
Societal Innovations for Global Growth
Research papers "Societal Innovations for Global Growth" Stream C National Sustainable Development under Globalization Conditions Mokslo darbai ,,Socialinės inovacijos globaliai plėtrai“ C skyrius Šalies darni plėtra globalizacijos sąlygomis 2012, 1(1) " Societal Innovations for Global Growth" Stream A: Justice, Security and Human Rights Stream B: Social Technologies Stream C: National Sustainable Development under Globalization Conditions Stream D: Improving Life Quality and Enhancing Employment Possibilities Stream E: Continuation and Change of Values in Global Society Editorial team Editors-in-Chief Managing editor Prof. dr. Monica Palmirani, University of Bologna, Italy Prof. dr. Eglė Bilevičiūtė, Mykolas Romeris University, Lithuania Rūta Tamošiūnaitė, Mykolas Romeris University, Lithuania Editorial board: Assoc. prof. dr. Povilas Aleksandravičius, Mykolas Romeris University, Lithuania Prof. dr. Helena Alves, University Beira Interior, Portugal Assoc. prof. dr. Tatjana Bilevičienė, Mykolas Romeris University, Lithuania Prof. dr. Stanislav Filip, School of Economics and Management in Public Administration, Slovakia Prof. dr. Vida Gudžinskienė, Mykolas Romeris University, Lithuania Assoc. prof. dr. Päivi Jokela, Linnaeus University, Sweden Dr. Evaldas Klimas, Mykolas Romeris University, Lithuania Dr. Miglė Laukytė, University of Bologna, Italy Assoc. Prof. Dr. Ilidio Tomas Lopes, Polytechnic Institute of Santarem, Portugal Prof. dr. Ingrida Mačernytė-Panomariovienė, Mykolas Romeris University, Lithuania Prof. dr. Gediminas Mačys, Mykolas Romeris University, Lithuania Prof. dr. Pilar Muro Sans, University Ramon Llull, Spain Prof. dr. Rimantas A. Petrauskas, Mykolas Romeris University, Lithuania Dr. Malgorzata Porada-Rochon, University of Szczecin, Poland Assoc. prof. dr. Romas Prakapas, Mykolas Romeris University, Lithuania Assoc. prof. dr. Agota Giedrė Raišienė, Mykolas Romeris University, Lithuania Prof. dr. Ona Gražina Rakauskienė, Mykolas Romeris University, Lithuania Prof. dr. Steven Schroeder, The University of Chicago, United States of America Prof. dr. Aelita Skaržauskienė, Mykolas Romeris University, Lithuania Prof. dr. Valery Shepitko, National University “Law Academy of Ukraine named after Yaroslav the Wise”, Ukraine Dr. Prodromos Tsiavos, University of Athens, Greece Prof. dr. Vilhelmina Vaičiūnienė, Mykolas Romeris University, Lithuania Prof. dr. Neven Vrček, Zagreb University, Croatia Dr. Andrea Wechsler, European University Institute, Italy Prof. dr. Stanislav Yalyshev, Northwest branch of the Russian Academy of justice, Russia Assoc. prof. dr. Jolanta Zajančkauskienė, Mykolas Romeris University, Lithuania "Socialinės inovacijos globaliai plėtrai" A skyrius: Teisingumas, saugumas ir žmogaus teisės B skyrius: Socialinės technologijos C skyrius: Šalies darni plėtra globalizacijos sąlygomis D skyrius: Gyvenimo kokybės gerinimas ir užimtumo galimybių didinimas E skyrius: Vertybių tęstinumas ir kaita globalioje visuomenėje Redakcija Vyriausieji redaktoriai Vykdančioji redaktorė Prof. dr. Monica Palmirani, Bolonijos universitetas, Italija Prof. dr. Eglė Bilevičiūtė, Mykolo Romerio universitetas, Lietuva Rūta Tamošiūnaitė, Mykolo Romerio universitetas, Lietuva Redakcinė kolegija: Doc. dr. Povilas Aleksandravičius, Mykolo Romerio universitetas, Lietuva Prof. dr. Helena Alves, Beira Interior universitetas, Portugalija Doc dr. Tatjana Bilevičienė, Mykolo Romerio universitetas, Lietuva Prof. dr. Stanislav Filip, Ekonomikos ir viešojo administravimo vadybos mokykla, Slovakija Prof. dr. Vida Gudžinskienė, Mykolo Romerio universitetas, Lietuva Dr. Evaldas Klimas, Mykolo Romerio universitetas, Lietuva Dr. Miglė Laukytė, Bolonijos universitetas, Italija Doc. Dr. Ilidio Tomas Lopes, Santarem Politechnikos institutas, Portugalija Prof. dr. Ingrida Mačernytė-Panomariovienė, Mykolo Romerio universitetas, Lietuva Prof. dr. Gediminas Mačys, Mykolo Romerio universitetas, Lietuva Prof. dr. Pilar Muro Sans, Ramon Llull universitetas, Ispanija Prof. dr. Rimantas A. Petrauskas, Mykolo Romerio universitetas, Lietuva Dr. Malgorzata Porada-Rochon, Štetino universitetas, Lenkija Doc. dr. Romas Prakapas, Mykolo Romerio universitetas, Lietuva Doc. dr. Agota Giedrė Raišienė, Mykolo Romerio universitetas, Lietuva Prof. dr. Ona Gražina Rakauskienė, Mykolo Romerio universitetas, Lietuva Prof. dr. Steven Schroeder, Čikagos universitetas, Jungtinės Amerikos valstijos Prof. dr. Aelita Skaržauskienė, Mykolo Romerio universitetas, Lietuva Prof. dr. Valery Shepitko, Nacionalinis universitetas ,,Jaroslavo išmintingojo Ukrainos teisės akademija’’, Ukraina Dr. Prodromos Tsiavos, Atėnų universitetas, Graikija Prof. dr. Vilhelmina Vaičiūnienė, Mykolo Romerio universitetas, Lietuva Prof. dr. Neven Vrček, Zagrebo universitetas, Kroatija Dr. Andrea Wechsler, Europos universitetų institutas, Italija Prof. dr. Stanislav Yalyshev, Rusijos teisingumo akademijos Šiaurės vakarų skyrius, Rusija Doc. dr. Jolanta Zajančkauskienė, Mykolo Romerio universitetas, Lietuva Table of content/Turinys EUROPOS PINIGŲ SĄJUNGA: ĮKŪRIMAS, PRIVALUMAI, ŠIANDIENINĖS PROBLEMOS ............... 479 MODERNISATION OF THE PUBLIC PROCUREMENT MARKET. TOWARDS A STRATEGY OF PUBLIC MARKETING SPECIFIC ON THE SINGLE MARKET ....................................................................... 497 GLOBALIZATION INFLUENCE AND CONSEQUENCES ON COUNTRIES’ ECONOMICAL DEVELOPMENT ........................................................................................................................... 512 THE STRATEGIC ASPECT OF INTELLECTUAL PROPERTY RIGHTS: CASE OF CHINA ...................... 520 THE CRISIS AND ECONOMIC RECOVERY IN BALTIC COUNTRIES AT CLOSE RANGE ................... 537 INDEPENDENCE OF THE CENTRAL BANKS .................................................................................. 551 TOWARDS INNOVATION-BASED ECONOMIC DEVELOPMENT: THE CASE OF LATVIA ............... 558 A TYPE OF MARKETING IN INNOVATION: GUERILLA MARKETING ............................................. 575 SOCIALINĖS POLITIKOS PRINCIPAI EUROPOS SĄJUNGOJE IR LIETUVOJE ................................... 582 LITHUANIAN MAIN FOREIGN TRADE PARTNERS ........................................................................ 598 LIETUVOS FINANSŲ RINKOS PRIEŽIŪROS REFORMA .................................................................. 612 MANAGEMENT INNOVATIONS IN THE HIGHER EDUCATION: THE CASE OF MYKOLAS ROMERIS UNIVERSITY ................................................................................................................................ 622 VEIKLOS VERTINIMO KRITERIJŲ OPTIMIZAVIMAS: LIETUVOS SPORTO ŠAKŲ FEDERACIJŲ ATVEJIS .................................................................................................................................................... 633 ORGANIZACIJOS LYDERIO VAIDMUO, KURIANT IR PLĖTOJANT SOCIALINĖS PARTNERYSTĖS RYŠIUS ........................................................................................................................................ 647 ECONOMIC IMPACTS OF HUNGARIAN MEMBERSHIP IN THE EUROPEAN UNION .................... 662 ACTUAL ASPECTS OF ENVIRONMENTAL OBLIGATIONS ENTERPRISES ....................................... 673 TRUST IN GOVERNMENT AND TAX COMPLIANCE ...................................................................... 684 INFLUENCE OF GLOBALIZATION PROCESSES ON UKRAINIAN STOCK MARKET .......................... 694 SCARCITY, SUSTAINABILITY AND LAND UTILISATION ................................................................. 701 DARBO EFEKTYVUMO DIDINIMO METODAI IR JŲ VERTINIMAS DARNIAI EKONOMIKOS PLĖTRAI .................................................................................................................................................... 712 ‘‘Societal Innovations for Global Growth‘‘, 2012, No. 1(1) ISSN 2335-2450 (online) EUROPOS PINIGŲ SĄJUNGA: ĮKŪRIMAS, PRIVALUMAI, ŠIANDIENINĖS PROBLEMOS Prof. dr. Gediminas Davulis Mykolo Romerio universitetas Ekonomikos ir finansų valdymo fakultetas Ekonomikos katedra Ateities g. 20, LT-0830 Vilnius El. paštas: [email protected] Santrauka Straipsnyje pateikiami Europos pinigų sąjungos kaip Europos integracijos rezultato sukūrimo istoriniai aspektai, aptariama Europos pinigų sąjungos bendros valiutos - euro tarptautinė reikšmė iki kriziniu laikotarpiu, analizuojami jos teikiami privalumai bei trūkumai. Nagrinėjama Vokietijos bei Slovėnijos patirtis įsivedant eurą. Remiantis statistiniais duomenimis analizuojama euro įvedimo įtaka kainų lygio dinamikai Vokietijoje. Nors ši įtaka ir nebuvo žymi, tačiau euro įvedimas vis tik tam tikru laipsniu įtakojo kainų augimą Vokietijoje. Antra vertus infliacijos procesą stiprino ir psichologiniai veiksniai. Pateikiama Lietuvos euro įvedimo strategija, įvertinant užsienio šalių, įsivedusių eurą, patirtį. Analizuojama šiandieninė valstybių skolos problema Europos pinigų sąjungoje, aptariamos priemonės, kurių imasi Europos pinigų sąjunga šiai problemai spręsti. Reikšminiai žodžiai: euras, Europos pinigų sąjunga, infliacija, euro zonos skolų krizė, finansinio stabilumo fondai. 1. Įvadas Euro įvedimas ir tuo pačiu įstojimas į Europos pinigų sąjungą iki šiol lieka vienas iš pačių svarbiausių Lietuvos ekonominės politikos uždavinių. Po nepavykusio bandymo nuo 2007 metų įsivesti eurą, kai infliacijos rodiklis Lietuvoje tik nežymiai (0,1 proc.) viršijo nustatytą ribą, t.y. Lietuvos ekonomika patenkino ne visus konvergencijos kriterijus ir į Europos pinigų sąjungą nebuvo priimta, šis uždavinys atidėtas ateičiai. 479 ‘‘Societal Innovations for Global Growth‘‘, 2012, No. 1(1) ISSN 2335-2450 (online) Situacija Lietuvoje 2007 m. ir po to sekęs ekonomikos nuosmukis tik patvirtino, jog šis Europos centrinio banko sprendimas nebuvo nepagrįstas – Lietuva išties nepatenkino ekonominės padėties tvarumo reikalavimus. Manoma, jog euro įvedimas teigiamai įtakos Lietuvos ekonomiką, tapdamas svarbiu šalies ekonomikos plėtros veiksniu. Antra vertus būtina numatyti ir tinkamą veiksmų, įvedant eurą, planą, kadangi nevykusi euro įvedimo strategija gali turėti ir neigiamų pasekmių šalies ekonomikai. Norint parinkti tinkamą integracijos į Europos pinigų sąjungą strategiją, svarbu išsiaiškinti bendros valiutos privalumus bei trūkumus, šalies galimybes, išanalizuoti šalių, sėkmingai įsijungusių į Europos pinigų sąjungą, patirtį bei pačios Europos pinigų sąjungos ateities perspektyvas. Šiandieninė situacija Europos pinigų sąjungoje rodo, jog diskusijos šiuo klausimu yra labai aktualios. Tyrimai, susiję su bendros valiutos įvedimo įtaka šalies ekonomikai, Lietuvoje nėra plačiai vykdomi, tačiau užsienyje šiai problemai buvo ir yra skiriamas pakankamas dėmesys. Lietuvoje Euro integracijos klausimus nagrinėja Davulis (2009,2011), Dumčiuvienė (2010), Kropas, Kropienė (2005), Kuodis (2005). Iš užsienio autorių paminėtini Benjamin (2007), Duisenberg (2002), Galati, Tsatsaronis (2003), Gaspar (2004), Greenspan (2001), Frankel, Rose (2002), Shalder (2005) bei kiti. Straipsnyje naudojami tyrimo metodai – sisteminė mokslinės literatūros ir statistinių duomenų analizė bei apibendrinimas. 2. Europos Sąjungos įkūrimo istorinės prielaidos Europos integracijos procesas, kurio rezultatas – Europos Sąjungos įkūrimas, yra vienas iš reikšmingiausių politine ir ekonomine prasme per visą Europos istoriją. Dar ekonominės integracijos pradžioje buvo suvokta, jog Europos šalių ekonominė integracija nebus pakankamai efektyvi, jei nebus apjungtos ir šių šalių pinigų sistemos ir nebus pereita prie bendros valiutos. Europos pinigų sąjungos idėja jau buvo aptarinėjama dar 1956 metais derybose dėl Romos sutarties. Kaip pagrindinius momentus kuriant Europos pinigų sąjungą, reikėtų paminėti Vernerio pranešimą (1970 m.), kuriame buvo siūloma sukurti Europos valiutinę sistemą, susidedančią iš valiutų krepšelio, pavadintu ekiu ir valiutų kurso mechanizmo. bei Delorso pranešimą (1989 m.), kuris tapo pagrindu Mastrichto sutartyje nustatytam Europos pinigų sąjungos sukūrimo planui. 1970 m Liuksemburgo ministro pirmininko Pjero Vernerio pranešime buvo pristatytas planas iki 1980 m. įkurti Europos pinigų sistemą. Pagrindinė šio plano dalis, kurią bandė įgyvendinti Europos Bendrijos narės, buvo apriboti valiutų kursų svyravimus. Buvo nustatyta maksimali leistina valiutų svyravimo riba – 2,25 proc. lyginant su JAV 480 ‘‘Societal Innovations for Global Growth‘‘, 2012, No. 1(1) ISSN 2335-2450 (online) doleriu. Įgyvendinant šį planą, 1973 m. buvo įsteigtas Europos piniginio bendradarbiavimo fondas, kuris teikdavo šalių-narių centriniams bankams paskolas, būtinas valiutų kurso stabilizavimo politikai vykdyti. Tačiau to meto situacija neleido įgyvendinti šio Vernerio plano dalies. Nepaisant Vernerio plano nesėkmės, 1978 m. Europos Taryba patvirtino planą, sukurti Europos pinigų sistemą, kuri pradėjo veikti nuo 1979 m. Šios sistemos pagrindiniai elementai buvo: valiutų kursų mechanizmas, Europos piniginio bendradarbiavimo fondas ir Europos valiutos vienetas – ekiu. Ekiu tai– Europos pinigų sistemos valiutų krepšelis, sudarytas iš kiekvienos šalies valiutų, įeinančių į šį krepšelį su nustatytu svoriu. Europos pinigų sistemos pagrindas buvo valiutų kursų mechanizmas. Jame dalyvaujančios šalys turėjo nustatyti ir palaikyti savo valiutų kursus kitų valiutų atžvilgiu nustatytose ribose. Europos pinigų sistema dar nebuvo pinigų sąjunga tikrąją to žodžio prasme, o ekiu nebuvo bendroji Europos bendrijos valiuta. 1989 m. Madride Europos Komisijos pirmininkas Žakas Delorsas pasiūlė planą Ekonominei ir pinigų sąjungai įgyvendinti su bendra valiuta – euru. Šis Delorso planas buvo sukonkretintas Europos Sąjungos sutartyje. Europos Sąjungos sutartyje buvo nustatyti konvergencijos (Mastrichto) kriterijai, kuriuos privalėjo įvykdyti šalys - Ekonominės ir pinigų sąjungos narės. Vykdant Delorso planą 1994 m. buvo įsteigtas Europos pinigų institutas, kuris pakeitė Europos piniginio bendradarbiavimo fondą, perimdamas ir išplėsdamas jo funkcijas. Europos pinigų instituto veikla buvo pagrindas parengti sąlygas Europos centrinio banko įsteigimui, kuris buvo įsteigtas 1998 m. Nuo 1999 m. savo veiklą pradėjo ir Europos centrinių bankų sistema , kurią sudarė Europos centrinis bankas ir Europos sąjungos šalių nacionaliniai centriniai bankai. Oficialiai Ekonominė ir pinigų sąjunga gyvuoja nuo 1999 m. sausio 1d., o euras grynųjų pinigų pavidalu pradėjo funkcionuoti dvylikoje Europos Sąjungos valstybių nuo 2002 m. sausio 1d. Euro įvedimu baigėsi daugiau kaip 50 metų trukusios pastangos pinigų integracijos srityje. Euras tapo pagrindine europinės integracijos ašimi. Tarptautinės pinigų sistemos kontekste Europos pinigų sąjungos sukūrimas yra bene svarbiausias įvykis nuo tada, kai žlugo Bretton Woods susitarimo pagrindu funkcionavusi pasaulio pinigų sistema. Vertinant kitų pinigų sąjungų kontekste euro projektas yra ypatingas įvykis pinigų istorijoje. Dar nėra buvę, jog grupė nepriklausomų valstybių savanoriškai atsisakytų savo nacionalinių pinigų ir kartu išlaikytų politinę nepriklausomybę. Šis aktas lemia visiškai naują makroekonominės politikos derinį, besiremiantį bendromis vertybėmis. Euro įvedimas yra reikšmingas ne vien ekonominiu, politiniu bet ir psichologiniu požiūriu. Nacionaliniai pinigai yra svarbus nacionalinio suvereniteto simbolis. Savanoriškas nacionalinių pinigų pakeitimas euru rodo, jog stiprėja ir bendras europinis identitetas. 481 ‘‘Societal Innovations for Global Growth‘‘, 2012, No. 1(1) ISSN 2335-2450 (online) 2007 m. sausio 1d., kada į Europos pinigų sąjungą buvo tikėtasi priimti ir Lietuvą, Europos pinigų sąjungai priklausė 12 Europos Sąjungos šalių. Tais metais į šią sąjungą įstojus Slovėnijai, o vėliau Kiprui, Maltai, Slovakijai bei Estijai, Europos pinigų sąjunga šiandieną jau vienija 17 Europos sąjungos šalių. 3. Tarptautinio euro vaidmens stiprėjimas iki kriziniu laikotarpiu bei jo įtaka šalių ekonomikoms. Euro įvedimas turėjo didelės reikšmės ne tik Europos Sąjungos, bet ir visoms pasaulio valstybėms. Pakeitęs daugumos Europos Sąjungos šalių nacionalinius pinigus, euras tolydžiai stiprėjo ir tapo viena iš svarbiausių tarptautinių valiutų pasaulyje. Praktiškai euras tapo antra pagrindine tarptautine valiuta po JAV dolerio. Pisani-Ferry et al. (2008) ir Angeloni (2011) analizuoja euro ir JAV dolerio vaidmens pasaulyje pokyčius bei šių valiutų kurso santykių tendencijas. Statistiniai JAV dolerio ir euro valiutų kurso santykių duomenys rodo, jog euro vertės dolerio atžvilgiu tendencija nebuvo pastovi. 2004-2007 m. euro vertė JAV dolerio atžvilgiu pastoviai augo dėl smarkiai augančios JAV biudžeto skolos, tačiau 2008 m. situacija pasikeitė - JAV doleris euro atžvilgiu sustiprėjo net 22 proc. 2009 m. JAV dolerio vertė euro atžvilgiu dėl augančios skolos ir neaiškios finansinės padėties vėl stipriai krito - net 20 proc. Graikijos skolos krizė ir nepatenkinama finansinė padėtis pietinėse ES šalyse lėmė euro valiutos kurso kritimą pastaraisiais metais. 2011 m. pradžioje euro kursas JAV dolerio atžvilgiu šiek tiek pakilo, o vėliau išliko beveik stabilus (Amadeo, 2012). Kaip teigia Angeloni (2011) , tikimybė, kad euras vėl taps stabilia ir stipria tarptautine valiuta ir Europos pinigų sąjunga susidoros su jai iškilusiais iššūkiais finansinėje sferoje, priklauso nuo to, ar ES bus imtasi pakankamai griežtų fiskalinių ir monetarinių reguliavimo priemonių ir bus vykdomos reikalingos struktūrines reformos. Euro įvedimas buvo galingas stimulas skatinantis finansų rinkų plėtrą. Per pirmuosius trejus metus nuo euro įvedimo finansinių priemonių apyvarta euro zonos šalyse išaugo daugiau kaip dvigubai, palyginus su apyvarta nacionalinėmis valiutomis. Pinigų sąjunga ir euras sudaro prielaidas stiprinti Europos Sąjungos, kaip tarptautinio finansų centro, pozicijas konkurencinėje kovoje su JAV, Japonija bei kitomis šalimis. Euro įvedimas turėjo poveikį ir pinigų sąjungos vidaus finansų rinkoms (Galati, 2003). Įvedus bendrą valiutą, išnyko ir sandoriai nacionalinėmis valiutomis, tuo pačiu išnyko ir apsidraudimo nuo valiutų kursų rizikos sandorių būtinybė. Taigi euras integravo ir konsolidavo Europos pinigų sąjungos valstybių finansų rinkas, kartu išplėsdamas finansinių priemonių įvairovę (Samuels, Ramlogan, 2007). Kaip pažymėjo Gaspar 482 ‘‘Societal Innovations for Global Growth‘‘, 2012, No. 1(1) ISSN 2335-2450 (online) (2004;2003), euro įvedimo poveikis finansų rinkoms yra kur kas stipresnis ir pasireiškia greičiau negu kitoms ūkio sritims. Bendra valiuta eliminuodama valiutų kurso neapibrėžtumą, sumažina riziką ir tuo pačiu lemia mažesnę realią palūkanų normą. Mažėjanti palūkanų norma savo ruožtu vėl gi skatina ekonomikos augimą. Įvedus eurą išnyksta euro ir nacionalinės valiutos keitimo kaštai. Šis veiksnys taip pat teigiamai įtakoja nacionalinio produkto apimtį. Antra vertus bendra valiuta turėjo įtakos kainų skaidrumo augimui ir konkurencijos tarp gamintojų euro zonoje didėjimui, dėl ko atsirado galimybė efektyviau skirstyti ir naudoti euro zonos valstybių išteklius. Vienas iš svarbiausių įstojimo į Europos pinigų sąjungą privalumas, kas ypač svarbu Lietuvai, – teigiamas prekybos plėtros poveikis stojančiai šaliai, t.y. vadinamasis Rose efektas (Rose, Engel, 2001). Rose nustatė, jog prekybos srautai tarp šalių, priklausančių pinigų sąjungai, yra vidutiniškai 100 proc. didesni, negu tarp Europos Sąjungos šalių, nepriklausančių pinigų sąjungai. Svarbu ir tai, jog šis prekybos padidėjimas nevyksta kitų šalių sąskaita, t.y. nesumažina prekybos su jomis apimčių. Prekybos didėjimas savo ruožtu skatina ir ekonominį augimą. Frankel, Rose (2002) nustatė, jog šalies prekybos padidėjimas 1 proc. lemia apie 0,33 proc. bendrojo vidaus produkto padidėjimą. Teigiamą bendros valiutos įtaką prekybai tarp Europos pinigų sąjungos šalių pažymėjo ir kiti autoriai. Micco et all (2003) nustatė jog prekyba tarp Europos pinigų sąjungos šalių narių išaugo 15 proc. per 1999-2002 m. laikotarpį, o per 2002-2005 m. prekybos apimtys išaugo dar 26 proc. Pasak Chintrakarn‘o (2008), prekybos apimtys tarp dviejų šalių, prisijungusių prie euro zonos, per pirmuosius metus išauga apskritai apie 9-14 procento. Prisijungimo prie euro zonos nauda nėra vienpusė. Ji bus ne tik naujose ES šalyse, įstojusių į pinigų sąjungą, bet ir visoje euro zonoje, tačiau įstojusiom į euro zoną šalims ji bus kur kas didesnė. Integracijos nauda euro zonoje pasireikš per prekybos plėtrą, per finansų sektoriaus integraciją, per euro tarptautinio vaidmens didėjimą. Prisijungimas prie euro zonos suteiks prisijungiančiai šaliai galimybę aktyviai atstovauti šalies ekonominiams interesams, dalyvauti priimant ekonominius sprendimus, liečiančius visą Europos Sąjungą. Svarbiausius ekonominius sprendimus lemia būtent šalys, priklausančios euro zonai. Likusios Europos Sąjungos šalys turi mažai galimybių paveikti šiuos sprendimus. Vienas iš argumentų prieš euro įvedimą grindžiamas Balassa – Samuelson efektu. Jis pasireiškia tuo, jog produktyvumo augimas atviruose sektoriuose yra spartesnis negu uždaruose, nes pirmieji pritraukia daugiau technologijoms imlių užsienio investicijų. Dėl didėjančio produktyvumo augantys atlyginimai atviruose ekonomikos sektoriuose sudaro spaudimą jų didėjimui ir uždaruose sektoriuose. Siekiant išlaikyti gaunamą pelną, 483 ‘‘Societal Innovations for Global Growth‘‘, 2012, No. 1(1) ISSN 2335-2450 (online) uždaruose sektoriuose kainos turi didėti. Taigi Balassa – Samuelson efektas reiškia infliacijos augimą šalies viduje. Tarptautinio Valiutos fondo vertinimu naujose Europos Sąjungos valstybėse, jei jos dalyvauja 2-jame valiutų kurso mechanizme, Balassa – Samuelson efektas gali infliaciją padidinti 1-2 procentais (Schalder et al (2005). Šalys, vykdančios klasikinę pinigų politiką, įstojusios į Europos pinigų sąjungą praras šią savarankišką ekonominės politikos priemonę, perleisdamos ją Europos centriniam bankui. Tuo tarpu Europos centrinis bankas vykdo pinigų politiką atsižvelgdamas į visos euro zonos situaciją ir neakcentuodamas atskirų šalių ypatybių. Todėl bendra pinigų politika gali būti ir neoptimali atskirų šalių atžvilgiu. Tačiau šalys, kuriose veikia valiutų valdybos modelis arba kurių valiutos tiesiogiai susietos su euru, šiuo požiūriu nieko nepraranda, kadangi jos ir taip neturi realių pinigų politikos svertų. Antra vertus šalys, kuriose veikia valiutų valdybos modelis, konvergencijos procese įgyja ir tam tikrų panašumų, kadangi valiutų kurso stabilumo reikalavimas įvykdomas automatiškai. Jeigu dauguma Rytų Europos šalių į pinigų sąjungą būtų priimtos šiandien, tai jos neišvengtų kainų „šoko“, t.y. nemažo kainų šuolio. Netgi labiausiai išvystytos vakarų Europos šalys, pvz. Vokietija neišvengė tam tikro kainų padidėjimo, nors jis ir nebuvo žymus. Šis kainų šuolis bus tuo didesnis, kuo šalies ekonominiai rodikliai bus žemesni už labiausiai išvystytų šalių vidutinius rodiklius. Todėl yra prasmės jungtis prie 2-ojo valiutos kurso mechanizmo, kas yra privaloma pagal Mastrichto sutarties reikalavimus, jau pasiekus aukštą konvergencijos laipsnį, t.y. šalies ekonominiams rodikliams pasiekus arba labai priartėjus prie Europos Sąjungos vidurkio. Labai svarbūs euro įvedimui ir psichologiniai veiksniai. Kaip šalies himnas ar vėliava, nacionaliniai pinigai yra bene ryškiausias šalies suvereniteto požymis. Suverenios teisės emituoti nacionalinius pinigus praradimas tam tikru laipsniu gali formuoti šalies gyventojų neigiamą požiūrį į euro įvedimą. Nežiūrint Europos pinigų sąjungos privalumų, teikiamų jos nariams, kai kurių autorių nuomone (Feldstein, 2011) šios sąjungos sukūrimas vis tik daugiausiai naudos davė stipresnės ekonomikos šalims ir ypač Vokietijai. Pradedant 1999 m., t.y. nuo euro įvedimo, Vokietija paspartino plėtrą įvairiose ūkio srityse, žymiai pagerino savo mokėjimų balansą ir tapo labiausiai konkurencinga šalimi Europos Sąjungoje (Norris, 2011). 4. Įstojimo į Europos pinigų sąjungą patyrimo apibendrinimas Europos šalių, sėkmingai įstojusių į Europos pinigų sąjungą, patyrimas yra gana svarbus Rytų Europos šalims, siekiančioms įstoti į šią sąjungą. Europos sąjungos šalims, 484 ‘‘Societal Innovations for Global Growth‘‘, 2012, No. 1(1) ISSN 2335-2450 (online) kol kas nesančioms Europos pinigų sąjungos narėmis, negali kilti klausimo įsivesti eurą ar ne, kadangi pagal Mastrichto sutartį jos privalės tapti pinigų sąjungos narėmis. Antra vertus, tikimasi, jog bendros valiutos įvedimas suteiks šioms šalims daugiau privalumų negu galimų praradimų. Tačiau svarbu pasirinkti teisingą konvergencijos proceso strategiją. Į kai kuriuos klausimus, parenkant konvergencijos strategiją, galima atsakyti išanalizavus Vokietijos patirtį. Nors Vokietija yra viena stipriausių Europos valstybių, dominuojanti Europos sąjungoje ekonomine prasme, tačiau tam tikri būkštavimai dėl euro įvedimo kilo ir šioje šalyje. Daugelis gyventojų tikėjosi staigaus kainų pakilimo, nors tokiam šuoliui, atrodytų, ekonominio pagrindo nebuvo. Iš tikrųjų statistiniai duomenys užfiksavo tam tikrą kainų kilimą po euro įvedimo Vokietijoje, tačiau jis buvo ne toks didžiulis kaip tai išpūtė spauda ir patys gyventojai. Be to kainų kilimą lėmė ir kiti veiksniai, nesusiję su euro įvedimu. Vokietijos statistikos departamentas atlikęs tyrimą padarė išvadą, jog euro įvedimas turėjo įtakos pavienių paslaugų ir prekių kainoms, tačiau bendram vartotojų kainų indeksui didelės įtakos neturėjo. Pagal Vokietijos statistikos departamento duomenis kainų lygis po euro įvedimo pakilo, palyginti su kainų lygiu prieš euro įvedimą, infliacijos lygis neviršijo Europos centrinio banko nustatytos ribos (1 pav.). 1 pav. Infliacijos kitimas Vokietijoje 1996-2008 m., proc. 3,0 2,6 2,5 2,3 1,9 1,9 2,0 1,8 1,5 1,4 1,5 1,8 1,4 1,2 1,0 1,0 0,6 0,6 0,5 0,0 1996 1997 1998 1999 2000 2001 2002 2003 2004 2005 2006 2007 2008 Šaltinis: www.destatis.de 485 ‘‘Societal Innovations for Global Growth‘‘, 2012, No. 1(1) ISSN 2335-2450 (online) Tyrimo rezultatai leido daryti tokias išvadas, jog kainų apvalinimas, keičiant markes į eurus tam tikru laipsniu padidino kainų lygį. Atskirų prekių ir paslaugų kainos dėl euro įvedimo, pvz. bilietai į kino teatrą, šokoladas, variklio alyva, kirpyklų ir cheminio valymo paslaugos, žymiai išaugo. Antra vertus, kai kurių ilgo vartojimo prekių (televizoriai, filmavimo kameros) arba atskirų maisto rūšių (pupelių kava, pienas, sviestas) kainos stipriai nukrito. Vokietijos banko atlikta analizė parodė, jog praėjus 2 metams po euro įvedimo, euro sukeltas kainų kilimas buvo sustabdytas, tačiau kainų įvairovė tapo didesnė nei prieš įvedant eurą. Kur kas didesnę reikšmę turėjo kiti veiksniai, nesusiję su euro įvedimu. Tai 2002 – 2004 m. vykusi ekologinio mokesčio reforma, 2004 m. – sveikatos reforma, lėmusi bendrą paslaugų brangimą, tabako gaminių mokesčio didinimai, turėję įtakos bendram kainų indekso didėjimui. Ypač didelę įtaką infliacijos lygiui turėjo energetikos produktų (dujų, elektros, šildymo) bei degalų kainų augimas bei maisto kainų kilimas. Kainų didėjimui turėjo įtakos ir psichologiniai veiksniai. Žmonės informaciją apie tam tikrą ekonomikos reiškinį vertina subjektyviai ir šis vertinimas neretai neatitinka realybės. Vartotojai kainų augimą pastebi ir akcentuoja stipriau nei kainų kritimą ar jų stabilumą. Tai ir paaiškina žmonių įsitikinimą apie didelį ir staigų kainų šuolį, kas neatitinka statistinių duomenų. Atsižvelgdamas į tai, Vokietijos statistikos departamentas pradėjo vadovautis atvirumo principu, t.y. teikti visuomenei objektyvią informaciją apie kainų indekso pokyčius, infliacijos lygį ir kt. Tokia departamento bendravimo strategija pasiteisino ir yra pripažinta ir tarptautiniu mastu. Pirmoji iš naujųjų Europos Sąjungos narių eurą įsivedė Slovėnija ir nuo 2007 m. sausio 1d. tapo tryliktąja Europos pinigų sąjungos nare. Lietuva, kuri pretendavo patekti į euro zoną kartu su Slovėnija, šio uždavinio neįvykdė dėl tuo metu buvusio infliacijos lygio, kuris viršijo nustatytą ribą tik 0,1 proc. Slovėnija įvertinusi kitų šalių patyrimą atsakingai pasiruošė šiam žingsniui. Visų pirma Slovėnijos ekonominiai rodikliai labiausia priartėjo prie europinio lygio, lyginant su kitomis Rytų Europos šalimis, kas leido be didesnių ekonominių sukrėtimų sklandžiai įsijungti į euro zoną. Nuo 2006 m. kovo mėn. Slovėnijoje buvo įvestas dvejopas, t.y. nacionaline valiuta ir eurais prekių ir paslaugų kanų žymėjimas. Nuo rudens iki pat euro įvedimo darbuotojai būdavo informuojami koks jų atlyginimas būtų eurais. Vyko intensyvi visuomenės informavimo kampanija visais klausimais. Apie 500 įmonių pasirašė susitarimą nekelti kainų. Iš karto po 2007 m. sausio 1d. Slovėnijos vartotojų asociacija pradėjo sudarinėti prekybininkų ir paslaugų tiekėjų juoduosius sąrašus, į kuriuos buvo įtraukiami subjektai padidinę prekių ar paslaugų kainas daugiau kaip 6 proc. Į šią kampaniją plačiai įsijungė ir gyventojai, kurių 486 ‘‘Societal Innovations for Global Growth‘‘, 2012, No. 1(1) ISSN 2335-2450 (online) pranešimai buvo papildomas ir svarbus informacijos šaltinis. Visos šios priemonės leido Slovėnijoje išvengti žymesnio kainų šuolio po euro įvedimo 5. Euro įvedimo Lietuvoje strategijos pagrindinės nuostatos Netrukus po Lietuvos įstojimo į ES 2005 m. gegužės 30 d. Vyriausybės nutarimu Nr. 592 buvo sudaryta euro įvedimo Lietuvos Respublikoje koordinavimo komisija (toliau Komisija), kurios užduotis – užtikrinti tinkamą pasirengimą euro įvedimui Lietuvoje ir Lietuvos prisijungimui prie Europos pinigų sąjungos. Tam buvo sudarytos septynios darbo grupės, kurios parengė Nacionalinį euro įvedimo planą bei Lietuvos visuomenės informavimo apie euro įvedimą ir komunikacijos strategiją. Kuriant euro įvedimo Lietuvoje strategiją buvo atsižvelgta ir į užsienio šalių, prisijungusių prie euro zonos, ypač Vokietijos, patirtį. 2007 m. Lietuva pabandė įstoti į Europos pinigų sąjungą, tačiau šis bandymas nebuvo sėkmingas dėl pernelyg didelės infliacijos, 0,1 proc. viršijusios Mastrichto sutartyje nustatytą ribą. Darbe (Pisani-Ferry et al, 2008) analizuojamas šis Lietuvos bandymas įsivesti eurą ir nustatė, jog visų šalių, kuriose valiuta susieta su euru, infliacija yra didesnė nei tų, kurios turi laisvą valiutos kursą, ir neretai net viršija Mastrichto kriterijaus nustatytą dydį. Autorių nuomone, didesnė infliacija tiesiog atspindi spartesnį ir stabilesnį ekonomikos augimą, ir todėl šalims, turinčioms susietą su euru valiutos kursą, beveik neįmanoma atitikti žemos infliacijos reikalavimo. Autoriai daro išvadą, jog Europos centrinio banko sprendimas atmesti Lietuvos prašymą dėl prisijungimo prie euro zonos dėl nurodytos priežasties nebuvo pakankamai pagrįstas. Antra vertus autoriai neatsižvelgė į ekonominės padėties tvarumo reikalavimus, kurių Lietuva iki šiol nepatenkina iš dalies ir dėl objektyvių priežasčių. Po nepavykusio bandymo prisijungti prie euro zonos, Lietuvos Respublikos Vyriausybės nutarimu buvo patvirtintas naujas Nacionalinis euro įvedimo planas „Dėl nacionalinio euro įvedimo plano bei Lietuvos visuomenės informavimo apie euro įvedimą ir komunikacijos strategijos patvirtinimo“, kuris įsigaliojo 2007 m. balandžio 25 d. Kaip įvardijama Nacionalinio euro įvedimo plane, pagrindinis tikslas yra numatyti pagrindinius euro įvedimo (lito pakeitimo euru) Lietuvos Respublikoje elementus ir priemones, užtikrinančius vartotojų interesų apsaugą, sklandų lito pakeitimą euru ir visuomenės informavimą. Šį planą rengė darbo grupės, sudarytos iš Lietuvos Respublikos Vyriausybės institucijų, Lietuvos banko, vartotojų, darbdavių ir verslo asociacijų atstovų atskiriems euro įvedimo klausimams nagrinėti. Kaip teigiama bendrosiose nuostatose, šiame plane numatyti pagrindiniai euro įvedimo principai ir elementai, pasirengimas šiam procesui, nurodytos atskirų sektorių atsakomybės sritys ir vartotojų apsaugos 487 ‘‘Societal Innovations for Global Growth‘‘, 2012, No. 1(1) ISSN 2335-2450 (online) priemonės. Nacionalinis euro įvedimo planas nustato pagrindinius euro įvedimo elementus, tvarkaraštį ir tvarką. Jame išdėstyti euro įvedimo Lietuvoje teisiniai pagrindai, institucinė struktūra, valiutos pakeitimo būdas, numatomos priemonės, reikalingos įgyvendinti įvairiuose sektoriuose. Pagal euro įvedimo planą numatoma euro įvedimo Lietuvos Respublikoje diena – atitinkamų metų sausio 1 d. Nuo pat įvedimo dienos euras taps vienintele valiuta, kurią privaloma priimti atsiskaitant, išskyrus apibrėžtą 15 kalendorinių dienų truksiantį grynųjų eurų ir litų bendros apyvartos laikotarpį, kurio metu bus galima atsiskaityti ir litų banknotais bei monetomis. Du mėnesius komerciniai bankai litus į eurus keis nemokamai. 120 dienų iki euro įvedimo ir 120 dienų po euro įvedimo kainos privalės būti rodomos dviem valiutomis. Darbo užmokestis, pensijos ir socialinės išmokos 120 dienų iki euro įvedimo bus nurodomos ir eurais. Kitas svarbus dokumentas, siekiant įsivesti eurą yra Lietuvos visuomenės informavimo apie euro įvedimą ir komunikacijos strategija. Kad euro įvedimas netaptų netikėtu šoku, svarbu reguliariai informuoti visuomenę apie daromus sprendimus ir skatinti jos pilietiškumą ir aktyvumą visuomeniniame gyvenime. Pagrindinis šios strategijos tikslas – padėti visuomenei pasirengti euro įvedimui. Ši strategija numato informuoti visuomenę apie euro įvedimą ir su tuo susijusius veiksnius. Suinteresuotos institucijos pagal kompetenciją turi pateikti visuomenei informaciją visais su euro įvedimu susijusiais aspektais: apie euro įvedimo įtaką Lietuvos ekonomikai, gyventojų ir įmonių sąskaitų bankuose, balansų, socialinių išmokų perskaičiavimo eurais principus, eurų banknotų ir monetų nominalus, banknotų apsaugos požymius, nacionalinės valiutos keitimo į eurus sąlygas. Suinteresuotos institucijos, informuodamos visuomenę, turi sudaryti sąlygas, kad visuomenė tinkamai ir laiku pasirengtų euro įvedimui. Jos turėtų siekti, kad informuota, euro įvedimui pritarianti ir pasirengusi visuomenė prisidėtų prie sklandaus jo įvedimo. Būtina formuoti palankų visuomenės požiūrį į eurą. Suinteresuotos institucijos turi rūpintis, kad gerai informuotoje visuomenėje nekiltų nerimo dėl perėjimo prie bendrosios Europos Sąjungos valiutos, būtų suvokiama euro įvedimo Lietuvoje nauda, taip pat siekti visuomenės pritarimo ir palankumo bendrajai Europos Sąjungos valiutai tiek jos įvedimo Lietuvoje metu, tiek ir vėliau. 2008 m. Lietuvos Respublikos Vyriausybė patvirtino Lietuvos ES politikos 20082013 m. strateginių krypčių dokumentą (Strateginių krypčių dokumentas, 2008, p.). Šiame dokumente patvirtinamas Lietuvos siekis ir toliau siekti narystės Europos pinigų sąjungoje. Šį tikslą Lietuva numato įgyvendinti vykdydama griežtą fiskalinę politiką, struktūrines reformas, užtikrinančias kainų ir valdžios sektoriaus finansų stabilumą, laiku atlikti nacionalinės teisės pritaikymą euro įvedimui. Lietuvos banko teigimu, Lietuvos dalyvavimas euro zonoje padėtų valstybei plėsti finansinius ryšius su kitomis euro zonos 488 ‘‘Societal Innovations for Global Growth‘‘, 2012, No. 1(1) ISSN 2335-2450 (online) valstybėmis, kas skatintų Lietuvos gyventojų pajamų didėjimą ir užimtumą, būtų užtikrintas kainų stabilumas, didesnės konkurencijos ir investavimo galimybės ES bendroje rinkoje. Pagal šį naujausią euro įvedimo planą, buvo planuojama Lietuvai prisijungti prie euro zonos 2014 m., tačiau šiandieninė reali situacija verčia abejoti tokia galimybe – ir vėl koją pakišti gali infliacija. Latvijos tikslas, kaip ir Lietuvos - įsivesti eurą 2014 m., tačiau Latvijos Centrinio banko valdytojo I. Rimsevics nuomone šis tikslas neturėtų būti siekiamas bet kokiomis priemonėmis ir turėtų priklausyti nuo šalies ekonominės situacijos (Šeputytė M., Eglitis A., 2011). Lietuvos kaimynėje Lenkijoje euro įvedimo tema taip pat sukelia daug diskusijų, ir čia euro įvedimas vertinamas daugiau neigiamai, baiminantis, jog įvedus naują valiutą, ekonominis augimas Lenkijoje gali būti pristabdytas ir bus prarastos galimybės vykdyti savarankišką pinigų politiką (Hunter, Ryan, 2009). Pagal 2011 m. Euro barometro atliktos ES šalių, nepriklausančių euro zonai, visuomenės nuomonių apklausos dėl euro įvedimo pasekmių vertinimo, 47 proc. Lietuvos respondentų euro įvedimą vertina neigiamai, o 40 proc. – teigiamai, Lenkijoje atitinkamai 48 ir 38 proc., o Latvijoje net 58 proc. respondentų euro įvedimą vertina neigiamai ir tik 28 proc. teigiamai. Taigi ši apklausa parodė, jog Lietuvos ir jos kaimynių valstybių visuomenės prisijungimą prie euro zonos vertina daugiau neigiamai negu teigiamai. Estijos, vienintelės Baltijos valstybės įsivedusios eurą, vyriausybė teigiamai vertina prisijungimą prie euro zonos (Rastello, 2011). Estijos ministras pirmininkas A. Ansip teigia, jog šis žingsnis turėjo teigiamas pasekmes Estijos ekonomikai – paskatino šalies ekonomikos augimą, padėjo pritraukti daugiau investicijų, sumažino nedarbą bei padidino eksportą, o kainų lygio stabilumas po euro įvedimo net pranoko lūkesčius, kadangi valiutos pakeitimas nesukėlė lauktų didelių infliacijos pokyčių (Rastello, 2011). Statistiniai pagrindinių Estijos makroekonominių rodiklių (Estijos centrinis bankas, 2011) – BVP augimo, nedarbo lygio, eksporto, tiesioginių užsienio investicijų ir kt. duomenys patvirtina šiuos teiginius. Estijos ekonomikos augimas 2011 m. net buvo didesnis nei euro zonos narių šalių vidurkis. Neabejotina, jog prisijungimas prie euro zonos be abejo padidino Estijos tarptautinį patikimumą, ir tai paskatino didesnį užsienio investicijų srautą į šalį, tačiau negalima teigti, jog tai yra vienintelė priežastis, lėmusi spartų Estijos ekonomikos augimą. Neabejotina ir tai, jog eksporto apimčių didėjimą lėmė ekonomikos atsigavimas pagrindinėse Estijos užsienio prekybos partnerėse- šalyse – Suomijoje, Švedijoje, Vokietijoje. Taigi nors statistiniai duomenys rodo, jog 2011 m. Estijos ekonomika tikrai atsigavo, tačiau sudėtinga įvertinti, kiek tam įtakojo euro įvedimas. Nepaisant Estijos vyriausybės optimizmo minėta Euro barometro apklausa parodė, jog net 55 proc. apklaustųjų teigė, kad jie būtų prieš euro įvedimą, jeigu būtų atsiklausiama jų nuomonės. Panašus skaičius respondentų, t.y. 58 proc. yra prieš šalies dalyvavimą 489 ‘‘Societal Innovations for Global Growth‘‘, 2012, No. 1(1) ISSN 2335-2450 (online) Europos finansinio stabilumo fonde (28 proc. – už, o 14 proc. neturi nuomonės), kuri savo įnašais gelbėtų eurą. 6. Euro zonos skolų krizė ir priemonės jai įveikti Aukščiau buvo paaiškinta nauda ir privalumai, kuriuos teikia Europos pinigų sąjungos valstybėms – narėms bendra valiuta. Iš tikrųjų, euro tarptautinė reikšmė pastoviai augo, kartu augo ir pinigų sąjungos valstybių ekonominė galia iki pat globalinės krizės pradžios. Pasikeitusi situacija euro zonoje ir euro silpnėjimas dėl globalinės krizės poveikio vertė suabejoti bendros valiutos privalumais. Bendra valiuta daro neįmanomu pasinaudoti valiutos devalvacijos galimybe ekonominio nuosmukio metu, kad palaikyti šalies konkurencingumą tarptautinėje rinkoje, kuo puikiausiai pasinaudojo Lenkija, sugebėjusi netgi krizės įkarštyje išlaikyti šalies BVP augimą. Griežti Mastrichto kriterijų reikalavimai apribojo euro zonos valstybių galimybes vykdyti savarankišką fiskalinę politiką dėl reikalavimo išlaikyti finansinės padėties stabilumą (Samuels, Ramlogan, 2007). Kai kurie autoriai euro nauda ir euro zonos stabilumu suabejojo dar pasaulinės krizės pradžioje. Munchau (2008) teigė, jog ši krizė gali sukelti pinigų politikos krizę ir sukelti grėsmę pačiai Europos pinigų sąjungai. Todėl būtinas institucijos, kuri būtų atsakinga už krizės įveikimą, įsteigimas. Panašų požiūrį išreiškė Evans-Pritchard (2008) suabejojęs euro zonos efektyvumu ir pabrėžęs, jog būtina institucija, kuri galėtų užtikrinti bendros valiutos stabilumą. Kai kurie autoriai kaip Jonesas (2009), Ioannou, Stracca (2011) viena iš pagrindinių euro zonos silpnybių laiko neefektyvų fiskalinį reguliavimą. Dar griežtesnį požiūrį į bendrą valiutą išreiškė Feldsteinas (2011), kuris eurą vadina nepavykusiu eksperimentu, privedusiu prie dabartinės skolų krizės kai kuriose euro zonos šalyse - narėse, daugelio Europos bankų nestabilumo, aukšto nedarbo lygio, didelių neigiamų prekybos balansų. Tuo tarpu kitos šalys sugebėjo visą dešimtmetį suvaldyti infliaciją, neprisijungdamos prie euro zonos, nors žemas kainų lygis laikomas būtent bendros valiutos privalumu. Pasak autoriaus visos šios problemos buvo neišvengiamos, kadangi bendra valiuta buvo įvesta per daug skirtingose šalyse ne tik ekonominiu, bet ir politiniu bei tradicijų požiūriu. Euro sistemos sukūrimas jo požiūriu buvo pagrįstas ne tiek ekonominiais kiek politiniais tikslais. Autoriaus nuomone dauguma euro sistemos šalių būtų išvengusios didelių įsiskolinimų bei kitų ekonominių problemų, jei turėtų nacionalinę valiutą. Euro krizė netruko peraugti į euro zonos skolų krizę. Nors negalima teigti, jog euro zonos skolų krizė yra tiesioginė globalinės krizės pasekmė, tačiau neabejotinai pastaroji, išryškinusi euro zonos struktūrines problemas, tam tikru mastu įtakojo euro zonos skolų 490 ‘‘Societal Innovations for Global Growth‘‘, 2012, No. 1(1) ISSN 2335-2450 (online) krizę. Mažėjanti paklausa vertė Europos centrinį banką mažinti bazinę palūkanų normą, o vyriausybes didinti išlaidas, tuo pačiu ir biudžetų deficitus, skatinant visuminę paklausą ir tuo būdu neleisti smukti ekonomikai. Esant žemai palūkanų normai, nėra didelės problemos skolinantis tarptautinėje rinkoje padengti biudžeto deficitą, kuo ir pasinaudojo probleminės euro zonos šalys. Tačiau kai jos prarado investuotojų pasitikėjimą ir išaugo skolinimosi kaina, šios šalys susidūrė su skolų naštos bei bankų likvidumo problema. Atsisakiusios nacionalinių valiutų, euro zonos šalys prarado galimybę spausdinti pinigus ir infliacijos pagalba mažinti realią šalies skolos naštą. Problemiškomis euro zonos skolų krizės šalimis tapo pietinės Europos šalys – Graikija, Ispanija, Portugalija, Italija, Kipras bei Airija, kurias labiausiai ir palietė ši krizė, tačiau priežastys dėl kurių šios šalys tapo probleminėmis yra skirtingos. Graikijos ekonomikos pagrindas – turizmo ir laivininkystės ūkio sektoriai labai priklauso nuo išorinių veiksnių, todėl Graikijos ekonomiką ypač palietė pasaulinė krizė. Mažėjančios biudžeto įplaukos, vyriausybės nesugebėjimas mažinti biudžeto deficitą bei vykdyti būtinas reformas kėlė grėsmę, jog valstybės skola taps nekontroliuojama. Graikija buvo pirmoji valstybė euro zonoje, kuri prarado pasitikėjimą rinkose. Portugalija visada buvo priskiriama prie ekonomiškai silpnesnių euro zonos valstybių grupės – per pastarąjį dešimtmetį čia beveik nepakito BVP vienam gyventojui rodiklis. Šios šalies taupymas buvo žemas net ekonominio pakilimo metais, kas vertė šalį nuolat skolintis. Praradus investuotojų pasitikėjimą, Portugalijai buvo padidintos kreditų palūkanos, kas ir įstūmė ją į skolų krizę. Už krizę Ispanijoje atsakomybę turėtų prisiimti ne viešasis, bet privatus sektorius. Sprogus nekilnojamo turto burbului, išsiplėtojęs šalies statybų sektorius patyrė didžiulį nuosmukį, padidėjo nedarbas. Dėl didelė dalis skolininkų dalies nesugebėjimo gražinti skolų, didėjo bankų atidėjimai blogoms paskoloms kas sąlygojo bankų likvidumo problemas. Sumažėjus vartojimui ir įplaukoms į valstybės biudžetą, valstybė buvo priversta skolintis tarptautinėse rinkose. Pagrindinė nepasitikėjimo Italija priežastis – mažas šalies konkurencingumas, pernelyg lėtas ekonomikos augimas bei vyriausybės vangumas sprendžiant šalies finansines problemas. Nors Airija pagal konkurencingumo rodiklį yra pirmame pasaulio šalių dešimtuke, jos gyvenimo lygis yra vienas aukščiausių pasaulyje, tačiau jos problemas sukėlė vyriausybės sprendimas garantuoti šešių Airijos bankų, finansavusių nekilnojamojo turto burbulą, įsipareigojimus. Taigi Airijos vyriausybė, siekdama išvengti bankų krizės, sprogus nekilnojamo turto burbului, dalį skolos iš privataus sektoriaus perkėlė valstybiniam sektoriui, tuo užsikraudama skolos naštą. Iš esmės Airija, Ispanija, Kipras susidūrė ne tiek su valstybės skolos, kiek su bankų likvidumo problema. Taigi euro zonos skolų krizė kartu yra ir bankų krizė dar ir dėl kitos priežasties – bankai yra įsigiję didžiausią krizės šalių vyriausybių vertybinių popierių dalį. 491 ‘‘Societal Innovations for Global Growth‘‘, 2012, No. 1(1) ISSN 2335-2450 (online) Europos Sąjungos institucijos reagavo į susiklėsčiusią padėtį euro zonoje ir visoje Europos Sąjungoje. Reikia pažymėti, jog kur kas anksčiau dar prieš pasirašant Mastrichto sutartį buvo numatytos priemonės, galinčios užtikrinti tvarų euro zonos narių ekonomikų augimą. 1997 m. birželio mėn. Europos Sąjungos Vadovų Taryba pasirašė Stabilumo ir augimo paktą, kuriuo buvo siekiama užtikrinti biudžeto drausmę Europos pinigų sąjungoje ir Mastrichto kriterijų vykdymą. 2005 m. šis paktas buvo pakoreguotas ir papildytas. Stabilumo ir augimo paktas reikalauja, jog euro zonos šalių biudžeto deficitas neviršytų 3 proc., o valstybės skola – 60 proc. šalies BVP. Už šio pakto reikalavimų nesilaikymą yra numatyta bauda iki 0,2 proc. BVP, jei tam pritaria du trečdaliai euro zonos šalių finansų ministrų. Tačiau pakto reikalavimai buvo ne kartą pažeidžiami, o nusižengusias šalis nebuvo ryžtasi bausti, t.y. paktas praktiškai neveikė. Kadangi euro zonos skolų krizė ėmė grėsti pačiam euro zonos išlikimui, Europos Komisija ėmėsi papildomų priemonių. 2010 m. gegužės mėn. buvo įsteigtas Europos finansinio stabilumo fondas – tai euro zonos valstybių-narių įsteigta ir Liuksemburge įregistruota finansinė įmonė. Europos finansinio stabilumo fondas skolina lėšas finansinius sunkumus patiriančioms euro zonos valstybėms sutartomis sąlygomis. Tais pačiais metais Europos centrinis bankas patvirtino vertybinių popierių rinkos programą, leidžiančią Europos centriniam bankui supirkti finansinių sunkumų turinčių euro zonos šalių vyriausybių išleistas obligacijas vertybinių popierių rinkose arba jas priimti kaip užstatą, skolinant pinigus tų šalių komerciniams bankams, siekiant palaikyti jų likvidumą. Europos centrinis bankas superka vyriausybių obligacijas antrinėse rinkose, kadangi vyriausybių obligacijų supirkimas tiesiogiai iš jų emitentų draudžiamas Europos Sąjungos teisės aktais.Kai tapo aišku, jog Europos finansinio stabilumo fondo įsteigimas buvo nepakankama priemonė, 2012 m. vasario 2d. euro zonos šalių ambasadoriai Briuselyje pasirašė naują sutartį, kuria sukuriamas Europos stabilumo mechanizmas. Europos stabilumo mechanizmas tai Liuksemburge įsikūrusi tarptautinė finansų įstaiga, kuri teiks paramą euro zonos šalims, kai tai bus būtina finansiniam stabilumui išsaugoti. Europos stabilumo mechanizmas yra 17 euro zonos šalių sukurtas fondas, kurio vertė sudarys 700 milijardų eurų. Kiekviena iš 17 eurą įsivedusių šalių prisidės prie šio fondo įnešdama tam tikrą dalį kapitalo, priklausomai nuo šalies BVP. Iš esmės, pats Europos stabilumo mechanizmas veikimo principas nesiskiria nuo iki šiol finansinę pagalbą suteikusio Europos finansinio stabilumo fondo – abu šie fondai teikia pagalbą probleminėms euro zonos šalims. Esminis skirtumas yra tas, jog Europos finansinio stabilumo fondo buvo sukurtas kaip laikinas fondas, kuris bus panaikintas 2013 metų liepos 1 dieną, tuo tarpu Europos stabilumo mechanizmas sukurtas kaip nuolatinė euro zonos institucija tam, kad galėtų skolinti su finansinėmis problemomis susidūrusioms šalims, supirkdamas trumpo laikotarpio šių valstybių vyriausybių obligacijas. 492 ‘‘Societal Innovations for Global Growth‘‘, 2012, No. 1(1) ISSN 2335-2450 (online) Euro zonos skolų krizė kartu yra ir bankų krizė, kadangi bankai yra supirkę didžiausią krizės šalių vyriausybių obligacijų dalį. Tam, kad ateityje būtų išvengta bankų krizių, atkurtas pasitikėjimas jais ir apsaugoti indėlininkai, reikalinga didesnė bankų sistemos integracija Europos Sąjungos lygmeniu. Europos Komisija siūlo įsteigti Europos bankų sąjungą, kurią sudarytų šie pagrindiniai komponentai: bankų priežiūros funkciją pavesti vienai institucijai – Europos centriniam bankui, sukurti bendrą bankų gaivinimo ir pertvarkymo sistemą bei indelių apsaugos sistemą. Bankų sąjungos veikla turėtų būti pagrįsta vieningomis bankininkystės taisyklėmis. Europos Komisija siūlo steigti ir bendrą bankų gelbėjimo fondą. Visos šios siūlomos priemonės leistų sustiprinti finansinį stabilumą ir teigiamai veiktų finansų rinkas. Išvados Atlikta analizė leidžia teigti, jog: 1. Europos pinigų sąjungos įkūrimas buvo ilgalaikio Europos integracijos proceso, kuris turėjo tiek ekonominius, tiek ir politinius tikslus, pasekmė. 2. Laikotarpiu iki globalinės krizės šalių, priklausančių euro zonai, ekonomikos augo ir stiprėjo, ypač ekonomiškai stipresnių šalių, o euro tarptautinė reikšmė ir įtaka didėjo. 3. Pasaulinė ekonomikos ir vėliau kilusi euro zonos skolų krizė atskleidė euro zonos trūkumus ir būtinybę vykdyti šioje sąjungoje struktūrinius pertvarkymus. 4. Finansinių pagalbos fondų euro zonos skolų krizės valstybėms gelbėti įsteigimas ir euro zonos bankų sistemos konsolidacija tikėtina leis susidoroti su dabartine skolų krize euro zonoje, tačiau visų struktūrinių euro zonos problemų šios priemonės neišspręs. Literatūra Amadeo, K. (2012), Value of the U.S. Dollar, Interneto prieiga: http://useconomy.about.com/od/tradepolicy/p/Dollar_Value.htm (žiūrėta 2012 08 12). Angeloni, I., Sapir, A. (2011), The international monetary system is changing: what opportunities and risks for the euro? , Bruegel working paper, 2011/11, Interneto prieiga: http://aei.pitt.edu/32868/1/The_international_monetary_system_is_changing__What_opportuniti es_and_risks_for_the_euro__(English).pdf (žiūrėta 2012 08 06). Benjamin, C. (2007), Enlargement and the international role of Euro, Review of International Political Economy, Vol. 14, No. 5, pp. 746-773. Chintrakarn,P. (2008), Estimating the Euro Effects on Trade with Propensity Score Matching. Review of International Economics, Vol.16, No. 1,pp. 186-198. 493 ‘‘Societal Innovations for Global Growth‘‘, 2012, No. 1(1) ISSN 2335-2450 (online) Davulis, G. (2009). Problems of the adoption of the euro in Lithuania. Intellectual Economics. Scientific Research Journal, No 2(6), pp.108-115. Davulis, G. (2011). Comparative analysis of macroeconomic processes in the Baltic countries during the global crisis, 1st International Scientific Conference “Whither our economies”. November 16-17, 2011. Conference proceedings, pp. 250-256. Dumčiuvienė, D. (2010), Europos ekonominė integracija: vadovėlis, Kaunas: Technologija, Duisenberg, W. (2002), The Euro as a Catalyst for Integration and Competition in EMU. Vienna, June, Interneto prieiga: http://www.bis.org/review/r020624a.pdf (žiūrėta 2012 08 18). Estonian Central Bank, (2011), Estonian Economy and Monetary Policy , Interneto prieiga: http://www.eestipank.info/pub/en/dokumendid/publikatsioonid/seeriad/ylevaade/_2011_02/rpy _211.pdf (žiūrėta 2012 09 02). Eurobarometras, Introduction of the euro in the new Member States, Interneto prieiga: http://ec.europa.eu/public_opinion/flash/fl_329_en.pdf (žiūrėta 2012 09 03). Evans-Pritchard, A. (2008), Financial crisis: Who is going to bail out the euro?, Interneto prieiga: http://www.telegraph.co.uk/finance/comment/ambroseevans_pritchard/3161588/Financial-CrisisWho-is-going-to-bail-out-the-euro.html (žiūrėta 2012 08 03). Feldstein, M. S. (2011), The euro and European Economic Conditions , NBER working paper, 2011 November, no. 17617, Interneto prieiga: http://www.nber.org/papers/w17617 (žiūrėta 2012 08 18). Frankel, J., Rose, A. (2002), An Estimate of the Effect of Common Currencies on Trade and Income, Quarterly Journal of Economics, 2002 May, vol. 117, pp. 437-466. Galati, G., Tsatsaronis, K. (2003), The impact of the Euro on Europe’s Financial Markets, Financial Markets. Institutions and Instruments, Vol. 12, Issue 3, pp. 165-222. Gaspar, V. (2004), The transformation of the European Financial System. Millenium BCP Bankers Seminar, Lisbon, February, Interneto prieiga: http://www.millenniumbcp.pt/multimedia/archive/00375/operatingplatforms (žiūrėta 2012 08 16). Greenspan, A. (2001), The Euro as an International Currency. Remarks by Chairman of the Board of Governors of the Federal Reserve System, before the Euro 50 Group Roundtable. Washington, 30 November, Interneto prieiga: http://www.federalreserve.gov (2012 08 26). Hunter ,R.J., Ryan, L.V. (2009), Poland, the European Union, and the euro: Poland’s Long Journey to Full European Integration , Global Economy Journal, 2009, vol. 9, issue 2, article 6, Interneto prieiga: http://www.relooney.info/00_New_3169.pdf (žiūrėta 2012 09 13). Ioannou, D., Stracca, L. (2011), Have euro area and EU economic governance worked? Just the facts, ECB working paper series, 2011 May, no. 1344, Interneto prieiga: http://www.ecb.int/pub/pdf/scpwps/ecbwp1344.pdf (žiūrėta 2012 09 15). Kropas, S., Kropienė, R. (2005), Europos pinigai, Vilnius, Lietuvos bankas. Kuodis, R. (2005), Euro įvedimas Lietuvoje: už ir prieš, Pinigų studijos, 2005, Nr. 4, pp 12-19. Lietuvos Europos Sąjungos politikos 2008–2013 metų strateginės kryptys „ Daugiau Europos Lietuvoje ir Lietuvos Europoje“ (2008), Interneto prieiga: http://www.euro.lt/documents/Strategines%20kryptys.pdf (žiūrėta 2012 09 08). Lietuvos Respublikos Vyriausybės 2007 m. balandžio 25d. nutarimas Nr. 417 dėl Lietuvos Respublikos Vyriausybės 2005 m. rugsėjo 29d. nutarimo Nr.1050 „Dėl nacionalinio euro įvedimo plano bei 494 ‘‘Societal Innovations for Global Growth‘‘, 2012, No. 1(1) ISSN 2335-2450 (online) Lietuvos visuomenės informavimo apie euro įvedimą ir komunikacijos strategijos patvirtinimo“ pakeitimo. Munchau, W. (2008), The case for a European rescue plan, Interneto prieiga: http://www.ft.com/intl/cms/s/0/e9f0a2e2-9305-11dd-98b5-0000779fd18c.html#axzz1lEsCnZef (žiūrėta 2012 09 10). Norris, F. (2011), Euro Benefits Germany More Than Others in Zone, Interneto prieiga: http://www.nytimes.com/2011/04/23/business/global/23charts.html?_r=1 (žiūrėta 2012 09 18). Pisani-Ferry, J. et al. (2008), Coming of age: report on the euro area. Bruegel Blueprint Series, 2008, Vol. 4, Interneto prieiga: http://aei.pitt.edu/8337/1/bruegel_comingofage.pdf (žiūrėta 2012 09 16). Rastello, S.(2011), Estonia Benefits From Euro Amid Debt Crisis, Prime Minister Says, Interneto prieiga: http://www.businessweek.com/news/2011-07-22/estonia-benefits-from-euro-amid-debt-crisis-primeminister-says.html (žiūrėta 2012-09-16). Rose, A., Engel C. (2001), Currency Unions and International Integration. CEPR Discussion Paper No. 2659, Interneto prieiga: http://www.cepr.org/pubs/new-dps/dp_papers.htm (žiūrėta 2012-09-26). Samuels, Ramlogan. (2007), The Euro: Ever More Global, Finance&Development”. - TVF, 2007/03, Vol. 44, No.1, Interneto prieiga: http://www.imf.org/external/pubs/ft/fandd/2007/03/bertuch.htm (žiūrėta 2012-09-28). Shalder S. et al (2005), Adopting the Euro in Central Europe, Challenges of the Next Step in European Integration, Occasional Paper No. 234. Washington, IMF, Interneto prieiga: http://www.imf.org/external/pubs/nft/op/234/op234.pdf (žiūrėta 2012-09-30). Šeputytė, M., Eglitis, A. (2011),Debt Crisis Cools Baltic Enthusiasm for Euro, Interneto prieiga: http://www.bloomberg.com/news/2011-06-08/european-debt-crisis-cools-baltic-enthusiasm-for-euroentry.html [žiūrėta 2012-10-04] SUMMARY European Monetary Union: Creation, Advantages, Today‘S Problems Prof. dr. Gediminas Davulis Euro implementation and joining the European Monetary Union is one of most important task of economic policy in Lithuania. The historical aspects of creation of European Monetary Union as rezult of European integration processes are presented in the paper. The international importance of the common currency, i.e. Euro, as basis of the European Monetary Union, advantages and shortcomings of the common currency are analyzed. The experience Germany introducing the common currency is analyzed. The analysis has shown that adoption of Euro did not have a considerable influence on the price level in Germany, though it caused rise of some prices to a certain degree.. On the other hand, psychological factors also had some influence on increasing in the 495 ‘‘Societal Innovations for Global Growth‘‘, 2012, No. 1(1) ISSN 2335-2450 (online) prices.. The strategy of implementation of Euro in Lithuania and joining it the European Monetary Union with taking into account the experience of other countries is discussed. The today‘s debt problems in some states of the European Monetary Union, the means to solve these problems and to strenghten the European Monetary Union are discussed. Key words: Euro, European Monetary Union, inflation and Euro, strategy of implementation of Euro, debt crisis of Eurozone, monetary stabilization funds. 496 ‘‘Societal Innovations for Global Growth‘‘, 2012, No. 1(1) ISSN 2335-2450 (online) MODERNISATION OF THE PUBLIC PROCUREMENT MARKET. TOWARDS A STRATEGY OF PUBLIC MARKETING SPECIFIC ON THE SINGLE MARKET Prof.Dr. Ani Matei Prof.Dr. Lucica Matei Faculty of Public Administration National School of Political Studies and Public Administration Str. Povernei no. 6, sector 1, 010643, Bucharest, Romania E-mail: [email protected] Faculty of Public Administration National School of Political Studies and Public Administration Str. Povernei no. 6, sector 1, 010643, Bucharest, Romania E-mail: [email protected] Abstract The public procurement of goods, services and works consume annually up to 18% of the EU Member States’ GDP. The ongoing diversity of public procurement as well as the more focused compatibility of the procedures on public procurement are shaping and substantiating the public procurement market as component of the European Single Market. Recently the European Union has aimed the modernization of the procedures of public procurement. In this context, the paper aims to re-substantiate and to describe the public procurement market, determining also the framework of a possible marketing strategy in view to promote green, sustainable and innovative public procurement according to the European Union objectives. Keywords: public procurement, public marketing, green, sustainable and innovative procurement 1. Introduction The necessity to support the social and economic development processes of local communities as well as the efficient use of financial resources available to the public 497 ‘‘Societal Innovations for Global Growth‘‘, 2012, No. 1(1) ISSN 2335-2450 (online) authorities and institutions determine their higher concerns in view to establish an adequate framework for the accomplishment of public procurement. ”Despite the quantitative importance of government purchases, research on procurement is limited and mostly covers the theoretical or conceptual level. Dimitri et al. (2006) Survey in a relevant theoretical concepts and provision schemes discuss the pros and cons of alternative tendering procedures and analyse the impact of product and production characteristics on the appropriate contract design” (Vogel, 2009, 2). The public procurement, either goods, services or works are more diversified and complex. This fact is also demonstrated by the multiple acknowledgements of the concept of public procurement in the field literature. Thus, in Catana’s paper (2011, 15 – 16) we find a few definitions revealing important managerial, legal or marketing characteristics of public procurement. It is worth to mention the following ones: it represents the situation in which the public institution gets the necessary goods and services, based on a contract established with another, entity which is part of the private sector (Arrowsmith et al., 2000,6); it represents the procurement of goods, works and services, performed by means of formal or informal contracts, by public entities; the definition of public procurement covers the whole range of procurement performed by the public authorities from the usual acquisition of goods and services to the formal procurement, organised in order to assign major projects of infrastructure (D.F.I., 2005, 3); it is an acquisition process, as a rule by means of a contractual arrangement, subsequent to a public competition, in order to procure goods, services, works and other materials by a public service; the process of public procurement defines all the stages of public procurement, from the conceiving and defining the public services needs to the end of the procurement contract. (D.F.P., 2002, 20); as a wider concept than that of government procurement, as it does not refer only to the public procurement performed by the central government, but also to those performed by public institutions and organisations, such as those having as a main objective to perform public services (energy, public transportation, postal services, telecommunications, water supplies, etc.) (Woolcock, 2001, 3); as a process that includes all the stages in acquiring goods, works and services, by means of using public funds, in order to achieve certain public goals. (M.F.T.T., 2005, 1). In this context, in the current paper, public procurement designates the whole process of purchase from third parties, including the logistic aspects, based on contracts for provision of goods, service delivery and execution of works. 498 ‘‘Societal Innovations for Global Growth‘‘, 2012, No. 1(1) ISSN 2335-2450 (online) 2. The Public Procurement Market The public procurement consumes annually up to 18% of the EU Member States GDP, and in US it exceeds 20% of GDP. The continuous diversity of public procurement as well as the higher compatibility of products in public procurement shape and substantiate the public procurement market as component of the European Single Market. At the same time,” the public procurement framework forms an essential part of the market economy, purchases by public entities are realised through the market and market mechanisms should be applicable” (EBRD, 2011, 14). Also ”procurement represents a very large fraction of total economic activity” (Dimitri et al., 2006,1). For the time being, the public procurement market represents a broad concept used in the field literature, as well as in the economic culture of the European Union or OECD, World Bank, European Bank of Reconstruction and Development etc. The above assertions are sustained by the existence of offer and demand of public procurement (Matei, 2003, 18), thus of the fundamental mechanism of the market. Unlike the other markets, the public procurement market benefits of special regulation, promoted both by the national entities and international bodies and institutions. 2.1 Methods of public procurement Six decades ago, Baumol (1947) presented a theory of governmental procurement, stating that ”this function of procurement is assuming larger proportions than ever before with the constantly increasing size and scope of governments” (Baumol, 1947, 1). For public procurement, Baumol (1947) introduces ”the open market purchase”, the prices resulting from the relations between demand and offer. Describing several methods of public procurement, the author states that ”the open market procurement should prove a useful method if it is desired to make small purchases cheaply, since it involves no expense of negotiation, publicity or other administrative expenses peculiar to alternative purchase methods”. (Baumol, 1947, 4). Other methods impose more complex public procurement based on governmental decisions and regulations, diminishing or cancelling the open character of the public procurement market. Briefly, the other methods (Baumol, 1947, 3 – 4) refer to the situations where: 499 ‘‘Societal Innovations for Global Growth‘‘, 2012, No. 1(1) ISSN 2335-2450 (online) the government may issue public notification or notification to some specific seller or sellers that it is prepared to consider offers for the delivery of definite or unspecified quantities of the good; the government may offer to purchase at a specific, announced price; the government may open negotiation for terms and conditions of sale with one or more sellers; the government may choose to requisition the desired items outright, with or without compensation. All those methods have developed, strengthening the necessity for the regulation of the public procurement market. Laffont and Tirole (1993) accomplish a rigorous and grounded analysis on the development of the frameworks of regulation for public procurement in view to ensure an optimum design of the public procurement market taking into consideration the confinement of the power of regulatory institutions. The authors approach prospective aspects concerning how the policies of regulation for public procurement should be conceived, taking into consideration the asymmetry of information. The framework of regulation is very important determining distinct approaches and methods of organisation under the following terms: freedom of future commitments for the regulatory authorities, or impossibility to take commitments for the future policy, or possibility of mutual renegotiation. The analysis is also focused on the alternative when the regulatory authority could be captured by groups of interests. 2.2 Impact of public procurement The determination of the socio-economic impact of public procurement and the economic modelling have been accomplished on the basis of classical Keynesian models (Laffont and Tirole, (1993), OFT (2004), Baumol (1947) and new-Keynesian models (Ratto et al. (2009), Vogel (2009)). The European Commission, Directorate General Economic and Financial Affaires (DG ECFIN) has accomplished relevant activities for modelling the public procurement market, aimed at ”investigating the long-run effect of cheaper procurement on output, employment and consumption” (Vogel, 2009, 2). DG ECFIN analyses are based on the macroeconomic model described by Ratto et al. (2009), called QUEST III, belonging to the category of new-Keynesian Dynamic Stochastic General Equilibrium (DSGE) models. DSGE models ”have rigorous 500 ‘‘Societal Innovations for Global Growth‘‘, 2012, No. 1(1) ISSN 2335-2450 (online) microeconomic foundations derived from utility and profit optimisation and include frictions in goods, labour and financial markets” (ECFIN, 2009, 10). For the public procurement market, Vogel (2009) proposes an extended version of QUEST III model, adding a sector of public procurement. Figure 1 presents an adapted version of a model concerning the socio-economic impact of public procurement. The model has a systemic structure emphasising the connections of the procurement sector, as support of the government and financial markets and goods markets or that of households and companies. The model describes the content of each connection. The quantitative evaluations and their significance in view of reducing the administrative costs associated to public procurement are thoroughly presented in Vogel (2009). Figure 1. A model concerning the socio-economic impact of public procurement 501 ‘‘Societal Innovations for Global Growth‘‘, 2012, No. 1(1) ISSN 2335-2450 (online) 2.3 The cost of public procurement Obviously, we should make the distinction between the price for the purchase of goods or services and the costs of the procedures for purchase. In a quasi generalised practice, “procurement outcomes are considered in light of the costs incurred (human resources and time), the level of competitiveness achieved (number of bids, participation from cross-border bidders) and the perception of transparency” (EC, 2011, 5). The above source highlights an estimation of total costs of public procurement of around 1.4% of the volume of purchases, which in real terms was equivalent to 5.3 billion euro in 2009. However, the data obtained from general statistics do not reflect a direct quantitative relation between the value of the contract of public procurement and the costs of purchases. For example, in Germany and Norway, the cost of public procurement is up to 4% of the volume of procurement, while in Italy and UK, it is around 1%. The reduction of the costs of public procurement represents a concern both for the European public authorities and the national ones. The field literature identifies this issue with that of performance of the public procurement market. ”Transaction with cost minimisation is essential to ensure good market performance” (EC, 2004, 21). The field literature (Vogel (2009)) highlights the fact that the administrative costs have increased to 0.2% of the contract value. At the same time, the prices of purchase can be reduced by ensuring a high transparency of the products purchased and thus the increase of the number of offers and competitors as well as by the reform on the legislation of European public procurement. Coppens (2009) evaluates the reduction of the purchase costs at an average of 5.5% of the contract value due to the enforcement of the reformed European legislation. In the EC (2011), the specific problems concerning the costs and effectiveness of public procurement are thoroughly analysed. Those depend both on procedures, quantity of goods and services, national legislation etc. Figure 2 presents a framework chart of”the activities costs for each procedure in each country”. The costs are determined (EC(2011)) by establishing: (i) the number of person-days spent by authorities and firms on each of the activities per purchase. This is a similar calculation to what has been shown above; (ii) the number of purchases; (iii) the standard costs for each person-day of time. 502 ‘‘Societal Innovations for Global Growth‘‘, 2012, No. 1(1) ISSN 2335-2450 (online) Figure 2. Cost model for calculating total costs of procurement process 2.4. The size and profile of the public procurement market The specific mechanisms ensuring the operation of the public procurement market determine different approaches concerning the size and recently the profile of the market. OECD (2011, p. 148) states the fact that ”the size of national procurement markets is estimated using data from the OECD National Accounts Database based on the System of National Accounts (SNA)”. The same document defines ”general government procurement” as the sum of: intermediate consumptions (goods and services purchased by governments for their own use); gross fixed capital formation (acquisition of capital excluding sales of fixed assets, such as building new roads); social transfers in kind via market producers (goods and services produced by market producers, purchased by government and supplied to households) (OECD, 2011, pp. 148 – 149). The scope of general government procurement includes central, national and local government levels, excluding the public corporations, such as state-owned utilities. Another approach of the evaluation of the size of the public procurement market consists of using data collected from published tenders. Thus the European Commission 503 ‘‘Societal Innovations for Global Growth‘‘, 2012, No. 1(1) ISSN 2335-2450 (online) ”estimates the total value of tenders published in the Official Journal of the European Union (OJEU) based on the number of tenders and the values of contract awards reported by countries, which may not represent disbursements in the year indicated” (OECD, 2011, p. 149). This second modality for evaluation of the size of public procurement market will quantify only a part of the volume of procurement on national markets. Consequently, taking into consideration OECD (2011, 149) for the EU Member States, the percentage from the total of public procurement emphasised by the OJEU varies between 45% for Estonia and around 8% for Germany. The specificity of the public procurement market is also demonstrated by the analyses of the European Bank for Reconstruction and Development (EBRD), establishing the profile of the markets of public procurement in the EU Member States and other states from EBRD coverage area. Those analyses define 11 key core principles benchmark indicators grouped in three categories (Figure 3). Figure 3. The assessment benchmark key evaluation categories No. Category 1 Integrity Safeguards 2 Efficiency Instruments 3 Institutional and Enforcement Measures Core Principle benchmark Accountability Integrity Transparency Competition Economy of the process Efficiency of the contract Proportionality Enforceability Uniformity Stability Flexibility Source: EBRD (2011, p. 24) For each indicator, EBRD (2011, p. 23) proposes quantitative quantifications based on the marks: “very high compliance” (above 90%), ”high compliance”, (76 – 90%), ”medium compliance” (60 – 75%), ”low compliance” (50 – 59%”, and “very low compliance” (under 50%). The evaluation is based on the assumption that all key indicators have equal influence on the effectiveness of the procurement process. Figure 4 presents the profile of the public procurement market in Romania. 504 ‘‘Societal Innovations for Global Growth‘‘, 2012, No. 1(1) ISSN 2335-2450 (online) Figure 4 Profile of the public procurement market in Romania Accountability 100 Enforceability 80 Integrity 60 Flexibiliy Transparency 40 20 0 Stability Competition Uniformity Proportionality Efficiency of the process Efficiency of the public contract Source: EBRD (2011, p. 40) 2.5. An integrated model of the public procurement market The elements analysed are leading to the formulation of an integrated model of the public procurement market. From systemic point of view, the model has a mix complex architecture, with multiple intermediary or general loops of feedback. At the same time, the mechanisms of control and evaluation of the public procurement market are emphasised concerning integrity, efficiency and institutional and enforcement measures. A more detailed overview on the model should highlight the characteristics and specific features. If we constrain the analysis to the EU Member States then the model presented in Figure 5 represents a part of the Single European Market and therefore it holds the required connections. 505 ‘‘Societal Innovations for Global Growth‘‘, 2012, No. 1(1) ISSN 2335-2450 (online) Figure 5. Integrated model of the market of public procurement Source: the authors 3. Public Procurement Market – Reform and Modernization Since two decades ago the analysis of the public procurement market has been approached in the context of the evolution of the Single European Market. Thus, Sohrab (1990) provides a detailed legislative perspective on the directives as part of the implementation of the 1992 programme within the European Communities (EC) in the 506 ‘‘Societal Innovations for Global Growth‘‘, 2012, No. 1(1) ISSN 2335-2450 (online) area of public procurement. The study demonstrates once again the important concerns of the European institutions for the continuous reform of the public procurement market. In its content, the Single European Act 1987 defines the internal market as an area without internal frontiers in which the free movement of goods, persons, services and capital is ensured” (Sohrab, 1990, p. 522). He stated that “in fact, the liberalization of the public procurement market is a key part of the broader aim to achieve the Single European Market. 3.1 EU 2020 Strategy and the public procurement market The skip of over two decades in our analysis is justified by the major importance provided to the public procurement market in the context of 2020 Strategy. One may assert that the specific mechanisms for the operation of the public procurement market have developed and may be adapted to new directions. Beuter (2011) reveals two trends in the development of the public procurement market sustaining the necessity of reform and modernization. On one hand, the effects of the actual economic crisis triggering the need of significant budgetary constraints and on the other hand, the values of public procurement “as panacea for many problems or as a promising policy tool whose benefits appeared to have been overlooked or not sufficiently taken into account in the past”. The conclusion reveals: “the reform of procurement rules is premature and the European public procurement rules are, in general, very flexible and innovative, which provide for the integration of other policy objectives” (Beuter, 2011, p. 37) Even in these conditions, in 2011, the European Commission has established the directions of development for public procurement at EC level in light to contribute better to the achievement of the objectives of Europe 2020 Strategy. Thus, the reform of legislation on public procurement represents one of the twelve pillars provided in the Act on Single Market, adopted in April 2011 (IP/11/469). In view to obtain better results, the European Commission (EC, 2011a) has established after consultation with the citizens the following objectives: The contracting authorities should ensure an efficient use of taxpayers’ money and should avoid long and expensive procedures. All the European enterprises should benefit of same equitable conditions of access to the contracts of public procurement everywhere in the EU. The public authorities are required to ensure that the contracts of public procurement contribute to fulfilment of social objectives purchasing ecologic 507 ‘‘Societal Innovations for Global Growth‘‘, 2012, No. 1(1) ISSN 2335-2450 (online) goods and services (i.e. using materials from sustainable sources) and liable socially (i.e. taking into consideration the needs of the handicapped persons). Also, the public administrations are encouraged to purchase innovative products and services in view to stimulate the economic development. In every EU country, the assignment of the public procurement contracts of a certain value should be accomplished according to the procedures stipulated in the European rules. Those rules should guarantee that the public procurement meet efficiently the above requirements. In this context EU aims to change by 2012 the rules regulating public procurement. In the first stage, the European Commission published a green paper containing its proposals concerning simplification and updating of the actual rules. The aimed objectives are as follows: simplifying the procedure to assign the public procurement contracts; facilitating the access to the procedures for assignment the public procurement contracts everywhere in the EU, especially for the SMEs; ensuring the conditions for a better use of the public procurement contracts as support of other policies. Referring to concrete modalities of the reform in view to sustain EU 2020 Strategy, (EC (2011b, p. 2)) asserts: “To further support the Europe 2020 Strategy objectives and due to the positive reactions to the Green Paper, the Commission suggests the introduction of a life-cycle cost concept, which will encourage public authorities to consider the full life-cycle of products in their purchasing decisions. The life-cycle cost will include internal costs and monetised external environmental costs. Member States and contracting authorities will remain free to decide whether to integrate life-cycle costing in their procurement procedures. Contracting authorities may take into account criteria linked to the production process of the goods or services to be purchased. In addition, contracting authorities may require the works, supplies or services bear specific labels certifying environmental, social or other characteristics, as long as only the criteria and characteristics of the label which are linked to the subject matter of the contract are required and that equivalent labels are accepted. More specifically on social inclusion, the Commission suggests broadening the current contracts’ reservation in favour of sheltered workshops: on the one hand, this exception is extended to economic operators whose main aim is the social and professional integration of disabled and disadvantaged workers; on the other hand, the 508 ‘‘Societal Innovations for Global Growth‘‘, 2012, No. 1(1) ISSN 2335-2450 (online) minimum required percentage of disabled or disadvantaged workers is reduced from 50% to 30%”. 3.2. Key issues of a marketing strategy for public procurement The starting point of a public marketing strategy consists in the estimated impact of the reforms of public procurement market in the context of Europe 2020 Strategy objectives. The theoretical and practical support of the marketing strategy is found in Catana (2011, chap. III, pp 94 – 113). An innovative trend ties the adaptation of the procurement policies to the environmentally friendly ones, by issuing the so called green public procurement. They are procurement processes in which elements of environmental protection are taken into consideration when procuring goods, services and works. Conceptually, the green public procurement represents the approach of the public authorities that integrates environmental criteria in all the stages of procurement processes they develop, thus encouraging spreading environmental technologies and developing safe products as the environment is concerned; they search and pick the solutions with the smallest negative impact upon the environment along the entire life cycle (Bouwer, 2006, p. 5). Other two concepts are emphazised, both of an utmost importance for the development of the public procurement based on performance and effectiveness criteria, such as: the concept of sustainable public procurement, according to which, in the context of climate change, of carbon emissions in the atmosphere and of world-wide menace upon biodiversity, the public procurement sustainability must be treated in a manner as serious as well as the financial matters related to public procurement (HCEAC, 2006, p. 3); the principles of sustainable public procurement are outcomes of the general principles of the sustainable development; the concept of abiding public procurement, defined as the process in which the organizations fulfill their needs regarding goods, services and utilities in a way that ensures value for money for their entire life cycle, thus generating at the same time benefits, not only for the organization, but also at social and economic level, and simultaneously reducing the pollution of the environment (DEFRA, 2006, p. 10). As stated in a European Commission report, the Member States can promote the research, development and innovation activities, by directing their huge expenditure for 509 ‘‘Societal Innovations for Global Growth‘‘, 2012, No. 1(1) ISSN 2335-2450 (online) public procurement. By opening high-tech markets, the public authorities can stimulate the companies to invest in research, offering at the same time the certainty that informed clients are waiting to buy the results of competitive innovations. Moreover, promoting research and development brings about opportunities of raising the public services’ quality and productiveness, by delivering innovative goods and services. In this respect, a new concept was initiated: “public procurement for innovation” (EC, 2005, p. 5), that brings about new opportunities in the framework of the European Directives. Public Procurement for Innovation is the purchase of goods and services that do not exist or need to be improved and hence require research and innovation to meet the specified users’ needs. They are at the same time some of the most recent innovative policies that can be used in raising competitiveness in urban area. Logically, goods and services of this kind must be described by their functionality and not in a prescriptive manner that impede upon the innovation. References Arrowsmith S., Linarelli J., Don Wallace Jr., (2000), Regulating public procurement. National and international perspectives, Kluwer Law International, p.6 Baumol, W.J., (1947), Notes on the Theory of Government Procurement, Economica, New Series, Vol. 14, No. 53, pp. 1 – 18 Beuter, R., (2011), European Public Procurement: Time for Reform?, EIPA, Maastricht Bouwer, M., (coord) (2006) Green Public Procurement in Europe, Virage Milieu & Management, the Netherlands Catana, C.M., (2011), ”Public Procurement Management”, Achizitii publice, Universul Juridic, Bucuresti, Romania Coppens, O., (2009), Does Competition Save Taxpayer’s Money in Public Procurement, mimeo. Department of Finance of Ireland (DFI), (2005), National Public Procurement Policy Unit, National Public Procurement Policy Framework Department of Finance and Personnel (DFP), Ministry of Finance and Personnel of Northern Ireland (2002), Public Procurement Policy Department of Environment, Food and Rural Affairs (DEFRA) (2006) Procuring the Future: Sustainable Procurement National Action Plan. Recommendations from the Sustainable Procurement Task Force, London Dimitri, N., Piqa, G., Spagnola, G. (eds), (2006), Handbook of Procurement, Cambridge University Press EBRD, (2011), Public Procurement Sector Assessment. Review of Laws and practice in the EBRD region; ECFIN, (2009), ECFIN Research Letter, vol. 3, Iss. 1 European Commission (EC), (2011), Public Procurement in Europe. Cost and effectiveness, http://ec.europa.eu; European Commission (EC), (2011a), Achizitii responsabile social. Un ghid al aspectelor sociale care trebuie luate in considerare in procedurile de achizitii publice, (in Romanian), http://ec.europa.eu/progress; 510 ‘‘Societal Innovations for Global Growth‘‘, 2012, No. 1(1) ISSN 2335-2450 (online) European Commission (EC) (2011b), MEMO/11/931, December 20, Brussels European Commission (EC) (2004), A report on the functioning of public procurement markets in the EU: benefits from the application of the EU directives and challenges for the future, http://ec.europa.eu/internal_market/publicprocurement/docs/public_proc_market_final_report_ en.pdf European Commission (EC) Research Directorate General, Expert Group Report (2005) Developing procurement practices favourable to R&D and Innovation, Brussels Laffont., J., J., Tirole, J., (1993), A Theory of Incentives in Procurement and Regulation; MIT Press Matei, A., (2003), Public Economics (in Romanian), The Economica Publishing House, Bucharest Ministry of Finance of Republic of Trinidad and Tobago (MFTT), (2005), Reform of the Public Sector Procurement Regime, A White Paper OECD, (2011), Size of public procurement market, in OECD, Government at a Glance 2011, OECD Publishing, doi:10.1787/gov_glance_2011_46_en Office of Fair Trading (OFT). (2004), Assessing the impact of public sector procurement on competition, vol. 2, OFT7426, www.oft.gov.uk Ratto, M., W. Roeger, J., in’t Veld, (2009), QUEST III: An Estimated DSGE Model of the Euro Area with Fiscal and Monetary Policy, Economic Modelling, vol. 26, No.1, pp. 222 – 233 Sohrab, J.A., (1990), The Single European Market and Public Procurement, Oxford Journal of Legal Studies, Vol. 10, No. 4 (Winter), pp. 522 – 538 The House of Commons – Environmental Audit Committee (HCEAC) (2006) Sustainable Procurement: The Way Forward, Third Report of Session 2005 – 2006, London Vogel, L., (2009), Macroeconomic effects of cost savings in public procurement, European Economy, Economic Papers 389 Warrillow, C., (2012), Market – oriented public procurement systems, International Trade Forum Woolcock, S., (2001), The Interaction Between Levels of Rule Making in Public Procurement, United Nations University, Comparative Regional Integration Studies 511 ‘‘Societal Innovations for Global Growth‘‘, 2012, No. 1(1) ISSN 2335-2450 (online) GLOBALIZATION INFLUENCE AND CONSEQUENCES ON COUNTRIES’ ECONOMICAL DEVELOPMENT Assoc. Prof. Natalia Pogorelenko Maksym Nezhurin, student Banking Department Kharkiv institute of banking of the University of banking of the National bank of Ukraine Peremogy av. 55, 61174, Kharkiv, Ukraine E-mail: [email protected] Kharkiv institute of banking of the University of banking of the National bank of Ukraine Peremogy av. 55, 61174, Kharkiv, Ukraine E- mail: [email protected] Abstract The distinctive characteristics of the world economic relations are intensive development of financial globalization involving national economics to the world financial market and intensification of their interrelation. These processes have resulted in emergence of integrated informational space, internationalization and rapid increase of capital markets. Intensification of goods, services and capitals international exchange leads to the origin of new tendencies in financial relations’ sphere. That is why the strategically important line is the elaboration of effective national policy in financial field, taking into account the necessity of countries’ integration to the world economy as equal participants of the global market process. The processes of world economy globalization can not bypass either Ukraine or its financial-banking system, especially taking into consideration domestic economy’s directness. It means that the majority of positive and negative events of the external world will be “imported” in this country with the appropriate consequences. The part of Ukraine’s world financial flows, the capacity of capital investment involved to economics, accordingly the earlier reach of an appropriate level in manufacture and finance spheres depend on the pace of integration of this country’s banking system to the world financial space. Globalization, especially its financial part, and international financial integration as a factor that influences the latter are the phenomena that are not fully explored 512 ‘‘Societal Innovations for Global Growth‘‘, 2012, No. 1(1) ISSN 2335-2450 (online) nowadays. Thus, research in this area is very important and truly arouses great theoretical and practical interest. Keywords: banking system, informational space, integration, globalization, financial market. 1. Introduction The main tendency of the modern world household development is close countries’ interconnection in political and economic sphere, that assures by growing communications’ development, the worldwide problems’ availability and is accompanied by interpenetration of different cultures. This tendency got the name of ‘globalization’. Economic globalization is one of the most developed elements of the general globalization process. A special place in the economic globalization structure is given to the process of the international financial markets’ globalization (IFM). Previously the main task of the IFM was servicing of the real economic sector. During last decades the process of financial sphere internationalization caused the emergence of a powerful infrastructure of the world financial market that spread to the majority of the world countries. Actual independency of the world financial market from the policy of some countries of the world has become its important consequence. Communication systems’ development against liberalization of international and especially currency-financial relationships has led to nearly absolute capital mobility. These factors promoted origin of comparative IFM independency from a real sector. That is why their pace of development exceeded real sector of the world economy progress – the most part of the operations (up to 90%) have purely speculative character. Besides, manifestation of the opposite influence of financial sphere on the real sector gains more and more power. Such position of the world financial markets provided for the general tendency of the world economic relations’ globalization favored the process of their globalization to go much quicker, than that of goods and service markets, other industrial factors. Owing to this, the research of globalization processes’ influence on the economy of a country in general attaches special importance nowadays, that stipulates topicality and expediency of this research. The latest research and publications’ analysis. The question of integration and globalization of the world economy in the international financial space, and also the question of internationalization and international goods exchange are widely studied in economical literature and examined by such scientists as A. Baranovsky, D. Hladkyh, Yu. 513 ‘‘Societal Innovations for Global Growth‘‘, 2012, No. 1(1) ISSN 2335-2450 (online) Kovalenko, T. Smovzhenko, S.L. Tihipko, George L. Kline, M. Deliahina, M. Cheshkova, V.Kh. Arutiunova, V.M. Svintsitsky, V.S. Dyev and others. Question statement. The work is devoted to the research of the processes of internationalization globalization, intensification of goods, services and capitals international exchange, and also their influence on the banking system of Ukraine and its economy in general. 2. The main material of the research Defining financial globalization, many researchers consider, that as a new tendency of development it appeared in 1970ies, when the amount of international liquidity and disbalance of current payments grew swiftly. It happened due to the cancellation of gold exchange standard and fixed exchange rates, oil ‘shocks’ and repeated increase of the world price for oil, ‘oildollars’ accumulation and Eurocurrency resources replenishment, extension of the international bank crediting and emission of securities at the international markets. The processes of globalization happen more actively in financial sector, mostly because of the abolition of limits for the international capital range and the liberalization of financial services trade in economically developed countries. The majority of researchers believe, that rather a great growth of international capitals presence at national markets refers to the most important consequence of globalization. This led to the diversification of national financial establishments activity, their amalgamation as a result of merging- acquisitions, and also international financial groups forming. Globalization also provides for the unification of legislation in the financial field sphere and its liberalization. Nowadays, any national features of financial sphere regulation, that come usually to some restrictions, are able to complicate a country’s integration into the world financial and economical space and decrease the competitiveness of national establishments dramatically. In fact, globalization does not give any opportunity for ‘the special’ national ways of development of the integrated economies’ financial sector. It may be explained by the fact that the world financial market turned to be a peculiar system of joined vessels, the difference of liquid levels in which leads to the whole mass movement. The last financial crisis, which affected many countries, including Ukraine, showed the effect of financial stability fault happening in at least one country. The unification and liberalization of national financial legislation take place in the countries of the EU during the two last decades. Thus, the establishments of communal investment became the first kind of financial institutions, operations of which were 514 ‘‘Societal Innovations for Global Growth‘‘, 2012, No. 1(1) ISSN 2335-2450 (online) liberalized within the European Community. The EU Council directive 85/611 was approved in 1985, clauses of which were transformed into the norms of national rights of the European countries, which allowed funds of a country to allocate its securities in other countries of the Community without their repeated registration. That is very important for the guaranteeing of national economy and banking system competitiveness. National economy competitiveness is defined on the level of separate companies that produce goods and services and represent national economy at the world markets, and on the regional level of branch and interbranch clusters, within which these companies function. Growth of the national economy competitiveness as the main momentum of the world economic development is one of the crucial conditions of finding the way out of the recession for the countries that had known considerable losses due to the world financial-economic crisis. The researches that are conducted by the World Economic Forum (WEF) in this sphere, include wide range of issues: revelation and analysis of factors of the major influence on competitiveness, comparative analysis of the relevant rates among most of the countries in the world, elaboration of recommendations for the mechanism of competitiveness improvement in some countries and regions. Mistakes on this way may result in destructive rather than stimulative factor for external competitiveness. The basis for the economic connections within the framework ‘North-South’ may be the Ukraine’s convenient geographical location between technologically developed North and South of Europe, that is developing rapidly, and adjoining the Near East and North African countries. Either northern countries of Europe, or the countries of the Black Sea Economical Community area, or nearly the whole region of the Mediterranean are interested in these connections progress and support . Black Sea-Baltic strategic vector gains even more topicality within the priorities, defined by the European Unit in the development of transport infrastructure in the direction ‘North-South’, which includes several transport corridors, pipeline building and other investment projects. The consequences of globalization are very disputable. Here are some of them: 1. The contradiction between universalization (homogenization) of social life and nations’ drive to save their individuality. Statement of common market patterns, democratic institutions and values extend to culture and life style. People use the same goods and information. For instance, it is known, that three-quarters of the films watched in different countries in the cinemas and on videocassettes are of American production. The symbol of culture’s homogenization is ‘McDonald’s’, that has branches in more than a hundred countries. Not everybody agrees to such expansion of West. 515 ‘‘Societal Innovations for Global Growth‘‘, 2012, No. 1(1) ISSN 2335-2450 (online) That is why many nationalities, accepting the market pattern in general, try to preserve their individuality and cultural identity. 2. The geoeconomical world division: deepening of the gap according to technical-economical rates and life level between North (developed countries) and South (‘outlying’ countries). The following numbers show the polarization of the world community: in the middle 50ies of the XX century 80% of the world GDP was possessed by twenty-four countries, where 14,5% of population lived. If many western countries are guided by the profit of three hundred dollars a year per person, in the other part of the world this profit is not higher than ninety-five dollars. Inequality, that divides the world, may be seen in the educational sphere too, for example, 78% of population in Ethiopia, Tanzania, Bangladesh and Congo are illiterate and semiliterate. Some researchers and politicians of the developing countries consider the marginalization of ‘periphery’ of the world system to be a direct result of globalization. They protest against such a model of international relations and foresee a conflict between ‘poor’ South and ‘rich’ North. Though not everybody agrees with such a radical evaluation of globalization, it should be admitted, that such economical polarization is dangerous with international instability and possible waves of nationalism. 3. The constituent part of globalization is migration, that has disputable consequences both for the ‘receiving’ and ‘giving’ countries. It happens, that western capital is interested in two kinds of immigrants: highly qualified specialists and low qualified cheap labor force. In such a way ‘giving’ countries solve unemployment problem, at the same time their economy and science suffer from intellectual elite loss. While ‘receiving’ countries also face considerable problems. Migration processes transform social culture of their societies, founding new ethnical communities, originating new discussions about civil rights of ethnic minorities and cultural identity of a folk. The growth of antimigrational actions has become the serious problem in some countries. These actions are usually racially coloured and worsen antagonisms between different ethnic diasporas. This makes the governments of many countries to toughen the migration control, which contradicts the logic of globalization that provides for free movement not only of capitals and goods, but also of labor force. 4. Interrelationship intensification in the world runs parallel to the processes of regionalization of the world space and disintegration of separate territories. The processes of regional household and political integration are observed not only in Europe, but also in Latin and North America (Andes agreement, North American Free Trade Zone – MERCOSUR), in Asia and Africa. At the same time fragmentation of some parts of the world is observed: post-soviet space, Yugoslavia etc. As S. Huntington considers, modern world space disintegration is performed not so much according to 516 ‘‘Societal Innovations for Global Growth‘‘, 2012, No. 1(1) ISSN 2335-2450 (online) economical, as to civilized borders. According to the scientist, the matter is in separation of various cultural superregions (Islamic, Christian etc), which have the main conflicts between them nowadays,. 5. Intensification of uncontrolled processes in international sphere, that is connected with the world’s fragmentation, growth of religious fundamentalism and nationalism, extension of mass destruction weapons and general armament, forming of the centers of the international terrorism and organized crime activity. These processes became ‘the other side of the coin’ of the globalization process. 6. Non-central multipolarity formation became one of the consequences of modern global changes. This is a kind of transitional stage from onepolar pattern with the USA dominance to new division of power and possible formation of new power centers and strategically unions, called to control this country. The traditional competition within the triangle the USA – Western Europe – China is added by the competition with Japan, India and Russia that try to establish their influence in some regions. The uniqueness of geographical position of Ukraine gives the opportunity to play the role of one of the main links on axis ‘East-West’, or in other words on the way ‘Europe-Pacific Region’. On the poles of this axis there are two main world regional trade alliances. The importance of Eastern direction of Ukraine’s external economic activity is also proved by the facts that nowadays almost half of the mankind live in the countries of APR, more than 55% of commercial output is produced here and nearly 40% of the world trade volume is centered in these countries. This region is one of the richest and the most progressive in the sphere of new technologies development and introduction, which generates nearly half of the whole world investments nowadays. The whole thing stipulates the necessity of Ukraine to broaden its presence in the region. Today Ukraine is more actively oriented towards West, that is connected with the opportunity to be given investments, passing technologies, experience of governing, but this does not include those wide opportunities, that are open for Ukraine in East. The very Eastern countries are able to absorb nearly the whole stock-list of Ukrainian machine export, and also can load with work its scientifically-technical potential. Ukraine has great opportunities for taking part in realization of considerable energetic and other industrial projects. Its integration in the system of economic relationships with APR countries demands solving of a lot of economic and political problems, some time for adaptation of Ukrainian legislation to the demands and peculiarity of the region. Turnpike of Ukraine’s economy development in XXI century will be creation of the economy of an open style, that is such an economical system, which recently gathered 517 ‘‘Societal Innovations for Global Growth‘‘, 2012, No. 1(1) ISSN 2335-2450 (online) the greatest number of followers in the world. On the one side, it will give the opportunity to Ukraine, that has become open to the world, to be understandable for the countries-partners and to speak one business language with them, on the other side, it will make the way to MNC (Multinational corporation) open for Ukraine. Thus, following the goal of entering the world economic space Ukraine should apply in practice the principles of free trade and propagate openness of the economy, gradually and steadily conduct privatization and form effective, devoted to the business, reduced to the effective minimum state authorities. It is not a secret, that nowadays the one, that possesses the newest technologies and can apply it in industry, gained success. However, success is not possible without creation of national innovation system, that is founded on the basis of applying knowledge as an efficient power via research organization and securing promotion of innovation application. In the period of globalization development a lot of countries unite on the basis of mutually profitable exchange of knowledge and technologies aiming at reaching the progress in the world economy. If the government does not have its own formed system of free trade conducting innovations, then it may lead to serious economic losses, moreover , to stagnation and degradation. Conclusions The influence of institutional reforms on the state economic policy in the process of realization of structural transformation of national economy in Ukraine consists not only in liberalization of economic policy, but also in taking into account the consequences of financial globalization for institutional transformations in the financial sector of economy. An important element of the state policy is the creation of institutional structure of financial sector, that is an essential premise for the development of the native capital market. As it is proven, that those countries have the most developed financial institutions, that have 1) surely advocated creditors’ rights; 2) legal system, that is aimed at contract duties defence; 3) calculating standards, that give an opportunity to get high quality of accountancy. So, reforms in these branches will fasten the development of financial sector of economy and provide economic progress. Generally, modern conditions of capital market development in the globalized world make the problem of financial sector stability, that in the long-term perspective depends on the existing set of formal rules and informal norms of its functioning. In fact, this is the object of further scientific research. 518 ‘‘Societal Innovations for Global Growth‘‘, 2012, No. 1(1) ISSN 2335-2450 (online) References Гусєв Я.О. (2010), «Українські банки в тенетах іноземного капіталу», Науковий вісник ДГМА, №1, с.20-23. Зварич І. (2009) «Модель впливу валютного курсу на економічне зростання», Економіст, №9, с.34-37. Коваленко Ю. (2012), «Формування комплементарної моделі фінансового сектору економіки», Вісник Національного банку України, №7, с. 42 Кожурин П.Е. (2010) «Финанциализация как фактор развития мировой экономики», Вестник Российского государственного гуманитарного университета, № 6. с. 260–265 Корнилюк Р. (2010), «Українські банки в тенетах іноземного капіталу», Економічна правда, с. 50-54 Перепьолкіна О. О. (2010) «Економічне зростання в умовах перехідної економіки», Фінанси України, №5, с.110-121. Сацик В. (2010) «Циклічність економічного розвитку України», Економіст, №5, с.80-83. Тарасевич В.М. (2006), Міжнародна економіка, КИЇВ, Центр навчальної літератури. Стратегії економічного розвитку в умовах глобалізації, access via Internet: www.ecolib.com.ua (referred on 23 September 2012) 519 ‘‘Societal Innovations for Global Growth‘‘, 2012, No. 1(1) ISSN 2335-2450 (online) THE STRATEGIC ASPECT OF INTELLECTUAL PROPERTY RIGHTS: CASE OF CHINA Instructor. Ceyhun Can OZCAN Ibrahim OZMEN , Ph.D Department of Tourism Managment, Necmettin Erbakan University, Konya, Turkey E-mail:[email protected] Department of economics Selcuk University, Konya, Turkey E- mail: [email protected] Abstract The most important capital of the countries that are based on the knowledge economy is Thw Intellectual Property Rights (IPR), in day by day the more globalized world. Protection of these rights supplies to supporting of creation of new technology-oriented R & D in the context of the axis of the business world and creative and innovative people. The legal ground of IPR is allowing creative personalities to derive a revenue through their studies. And it also contributes significantly to the economy as indirectly. The obtained revenues from IPR increase day by day with together the developing of technology. An another advantage of IPR is its providing a competitive environment. In this period that we are face to face with scientific and tecnological developments; IPR comprise the main force of economic development. According to the data of OECD, it is considered that in last 25 years the share of innovations on the economic growth is more than 50% especially for developed countries. And on the other hand, the most important economic fact of today is the difference between the central capitalist economies which produce knowledge and technology, and the developing 520 ‘‘Societal Innovations for Global Growth‘‘, 2012, No. 1(1) ISSN 2335-2450 (online) economies which are only the users of it. These mentioned central capitalist economies make IPC more important with some of regulations, because they don’t want to lost the monopoly power which that difference provides them. The last recent "global quality" regulation in intellectual and industrial rights is "Agreement on TradeRelated Intellectual Property Rights". The two loom large countries that are the factors of balance are; post super power ABD and China that is the unstoppable power of Asia. former super power the United States and China in Asia. The aim of this study is o provide information imposed by the light of the provisions and regulations of Agreement on TradeRelated Intellectual Property Rights, to examine China's approach to intellectual property rights and its practices, according to the basis of international legislation and also present a projection how IPC developed in China. Keywords: China, IPR in the world, Competition, Intellectual Property Rights Protection 1.What is the intellectual property rights? According to the researches related to Intellectual Property (IP) it is possible to reach different definitions. In 1967 WIPO, without making any definitions, lists a few of the issues to be addressed within the scope of IPR as below. The studies on the fields of literature, art and science; Audio and video recordings of the active artisans; The new discoveries in all areas of human life; Scientific discoveries; Industrial designs; Trademarks, service marks and trade names and marks in the field; Protection against unfair competition and 521 ‘‘Societal Innovations for Global Growth‘‘, 2012, No. 1(1) ISSN 2335-2450 (online) ''The rights resulting from all the personal discoveries in industrial, scientific, literary or artistic fields''. The subject of IP divides into two: Copyright (protection of literary and artistic works) and Industrial Property (Protection of inventions). But subheadings of intellectual property rights will not be covered in this study. 2. China in General Napoleon's famous words about China began with ''There is a sleeping giant in China''. ''Let him sleep; because this giant will undermine the world when he wake up''. What Napoleon said 200 years ago slowly begins to take place today. Located on the west coast of the Pacific Ocean and at the eastern end of Asia, it is the world's third largest country with 9.6 million km2 surface area after Russia and Canada. There is a land border longer than 20 000 kilometers.It is bordered by Korea at the north-east , Former Soviet republics and Mongolia at the north, Afghanistan, Pakistan, Nepal, Bhutan, and India at the southwest, and Torsion, Laos and Vietnam at the south. China has been a country of interest in each period. China is at the stage of history for 5000 years.(TUSIAD, 1995: 21) 3. What is WIPO? 3.1. The role of WIPO World Intellectual Property Organization (WIPO), is an expert structuring of United Nations (UN). He is responsible for the development of international intellectual property system which is balanced and open for anyone. It provides this task by rewarding making invention, supporting innovation, protecting the public interest and strengthening the development in the economic field. WIPO was created in 1967 by the 522 ‘‘Societal Innovations for Global Growth‘‘, 2012, No. 1(1) ISSN 2335-2450 (online) Treaty of WIPO. The center is in city of Geneva, Switzerland. General Manager is Francis Gurry'dir (ASO, 2010). Member States WIPO's member states determine the organization's strategic steps and activities. They meet with each other in the general council meetings, in the committees and in the working groups. There are currently 184 member states, ie, they represent 90% of countries in the world (ASO, 2010). The Secretariat The Secretariat of WIPO, the International Bureau, is in Geneva. The staff of WIPO has been appointed by 90 different countries and ıt consists of the general political field experts, economists, administrative personnel, computer operators and the experts who are responsible for the implementation of Intellectual Property Law. 4. NGOs and intergovernmental organizations WIPO is working with a large group of social interest, which includes other international institutions, NGOs, non-governmental organizations and the representatives of the industry groups.250 pieces intergovernmental organizations (IGO), have attended meetings with the observer status currently. In this context, IPR, to ensure innovation, and economic growth, is especially important for the reasons listed below (BIAC, 2003). Intellectual property protection promotes innovation and sustainable economic development in a broad spread. In other words, ıt creates the necessary supply environment to create the new inventions. 523 ‘‘Societal Innovations for Global Growth‘‘, 2012, No. 1(1) ISSN 2335-2450 (online) IPR provides the spread of leading information and inventions which will increase the innovation in both industry and also between industries. IPR encourages the risky, uncertain, and costly investments. IPR spreads and increases the consumer awareness in the global economy. Effective competition policy is based on the appropriate intellectual property regime. IPR provides the security of the benefits of intellectual property for the development of digital economy (computers, telecommunications, entertainment, education and other knowledge-based sectors). IPR allows the creation of new markets as it is commercial and can be transferred. Intellectual property, also, supports the development of innovation in the sectors, just like health care, which are important for the development of the ecenomy. IPR plays an important role in teaming science and innovation. On the other hand, it is known that there is an important relation between IPR and foreign direct investment, trade flows and technology transfer. Even if their contents are not fully understood, intellectual property regimes play an important role in this relationship. According to OECD (2003) report, a developing country with a strong structure of IPR is in a more advantageous position in bringing the technologies of foreign companies to its own country. 5. What is TRIPS? TRIPS, which was negotiated for the objectives of facilitating the transfer of intellectual property rights in the multilateral trading system and making closer of the structures of intellectual property rights regimes during Uruguay meetings which are carried by WTO between the years 1986-1994, entered into force in 1995. 524 ‘‘Societal Innovations for Global Growth‘‘, 2012, No. 1(1) ISSN 2335-2450 (online) The main purpose of TIRPS seeks to correct the flaws caused by national intellectual property law in global trade. TRIPS binds all WTO member states and is developing an inter-governmental settlement mechanism by WTO to protect disputes arising in the field of intellectual property. 6. Why is Implementation of Intellectual Property Rights and Data Protection important? The production of the innovative and original products to improve the quality of human life, an average of 12 -13 years of production, is a process that has cost millions of dollars. The work takes a very long time.Due to the length of the process, it is not possible to enjoy the full right of 20-year patent protection which begins after the first application for research and development. Therefore, as soon as the application is made to obtain a license, implementation of a protection period of the data has been adopted.If you need to approach it with an example here, the subject can be explained as follows. As an example, if we consider a company engaged in pharmaceutical production, "data protection" application, which protects the data produced by research-based pharmaceutical companies in exchange for serious cost and does not give these data automatically to the opponent organizations which does not waste these costs, is appropriate in terms of the principles of fair competition and promoting innovative drug research. Otherwise, less research and development study will be made due to unfair competition, there will be less original drugs that will be mimiced by generic manufacturers, and fewer new drugs will become available to improve the quality of life. It can be expressed in the same way for the other products of R & D study. The fact that research and development activities are costly, troublesome, and long-term have increased the risks of research firms. Only 525 ‘‘Societal Innovations for Global Growth‘‘, 2012, No. 1(1) ISSN 2335-2450 (online) one of the thousands of molecules considered appropriate in the laboratory may be on the shelves of pharmacies as a medicine at the end. Or thousands of products may find the opportunity of being on the market after many experiments. Many drug candidate may be passed aside, after spent large sums of money, due to the negative side effects determined after reaching a certain point in the process of research. This also shows a serious risk of investment in terms of research-based pharmaceutical companies. The implementation of intellectual property rights within the framework of legal rules has an important role for research-based pharmaceutical companies making millions of dollars of investment in R & D to meet this investment and to create new resources for research. Today, even outside of developed countries, the trend in the world suggests the protection of intellectual property rights.For example, China adopts international standards for the protection of intellectual property rights, as it also provides significant incentives in order to attract international investment in recent years. Similarly India has increased the importance of intellectual property rights in recent years, and almost has become the center clinical trials. It attracts hundreds of millions of dollars of investment in a year in this area. In addition, many countries in the Far East has become the technology base. Almost all the companies that have become production centers of multinational companies in the west shifted their production facilities to the Far East and Asia by considering the other factors. One of the most important of them is, Asia's rising power, China. 7. Economic Importance of Intellectual Property Concept For information has become the main economic entity in the new economy, information management and protection has become a cornerstone of the company and their economic management. After the 526 ‘‘Societal Innovations for Global Growth‘‘, 2012, No. 1(1) ISSN 2335-2450 (online) 1990s, private companies, universities and research institutes, understanding the importance of information, have accepted the importance and necessity of protection of intellectual property. The top managements of companies established departments dealing with these issues. Because intellectual property started to be seen as valuable as financial entities in many sectors of industry in this period.Thus, companies have employed more educated people for the management of this area (Hanel, 2006; Taş, 2008) Especially in terms of developing countries (DC), there is a close connection between economic development and technology transfer with Intellectual Property Rights. Because technology transfer is one of the ways which these countries need in order to access new technologies. Thus, production levels, foreign trade, and growth rates will increase. By this way, exporters in DC does not only have the opportunity to cut costs and increase production capacity and products quality, but they may also increase their export capacity raising the international competitive power(Taş, 2008: 82). Technology transfer, as well as the benefits mentioned, has an impact on developing the laws of these countries about intellectual and industrial rights, and enhancing the importance of protecting these rights. The protection of intellectual and industrial rights is of great importance to the realization technology transfer. Because the domestic companies that have technology transfer, if these rights are not protected enough in their countries, may be subjected to unfair practices of competitors in the same sectors. However, if effective measures are not taken sufficiently against violations of intellectual property rights in these countries, competitors, without making any payment to the multinational companies, are able to obtain the technology and gain unfair prices . In this case, multinational companies, in order to protect their rights, will be unwilling to make technology transfer to this kind of countries in which industrial and intellectual rights are not protected enough. Since inrealization of 527 ‘‘Societal Innovations for Global Growth‘‘, 2012, No. 1(1) ISSN 2335-2450 (online) technology tarnsfer will negatively affect the development of DC, it will force these countries to give importance to the protection of intellectual property rights, and to bring their laws about this issue into the line with international agreements. Many countries, in this way, arranged their laws in accordance with the international conventions.Thus, the importance of the protection of intellectual property rights at the international level has been understood and new progresses have been made on this issue(Taş, 2008: 83). 8. View of China about intellectual property rights China entered to World Trade Organization (WTO) in 11 December 2001. Before China entered the World Trade Organization, entering the World Trade Organization took a long and extended negotiations. One of the fields of hard bargain is China's intellectual property rights protection and not having long trade relations with the West. China has encountered very different regulations in entering the World Trade Organization, China had to change its legal infrastructure and the framework because of these arrangements. System had to be modified with long-term laws and regulations. It was forced to implement to comply with the agreement of the intellectual property rights based on trade together with intellectual property rights protection under the umbrella of the WTO. 9. The roof of the development of IPR in China The first development related to intellectual property rights in China occurred after the development of printing process. There are a lot of evidence to support it. To give an example in the time of the Tang dynasty, the provisions stating that copying prohibited have been distributed and applied with the advent of printing techniques. And in the period of the 528 ‘‘Societal Innovations for Global Growth‘‘, 2012, No. 1(1) ISSN 2335-2450 (online) Song dynasty, due to the increase in publications, preliminary examination and registration procedures were applied. Moreover, protections were at the regional level for the protection of IPR. Tea, silk, paper and pharmaceutical manufacturers, and the guilds tried to protect brand names and symbols for trademark registration. These guilds were as effective as the Song dynasty in receords, but they had no implementation power. However, emerging evidence in the past decade and widely accepted view is : there is a centrally declared official protection for both invention rights and property symbols. In contrast, the feeble efforts to protect intellectual property rights are only considered as ideas in the purpose of protecting the state authority by controlling its spread. China's IPR protection has gained momentum after the Paris Convention on Industrial Property (1883) and the Berne Convention for the Protection of Literary and Artistic Works (1886) conferences in the late 19th century. In addition, the provisions of these treaties with Britain, Japan and the United States in the early twentieth century, including the provisions on intellectual property, were contradictory and ambiguous. Consequently, despite an unprecedented international interest about IPR in this period, the rules could not be established by the Chinese empire. 9.1. IPR Protection in China: 1911-1949 Kuomintang (KMT), when he came to power, made efforts to stimulate the creativity and invention. For example, after coming to power, KMT announced the Provisional Regulation on the Technology Award in 1912. A patent law was put into action in 1944, trademarks were arrenged in 1923, copying laws were modified 5 times. However, the legislation remained largely unused during this period, legal reforms were largely sidelined by the political instability. 529 ‘‘Societal Innovations for Global Growth‘‘, 2012, No. 1(1) ISSN 2335-2450 (online) 9.2. IPR Protection in China: 1949-1978 Under the Communist ideology, the concept of private property rights has become meaningless.Thus a limited reward system was created, the limited reward and bonus model from the Soviet system for inventors failed at encouraging innovations. Anti-rightist movement and Huge Strides raised some doubts about the suitability of financial incentives in the late 1950s. In addition, during the Cultural Revolution, even the lump sum bonus system has been removed in favor of a strict policy although all the inventions and creations were national assets. Consequently, research and development system was almost paralyzed, many people were unwilling to accept the role of a creation or invention for fear of the stigma attached to them. 9.3. IPR protection in China Since 1978 In 1978, when China began to open its doors to the outside world in the reform period, IPR protection was a dangerous phrase. Although there is no IPR, all lack of the concept of intellectual property protection was a priority in China's relations with close trading partners. The commercial relations agreement between the U.S. and China in July 1979 was for the implementation of China's IPR protection. Article VI undertakes both sides to apply at least equivalent on trademark, copyright protection and patent provided by the other. In fact, this agreement presents China to reveal laws and regulations in the same legal protection level with U.S. As a result, in the early 1980s, China has designed and adopted a few IPR protection laws. In addition, such laws were not easy to welcome,they faced with difficult questions about the future of Chinese socialism. For example, Advocates of patent law were claiming this attempt will facilitate and promote technology transfer, while opponents were claiming that a patent law would ''be essentially contrary to socialist principles". 530 ‘‘Societal Innovations for Global Growth‘‘, 2012, No. 1(1) ISSN 2335-2450 (online) China continued the reform of IPR, although Law of Trademarks was put into action in 1982 and the Patents Law in 1984, and despite the ideological difficulties, and joined the world intellectual property rights organization (WIPO) in 1980. New laws of private property rights made the government anxious and the reason was socialist principles. For example, with the 1984 Patent Law, inventions belonged to the unit operation rather than individually. Copyright protection remained behind of the protection for patents and trademarks, perhaps industrial property has been considered more necessary commercially. Ultimately, the copyright law enacted in 1990. Despite the efforts to establish a structure for the protection of IPR, tension increased in the United States, the U.S. impatience has grown to the reforms at a slower pace. When their impatiance reached the breaking point, the U.S. took action in a hard way. Under the U.S. Trade Act of 1974, the content of section 301 has been referred to ''the H-bomb of the trade policy'' Special 301 application says in basic that U.S. Trade Representative (USTR) has to define the country and investigate and implement sanctions in case of inadequate intellectual property protection. Under the threat of a great sanction based on Section 301, China has missed an absolute trade war accepting the Agreement on the Protection of Intellectual Property in January 1992. China, with the compliance with this agreement, accepted the patent law in 1992, the law of trademarks in 1993, and the unfair competition law in 1993 to keep the trade secrets. Although creating a comprehensive framework for1992 MOU intellectual property protection, tensions with the United States climbed again in 1994, and both sides threatened each other with large commercial sanctions.As a result, China and the U.S. reached a second agreement in 1995. This especially dealt with "Improving the structure of the application".Later, according to the agreement in 1996, China has renewed their commitment for the protection of IPR. In the late 1990s, "compelling one-sided policy" of 531 ‘‘Societal Innovations for Global Growth‘‘, 2012, No. 1(1) ISSN 2335-2450 (online) the United States have severely been criticized. The cycle of threat of sanctions and contract negotiations caused hostility among Chinese people and a loss of credibility for the United States. Therefore, an alternative mechanism was required to reform the initiator and feeding intellectual property rights. Such a mechanism could merge under the umbrella of the World Trade Organization. In terms of the parties, without resentment, a sustainable and reliable alternative may be offered by the WTO. In order to comply with the substantial obligations associated with WTO entry, China undertook a massive overhaul of its intellectual property laws beginning in 1999, before official accession. During the period 19992002, many laws and regulations were considerably amended, while others were introduced for the first time. To illustrate this huge legislative effort, a selection of the major laws and regulations passed during this term are outlined in Table 1 below. In addition to the main period of legislative revision from 1999-2002, the process of review and modification is still continuing in China. According to the 11 State Intellectual Property Office (SIPO), in 2003, “a total of 26 regulations and documents, which were not in accordance with the rules of WTO, were revised or cancelled.”21 In order to analyse this plethora of changes, key areas will be emphasised that were subject to the most criticism prior to the recent reforms. Changes in these areas will be identified and taken as an indicator of China’s overall compliance with its WTO/TRIPS commitments. 532 ‘‘Societal Innovations for Global Growth‘‘, 2012, No. 1(1) ISSN 2335-2450 (online) Table 1. Laws, regulations and rules amended or passed to comply with TRIPS requirements. Copyright Law Implementing Regulations of the Copyright Law Decisions on Safeguarding of Security on the Internet Regulations on Computer Software Protection Regulations on Publications Regulations on Motion Pictures Regulations on Sound and Video Recordings Patent Law Patent Examination Guidelines Layout-Designs of Integrated Circuits Protection Regulations (IC Regulations) Implementing Rules of the IC Regulations Regulations on Administration of Imports or Exports of Technologies Rules on Registration of Technology Import or Export Contracts Rules on Technologies prohibited or restricted from importation Rules on Technologies prohibited or restricted from exportation Trademark Law Implementing Regulations of the Trademark Law Trademark Examination Guidelines Amended and came into effect 27 th October 2001 Came into force on September 15 th 2002 Adopted 28 th December 2000 Amended and came into effect 1 st January 2002 Came into effect 1 st February 2002 Came into effect 1 st February 2002 Came into effect 1 st February 2002 Amended and came into effect 1st July 2001 Republished 1st July 2001 Came into force on 1 st October 2001 Came into force on 1 st October 2001 1 Ekim 2001de Yürürlüğe Girdi Came into force on 1 st January 2002 Came into force on 1 st January 2002 Came into force on 1 st January 2002 Amended and came into effect 1 st December 2001 Came into force on 15 th September 2002 Revised 17 th October 2002 Result China, despite international pressure, began slowly to protect the intellectual property rights. As a whole concept, intellectual property was largely unknown in the most of the twentieth century in China. With China's beginning reforms in 1978, intense demands coming from West to China in order to protect intellectual property have rapidly emerged. After 25 years in the past, in the past 25 years, China made a notable progress for a comprehensive system of intellectual property protection. 533 ‘‘Societal Innovations for Global Growth‘‘, 2012, No. 1(1) ISSN 2335-2450 (online) This structure was created by the encouragement of U.S. applying severe trade sanctions in 1990s. But ultimately it seemed that this compelling approach was unsustainable; it was useless to force trade sanctions with threats, and China knew that the provision of these trade sanctions in retaliation would harm the United States equally. Thus, accession to the WTO, presented a new approach to promoting reform in China and it represented a new challenge for law reform. Accession to WTO required new laws and important fixes in the existing legislation. How a challenge did China face with? China has undertaken a comprehensive legal review started in 1999, which continues to this day, to ensure compliance with TRIPS obligations. China made legal arrangements effectively in accordance with TRIPS or the things they need in five key areas critical of WTO as a priority (technology transfer, the well-known trademarks, geographical indications, integrated circuits layout design, and penalties). In fact, since the involvement, general assessment is ; it is successful that China greatly changed the laws of their own intellectual property to comply with the TRIPS agreement and the laws of the most important areas in terms of international norms. However, the fast reform steps in the last few years have not been without problems. Two cases, examined in the previous section, show that China has different problems in intellectual property law and its implementation. In the case of Toyota, the statements on specific legislation rules are uncertain. Uncertainty over the correct test to apply can lead to inconsistencies in practice, therefore, it may be required to explain the main provisions of the laws and regulations already in secondary legislation. The case of Yamaha is one of the successfull intellectual property lawsuits and it highlihts the issue of compensation. Violation of TRIPS Article 45 (1) indicates that the damage subjected to loss is ''adequate to compensate for the damage suffered by the right holder''. Therefore, despite satisfying the laws of China, the implementation of these 534 ‘‘Societal Innovations for Global Growth‘‘, 2012, No. 1(1) ISSN 2335-2450 (online) rights is far from being perfect. Both in terms of administrative or criminal, application was ineffective and IPR violations could not be prevented. China still requires to develop implementation mechanisms of IPR. Subsequent investigations guarantee that the contributing or removing factors for intellectual property rights implementation will be revealed. As a result, the answer of the question - Is china compatible or disobedient in complying the regulations of WTO / TRIPS - is compatible. However, despite the efforts of China problems still continued in the field of implementation. Just as China is a member of WTO since 2001, it is hoped that this's teething problems will be resolved within the next few years and a comprehensive system of intellectual property protection will emerge. References İstanbul Bilgi Üniversitesi Fikri Mülkiyet Hukuku Araştırma ve Uygulama Merkezi, Fikri Mülkiyet Hukuku, http://bilfim.bilgi.edu.tr. Gemrik, S., (2008). Fikri Mülkiyet Hakları Bağlamında Korsan Yayıncılığın Ekonomi Politiği, T.C. Süleyman Demirel Üniversitesi Sosyal Bilimler Enstitüsü Maliye Anabilim Dalı, Yüksek Lisans Tezi, Isparta. Suluk, C.,(2004), Telif Hakları ve Korsanlıkla Mücadele, Hayat Yayıncılık, İstanbul. Tekinalp, Ü., (1999), Fikri Mülkiyet Hukuku, Beta Yayınları, İstanbul.. Tekinalp, Ü., (2011), T.C. Kültür ve Turizm Bakanlığı, Fikir ve sanat Eserleri Hukukunun Dünyada ve Türkiye’de Gelişim Süreci, http://www.kultur.gov.tr. (referred on 11 December 2011). T.C. Kültür ve Turizm Bakanlığı Telif Hakları ve Sinema Genel Müdürlüğü, Korsanlık Çeşitleri, http://www.telifhaklari.gov.tr/BelgeGoster.aspx. (referred on 11 December 2011). Taş, S., (2006), Fikri ve Sınai Mülkiyet Alanındaki Sorunlar, Gelişmeler ve Türkiye-AB İlişkileri Açısından Bir Değerlendirme, Selçuk Üniversitesi Karaman İ.İ.B.F. Dergisi, Sayı: 10, Yıl: 9. TÜSİAD, (1995), 2000’li Yıllara Doğru Yeni Ekonomik Süper Güç Çin. (WIPO), Dünya Fikri Haklar Organizasyonu -World intellectual Property Organization http://www.wipo.int, (referred on 11 December 2011). ASO, (2010), Avrupa birliği uygulamaları çerçevesinde FMH kılavuzu, www.aso.org.tr/kurumsal/media/kaynak/TUR/.../IPRGuideTurkce.pdf.(referred on 11 December 2011). Hanel, P., (2006), “Intellectual property rights business management practices: A survey of the literature”, www.sciencedirect.com, (referred on 11 December 2011). T.C. Kültür ve Turizm Bakanlığı, Fikir ve Sanat Eserleri Hukukunun Dünyada ve Türkiye’de Gelişim Süreci, <http://www.kultur.gov.tr. (referred on 11 December 2011). 535 ‘‘Societal Innovations for Global Growth‘‘, 2012, No. 1(1) ISSN 2335-2450 (online) Soyak, A., (2010), Fikri ve Sınaî Mülkiyet Haklarında Küresel Düzenlemeler: Kim İçin, Ne İçin? Ulus gazetesi, http://alkansoyak-ulusgazetesi-yazilari.com/2010/04/fikri-ve-snai-mulkiyet-haklarnda.html (referred on 11 December 2011). Thomas, K., (2004), Changes to Intellectual Property Law in China Since WTO Entry: Compliance or Defiance?, Durham East Asian Papers Series, No. 19, pp. 97-115. 536 ‘‘Societal Innovations for Global Growth‘‘, 2012, No. 1(1) ISSN 2335-2450 (online) THE CRISIS AND ECONOMIC RECOVERY IN BALTIC COUNTRIES AT CLOSE RANGE Prof. dr. Gediminas Macys Department of Economics Faculty of Economics and Financial Management Mykolas Romeris University Ateities g. 20, LT-08303 Vilnius, Lithuania E-mail: [email protected] Member of Global Science and Technology Forum, Anson str. 10, Int. Plaza, Singapore-079903, www.GlobalSTF.org Abstract The paper analyses the crisis and recovery in three Baltic countries, Estonia, Latvia and Lithuania. Using macroeconomic data for the three countries over a 12-year period, 2005-2011, the paper examines the factors leading to- and out the crisis, the policy responses to the crisis, an evaluation of their recovery and the lessons that can be learned. Three years after the 2009 recession, the global recovery is faltering. The present analysis undoubtedly shows that Estonia has passed the crisis due to excellent readiness with least losses, and it was valued at the admission to the EU Euro countries union. What about other two countries? They have passed the crisis with huge losses. The policymakers in all three countries are under pressure to act. What aftercrisis policy strategies are under choice judging at a long-term perspective? The first and most obvious lesson is that a vulnerability of economy should be avoided. The recession conditions contribute to the economic restructuring through stimulating the business churn, the entry and exit of firms, and by motivating the incumbent firms to adapt products and business processes. The dynamic, innovative new businesses have an important role to play in leading the economy out of recession. 537 ‘‘Societal Innovations for Global Growth‘‘, 2012, No. 1(1) ISSN 2335-2450 (online) The restructuring of banking sector, aimed at the sound balance sheets, the better risk management and increased transparency, is also of the essence of after crisis lessons. The economic recovery and growth beyond the current period of large-scale deficit spending by governments will require an increase in household consumption especially in Lithuania. The Governments have to be watchful about the build-up of leveraged debt financing. The paper concludes with an outline of key lessons for policy makers from the experience of the three countries. Keywords: crisis in Baltic countries, recovery of economies, evaluation of recovery, public policy responses to the crisis. 1. Introduction The world entered the worst financial crisis in autumn 2008 and the most severe economic downturn since the end of the Second World War. The financial market conditions have improved, an economic growth has resumed in most countries since spring 2009, albeit very moderately in many advanced economies. These improvements have largely resulted from the massive support measures taken by governments and central banks in Western European and North America countries. However, what situation is in small countries like the Baltic countries – Estonia, Latvia and Lithuania? Market economies have historically been prone to fluctuations - booms and slumps - in aggregate activity over time. Analysts claim to have detected a pattern in these fluctuations, referring to changes in economic activity in terms of an economic cycle or as long waves of capitalist development. These fluctuations, or long waves, were brought to international attention by Kondratiev in the mid-1920’s (Kondratieff, 1926). Investigating international data on prices from the late-18th century through to the start of the 20th, Kondratiev identified three phases of the economic cycle expansion, stagnation and recession – each complete cycle taking approximately 50 years. At that time, Kondratiev claimed to have identified three cycles. Economists have subsequently claimed to detect a fourth and a fifth ‘Kondratiev wave’ based around oil, cars and mass production, and information and communications technologies respectively (Roubini, Alesina, Cohen, 1997). Although many analysts accept that economic fluctuations occur, there is less agreement as to their causes. Some attribute fluctuations to the bunching of innovations; others link the fluctuations to the collapse of aggregate demand, itself due to declining investment and ‘animal spirits’ among businesspeople. Yet others view the recurrent upswings and downturns as an inherent feature of the market system rather than as a consequence of shocks such as new innovations. Under the latter view, market 538 ‘‘Societal Innovations for Global Growth‘‘, 2012, No. 1(1) ISSN 2335-2450 (online) economies are perceived as prone to over-accumulation as a firms’ pursuit of profit encourages continued investment until a situation of over-capacity is created, with too many goods and services produced relative to the level of aggregate demand. Overcapacity ultimately leads to a crisis of declining profitability, business failure, rising unemployment, and declining consumption – a “consumption crisis” (Keeley, Love, 2010; Anastasakis, Bastian, Watson, 2011). Access to credit can support consumption for a period of time, but not indefinitely. If credit becomes restricted, or consumers become unable to service their debt, then consumption is likely to decline with consequences for GDP and other macroeconomic indicators. The rational to investigate the economic cycles at different countries is clear and present. When it comes to analyzing the long-term impacts of the crisis on economic development, very simple and highly sophisticated approaches have been presented as well. A simplest hypothesis is based on the expectation that the crisis will only interrupt the development trends, and some years later the trajectories of economic development will bounce back to the old trend lines. The retrenchment scenarios construct a contrasting picture, which assumes a break of trends in the economic development process and a further decline of growth rates compared with the old trends (Rothengatter, et al., 2011). Putting both impacts together, the breakdown during the crisis and the reduced growth rates later lead to a very pessimistic vision for economic development – while the chances of achieving environmental goals seem to improve. It is obvious that the real development will lie somewhere in between the optimistic and pessimistic scenarios. These remarks unquestionably denote the practical importance of present research, only a detailed discussion on the state and policies during pre-crisis period can give a clear qualification of economic recovery strategies. The innovation of present research effort consists of using macroeconomic data for the three countries over a 12-year period, 2005-2011, and examined from a new perspective, incorporating parallel and rarely interacting strands of literature on global and local crises, political and economic means of recovery. The paper examines also the factors leading to the crisis, the policy responses to the crisis, an evaluation of their recovery and the lessons that can be learned. The objective of present research is to provide the statistical data of pre- and after crisis setting in Baltic countries, and present from the experience of the three small countries the key lessons for policy makers. The paper is structured as follows: the second section provides the crisis in Baltic States. The third section describes the economic recovery in these countries, the fourth 539 ‘‘Societal Innovations for Global Growth‘‘, 2012, No. 1(1) ISSN 2335-2450 (online) section – the lessons learned from the crisis, the fifth section concludes with a discussion and suggestions for further research. 2. Crisis in Baltic Countries The three Baltic States are usually presented as one region. The natural, historic, political and socio-economic development of - and business environment in these countries are analogous thereabout. The annual changes of national GDP can provide a rough perception of different paths to - and after the crisis: 15.00% 10.00 5.00 Lithuania 0.00 2005 2006 -5.00 2007 2008 2009 2010 2011 Latvia Estonia -10.00 -15.00 -20.00 Source: Eurostat data. Figure 1. The national GDP variations in 2005-2011. The economies of three Baltic States have been growing successfully up to 2007, though the different rates of economic growth have also became clear at the early beginning of financial crisis of 2008 (Fig. 1). An economy of Lithuania has begun to decay almost one year later but retained, nevertheless, the positive rate of economic growth at the 2.9% level by contraries to the negative rates in Latvia (-3.3%) and Estonia (-3.7%). It means that an economic cycle in Lithuania is running behind in a decade of months as compared with the Latvian and Estonian cycles. The crisis has touched bitterly the Baltic States economies. They have begun to shrink together, and the largest 17.7% decline of economy has been noticed in 2009 in Latvia. The reasons of economic recession were the same in all Baltic countries: the reduced internal consumption due to the reduced incomes of population and fast 540 ‘‘Societal Innovations for Global Growth‘‘, 2012, No. 1(1) ISSN 2335-2450 (online) growing unemployment. The reduced foreign and internal investments, public expenditures and bank credits have become also the important negative factors of economic recessions too (Fig. 2). The deteriorative expectations of consumers have worsened furthermore the internal consumption in Baltic countries. The different scenarios of economic recovery after the crisis have been chosen too (Eurostat, 2012). It is interesting to notice that the economies of Lithuania and Estonia have started to unbend earlier than an economy of Latvia. The rates of GDP growth in 2010 were in Lithuania (1.4%), Estonia (2.3%) and conversely in Latvia (-0.3%). On the contrary, the stable means of EU structural support funds were the positive factors in these countries. These means have substituted the substantially vanishing means of direct investments in Latvia and Lithuania (Fig. 2). 25 % 20 15 Lithuania 10 Latvia Estonia 5 0 2005 2006 2007 2008 2009 2010 Source: Eurostat data. Figure 2. The foreign direct investments as a share of national GDP in 2005-2010. According the founder of the economic theory of evolution - J.A. Schumpeter, a crisis fosters structural changes, which are necessary to guide the economy to a new phase of growth, stimulated by new products and new production processes (Totir, Dragota, 2011). The state can foster this process by investing in research and development, supporting the implementation of new technology and by public investment in the necessary infrastructure. The structural support means of EU are performing that role in Baltic countries but it is exceptionally essential to complement them by the private investments. It is even more vital for developing countries like the Baltic countries. The foreign direct investments play the important roles in the business development through the new phases of grow (Purfield, Rosenberg, 2010). 541 ‘‘Societal Innovations for Global Growth‘‘, 2012, No. 1(1) ISSN 2335-2450 (online) The clear increment of FDI can be noticed after the adhesion into the EU in all three Baltic countries. The FDI flows to Estonia are even large. The FDI in Estonia have even considerably grown to 9.6% level though the crisis nearly interrupted these flows to the level of 0.2% in Lithuania and 0.4% - in Latvia. The FDI flows have grown in 2010 due to the means of EU structural funds and the expanded capitals in the biggest commercial banks of Baltic countries that are the branches of Scandinavian commercial banks. The sale of Eurobonds in Lithuania has given a positive push too. The good business environment, numerous Scandinavian companies and the pending adhesion into the Euro countries club gave a strong push to FDI flow in Estonia. These flows secured and gave a clear support to the fast economic recovery in Estonia. The strongest process of economic recovery has begun in Estonia due to handling of special fund stores and regaining in short time the past volumes of export, predominantly in the markets in Finland. The growth of Estonian FDUI has reached the 7.6% level in 2011, whereas the annual rates of FDI growth were accordingly less in Lithuania (5.9%) and Latvia (5.5%). These two indexes above clarify the path of economic development. A decline of unemployment rate clarifies the efficiency of economic recovery means. The similar path of unemployment rate can be observed in all three Baltic countries, and a substantial jump of unemployment rate due to turmoil of the crisis can be noticed also in all three countries (Fig. 3). The economic leader is obviously Estonia where an unemployment rate is usually less than in other two countries. 20% 15 Lithuania 10 Latvia Estonia 5 0 2005 2006 Source: Eurostat data. 2007 2008 2009 2010 2011 Figure 3. An unemployment in 2005-2011. 542 ‘‘Societal Innovations for Global Growth‘‘, 2012, No. 1(1) ISSN 2335-2450 (online) The unemployment rate in Lithuania has reached the ultimate 17.8% level in 2010 and came to lessen. The more detailed analysis shows that the largest jump of unemployment was observed between young people of 15-25 years old; at that point the unemployment rate of other age groups varies little (Macys, 2012b). What are the reasons of that unprecedented expansion? Despite of the long-term process of higheducation reforms the large part of high-school graduates are still becoming every year the youngest clients of local labour exchange offices due to their clear lack of professional experiences and competences. On other side, the largest part of Lithuanian entrepreneurs and business managers are still under the stress of budget and markets shortages due to the past crisis, and they have no possibilities to undertake the own training courses. As a consequence the rate of unemployment of young Lithuanian people reaches now a high level of 35.1% (Lubinaite, 2012). The unemployment is close related with the national at-risk-of-poverty-rate (RPR). If some of unemployed people cannot quite a long time to find the workplaces, the own savings can quite fast issue in and the people or families can very fast descend under a poverty level. According our previous research, the RPR varies in Lithuania quite little from 2005 to 2010 (Macys, 2012b). The highest RPR of two groups - of children and working people of 25-49 years old - is coming to notice, and that high-risk trend continues to grow. The main constraints are familiar in Lithuania and Eastern Europe as well: the shortage of working age people, the lesser wages and lower educational background in the rural areas. The weak social infrastructure does not meet the expectations of young people in rural areas too. The trends of the development of working people market remain the same, tough it has been passed 13 years and the crisis on 2009-2010 (Cross-country study, 2010). Due to reviving economies the unemployment level has started to lessen in Baltic countries: it reached 15.4% in Lithuania, 15.6% - in Latvia and 12.5% in Estonia (Fig. 3). The dynamics of unemployment rate is quite similar, though it usually was higher in Latvia. The average inflation index is other index of Government policies efficiency. This index has continuously grown excluding the turmoil of incoming crisis of 2009 (Fig. 4). The reasons of inflation slump in all three Baltic countries were the considerable reduction of consumption expenses inside the countries and the depressed world prices for the exporters. 543 ‘‘Societal Innovations for Global Growth‘‘, 2012, No. 1(1) ISSN 2335-2450 (online) 20 % 15 Lithuania 10 Latvia 5 Estonia 0 2005 2006 -5 Source: Eurostat data. 2007 2008 2009 2010 2011 Figure 4. An inflation in 2005-2011. The economic recovery has repaired the downturn of past crisis and has shifted into the conventional level of inflation for Baltic countries, though the Latvia as Lithuania as well show the stern resolution to keep the inflation rate at low level. The question is, how long? The cutting the deficit of the public expenditures of state budget is the next index of successful economic recovery after the crisis in developing countries. The ponderous bureaucratic apparatus was always a painful burden of national budget in Baltic countries except the Estonia. During the period of wholesome economic development the Latvia and Lithuania have shaped the losing budget with a small negative deficit, and at the beginning of crisis their Governments have been not able to retain the constrained low level of budget deficit and started to go down (Fig. 5). 4% 2 0 2005 2006 -2 -4 -6 -8 -10 -12 Source: Eurostat data. 2007 2008 2009 2010 Lithuania Latvia Estonia Figure 5. The national budget deficit as a share of national GDP in 2005-2010. 544 ‘‘Societal Innovations for Global Growth‘‘, 2012, No. 1(1) ISSN 2335-2450 (online) Estonia has declared the setting-up principle of national budget to keep the surplus national budget, and their efforts were successful except a couple of years during the turmoil of crisis. The European Commission has noticed these efforts and proposed to admit Estonia to the Euro countries union. Estonia has become the 17th member of Euro union on the 1st of Jan. 2011. Despite the fact that Estonia is smallest country as compared with two other Baltic countries, the Estonian financial policy really was most successful. The last statement would be clearer if we could take under analysis the public sector debt of Baltic States. Certainly, the public sector debt was diminishing before the crisis in all Baltic States though Estonia is a clear leader (Fig. 6). 50 % 45 40 35 30 25 20 15 10 5 0 Lithuania Latvia Estonia 2005 2006 2007 2008 2009 2010 Source: Eurostat data Figure 6. The public sector debt as a share of national GDP in 2005-2010. The situation worsened heavily during the crisis. The largest Latvian debt has reached a level of 44.7% of national GDP due to the nationalisation of local commercial bank “Parex” in 2008. The situation in financial markets has become so tight that the IMF and EU have committed to Latvia the credit of Bill. Euro 7.5 (Nanto, 2009). Latvia has undertaken to reduce the public sector deficit, to pursue the structural reforms and other means. Meanwhile, Estonia has saved up a special fund for crisis long before the crisis and the public sector deficit was 6.7% of national GDP in 2010. It can be noticed 545 ‘‘Societal Innovations for Global Growth‘‘, 2012, No. 1(1) ISSN 2335-2450 (online) that Estonia has passed the crisis without the hard consequences. So, what is a story of economic recovery after crisis? 3. Economic Recovery The statistics presented above and other data decisively show that Estonia has passed the crisis without considerable shock. The consequences of crisis were most complicated in Latvia. The most negative consequence of crisis in Lithuania still is a large national budget deficit. The large Lithuanian commercial banks reside in Scandinavian banks that have clearly conducted the aggressive policies in Lithuania to distribute a lot of real estate credits especially to young working families. These families were mostly the graduates of national and foreign universities and used to serve in large firms or Government institutions. These flows of cheap credits gave a strong boost to building industry at precrisis time, i.e. created a real estate bubble like to some extent the analogous bubble in the USA (Buzgalin, Kolganov, 2009). Unfortunately, the turmoil of crisis has to a large extent destroyed this prosperous situation – the companies have been constrained to cut their expenditures by standing off often a lot of people including these before prosperous families. A lot of poor people especially at working age, a lot of hardly acting companies and diminishable wages, the huge hopeless credit portfolios and diminishable crediting capacities of banks were the main reasons of drastic decline in internal consumer market in Lithuania. It caused a GDP downturn of 14.8% in 2009 and a marginal increase of 1.4% in next year. A missing crisis fund caused unprecedented public debt too. These factors caused a mentioned before GDP downturn. Certainly, the Lithuanian business has also been confronted with diminishing export markets due the crisis in the rest of world. However, the export flows in Lithuania have been reduced at Billions Euro 4.3 in 2009 by comparison to 2008. It would cause only 2-3% of economic shrinkage. The largest part of economic decline is caused by the incompetent policies of the Government and Central Bank of Lithuania up to 2008. The means of economic recovery were similar in all three Baltic countries. The taxes as VAT, excise duties and other have been raised; the tax concessions have been defeated in all three countries. However, the results were different – the public incomes as a share of GDP have grown on 6.7% during 2009 in Estonia, only 0.4% - in Lithuania, and they have shrunk on 0.2% in Latvia. The more conscious culture and more flexible system of taxation, the bigger trust of people in Government institutions have caused the higher public incomes in Estonia. 546 ‘‘Societal Innovations for Global Growth‘‘, 2012, No. 1(1) ISSN 2335-2450 (online) As mentioned before, the Government of Estonia has started the counter crisis means at the beginning of 2008, and Lithuania and Latvia – at the end of 2008. The opinions of population were rigorous: the 12% of Lithuanian people assessed positively according the EU survey (Stark, 2010) the counter crisis programme of Government, the 11% - in Latvia and 40% - Estonia. Thus the protest demonstrations have entered in Latvia and Lithuania, and no protests in Estonia. What lessons can be taken from the crisis? 4. Lessons from the Crisis A pre-crisis economic growth could alleviate fiscal strains to some extent, by reducing the size of existing debt relative to the size of the economy and by improving the annual budgets including the creation of pre-crisis special fund. This underlines the importance of increasing the Baltic economies’ growth potential. It is therefore crucial to accelerate structural reforms that will reinforce sustainable growth and job creation. Policies that enhance competition and innovation are urgently needed to speed up restructuring and investment, and to create new business opportunities. Increased labour market flexibility is required to create employment and restore competitiveness (Macys, 2011a). Restructuring of the banking sector, aimed at sound balance sheets, better risk management and increased transparency, is also of the essence. The economic recovery and growth beyond the current period of large-scale deficit spending by governments will require an increase in household consumption especially in Lithuania. Sustained recovery and growth require that this be based on rising real earnings, and not on rising debt (Tropeano, 2011). In general terms, the literature identifies three broad categories of strategy in recession conditions: retrenchment, investment, and “ambidextrous” strategies (Totir, Dragota, 2011). Retrenchment strategies involve cutting operating costs and divestment of noncore assets. These appear to be the most common approaches adopted by businesses to deal with recession conditions, especially in the short-term. It is clear from the text above that the divestments of businesses, closures of establishments, reductions in employment; expenditure cuts on a wide range of activities including R&D, marketing and employee training have been put into practice in all three Baltic countries. Investment strategies involve expenditure on innovation and market diversification. Recession is regarded as an opportunity to implement strategic change that would otherwise not have occurred. The evidence on businesses adopting investment strategies to manage through recession, however, is patchy in Baltic 547 ‘‘Societal Innovations for Global Growth‘‘, 2012, No. 1(1) ISSN 2335-2450 (online) countries. Such strategies are risky and many firms are likely to be too preoccupied with short-term survival to think about innovation and growth, or lack the resources to implement such strategies effectively. “Ambidextrous” strategies combine retrenchment and investment. It is likely that most firms adapt under recession conditions through judicious cost/asset-cutting behaviour and through investment in product innovation and market development. Choosing the appropriate investments to make and costs to cut takes on additional importance during recession when market selection pressures are at their most severe. It is obvious that an ambidextrous strategy has been adjusted partially in Estonia. The endless and ineffective quarrels of actual Government with business associations continue to run in Lithuania. The efforts to accomplish an ambidextrous strategy can be noticed in Latvia. 5. Conclusions So, what political lessons can be taken from the experience of Baltic countries? A number of useful lessons can be deduced. The first and most obvious lesson is that vulnerability should be avoided. This means that a Government has to be watchful about the build-up of leveraged debt financing. Beyond a low threshold, the financing of such debt with foreign currency exposures must be avoided. Since the need for debt and external financing arises from the need to grow at any cost, Governments must reorientate growth strategies. A slower but better quality growth strategy makes sense, one that has a better absorption rate of domestic resources and higher added value. For some analysts, recessions are regarded as periods of ‘creative destruction’, during which some businesses and industries decline, often terminally, while new ideas, technologies, products and industries emerge and become the driving forces of subsequent economic activity and growth (Burakovsky, et al., 2009; Roubini, Alesina, Cohen, 1997). Recession conditions contribute to this economic restructuring through stimulating business churn, the entry and exit of firms, and by motivating incumbent firms to adapt products and business processes. The dynamic, innovative new businesses have an important role to play in leading the economy out of recession. Adapting to environmental shocks, including recession, is a capability of business leaders to develop in order to survive. One view argues that, during recession, incumbent firms tend to suffer from organisational inertia, which prevents them from adapting appropriately to environmental shocks. Conversely, the “pit-stop” theory of business behaviour in recession treats firms as more willing to innovate because the 548 ‘‘Societal Innovations for Global Growth‘‘, 2012, No. 1(1) ISSN 2335-2450 (online) opportunity costs of not undertaking such action are lower than during more buoyant times. The governments have the roles in encouraging innovation and being more flexible in the delivery of support. This might involve promoting cross-sector and crossspecialism linkages and dialogues with organisations in order to spark ideas for innovation. Propping-up outmoded business models or industries in structural decline, a process accentuated by recession, may be less desirable than more experimental forms of intervention (Jackson, 2009; Tropeano, 2011). Many studies identify particular adaptations under recession conditions, such as adjustments in marketing, R&D, training, and pricing. They tend not to report, however, whether such changes constitute a fundamental strategic change, for example, as part of a retrenchment or investment strategy, as distinct from an operational change. The further development of the present analysis needs to focus on macro econometric models of economic and financial crisis and suitable economic recovery measures. References Anastasakis, O., Bastian J., Watson M. (eds.), (2011), “From crisis to recovery: sustainable growth in South East Europe”, ed. by, SEESOX, University of Oxford, pp. 109, Jan. 2011. Burakovsky, I. et al. (2009), “Coping with the Effects of International Financial Crisis. Searching for Proper Policy Response”, Problems of Economic Transition, vol. 51, No. 10, pp. 78–96. Buzgalin, A., Kolganov, A. (2009), “The Global Economic Crisis and Scenarios for Post crisis Development”, Problems of Economic Transition, vol. 52, no. 4, pp. 25–4. Cross-country study, (2010), “Economic policy challenges in the Baltic countries”, European Comm., Economic and Financial Affairs: Occasional Papers, No. 58, pp. 106, online http://ec.europa.eu/economy_finance/publications/occasional_paper/2010/pdf/ocp58_en.pdf (Referred July 16, 2012). Jackson, J. K., (2009), “The Financial Crisis: Impact on and Response by the European Union”, Congress. Res. Service, 36 p. online http://fpc.state.gov/documents/organization/127015.pdf (Referred July 18, 2012). Keeley, B., Love P., (2010), “From crisis to recovery: the causes, course and consequences of great recession”, OECD insights, OECD, pp. 147. Kondratieff, N.D., (1926), “Die langen Wellen der Konjunktur. (The long waves of economic dynamics)”, Archiv für Sozialwissenschaft und Sozialpolitik, vol. 56, pp. 573–609. Lubinaite, S., (2012), “Global Financial Crisis Impact on Lithuanian Economy”, Bach. Work, Vilnius: M. Romeris Un., pp. 1 - 93. Macys, G., (2011a), “Do the Networks matter: the dynamic Pattern”, Int. Journal on GSTF Business Rev., vol. 1, No.2, Oct. 2011. Macys, G., (2012b), “Poverty in Lithuania: State and Modelling Premises”, Proc. of Int. Virtual Conf. EIIC, Prague, Czech Rep., pp. 211-218. 549 ‘‘Societal Innovations for Global Growth‘‘, 2012, No. 1(1) ISSN 2335-2450 (online) Nanto, D. K., (2009), “The Global Financial Crisis: Analysis and Policy Implications”, Congress. Res. Service, pp. 155, online http://fpc.state.gov/documents/organization/127296.pdf(Referred July 10, 2012). Purfield, C., Rosenberg, Ch. B., (2010), “Adjustment under a Currency Peg: Estonia, Latvia and Lithuania during the Global Financial Crisis 2008-09”, Int. Monet. Fund: Work. Paper, No. 213, pp. 35., online http://www.imf.org/external/pubs/ft/wp/2010/wp10213.pdf (Referred July 21, 2012). “Real GDP annual change”, (2012), Eurostat data, online http://epp.eurostat.ec.europa.eu/tgm/table.do?tab=table&init=1&plugin=1&language=en&pcode =tsieb020 (Referred July 17, 2012). Roubini, N., Alesina, A., Cohen, G. D., (1997), “Political cycles and the macro economy”. MIT Press, Cambridge, pp. 327. Rothengatter, W. et al. (eds.), (2011), “Transport Moving to Climate Intelligence, Transportation”, Research, Economics and Policy, DOI 10.1007/978-1-4419-7643-7_2, Springer Scie. and Bus. Media, LLC. Stark, J., (2010), “The post-crisis strategy for growth and jobs, and modernisation of the global financial architecture between the Committee on Economic and Monetary Affairs of the European Parliament and national parliaments”, EU Comm., Brussels, 16 March 2010. Totir, F., Dragota, I. M., (2011), “Current Economic and Financial Crisis – New Issues or Returning to the Old Problems? Paradigms, Causes, Effects and Solutions Adopted”, Theor. and Appl. Ec. vol. XVIII, no. 1(554), pp. 129-150, online, http://store.ectap.ro/articole/547.pdf(Referred July 10, 2012). Tropeano, D., (2011), “Financial regulation after the crisis. Where do we stand?”, Int. Journ. of Polit. Ec., vol. 40, No. 2, pp. 45–60. 550 ‘‘Societal Innovations for Global Growth‘‘, 2012, No. 1(1) ISSN 2335-2450 (online) INDEPENDENCE OF THE CENTRAL BANKS Candidate of Economics, Assoc. Prof. Natalia Pogorelenko Banking Department Kharkiv institute of banking of the University of banking of the National bank of Ukraine Peremogy av. 55, 61174, Kharkiv, Ukraine E-mail: [email protected] Roman Pasichnyk, student Kharkiv institute of banking of the University of banking of the National bank of Ukraine Peremogy av. 55, 61174, Kharkiv, Ukraine E- mail: [email protected] ABSTRACT. This paper analyzes question of the central bank's independence, its forms and classification, justifies the benefits of autonomous central bank in the process of stable state economy formation. Speed-up of globalization process, formation of world's economical integrity, changes in nature of ties between national and international economies pushed the problem of national bank's effective functioning and transformation of monetary policy that will provide stable economical growth on non-inflationary basis on the topic of scientific researches. One of the main tasks of central banks is to provide price stability. The importance of these tasks put them to the top of the state economy management system and put great responsibility on them. So, to achieve these goals national banks ought to have the high level of autonomy and to carry out certain institutional reforms in the means of the national bank's functioning. Keywords: national bank, independence, globalization, economical growth. 1. Introduction. In modern terms of Ukrainian socio-economic development, complicated with worldwide financial crisis, the role of the state in the process of economical regulation grows. The role of the central bank as the main market institution of economical regulation and financial stability also became more significant. 551 ‘‘Societal Innovations for Global Growth‘‘, 2012, No. 1(1) ISSN 2335-2450 (online) One of the main tasks of central banks is to provide price stability. The importance of these tasks put them to the top of the state economy management system and put great responsibility on them. So, to achieve these goals national banks ought to have the high level of autonomy and to carry out certain institutional reforms in the means of the national bank's functioning. 1.1 The Task. Central bank plays exceptional role in economical regulation of every country in the world and as the main subject of the monetary sector it must be independent and self-sufficing in its policy. As we can see from numerous scientific researches the question of central bank independence historically was bounded to time of crisis and unstable situations of the monetary relations. Lately, against the background of frequent financial crises numerous central banks around the world began to question their legal status and try to raise the level of their autonomy and independence from the executive authorities. 1.2 Analysis Of Publications. The question of independent central bank is studied by many foreign and Ukrainian scientists. The problem of displaying correlation between the level of independence of the central bank and the effectiveness of its monetary policy is being researched by many specialists and scientists, such as V. Grilli, G. Tabenelly, G. Haan, M. Arnone and many others. 1.3 The Goal The goal of this paper is to systematically study the question of independent central bank as the main condition of successful and effective state monetary policy and the guarantee of strategic development of the national economy. 2. Main Part. The status of the central bank is not only the main element of its development as a financial institution, it’s also has a very important political and economical factor in the formation of market infrastructure. 552 ‘‘Societal Innovations for Global Growth‘‘, 2012, No. 1(1) ISSN 2335-2450 (online) Central banks have combined features of a banking institution and the government authority, so under its legal status we mean its role and place among the other state authorities that are fixed by law. The nature of the relations between the central bank and the state authorities may significantly vary in different countries. Generalizing features of interactions between central bank and the government we can distinguish two macroeconomic models: Model I: The central bank is independent from the government and free in its monetary policy without pressure from the state authorities. The independence is fixed by law. It counts for German Federal Bank, Austrian Central Bank and others. They are totally independent from the government and free to conduct monetary policy. Federal Reserve System of the USA acts as independent agency within the government and its decisions are not bound to ratification by the authorities or the president. Model II: The central bank acts as an agent of a ministry of finance and executes its monetary policy. It’s also possible for a government to interfere in its policy. Government of the United Kingdom has a legal right to give instructions to Bank of England, although there were no such cases during the last years. In France, government had a right to directly conduct monetary policy and the Bank of France was one of the most dependent central banks in the world. Although in 1993 it had became much more independent due to legislative reforms. Total independence by the first model and “dependence” by the second are relative concepts. Absolute independence of a central bank is impossible, because its tactical policy cannot contradict with strategic goals of a state government. Central bank (CB) is a major credit institution of the country and has to cooperate with state authorities that form a national policy to meet the strategic goals of the country and form a stable and strong economy. Worth to note, that the independence does not mean that a central bank is not responsible for his actions before the authorities. In fact, this conception is much deeper and represents banks’ autonomy in questions of self-management and its ability to function without intervention from the outside. Foreign economists distinguish several features that define the degree of CB independence: Guarantees of autonomy and non-interference, that are fixed by law The legal definitions of the goals of the central banks functioning The order of assignment and dismissal of the high authorities of a bank, terms of assignment 553 ‘‘Societal Innovations for Global Growth‘‘, 2012, No. 1(1) ISSN 2335-2450 (online) Presence or absence of government officials in banks council The set of economical instruments that are available for a bank The simplicity of a procedure that changes these features by the government So, it is possible to define two aspects of CB independence – political and economical Political independence is determined by a procedure of assignment of banks authorities and the terms of their credentials. In most countries the procedure of assignment calls for the system of counterweights. First, the terms of CB authorities’ credentials outreach the terms of the government and the legislative officials. Second, the procedure of anticipatory withdrawal of the central banks’ administration is more complicated. In most of the advanced countries CB administration is chosen from the list of candidates that are proposed by the state government. Worth to mention, that their terms are higher than the terms of state officials – 14 years in USA, 8 years in Germany and 7 years in Canada. Moreover, in some countries like Belgium, Netherlands and Denmark the procedure of anticipatory CB administration withdrawal is complicated and in USA, Great Britain and Germany it is impossible. In countries like France, Greece and Italy administration could be dismissed by the state government at any time. Economical independence is reflected in the level of control of the economical instruments that bank possess and absence of duty to automatically provide credits to a government. The central banks of countries with no limitations on crediting government are more dependent than the others. In this case the level of independence depends on the possibility to credit the state budget only to increase money mass. Direct legislative limitation of crediting the government is more effective and is used in some developed countries such as Japan or France. The main goal of any central bank is to provide stability to a national currency and monetary sphere of a state. The global experience shows that reaching these goals directly depends on the degree of political and economical independence of the central banks. The fact is, that the government usually cares mostly about reaching short-term goals, for example it can act against strategic goals of a state before elections. It this case CB usually acts as a counterweight to the government. It is clear that it is impossible to adequately measure the degree of independence, but the research conducted in the middle of XX century shows us that the greatest success in stability of a currency and state economy were made by countries with the most independent and autonomous central banks. 554 ‘‘Societal Innovations for Global Growth‘‘, 2012, No. 1(1) ISSN 2335-2450 (online) Figure 1. Index of Central Bank Independence and it’s correlation with Average Inflation. As the modern researches show, significant changes in the functioning of central banks are made nowadays all around the world. Only in the 90s 34 countries conducted legal actions to increase independence level of their central banks. A number of studies justify the relevance of increasing CB autonomy. There is a negative correlation between independence level and the inflation rate on the long-term period. The low inflation rates will usually be observed in the countries with independent central bank but not in the countries with strict control of a CB. We can also see a negative correlation between the independence level and the level of budget gap. The countries with an independent CB usually have low rate of budget deficit. There is no correlation between independent status of a central bank and economical growth dynamics. In other words, production and employment rates in midand long-terms are not affected by giving CB a high level of independence. 555 ‘‘Societal Innovations for Global Growth‘‘, 2012, No. 1(1) ISSN 2335-2450 (online) In the same time the process of making decisions in the monetary sphere must be efficient and democratic, so the central bank must be responsible for its actions. Goals and the policy of CB must be fixed by law and be clear for the society. Although there are some scientists that follow opposite view on this question. The main proofs against giving CB greater degree of independence base mostly on politic arguments, not on the economical ones. The first argument is based on undemocratic nature of giving the group of nonelected officials the full control of monetary system. In this case we must separate concepts of CB independence and his duty to answer for its policy. As mentioned above, even the most independent central banks are answering for their actions before legal authorities of the state, that could adjust the laws that regulate CB functioning. The second argument against is that independent central bank could not effectively coordinate fiscal and monetary policy, but experience shows that independent CB reaches this goals in long-term period. The progress in the sphere of CB status researches is always useful and helpful, but I think that formation of every institute of a country must be first of all justified by the particular nations’ specialties, and only then – on the successful experience of the other countries. Saving the national features in its policy in many countries, a central bank is still the highest authority that regulates cash and non-cash money circulation. It can realize its goals only by confirming his legal status of an independent institution. Every branch of the state government must count with CB legitimacy of its actions in the monetary sphere that is provided by a Constitutional law of guiding the bank’s policy on reaching stability of a national currency. On the other hand, CB must not be isolated from all the other subjects of economical policy, should be somehow limited by laws and answer for its actions. Independent status of a central bank has to provide effective cooperation with the state authorities. Today, Ukraine needs to take some regulatory laws that determine overall principles of interactions between the institutes in monetary sphere. It has to serve the goals of improvement of integration and democratic processes in the country. References Bugay, D.V. (2003) “Analysis of legal support for political independence of the National Bank of Ukraine” Geets, V.M. (2006) “Independence of the central bank is a guarantee if stability”, Uryadovy Kur’er #92 556 ‘‘Societal Innovations for Global Growth‘‘, 2012, No. 1(1) ISSN 2335-2450 (online) Stepanenko, A.I. (2010) “Independence of a central bank as the main factor of its activity” Petrik, O.I., Melnik K.K. (2009) “Independence of a central bank as the crucial precondition for realising successful regime of inflation targeting” Zaparnyuk, T.V. (2012) “Central bank as the main market institute of macroeconomic regulation” Kozyuk, V.V. (2006) “Central banks in conditions of globalization” Bykhovchenko, V.P. (2009) “Monetary policy and financial stability” “The government and the National Bank: in search of joint strategy”, Dzerkalo Tyzhnya (2009) 557 ‘‘Societal Innovations for Global Growth‘‘, 2012, No. 1(1) ISSN 2335-2450 (online) TOWARDS INNOVATION-BASED ECONOMIC DEVELOPMENT: THE CASE OF LATVIA Assoc. Prof. Dr. Elita Jermolajeva PhD Stud. Viktorija Šipilova Department of Economics Faculty of Social Sciences Daugavpils University Parādes 1, LV-5401, Daugavpils, Latvia E-mail: [email protected] Institute for Social Investigations Faculty of Social Sciences Daugavpils University Parādes 1, LV-5401, Daugavpils, Latvia E- mail: [email protected] Abstract The article describes the original empirical research; with aim evaluate process of forming innovation-based economic development in Latvia. Theoretical and empirical research results that reveal the importance of innovation in economic development is the foundation for a strategy „Europe 2020“. But unconditionally perceiving of innovation as a key to success is not rational, as evidenced by the European Union‘s experience. Innovation provides benefits such as: 1) countries with higher Innovation Index has a higher standard of living; 2) branches which have higher financial investments in R&D have higher number of registered patents; 3) in European Union in 2009 branch, which had the highest investments in R&D was the only one in which exports exceeded imports and it was the „Machinery and transport ecquipment“; but also provide threats: 1) during global economic downturn GDP growth over the previous period was expressed by a negative value, not only in countries with weak innovation system, but also in countries with the most successful performance in innovations; 2) impact of innovations on branches during economic growth and downturn is different, and therefore different is effect on the economy as a whole, on what is indicated by dynamics of value added and employment into branches – the biggest reduction of value added, as well as the biggest amount of people, who lost their job were in innovative branches; 3) reliance on a single innovative branch can lead to negative consequences (for example, Nokia in Finland). 558 ‘‘Societal Innovations for Global Growth‘‘, 2012, No. 1(1) ISSN 2335-2450 (online) Sustainable growth is an urgent problem in many countries worldwide, but particularly Latvia should solve this, where after one of the fastest growth of GDP was followed even more severe reduction of GDP. After consistent and well-timed reaction to the global economic downturn Latvia proved itself as a country whose achievements are welcoming in international economic area. After overcoming the most difficult period of economic downturn, Latvia is in front of new road, where one of the main directions is forming of knowledge-based (innovative) economy. In National Development Plan of Latvia 2014-2020 is determined - to become one of leaders in European Union in spread of innovative and export oriented enterprises. Taking into account experience of European Union, it is appropriate to evaluate opportunities and threats of innovations for sustainable economic development in Latvia, searching for answers to questions: 1) does Latvia has sufficient resources to take advantage of the opportunities provided by innovation; 2) does Latvia has sufficient resources to mitigate, prevent threats posed by innovations. Research findings show, that creation of Latvian innovation-based economy is still ongoing, as well as available statistical information suggests that the Latvian hightechnology and knowledge-intensive branches have the potential, but at the moment predominance, as well as the success of innovation is in low- and medium-technology branches („Export and Innovation Award“). Keywords: innovation-based economic development, innovative branches, structural changes, resources, Latvia. 1. Introduction Emphasis in the economic development should be done on high-technology and knowledge-intensive branches, what is defined in strategy “Europe 2020” (Komisijas paziņojums “Eiropa 2020”. Staretēģija gudrai, ilgtspējīgai un integrējošai izaugsmei, 2010). However, rapid technological development and globalization for some countries create a unique opportunity for rapid development, but in others - risk of economic stagnation and even decline. The highest growth rates provide knowledge resources and ability to commercialize them with the highest productivity (Dimza, 2003). Till today the pillars of Latvian economic development are branches with a strong focus on the domestic market and the low level of productivity – retail sale, real estate (Annual detailed enterprise statistics on services (Nace Rev.1.1 H-K), 2012), while in exports are dominated low- and medium-technology branches like woodworking and food processing (Eksports pa svarīgākajām preču sadaļām (milj. eiro), 2012). The latest 559 ‘‘Societal Innovations for Global Growth‘‘, 2012, No. 1(1) ISSN 2335-2450 (online) data on GDP growth indicates that these branches still play significant role and impact on the economy and its development in Latvia (Kopējās pievienotās vērtības sadalījums pa darbības veidiem (NACE 2. red.) pa ceturkšņiem, faktiskajās cenās (procentos no kopapjoma), 2012). Latvian decision to develop an innovation-based economy is the base of the country’s National Development Plan 2014-2020 (Nacionālā Attīstības plāna 2014.-2020. sākotnējā redakcija, 2012), as well as of the National Programme for the strategy “Europe 2020” implementation (Progresa ziņojums par Latvijas nacionālās reformu programmas “Eiropa 2020” stratēgijas kontekstā īstenošanu, 2012). However, despite the decision, implementation and success of the development of innovations in Latvia within European Union (EU) is found to be modest - the last place among the EU Member States (Innovation Union Scoreboard, 2011). Structural changes in the Latvian economy to ensure future sustainable economic development must be based on the requirements of a modern economy: on the one hand specific role of service branch in post-industrial economy and on the other hand EU decision to realise re-industrialization policy. Given the expectation countries put on innovation in economic growth, as well as their limited access to knowledge resources and low commercialization opportunities, the aim is to assess the opportunities and threats posed by innovation-driven economic growth, focusing on the Latvian resources. Tasks of research are: 1) provide insight into the theoretical, empirical studies that reveal the decision to base economic development on innovation, as well as the threats that this decision can bring; 2) evaluate the resources in Latvia to take advantage of innovative opportunities and avoid threats. The research work in this article is based on the following methods: scientific methods-analysis, synthesis, monographic method; economic method-institutional analysis; statistical methods-analytical grouping, state series, as well as on calculation of quantitative and qualitative indicators of structural changes. In the first chapter is defined the research problem, in the second - using theoretical and empirical studies are explained decision to base economic development on innovations, as well as defined the threats that this decision can bring, as well as is made emphasis on necessary resources for innovation-based economic development, in the third - is provided empirical research methodology, in the fourth - the authors present research findings. 560 ‘‘Societal Innovations for Global Growth‘‘, 2012, No. 1(1) ISSN 2335-2450 (online) 2. Innovation create opportunities and threats: a theoretical and empirical aspects The Nobel Prize-winning R. Solow’s (Solow, 1956) research has shown that sustainable economic development in the country is mainly based on technological change. Further theoretical, empirical studies show that innovation is the basis for growth of production and productivity (Romer 1990; Grossman, Helpman 1991; Aghion, Howitt 1992; Griliches 1992). Sustainable economic development should be based on technology, knowledge, intellectual capital and productivity (Chen, Dahlman, 2005), what is reached through innovation. Innovation is important in providing economic growth, welfare and social cohesion, as well as innovation could be perceived like engine for sustainable economic growth, especially in countries, which could exploit their technological capabilities in the best way (Autant-Bernard, Chalaye, Manca, Moreno, Surinach, 2010). Positively about innovation speaks positive experience of countries which is summarized in empirical studies. For example, countries whose development and implementation of innovations in the global and EU level have positive evaluation, also shown higher rates in prosperity and competitiveness (Innovation Union Scoreboard, 2011; Global Competitiveness Report, 2011; Monitoring Industrial Research: The 2010 EU Industrial R&D Investment Scoreboard, 2011). For example, the innovation performance in Sweden within EU takes first place (Innovation Union Scoreboard, 2011) and second place in the world (The Global Innovation Index 2012), while competitiveness ranks country in second place in the world (Global Competitiveness Report, 2011), as well as GDP per capita in Sweden is well above the EU average (GDP per Capita, 2012). However, not all cases, innovation are the key to economic success. The world has found that relatively few successful examples of convergence - close approach of the poorest countries to developed countries using the latest technology. In most cases, by contrast, takes place in divergence or polarization between countries (Dimza, 2003; Samuelson, Nordhaus, 1995; Burda, Wyplosz, 1997). The poorest countries come in „traps” of poverty - low average incomes, low savings and investment rates, low rate of capital accumulation, low productivity, low income, etc. (Dimza, 2003). Innovation could negatively impact not only in poor countries but also in developed countries. Analyzed data for Sweden indicates that development, which was achieved in knowledge-intensive, high-technology branches through innovation during growth stage, stopped and even declined sharply during the economic downturn –the faster decrease of value added and the largest number of persons lost their jobs were directly to knowledge-intensive and high-technology sectors (Šipilova, 2012b). In cases, 561 ‘‘Societal Innovations for Global Growth‘‘, 2012, No. 1(1) ISSN 2335-2450 (online) when the branch’s value and contribution to economic development is significant, followed serious economic decline. Evaluating of GDP growth rate during global economic recession in the EU Member States, it was found that GDP had negative value, not only in countries with weak innovation performance, but also in countries with strong innovation performance (Šipilova, 2012a). Dangerous is the lack of diversification, as indicated by the example of Finland’s Nokia. Finland’s innovation performance allows country receive 4th place in the EU (Innovation Union Scoreboard, 2011) and 4th place in the world (The Global Innovation Index, 2012), however, excessive economic dependence on a single innovative business weakened considerably Finnish economic position in the world economic space. Nokia Corporation’s weakening in the sector of mobile phones shattered the Finnish economy (Cabural, 2012). The negative effect of innovation occurs because of necessity of huge and neverending investments in R&D, as well as because of risks, which could decline economic sustainability. The most serious risks are: investments in R&D pay off in the long term; the life cycle of innovative product becomes shorter, this making the need for continuous research activities to improve the product, service, or for the creation of an entirely new one, which requires additional financial investment; most of the innovative products and services are not attributable to basic goods and services, therefore the demand for these positions is highly flexible during the economic downturn; it is difficult to predict the consumer’s attitude and interest to innovative product, service; it is difficult to predict the stage of implementation of innovation development achieved by competitors The result may be observed sensitivity to changes in economic conjuncture in some innovative branches. In cases, when the branch’s value and contribution to economic development is significant, followed serious economic decline. Therefore, it is important to the extent to which the country is provided with the necessary resources for innovation-based development. To accelerate economic development is necessary not only R&D development in the public and private sectors, but also increasing the competitiveness through: sectoral diversification, investments in improvement of skill level and infrastructure, commercialization of new ideas, acquisition of global technology (Голдберг, Годдар, Куриакосе, Расин, 2011). In many countries, it is accepted practice select priority branches or regions and in their direction creates a national-level development policy. However, it is difficult to 562 ‘‘Societal Innovations for Global Growth‘‘, 2012, No. 1(1) ISSN 2335-2450 (online) predict which branch or region in the future prove to be successful, because usually a new branch, as well as progress develops spontaneously, and each region has its own potential in knowledge-intensive economy (Asheim, Boschma, Cooke, 2011). Thus, we can distinguish one more threat posed by innovation – the wrong innovation policy formulation and implementation in relation to branch, region, thus weakening overall economic prospects for successful development. Summarizing the above mentioned, it can be concluded that innovation is important basis for the development, but not in all cases it brings only positive effect, why countries should carefully evaluate their resources for using opportunities offered by innovation and to be prepared for reducing the threat posed by innovation. In case the state necessary resources are in short supply, it can use acquisition of global technologies. 3. The Empirical Research Methodology Is the Latvian economy is based on innovation? To illustrate whether the structural changes in Latvian economy had contributed or had not contributed to developing innovation-based economy, authors use calculations of quantitative and qualitative indicators of structural changes, using such quantitative indicators like Index (I), Speed (V) and Intensity (E), as well as using such qualitative indicators like Direction (N), Quality (K) and Aggregate Quality (Ka) (Красильников, 1999). For assessment of innovation authors use Oslo Manual’s methodology (Oslo Manual, 2010), as well as aggregate measurement results (Innovation Union Scoreboard, 2011; Global Innovation Index, 2012). According to the Oslo Manual recommendations there are two basic scientific-technical approaches for innovation measurment: resources that are spent on R&D, patents statistics (Oslo Manual, 2010). In empirical research is used the National Development Plan 2014-2020 and the National Development Programme for strategy “Europe 2020” implementation, in which are defined national targets in connection with research problem of this article. The research work in this article is based on the following methods: scientific methods-analysis, synthesis, monographic method; economic method-institutional analysis; statistical methods-analytical grouping, state series, as well as on calculation of quantitative and qualitative indicators of structural changes. 4. The Empirical Research Results In what extent the Latvian economy could be named innovative? 563 ‘‘Societal Innovations for Global Growth‘‘, 2012, No. 1(1) ISSN 2335-2450 (online) Human resources in Latvia is evaluated as high, what could provide a good starting platform for innovation, but innovation development process do not depend only high level of human resources, but also on other enabling factors, which are influenced by different national policies. The most important problem in Latvia is the weak link between science and enterprises (Paas, Poltimäe, 2012). According to empirical studies, Latvia is at 27th place in the EU (Innovation Union Scoreboard, 2011) and at 30th place in the world (Global Innovation Index, 2012) by innovation performance. The given researches provide complete assessment of the economic, social and legal environment, but little attention is paid to the structure of the economy and branches. Results of calculations of quantitative and qualitative indicators of structural changes could show the extent to which the Latvian economy approaches to designation “innovative”. -0.67 Research and development (K73) -2.33 0.0 -0.01 Computer and related activities (K72) 0.12 0.09 -0.53 Post and telecommunications (I64) -0.66 -0.26 Manufacture of transport equipment (DM) 1.00 0.0 0.0 Manufacture of electrical machinery and apparatus n.e.c. (DL) 1.20 0.01 0.01 -0.60 Manufacture of machinery and equipment n.e.c. (DK) -0.01 -0.02 Manufacture of chemicals, chemical products and man-made fibres (DG) 1.50 0.01 0.02 -0.39 Innovative branches -0.66 Whole economics (A-O) -3 -2.5 -2 -1.5 -1 Speed (V) -0.5 Intensity (E) 0 Quality (K) 0.5 1 1.5 2 Aggregate quality (KA) Source: Calculated by authors according to National Accounts by 31 Branches – Aggregates at Current Prices access via Internet http://appsso.eurostat.ec.europa.eu/nui/show.do?dataset=nama_nace31_c&lang=en (reffered on 31 August 2012) Figure 1. Quantitative and Qualitative Indicators of Structural Changes in knowledge-intensive and high-technology branches in Latvia in 2009 in accordance with NACE Rev. 1.1 564 ‘‘Societal Innovations for Global Growth‘‘, 2012, No. 1(1) ISSN 2335-2450 (online) More significant in economic development are branches that directly implements scientific advances - at the branch structure level the most important in processes of providing national competitiveness have become mechanical engineering, chemical manufacturing, communication, and research. Qualitative assessment of structural changes in high-technological, knowledgeintensive branches indicates that most of the structural changes in the unfavorable direction relative to the development of innovative economy occurred in innovative services. The only one manufacturing branch, in which the ongoing structural changes were found to be negative (adverse) in Latvia in 2009 was „Manufacture of machinery and equipment n.e.c.” (DK) -0.60. In branches „Manufacture of chemicals, chemical products and man-made fibres” (DG) 1.50, „Manufacture of electrical machinery and apparatus n.e.c.” (DL) 1.20 and „Manufacture of transport equipment” (DM) 1.00 in the last twenty years, ongoing structural changes are assessed as positive (desirable) in relation to the development of innovative economy. Contrast situation is in innovative services. The highest negative value of quality of structural changes K=-2.33 was achieved in branch „Computer and related activities” (K72) and in branch „Research and development” (K73) K=-0.67. The smallest negative value of quality of structural changes K=-0.53 between innovative branches was in branch „Post and telecommunications” (I64). Aggregate quality of structural changes of all innovative branches although is expressed by a negative value of K=-0.39, indicating that structural changes took place in the unfavorable direction relative to the innovation economy, however, is closer to desired than aggregate quality of structural changes K=-0.66 in all branches relative to innovative economy. According to estimates the most important in providing economic structure in Latvia among high-technological and knowledge-intensive branches were „Post and telecommunications” (I64) and „Computer and related activities” (K72), on what indicates speed (V) and intensity (E) of structural changes. It should be noted that structural changes in branch “Post and telecommunications” (I64) have been focused on the reduction of the share of branch in the economy V=-0.26, E=-0.66, while the in branch “Computer and related activities” (K72) was observed reverse process V=0.09 E=0.12. In high-technology and knowledge-intensive manufacturing branches structural change occurred more slowly and less intensely, pointing to the smaller impact of these branches on economic structure. In branch „Manufacture of chemicals, chemical products and man-made fibres” (DG) V=0.02 and E=0.01, in branch „Manufacture of 565 ‘‘Societal Innovations for Global Growth‘‘, 2012, No. 1(1) ISSN 2335-2450 (online) electrical machinery and apparatus n.e.c.” (DL) V=0.01 and E=0.01, in „Manufacture of machinery and equipment n.e.c.” (DK) V=-0.02 and E=-0.01, while in branch „Manufacture of transport equipment” (DM) V and E =0.00. The calculations indicate that the role of innovative branches in the Latvian economy is not yet high. Of these, the greatest role in the economic structure play hightechnology and knowledge-intensive service branches, while the slower, but more stable results are reported by the manufacturing and directly manufacturing branches could gradually brings Latvian economy to innovation-based economic development. What is being done to promote the development of innovative economy and hence for using of innovation created opportunities? One of the most important tools, which helps to promote innovation in the development of the branches and the economy as a whole is a research and development (R&D) and the resources needed for investment in R&D. Investments in R&D in Latvia for a long time are at low level, and in 2006 the highest result achieved by the private sector, 0.35% of GDP is 4 times smaller than the targets of Latvian “National Development Plan 2014-2020” to increase investments in R&D to 1.5% of GDP in 2020 (Nacionālā Attīstības plāna 2014.-2020. sākotnējā redakcija, 2012). Figure 2 data show a low public participation and in recent years dominance of the higher education sector over the business sector. Despite the large role of higher education in the development of innovation (Jermolajeva, Eglītis, Paņina, Ostrovska, 2010), dominance of sector of higher education creates a situation where the R&D process and the commercialization of its results is hampered due to lack of resources. The business sector has a high concentration of the necessary resources, while the public sector with its support can reduce the risk of adverse effects. Figure 2 data indicate that significantly higher R&D employment in Latvia for a longer period of time there has been a higher education sector. However, the sector of higher education often has not necessary resources for commercialization of R&D results, and there may also be some legal restrictions that prohibit actively involved in the business process. It can be concluded that in R&D activities in Latvia are not invested sufficient resources, as well as distribution of R&D personnel by sectors indicates a relatively low possibilities to commercialize R&D results. Most of the R&D investments by branches of science are represented in the higher education sector. In branches such like „Electrical engineering, electronic engineering, information engineering” and „Engineering and technology” are represented higher education sector, as well as business and public sectors, moreover, the bulk of these positions are represented in business sector 0.06% and 0.08% of GDP (Total intramural R&D expenditure (GERD) by sectors of performance and fields of science, 2012). 566 ‘‘Societal Innovations for Global Growth‘‘, 2012, No. 1(1) ISSN 2335-2450 (online) 0.70 0.60 0.50 0.40 0.30 0.20 0.10 R&D investments Business enterprise sector 2009 2008 2007 2006 2005 2004 2003 2002 2001 2000 2010 2009 2008 2007 2006 2005 2004 2003 2002 2001 2000 0.00 R&D personnel Higher education sector Government sector Source: Total intramural R&D expenditure (GERD) by sectors of performance access via Internet http://appsso.eurostat.ec.europa.eu/nui/show.do?dataset=rd_e_gerdtot&lang=en and Total R&D personnel and researchers by sectors of performance, as % of total labour force and total employment, and by sex access via Internet http://appsso.eurostat.ec.europa.eu/nui/show.do?dataset=rd_p_perslf&lang=en (reffered on 31 August 2012) Figure 2. R&D expenditure, R&D personnel by sectors in Latvia in 2000-2010, % of GDP, % So intense involvement of all sectors, as well as high concentration of resources in the business sector is delivering positive results such like significant number of registered patents in „Manufacture of electrical machinery and apparatus n.e.c.” (DL) and since 2007 and increasing number of registered patents in „Manufacture of machinery and equipment n.e.c.” (DK). In conformity with available data in Latvia last years clearly dominate two branches – „Manufacture of chemicals, chemical products and man-made fibres” (DG) and „Manufacture of electrical machinery and apparatus n.e.c.” (DL) (see Figure 3). During the economic downturn within the branches recorded a significant reduction of 567 ‘‘Societal Innovations for Global Growth‘‘, 2012, No. 1(1) ISSN 2335-2450 (online) the number of patents, however, reached in the previous year can bring economic benefits. Registered number of patents in other branches is similar and relatively low. 12.000 10.000 Manufacture of chemicals, chemical products and man-made fibres (DG ) 8.000 Manufacture of machinery and equipment n.e.c. (DK) 6.000 Manufacture of electrical machinery and apparatus n.e.c. (DL) 4.000 2.000 2009 2008 2007 2006 2005 2004 2003 2002 2001 2000 0.000 Source: Patent Applications to the EPO by Priority Year at the National Level by Sector of Economic Activity (NACE Class Derived Through Concordance with IPC) access via Internet http://appsso.eurostat.ec.europa.eu/nui/show.do?dataset=pat_ep_nnac&lang=en (reffered on 31 August 2012) Figure 3. Registered patents by branches in Latvia in 2009 in conformity with NACE Rev. 1 Both in branch “Manufacture of chemicals, chemical products and man-made fibres” (DG), as well as in branch „Manufacture of electrical machinery and apparatus n.e.c.” (DL) was growing labor productivity and was increasing R&D employment. Labour productivity increased 2 times in both branches (Annual detailed enterprise statistics on manufacturing subsections DA-DE and total manufacturing (NACE Rev.1.1 D), 2012; Annual detailed enterprise statistics on manufacturing subsections DF-DN and total manufacturing (NACE Rev.1.1 D), 2012), similar positive changes occurred in R&D personnel share (Total R&D personnel and researchers by sectors of performance, as % of total labour force and total employment, and by sex, 2012). This shows the potential 568 ‘‘Societal Innovations for Global Growth‘‘, 2012, No. 1(1) ISSN 2335-2450 (online) of these branches, which could allow them to take the appropriate place in the developing innovation-based economy in Latvia. It is possible to conclude that development of innovation-based economy in Latvia is still ongoing, and for this is used inadequate amount of resources what prevent access to the benefits of innovation and decreases possibilities for reducing threats to innovation. However, despite this, there are successful examples of innovative activities in Latvia. Analyzing information about annual award organized by Ministry of Economics of Republic of Latvia and Investment and Development Agency of Latvia the „Export and Innovation Award” can be made some conclusions. During the period from 2004 to 2011. Total amount of awarded products and services since 2004 till 2011 is 141. Figure 4 data shows that over the period analyzed the largest export-oriented and innovative products and services has been in low- and medium-technology branches – „Manufacture of food products, beverages and tobacco” (DA) 24 products, „Manufacture of basic metals and fabricated metal products” (DJ) 23 products. It should be noted that the sector „Manufacture of basic metals and fabricated metal products” (DJ) is an important raw material source for the high-technology and knowledgeintensive branches. In innovative branches „Manufacture of chemicals, chemical products and manmade fibres” (DG), „Manufacture of machinery and equipment” (DK), „Manufacture of electrical machinery and apparatus n.e.c.” (DL), „Manufacture of transport equipment” (DM) award „Export and Innovation Award” was given less, respectively, 14, 5, 8 and 4 times. Based on the analyzed material for further research work authors defined the following question - would not be profitable for Latvia to invest in innovation in the low- and medium-technology branches, rather than trying to achieve high performance in innovative branches? 569 ‘‘Societal Innovations for Global Growth‘‘, 2012, No. 1(1) ISSN 2335-2450 (online) Health and social work (N) Real estate, renting and business activities (K) Transport, storage and communication (I) Wholesale and retail trade; repair of motor vehicles, motorcycles and personal and household goods (G) Construction (F) Electricity, gas and water supply (E) Manufacturing n.e.c. (DN) Manufacture of transport equipment (DM) Manufacture of electrical machinery and apparatus n.e.c. (DL) Manufacture of machinery and equipment n.e.c. (DK) Manufacture of basic metals and fabricated metal products (DJ) Manufacture of other non-metallic mineral products (DI) Manufacture of rubber and plastic products (DH) Manufacture of chemicals, chemical products and man-made fibres (DG) Manufacture of pulp, paper and paper products; publishing and printing (DE) Manufacture of wood and wood products (DD) Manufacture of textile and textile products (DB) Manufacture of food products, beverages and tobacco (DA) 0 5 10 15 20 25 30 Source: Calculated by authors according to Konkursa „Latvijas Eksportspējīgākais produkts 2004”, Konkursa „Eksporta gada balva 2005” , Konkursa „Eksporta gada balva 2006”, Konkursa „Eksporta un inovācijas balva 2008”, Konkursa „Eksporta un inovācijas balva 2009”, Konkursa „Eksporta un inovācijas balva 2010”, Konkursa „Eksporta un inovācijas balva 2011” laureāti access via Internet http://www.liaa.gov.lv/lv/eksportetajiem/eksporta-un-inovacijas-balva (reffered on 31 August 2012) Figure 4. Distribution of exportable and innovative products by branches in Latvia in 2004-2011 in conformity with annual award organized by Ministry of Economics of Republic of Latvia and Investment and Development Agency of Latvia the „Export and Innovation Award” 570 ‘‘Societal Innovations for Global Growth‘‘, 2012, No. 1(1) ISSN 2335-2450 (online) Conclusions 1. Despite the extremely important role of innovation in economic development and sustainability in conditions of increased competition and scarce resources explicitly to perceive innovation as a key to success would not be rational, as shown in the theoretical and empirical research, as well as experience of countries, innovation not only brings opportunities, but also poses a threat, also a negative effect of innovation could be not only in poor countries but also in developed countries; 2. Over the past two decades, the structural changes in high-technology and knowledge-intensive branches indicate that the role of innovative branches in Latvian economy is not yet high, so it is possible to conclude that the creation of Latvian innovation-based economy is ongoing; 3. Available statistical information suggests that the Latvian high-technology and knowledge-intensive branches have the potential (high or increasing number of registered patents, increasing labor productivity and increasing share of R&D personnel), but at the moment predominance, as well as the success of innovation is in low- and medium-technology branches („Export and Innovation Award“); 4. Available for Latvia and necessary for creation of innovation-based economy resources, as well as resources for minimizing the innovative risks are in short supply, it is necessary significant changes in the economic structure in favor of a high-technology and knowledge-intensive branches what requires more financial and human resources which are used today. Recommendations 1. It could be usefull if higher education institutions in Latvia will have rights to be involved in business processes, therefore will increase possibilities of innovation commercialization; 2. Acquisition of technologies, as well as outsorsing is possibilities for increasing innovation performance in Latvia. References Aghion, P., Howitt, P. (1992), A Model of Growth Through Creative Destruction, Econometrica, Vol. 60, No 2, pp. 323-351. Annual detailed enterprise statistics on manufacturing subsections DA-DE and total manufacturing (NACE Rev.1.1 D) (2012), access via Internet: 571 ‘‘Societal Innovations for Global Growth‘‘, 2012, No. 1(1) ISSN 2335-2450 (online) http://appsso.eurostat.ec.europa.eu/nui/show.do?dataset=sbs_na_2a_dade&lang=en (reffered on 31 August 2012) Annual detailed enterprise statistics on manufacturing subsections DF-DN and total manufacturing (NACE Rev.1.1 D) (2012), access via Internet: http://appsso.eurostat.ec.europa.eu/nui/show.do?dataset=sbs_na_2a_dfdn&lang=en (reffered on 31 August 2012) Annual detailed enterprise statistics on services (Nace Rev.1.1 H-K) (2012), access via Internet: http://appsso.eurostat.ec.europa.eu/nui/show.do?dataset=sbs_na_1a_se&lang=en (reffered on 31 August 2012) Asheim, B., Boschma, R., Cooke, P. (2011), Constructing Regional Advantage: Platform Policies Based on Related Variety and Differentiated Knowledge Bases, Regional Innovation Systems: Theory, Empirics and Policy, Vol. 45, No 7, pp. 893-904. Autant-Bernard, C., Chalaye, S., Manca, F., Moreno, R., Surinach, J. (2010), Measuring the adoption of innovation. A typology of EU countries based on the Innovation Survey, Innovation – The European Journal of Social Science Research, Vol. 23, No. 3, pp. 199-222. Burda, M., Wyplosz, C. (1997), Macroeconomics: A European Text, Oxford, Oxford University Press Cabural, M. Nokia’s Troubles Add to Finland’s Economic Woes (2012), access via Internet: http://www.valuewalk.com/2012/07/nokias-troubles-add-to-finlands-economic-woes/ (reffered 31 August 2012) Chen D.H.C., Dahlman C.J. (2005), The Konowledge Economy, the KAM Methodology and World Bank Operations, access via Internet: http://siteresources.worldbank.org/KFDLP/Resources/KAM_Paper_WP.pdf (reffered on 31 August 2012) Dimza, V. (2003), Inovācijas pasaulē, Eiropā, Latvijā, Rīga, LZA EI. Eksports pa svarīgākajām preču sadaļām (milj. Ls) (2012), access vis Internet: http://data.csb.gov.lv/Dialog/varval.asp?ma=AT0080&ti=ATG08%2E+EKSPORTS+PA+SVAR%CEG%C2KAJ% C2M+PRE%C8U+SADA%CF%C2M++%28milj%2E+Ls%29&path=../DATABASE/atirdz/Ikgad%E7jie%20 statistikas%20dati/%C2r%E7j%E2%20tirdzniec%EEba/&lang=16 (reffered on 31 August 2012) GDP per Capita in PPS (2012), access via Internet: http://epp.eurostat.ec.europa.eu/tgm/table.do?tab=table&init=1&language=en&pcode=tec00114&plugi n=1 (reffered on 31 August 2012) Global Competitiveness Report (2012), access via Internet: http://www3.weforum.org/docs/WEF_GCR_Report_2011-12.pdf (reffered on 31 August 2012) Griliches, Z. (1992), The Search for R&D Spillovers, Scandinavian Journal of Economics, Vol. 94, pp. 29-47. Grossman, G., Helpman, E. (1991), Innovation and Growth in the Global Economy, Cambridge, MA: MIT Press. Innovation Union Scoreboard (2011), access via Internet: http://ec.europa.eu/enterprise/policies/innovation/files/ius-2011_en.pdf (reffered on 31 August 2012) Jermolajeva, E., Eglītis, J., Paņina, L., Ostrovska, I. (2010), Innovation: challenges and solutions in promoting the cooperation of higher education and business, Tarptautinis Verslas: inovacijos, psichologija, ekonomika, Vol. 1, No 1, pp. 9-23. Komisijas paziņojums „Eiropa 2020”. Stratēģija gudrai, ilgtspējīgai un integrējošai izaugsmei (2010), access via Internet: http://ec.europa.eu/eu2020/pdf/1_LV_ACT_part1_v1.pdf (reffered on 31 August 2012) 572 ‘‘Societal Innovations for Global Growth‘‘, 2012, No. 1(1) ISSN 2335-2450 (online) Konkurss eksporta un inovāciju balva (2012), access via Internet: http://www.liaa.gov.lv/lv/eksportetajiem/eksporta-un-inovacijas-balva (reffered on 31 August 2012) Kopējās pievienotās vērtības sadalījums pa darbības veidiem (NACE 2. red.) pa ceturkšņiem, faktiskajās cenās (procentos no kopapjoma) (2012), access via Internet: http://data.csb.gov.lv/Dialog/varval.asp?ma=IK0051c&ti=IK051%2E+KOP%C7J%C2S+PIEVIENOT%C2S+V% C7RT%CEBAS+SADAL%CEJUMS+PA+DARB%CEBAS+VEIDIEM+%28NACE+2%2Ered%2E%29+PA++CET URK%D0%D2IEM%2C+faktiskaj%E2s+cen%E2s+%28procentos+no+kopapjoma%29&path=../DATAB ASE/ekfin/%CEstermi%F2a%20statistikas%20dati/Iek%F0zemes%20kopprodukts/&lang=16 (reffered on 31 August 2012) Monitoring Industrial Research: The 2010 EU Industrial R&D Investment Scoreboard (2010), access via Internet: http://iri.jrc.es/research/docs/2010/SB2010_final_report.pdf (reffered on 31 August 2012) Nacionālā Attīstības plāna 2014.-2020. sākotnējā redakcija (2012), access via Internet: http://www.llf.partneribas.lv/resource/1344430746_NAP2020%20sakotneja%20redakcija_20120806.pdf (reffered on 31 August 2012) National Accounts by 31 Branches – Aggregates at Current Prices (2012), access via Internet http://appsso.eurostat.ec.europa.eu/nui/show.do?dataset=nama_nace31_c&lang=en (reffered on 31 August 2012) Oslo Manual (2005), access via Internet: http://epp.eurostat.ec.europa.eu/cache/ITY_PUBLIC/OSLO/EN/OSLO-EN.PDF (reffered on 31 August 2012) Paas, T., Poltimäe, H. (2012), Consistency between innovation indicators and national innovation performance in the case of small economies, Eastern Journal of European Studies, Vol. 3, Issue 1, pp. 101-121. Patent Applications to the EPO by Priority Year at the National Level by Sector of Economic Activity (NACE Class Derived Through Concordance with IPC) (2012), access via Internet http://appsso.eurostat.ec.europa.eu/nui/show.do?dataset=pat_ep_nnac&lang=en (reffered on 31 August 2012) Progresa ziņojums par Latvijas nacionālās reformu programmas „Eiropa 2020” stratēģijas kontekstā īstenošanu (2012), access via Internet: http://ec.europa.eu/europe2020/pdf/nd/nrp2012_latvia_lv.pdf (reffered on 31 August 2012) Romer, P. (1990), Endogenous Technological Change, Journal of Political Economy, Vol. 98, No 5, pp. 71102. Samuelson, P.A., Nordhaus W.D. (1995), Economics, N.Y., Mc Graw-Hill. Solow, R., (1956), A Contribution to the Theory of Economic Growth, The Quarterly Journal of Economics, Vol. 70, No 1., pp. 65-94. Šipilova, V. (2012a), Effect on Innovation on National Economy (Example of the European Union), Regional Review, No 8, pp. 21-33. Šipilova, V. (2012b), Inovācijas ekonomiskās izaugsmes un lejupslīdes laikā nozaru griezumā: divu polu piemērs, Sociālo Zinātņu Vēstnesis, No 14, lpp. 43-67. The Global Innovation Index (2012), access via Internet: http://www.globalinnovationindex.org/gii/GII%202012%20Report.pdf (refferes on 31 August 2012) 573 ‘‘Societal Innovations for Global Growth‘‘, 2012, No. 1(1) ISSN 2335-2450 (online) Total intramural R&D expenditure (GERD) by sectors of performance and fields of science (2012), access via Internet: http://appsso.eurostat.ec.europa.eu/nui/show.do?dataset=rd_e_gerdsc&lang=en (reffered on 31 August 2012) Total intramural R&D expenditure (GERD) by sectors of performance (2012), access via Internet: http://appsso.eurostat.ec.europa.eu/nui/show.do?dataset=rd_e_gerdtot&lang=en (reffered on 31 August 2012) Total R&D personnel and researchers by sectors of performance, as % of total labour force and total employment, and by sex (2012), access via Internet: http://appsso.eurostat.ec.europa.eu/nui/show.do?dataset=rd_p_perslf&lang=en (reffered on 31 August 2012) Голдберг, И., Годдар Дж.Г., Куриакосе, С., Расин, Ж. (2011), Расширяя горизонты инноваций access via Internet: http://siteresources.worldbank.org/INTECA/Resources/2578961314820419212/Innovation20110929_ru.pdf (reffered on 31 August 2012) Красильников, О., (1999), Структурные сдвиги в экономике: теория и методология, Саратов, Научная книга. 574 ‘‘Societal Innovations for Global Growth‘‘, 2012, No. 1(1) ISSN 2335-2450 (online) A TYPE OF MARKETING IN INNOVATION: GUERILLA MARKETING Lec. Grv. Soner Arslan Assoc.prof. Dr. Fügen Durlu-Özkaya Department of Tourism Management Faculty of Tourism Necmettin Erbakan University Karatay, 42050, Konya, Turkey E-mail: [email protected] Department of Gastronomy and Culinary Arts Faculty of Tourism Gazi University Golbasi, 06830, Ankara, Turkey E- mail: [email protected] Abstract Innovation is a strategy having a vital importance in the competitive world of today to be different from the competitors and to grow. Today’s commoner any longer goes toward what is different, instead of showing interest to what is ordinary. From sociological and psychological point of view, the changes occurring in human being orientated him/his to be more free, adventurist, and original. In parallel with these changes, the consumers mostly began to show interest to what is newer and more different. Innovation and differentiation in business world can only be possible to understand innovation and apply it correctly. This study aims to introduce the innovative aspects of guerilla marketing among the domain of marketing innovation, one of the sorts of innovation. From the years it appeared to now, this marketing strategy, to whose development the various authors and academics have contributed, often began to come into the face of humans in these days. Guerilla marketing, largely emerged for use of SMSEs, promises to them to provide competitive advantage in the domain of marketing. That SMSEs become competitive against the large companies is an important issue in national sustainable development. This study theoretically examines the reason why guerilla marketing should be viewed as innovation. Keywords: Marketing, innovative, guerilla marketing, SMEs. 575 ‘‘Societal Innovations for Global Growth‘‘, 2012, No. 1(1) ISSN 2335-2450 (online) 1. Introduction Marketing comes to our face as a concept showing continuous change and development in parallel with the developments being experienced in business world. In the period, from the late 19th centuries to 1930s, production approach arguing that everything produced will be sold replaced over time with a sale orientated approach and following this, with recognizing that the only sale is insufficient, beginning from 1950s, market - orientation has become a marketing approach adopted by business enterprises. In market –orientated approach, the importance of efforts of business enterprises such as making decision about what will be produced before starting production and informing, positioning, and creating trademark before making sale stood out. But, overtime, classical market orientated approach became unanswerable to the needs of business enterprises. Therefore, the concept of modern marketing that divides the customers into specific subgroups and departmentalizes them; identifies target markets; and sends integrated marketing messages, which apprehended customer satisfaction and will provide to repurchase, emerged. (Babacan and Onat, 2002:19) One of the customer orientated marketing strategies adopted by the business enterprises facing to the economic and social problems of the age so that they can both come through these problems and cope with the competition they have experienced is guerilla marketing strategies. Via this strategy, since the business enterprises can obtain the chance to reach more customers with fewer budgets, they are particularly preferred by the business enterprises that are new in the market. 2. Emergence of Guerilla Marketing and Its Definition The concept of guerilla marketing was revealed and introduced by Jay Conrad Levinson, the founder and father of idea of marketing strategies in the early 1980s. Levinson explains the emergence of guerilla marketing strategy, during his lecturing marketing in Berkeley University, California, as a group of student desiring to found their own businesses to ask for him to suggest a book teaching the way of founding a business without investing any money. Levinson promising to find resource to the students, although he reviewed many libraries, does not reach such a resource and with what he researched from the literature, writes an article titled “527 Ways of Marketing Without Investing Money” and gives it to the students and according to his expression, the foundations of guerilla marketing were laid (Arslan, 2009:12). 576 ‘‘Societal Innovations for Global Growth‘‘, 2012, No. 1(1) ISSN 2335-2450 (online) The development of guerilla marketing continues with publication of “Guerilla Marketing”, the first book of Levinson on guerilla marketing in 1983.Then, that various authors give place this subject in their books and some courses and seminars on guerilla marketing provided the subject to become widespread. Levinson publicized a number of books, in which he handled the different dimension of subject. But, that guerilla marketing is heard all over the world in the real meaning has gained acceleration after 1990s. The increase of importance of marketing with that various crises are experienced in the world; the changes in political structures of countries; and globalization movement that increases with ending of Cold War, and the most importantly, becoming easier to reach the information as a result of becoming widespread of internet caused guerilla marketing to be heard all over the world and its examples to be seen and developed for the others as well. Guerilla marketing is based on the principle that especially small and medium sized enterprises, with the small, periodic, but surprising attacks, demoralize their competitors and acquire a place in the markets (Tek, 1997:109; Kotler, 2003:163). İn order to be permanent in the market seized from the demoralized competitor, the efforts to promote the sales is realized by intensive advertisement attacks and the other legal actions in localized regions (Boyd & Orville, 1990:728). In the light of this information, if it is necessary to make e general definition, guerilla marketing is a cheap, effective, and rapid marketing strategy that the agencies aiming at making profit or not realize via non –traditional instruments and method, instead of the traditional marketing methods, in order to reach their target masses and influence them, investing their labors and creativities as capital (Arslan, 2009:14). 3. What is Innovation? Innovation, a word coined from innovatus that is a word in Latin, refers to beginning to use the new methods in the social, cultural, and administrative environment (Elçi, 2007:1). Innovation is a certain function of entrepreneurship. Innovation is that the entrepreneur produces welfare, forming new resources or increasing the potential to use the existing resources (Drucker, 1998). The definition of OECD is: “innovation is the application of new or modified product or process (good and service), marketing method, or a new organizational method in work practices, organization of workplace, or foreign relationships” (OECD, 2005). Innovation can be made on the products, services, production and distribution methods, the methods to make work, and design and marketing methods of a firm. 577 ‘‘Societal Innovations for Global Growth‘‘, 2012, No. 1(1) ISSN 2335-2450 (online) These are also called product innovation, service innovation, process innovation, organizational innovation, and marketing innovation, respectively. In addition, innovation, according to the size of difference, renewal, and variability is divided into two as “radical” or “accrual” (Elçi, 2007; Yılmaz, 2008). Geoffrey Moore defines 8 sorts of innovation. These are the deranging strategic innovation, application innovation, new product innovation, process innovation, experience innovation, marketing innovation; work model innovation, and structural innovation (Vatan, 2010:35). Various authors mention about different innovation sorts, but is seen that one of their common points is marketing innovation. Due to the fact that it is directly related to our subject, marketing innovation is shortly referred below. Marketing innovation is to use the new marketing methods containing magnificent changes in designing, packaging, distributing, and pricing the product: Marketing innovation targets the needs of customers to shift to the newly opened market or a new position, certainly, with the target to increase the sales of firm (Kiwari, 2008). According to another definition, marketing innovation is that the different or new designs (in product or its packaging) are realized; different marketing methods are developed and applied; or the existing ones are improved and made more developed (Elçi, 2007). Marketing innovation can not only be in the form of changes made in product and packaging but also in the way of renewals carried out in marketing strategies. From this aspect, below, the guerilla marketing is examined in terms of marketing innovation and its innovative aspects are noted. 4. Outlook to Guerilla Marketing From the Viewpoint of Innovation Innovation, just as it expresses a new or developed product, technology, or service, it also expresses a new or developed method (Göker, 2000:3). Therefore, guerilla marketing, due to the fact that it introduced innovations to the domain of strategic marketing and it is based on developing he old methods, is both a managerial innovation and marketing innovation. Guerilla marketing is a marketing approach mostly developed for small and medium sized enterprises and to make a contribution to their compatibilities. In national development, the roles of small and medium sized enterprises are as much as it will not be able to be denied. These roles can be put in order as reducing the unemployment, increasing the production, contribution to gross national product, and taxes. Those small and medium sized enterprises having so much importance survive and sustain their 578 ‘‘Societal Innovations for Global Growth‘‘, 2012, No. 1(1) ISSN 2335-2450 (online) activities are important in terms of national development. The major issue the small and medium sized enterprises are mostly forced is the skill to be able to market effectively. When regarding from this point of view, guerilla marketing shows to the small and medium sized enterprises the way of how they can market cheaper and more effective. The renewals introduced by guerilla marketing to the approach of marketing can be put in order as follows: • Guerilla marketing, first of all, has pushed the mass media into background and went toward target orientated advertisement channels. It has built its strategies on these. Thanks to this, the small sized enterprises became compatible from the view point of marketing. • Since it has regarded to marketing action in terms of small and medium sized enterprises, it considered entrepreneurship and marketing with an holistic approach. That is, entrepreneur can simultaneously become marketing agent and marketing agent, entrepreneur. This also means that the boss takes places and so his becomes an accelerating element so that the desires and expectations of target mass can be understood more healthily and the appropriate reaction can be given. • Another innovation it introduced is to diversify the instruments of advertisement. While the channels the classical marketing has used are TV, radio, leaflets, and classic billboard notices, guerilla marketing developed these or discovered the new advertisement instruments. The idea to add the third dimension to the billboards, the idea to use the public areas in daily life surprisingly, or the idea to create a new channel, placing the advertisements on humans and animals are the renewals introduced by guerilla marketing. • The greatest renewal introduced by guerilla marketing became redefining the capital. Normally, the greatest capital of marketing is money. The business enterprise spend the money and marketing campaign is ended without making an examination in detail and regarding to performance. Guerilla marketing is capital, energy, time, and imagination. It recommends the time to give money to the entrepreneur, his/her putting energy, listening to his/her customers to develop his/her business, and thanks to this, that he/she can develop imagination. • In guerilla marketing, marketing plans were rearranged In the plans of traditional marketing, while the question of the “What to do?” is tried to be answered, the plans of guerilla marketing are built on the question on “How to do?” (Levinson & McLaughlin, 2004:33) • Timing of marketing was reviewed in guerilla marketing. In this scope, in terms of timing, the guerrilla marketing agents are recommended to make advertisement and presentation in the dead times their competitors interrupted them. 579 ‘‘Societal Innovations for Global Growth‘‘, 2012, No. 1(1) ISSN 2335-2450 (online) Thanks to this, in the course that the major competitors stopped their advertisements, the message of business enterprise will reach the customers more clearly and without losing. In addition, the attentions will be focused on them (Levinson, “Guerrilla Timing”, www.gmarketing.com). • Guerilla marketing, with the innovation and improvement it introduced to a number of domain of marketing, counted above and similar to these, showed that particularly small and medium sized enterprises can also market effectively and in cheap ways and with an innovative approach, opened new roads in marketing. 5. Conclusion Even though there are a few publications about whether guerilla marketing is innovation or not, according to authors, when the definition and scope of innovation is examined, guerilla marketing completely represents an innovation. When both regarding to the innovation it brought to the marketing method and introduced smart products in the domain of advertisement, guerilla marketing succeed in getting itself accepted all over the world. It was introduced that it was successful and effective in a variety of scientific studies and thanks to this, it was studied as a lecture and reported in the books of a number of authors as a marketing method. One of the aims of this study is to provide guerilla marketing to be introduced, releasing its innovative aspects, and to discuss the renewals it brought. Another aim is, with these applications and like, small and to announce and promote that medium sized enterprises can be made effective advertisement and marketing with less budgets. Thanks to this, it was aimed to make contribution from micro point of view to the business enterprises, from macro point of view to the national development. References Arslan, S. (2009). The Use of Guerrilla Marketing As an Alternative Marketing Strategy: A Survey on Hospitality Industry. Unpublished master's thesis. Gazi University. Ankara. Babacan, M., and Onat, F. (2002). “Postmodern Pazarlama Perspektifi”, Journal of Ege Akademik Bakış, Vol:2, No:1, p.11-19. Boyd, H., W., and Orville, C., W. (1990). Marketing Management. Boston: Irwin. Drucker, P. (1998). “The Discipline Of Innovation”, Harvard Business Review, November- December, access via Internet, <www.omegaproject.info/uploads/9/4/7/3/9473028/_the_discipline_of_innovation.pdf > (referred on 08 July 2012). Elçi, Ş. (2007). İnovasyon: Kalkınma ve Rekabetin Anahtarı. 7th Edition. İstanbul: Acar Matbaacılık. 580 ‘‘Societal Innovations for Global Growth‘‘, 2012, No. 1(1) ISSN 2335-2450 (online) Göker, A. (2000). Prodüktivite, İnovasyon Yeteneği ve Teknoloji. MPM, “Rekabet Gücü, Teknoloji ve Verimlilik”, Controversial Meeting, Ankara. Kiwari, R. (2008). Research Project Global Innovation. Hamburg University of Technology, access via Internet <www.global-innovation.net/innovation/Innovation_Definitions.pdf>, (referred on 25 July 2012). Kotler, P. (2003). A Framework For Marketing Management. 3rd Edition. New Jersey: Prentice Hall. Levinson, J., C., and McLaughlin, M., W. (2004). Guerrilla Marketing for Consultants. Hoboken: John Wiley and Sons Inc. Levinson, J., C., “Guerrilla Timing”, <www.gmarketing.com/articles/85-guerrilla-timing> (referred on 30 August 2012). OECD, (2005). Oslo Manuals: Guidelines For Collecting And Interpreting Innovation Data, access via Internet <http://www.tubitak.gov.tr/home.do?sid=471&pid=468> , (referred on 17 July 2012). Tek, Ö., B. (1997). Pazarlama İlkeleri. 7th Edition. İzmir: Cem Ofset. Vatan, A. (2010). Innovation In Tourism Management: A Research On 5-Star Accommodation Enterprises İstanbul. Unpublished master's thesis. Balıkesir University, Institute of Social Sciences, Balıkesir. Yılmaz, E. (2008). The Effect of Innovation to be Active Small and Medium Size Enterprise (SME)'s in Kahramanmaraş. Unpublished master's thesis. Department of Business Administration Institute of Social Sciences University Of Kahramanmaraş Sütçü İmam, Kahramanmaraş. 581 ‘‘Societal Innovations for Global Growth‘‘, 2012, No. 1(1) ISSN 2335-2450 (online) SOCIALINĖS POLITIKOS PRINCIPAI EUROPOS SĄJUNGOJE IR LIETUVOJE Prof. dr. Gediminas Davulis Mykolo Romerio universitetas Ekonomikos ir finansų valdymo fakultetas Ekonomikos katedra Ateities g. 20, LT-0830 Vilnius El. paštas: [email protected] Santrauka Straipsnyje analizuojami teoriniai socialinės politikos aspektai Europos Sąjungoje (ES) ir Lietuvoje. Pateikiama socialinės politikos sąvoka bei jos tikslai ir uždaviniai ES. Straipsnyje analizuojamos socialinės ir ekonominės politikos sąsajos, socialinės politikos prioritetai ES. Aptariami socialiniai aspektai ES ir Lietuvos strateginiuose plėtros dokumentuose, socialinės politikos prioritetai Lietuvoje. Detaliau nagrinėjama socialinės apsaugos politika Lietuvoje, aptariama jos sąvoka, tikslai bei pagrindiniai socialinės apsaugos modeliai. Aptariama Lietuvos socialinės sistemos modelis bei jo struktūra. Analizuojama ir įvertinama Lietuvos socialinės apsaugos sferos pajamos, išlaidos, jų struktūra Europos sąjungos kontekste. Reikšminiai žodžiai: socialinė politika, ekonominė politika, socialinės apsaugos politika, darni plėtra. 1. Įvadas Socialinė politika – tai teisinių, organizacinių ir ekonominių priemonių visuma, skirta socialiai apginti šalies žmones, sudarant jiems sąlygas dirbti, kartu solidariai suteikiant paramą tiems asmenims, kurie dėl ne nuo jų priklausančių aplinkybių nepajėgia užtikrinti būtinų gyvenimo sąlygų, atitinkančių priimtus standartus. Taigi socialinės politika turėtų garantuoti įvairioms gyventojų grupėms tam tikrą pajamų lygį. Socialinė politika, apima tokias sritis kaip švietimas, sveikata, socialinė apsauga, darbo rinka, namų ūkių gyvenimo sąlygos, būstas, kultūra, sportas ir kt. Nors socialinė politika 582 ‘‘Societal Innovations for Global Growth‘‘, 2012, No. 1(1) ISSN 2335-2450 (online) apima platų visuomenės interesų ratą, tačiau kaip svarbiausias mes išskirsime dvi socialinės politikos kryptys, t.y. socialinės apsaugos, taikomos tiems gyventojams, kurie dėl tam tikrų priežasčių (senatvės, ligos, motinystės/tėvystės, šeimos aplinkybių, nepritekliaus) negali pakankamai apsirūpinti iš darbo ar kitokių pajamų, įgyvendinimas bei darbo politikos, kurios objektais yra užimtumas, darbo rinka, darbo santykiai, darbo sąlygos, darbo apmokėjimas, formavimu ir įgyvendinimu. Reikia pažymėti, jog darbo politika apima platesnį problemų ratą negu užimtumo politika, kuri yra darbo politikos sudėtinė dalis ir apima tik darbo išteklių efektyvų panaudojimą ir darbo rinkos kontroliavimą. Šių dviejų socialinės politikos krypčių išskyrimas akivaizdžiai parodo socialinės ir ekonominės politikos sąsajas. Iš vienos pusės socialinės politikos (socialinės apsaugos) efektyvumas priklauso nuo ekonominės šalies padėties, tačiau iš kitos pusės ji pati taip pat skatina ekonomikos augimą. Galima teigti, jog socialinė politika, orientuota į užimtumo didinimą ir nedarbo mažinimą, darbo užmokesčio ir gyventojų pajamų augimą, yra vienas svarbiausių ekonomikos augimą lemiančių veiksnių. Kuriant gerovės valstybę, nepaprastai svarbus socialinės politikos veiksnys. Tik efektyvi socialinė politika, užtikrinanti pakankamą socialinę apsaugą, sudaro prielaidas tokiai valstybei sukurti. Šiuolaikinė gerovės valstybė kuriama remiantis darnios plėtros principais, t.y. ekonominis augimas turi būti suderintas su socialine sfera, bei tenkinti gamtosauginius reikalavimus. Kitaip sakant, augant ekonomikai, turėtų būti sudaromos sąlygos didėti socialinės apsaugos standartai bei didėti arba bent jau nemažėti ekologinė gerovė, t.y. gamyba turėtų būti draugiška aplinkai. Socialinės politikos reikšmė ir aktualumas ypač akivaizdus šiandieninėse sąlygose, kai stebimi nepalankūs demografiniai bei ekonominiai pokyčiai , kurios būdingos tiek Lietuvai, tiek ir kitoms ES šalims – narėms, tokie kaip: mažėjantis gimstamumas, didėjantis pensinio amžiaus gyventojų skaičius, didėjantis skurdą ir socialinę atskirtį patiriančių asmenų ar atskirų jų grupių skaičius, bedarbystės, emigracijos mastai. Visa tai neigiamai atsiliepia šalies ūkio plėtrai, tuo pačiu kyla problemų ir socialinei sferai, kadangi didėja socialinių išmokų poreikis, atsiranda socialinio biudžeto deficito problema. Narystė ES verčia Lietuvą suvokti visiškai naują socialinės politikos vaidmenį ekonomikoje. Kaip rodo pagrindiniai ES strateginiai dokumentai (Lisabonos strategija, Europos Tarybos Naujoji socialinės sanglaudos strategija ir kt.), socialinė politika ES yra svarbi ekonomikos augimo prielaida. Lietuva, būdama Europos Sąjungos nare ir dalyvaudama ES valstybių - narių vykdomų socialinės apsaugos politikos koordinavimo procese, gali tobulinti savo socialinę politiką, atsižvelgiant į kitų šalių patirtį. Nors Lietuvos strateginiuose dokumentuose deklaruojamas siekis įgyvendinti Europos gerovės modelį, tačiau realybė šiek tiek skiriasi. Lietuvoje nėra visiškai aišku kokia kryptimi einama, kadangi čia daugiau siekiama propaguoti ir plėtoti laisvosios, o ne 583 ‘‘Societal Innovations for Global Growth‘‘, 2012, No. 1(1) ISSN 2335-2450 (online) socialiai orientuotos rinkos principus, t.y. negalima tvirtai teigti, jog Lietuvos ekonominė politika yra socialiai orientuota. Kadangi socialinė sfera yra labai svarbi, todėl ir tyrimai šioje sferoje intensyviai vykdomi. Paminėsime tik tuos užsienio ir Lietuvos tyrėjus, kurių darbai svarbūs straipsnyje nagrinėjamai problemai, t.y. Esping-Andersen (1990), Goodin at al (1999), Pieters (1998), Stephan, Pierson (2002), Rodger (2000), Bernotas, Guogis (2000, 2003), Beržinskienė, Martinkus (2001), Dunajevas (2009), Guogis (2000, 2010), Gruževskis, Bartkus (2010), Indrašienė, Katkonienė (2011), Jančaitytė (2011), Kazlauskienė, Ostrauskienė (2010), Mališauskaitė, Lazutka (2003), Martinkus ir kt. (2000), Medaiskis (2011), Rakauskienė, Bivainis (1999), Papirtis, Bitinas (2010), Tartilas (2005), Žalimienė (2003). Straipsnyje naudojami tyrimo metodai – sisteminė mokslinės literatūros ir statistinių duomenų analizė bei apibendrinimas. 2. Europos Sąjungos socialinės politikos principai, tikslai ir teisiniai pagrindai Socialinė sfera yra viena iš veiklos sričių, kuri yra palikta ES šalių - narių kompetencijai. Kiekviena šalis vykdo savarankišką socialinę politiką. Čia nėra konkrečių ES nustatytų normatyvų, kuriuos šalys privalėtų besąlygiškai vykdyti, kaip, pavyzdžiui, netiesioginių mokesčių atveju. Tokie bendri normatyvai vargu ar įmanomi dėl nevienodų šalių – narių ekonominių galimybių. Nors ES negali diktuoti valstybėms - narėms kaip joms tvarkyti savo socialinius reikalus, tačiau tam tikri pagrindiniai socialinės politikos principai, kurių šalys – narės privalo laikytis, yra nustatytos tarptautinėse sutartyse bei kituose ES teisės aktuose. Iš kitos pusės iš dalies šalių – narių socialinės politikos dalinis reguliavimas ES mastu vis tik vyksta per reguliavimą sričių, kurios susijusios su bendros rinkos veikimu kaip, pavyzdžiui, darbo teisė, darbo saugos reikalavimai, socialinės darbuotojų teisės ir kitokius reikalavimus, kurie nustatyti ES direktyvose. Socialiniai aspektai nebuvo apeiti nuo pat Europos Bendrijos kūrimosi pradinių etapų. Socialinės politikos nuostatos jau buvo įrašytos Europos anglių ir plieno bendrijos sutartyse 1951 metais. Toliau jos buvo išplėtotos 1957 metais kovo 25 d. Romoje pasirašytoje Europos bendrijos steigimo sutartyje, kurioje buvo numatoma užtikrinti šalių socialinę ir ekonominę pažangą, aukšto lygio užimtumą ir socialinę apsaugą, skatinti valstybių narių socialinę sanglaudą bei solidarumą. Šiems tikslams įgyvendinti 1960 metais buvo įkurtas Europos socialinis fondas, kurio tikslas – gerinti darbuotojų įsidarbinimo galimybes. 1961 metais Europos Tarybai priklausančios Europos šalių vyriausybės Turine pasirašė Europos socialinę chartiją. Ši chartija, kurioje akcentuojamos darbuotojų socialinės teisės ir teisė į tinkamas darbo sąlygas, įnešė svarų 584 ‘‘Societal Innovations for Global Growth‘‘, 2012, No. 1(1) ISSN 2335-2450 (online) indėlį plėtojant ir humanizuojant Europos valstybių ekonominius ir socialinius santykius. 1991 metais Turine vykusios Ministrų konferencijoje Europos socialinė chartija buvo atnaujinta, atsižvelgiant į esminius socialinius pokyčius įvykusius po pirmojo chartijos pasirašymo. Kartu Chartija buvo papildyta specialiu protokolu dėl socialinės politikos. Papildyta Chartija įtvirtina šiuos pagrindinius principus: visi darbuotojai turi teisę į saugias ir sveikas darbo sąlygas ir į teisingą atlyginimą, garantuojantį normalų jų pačių ir jų šeimų gyvenimo lygį, visi darbuotojai ir jų išlaikytiniai turi teisę į socialinę apsaugą, kiekvienas asmuo, neturintis pakankamai išteklių, turi teisę į socialinę paramą ir medicinos pagalbą, kiekvienas žmogus turi teisę naudotis socialinės rūpybos tarnybų paslaugomis, šeima, kaip pagrindinė visuomenės ląstelė, siekiant užtikrinti jos gerovę, turi teisę į atitinkamą socialinę, teisinę ir ekonominę apsaugą, kiekvienos iš Chartiją pasirašiusių šalių piliečiai kitos šalies teritorijoje turi teisę dirbti bet kurį mokamą darbą tokiomis pat teisėmis, kaip ir pastarosios šalies piliečiai, atsižvelgiant į apribojimus, kurie taikomi dėl pagrįstų ekonominių ir socialinių priežasčių, darbuotojai migrantai, kurie yra vienos iš pasirašiusių Chartiją šalių piliečiai, ir jų šeimos turi teisę į apsaugą ir paramą kiekvienos kitos pasirašiusios Chartiją šalies teritorijoje, kiekvienas žmogus turi teisę į apsaugą nuo skurdo ir socialinės atskirties. Pažymėtina, jog čia išvardinti ir kiti Chartijos principai akcentuoja darbo santykius bei socialinę apsaugą. 1987 metais pasirašytame Suvestiniame Europos akte buvo akcentuojama socialinės partnerystės reikšmė, kuriant bendrą rinką ir socialinę politiką ES mastu. 1997 metais pasirašytoje Amsterdamo sutartyje buvo įtvirtintas svarbus Europos Sąjungos socialinės politikos prioritetas – socialinė sanglauda, kurios strategiją 2001 metais patvirtino Ministrų Komitetas. Taigi nurodytuose ir kituose ES teisės aktuose akcentuojami šie ES socialinės politikos tikslai: investicijos į švietimą, mokslą, užimtumo politiką, socialines apsaugos sistemų pritaikymas prie inovacijų, globalizacijos bei kitų šiuolaikinių procesų, siekiant kurti žiniomis grindžiamą visuomenę, deramų darbo sąlygų, teisės į pensiją ir kokybišką sveikatos priežiūrą užtikrinimas, socialinio dialogo bei socialinės atsakomybės plėtojimas, lygių galimybių užtikrinimas draudžiant bet kokią diskriminaciją dėl lyties, rasinės, etninės kilmės, negalios, socialinės orientacijos, amžiaus, religijos ar tikėjimo, judėjimo laisvės garantijos, sudarant galimybes ES valstybių piliečiams dirbti, gyventi bet kurioje kitoje Sąjungos šalyje su teise gauti socialines išmokas bei sveikatos priežiūrą. 3. Socialinės politikos, užimtumo politikos ir ekonomikos sąsaja Europos Sąjungoje Nesunku suvokti ryšį tarp socialinė ir užimtumo politikos bei ekonomikos augimo. Tik augantis užimtumas, sąlygojantis ir ekonomikos augimą, garantuoja ir socialinės 585 ‘‘Societal Innovations for Global Growth‘‘, 2012, No. 1(1) ISSN 2335-2450 (online) politikos sėkmę, t.y. be ekonomikos augimo negalima bus užtikrinti ir tinkamos bei stabilios socialinės apsaugos. Antra vertus ir tinkama socialinė politika teigiamai įtakoja ekonominius procesus. Socialinės politikos įtraukties atžvilgiu, žmonių bei gyventojų grupių kaip emigrantai, etninės mažumos, išstūmimas iš darbo rinkos bei aktyvaus dalyvavimo visuomeniniame gyvenime, reiškia turimų išteklių švaistymą. Antra vertus socialinė politika daro didelį poveikį sveikatai, o sveikata yra svarbus asmens galimybių ekonominėje veikloje veiksnys. Taigi tinkama bei finansiškai pagrįsta valstybės socialinė politika bei stabili ekonomikos ir viešųjų finansų padėtis stiprina viena kitą. Taigi, suderinta socialinė bei užimtumo politika skatina visuotinę aukštą gyvenimo kokybę ir reikiamą gyvenimo lygį, užtikrina galimybę gyventi aktyvioje integruotoje ir sveikoje visuomenėje. Darbo vietų kūrimo ir augimo skatinimo strategijos pagrindas – investavimas į žmones, panaudojant Europos socialinis fondo lėšas. Piliečių įsidarbinimo galimybėms didinti, darbuotojų ir įmonių gebėjimams skatinti ir pajėgumams palankių sąlygų neturinčiuose regionuose plėtoti numatyta per 2007–2013 metus skirti iki 77 mlrd. eurų šio fondo lėšų. Šis Fondas taip pat padeda dėl finansinės krizės praradusiems darbą asmenims persikvalifikuoti ir rasti naują darbą. Pastaraisiais metais ES socialinės politikos prioritetai šiek tiek pakito. Susirūpinimą ima kelti didėjantis skurdas ir socialinė atskirtis. Todėl. vienas iš pagrindinių ir svarbiausių socialinės politikos prioritetų ES yra kova su skurdu ir socialine atskirtimi. Šiai problemai spręsti reikėtų glaudesnių sąsajų tarp ES ekonominės politikos plėtros ir Europos Sąjungos socialinės politikos tikslų. Kaip jau buvo aptarta ES negali formuoti vieningos visos ES užimtumo ir socialinės politikos ir negali būti atsakinga už tai. Visų pirma, klausimus susijusius su konkrečios šalies užimtumo ir socialinės politikos formavimu, prisiima pačios valstybės narės, o Europos Sąjungai paliekami tik tie klausimai, kurie yra aktualūs ir svarbūs visos Europos Sąjungos lygmeniu. Bene reikšmingiausias ES dokumentas socialinės politikos srityje yra Europos socialinė chartija, kurioje akcentuojama darbo santykiai ir socialinė apsauga. Be šio dokumento paminėtini Lisabonos ir Europos Sąjungos darnios plėtros strategijos, kuriose ryškiau pabrėžtos socialinės ir ekonominės politikos sąsajos. Europa, reaguodama į greitai besikeičiantį pasaulį, kuriame vyksta globalizacijos procesai, 2000 m. patvirtino Lisabonos strategiją. Joje buvo numatytas ambicingas tikslas – per 10 metų ES paversti labiausiai konkurencinga ir sparčiausiai augančia ekonomika. 2005 m., remdamasi Lisabonos strategijos įgyvendinimo penkerių metų patirtimi, Europos Vadovų Taryba nusprendė iš esmės atnaujinti strategiją ji perskirstė prioritetus, daugiausia dėmesio skiriant ekonomikos augimui ir užimtumui, sutelkiant visus atitinkamus nacionalinius ir 586 ‘‘Societal Innovations for Global Growth‘‘, 2012, No. 1(1) ISSN 2335-2450 (online) ES išteklius. Antra vertus Lisabonos strategijos įgyvendinimas laikomas svarbiu ES socialinės politikos įgyvendinimo priemonių bei prioritetų. Lisabonos strategija – ES tvaraus ekonomikos augimo skatinimo ir darbo vietų kūrimo strategija – skatinama diegti naujoves įmonėse ir investuoti į žmones, siekiant kurti žiniomis grindžiamą visuomenę. Ypatingas dėmesys skiriamas mokymuisi visą gyvenimą bei mokslinių tyrimų ir plėtros skatinimui. Strategija taip pat siekiama užtikrinti, kad daugiau žmonių turėtų darbą, kad ilgėjant gyvenimo trukmei būtų ilgiau tęsiama profesinė veikla, o taip pat pritaikyti socialinės apsaugos sistemas atsižvelgiant į naujas sąlygas ir globalizaciją Turėtų būti modernizuojamas Europos socialinis modelis, investuojama į žmones ir kuriama gerovės valstybė. Būtinas naujas požiūris: lankstumas darbo rinkose turėtų būtų suderintas su tvirtomis socialinės apsaugos garantijomis, t. y. turėtų būti užtikrinta darbo rinkos lankstumo ir užimtumo garantijų pusiausvyra. Taigi vienas iš svarbių atnaujintos Lisabonos programos principų yra socialinės politikos, ekonomikos augimo bei užimtumo tikslų derinimas. Europos Sąjungos darnios plėtros strategijoje, kuri buvo priimta 2001 m. Gothenburge, nagrinėjamos kelios svarbiausios problemos, nustatyti šie darnaus darnios plėtros prioritetai: pasaulinės klimato kaitos sušvelninimas; transporto poveikio aplinkai mažinimas; pavojaus žmonių sveikatai mažinimas; efektyvesnis gamtos išteklių naudojimas; skurdo ir socialinės atskirties mažinimas; visuomenės senėjimo problemų sprendimas. Europos Sąjungos darnios plėtros strategijoje teigiama, kad ekonominio ir socialinio regionų plėtros netolygumai, didėjantys gyventojų gerovės skirtumai – vienas iš didžiausių darnios plėtros pavojų. 4. Lietuvos socialinės politikos prioritetai, atsižvelgiant į Europos Sąjungos strateginius dokumentus Lietuvos Respublikos Seimas 2002 m. lapkričio 12 d. priėmė nutarimą „Dėl valstybės ilgalaikės raidos strategijos“. Valstybės ilgalaikės raidos strategijos pagrindinis tikslas – sukurti aplinką plėtoti šalies materialinei ir dvasinei gerovei. Tai leistų sudaryti sąlygas plėtoti žmogaus pasirinkimo galimybes visais aspektais – ekonominiu, socialiniu, kultūriniu ir politiniu; investuojant į švietimą, lavinimą ir sveikatos apsaugą užtikrinti žmogaus galimybių didinimą. sudaryti sąlygas naudoti šias galimybes ekonominei ir kūrybinei veiklai, politikai, visuomeniniam gyvenimui bei poilsiui. Strategijoje išskiriami šie ilgalaikiai valstybės raidos prioritetai: žinių visuomenė, saugi visuomenė ir konkurencinga ekonomika. Socialinės apsaugos srityje akcentuojami šie prioritetai - užimtumo didinimas, nedarbo mažinimas, darbo vietų kokybės gerinimas, socialinio draudimo sistemos plėtra, socialinės paramos plėtra ir skurdo bei 587 ‘‘Societal Innovations for Global Growth‘‘, 2012, No. 1(1) ISSN 2335-2450 (online) socialinės atskirties įveikimas, gyvenimo kokybės gerinimas ir socialinės partnerystės stiprinimas. 2005 metais pakoregavus Lisabonos strategiją buvo nuspręsta, kad šalys narės privalės rengti nacionalines Lisabonos strategijos įgyvendinimo programas, o kiekvienais metais teiks Europos Komisijai jų įgyvendinimo pažangos ataskaitas. Lietuvos Respublikos Vyriausybė 2005 m. lapkričio 22 d. priėmė nutarimą „Dėl nacionalinės Lisabonos strategijos įgyvendinimo programos“. Nacionalinėje Lisabonos strategijoje akcentuojama užimtumo didinimo ir investicijų į žmoniškąjį kapitalą didinimo svarba, numatomos ir struktūrinės reformos sveikatos apsaugos bei pensijų sistemos srityje, o taip pat didinti investicijas į mokslą. Rengiant Vyriausybės programos priemonių sąrašą, atsižvelgiama į nacionalinės Lisabonos strategijos įgyvendinimo programos prioritetus ir tikslus. 2003 m. LR vyriausybė parengė Nacionalinę darnios plėtros strategiją, kuri 2009 metais buvo patobulinta. Patvirtinta darnios plėtros strategija apima laikotarpį nuo 2003 metų iki 2020 metų. Lietuvos darnios plėtros strateginiai prioritetai ir principai išdėstyti atsižvelgiant į nacionalinius Lietuvos interesus, savitumą, Europos Sąjungos darnios plėtros strategijos, kitų programinių dokumentų nuostatas. Į Strategiją buvo įtraukti Lietuvai svarbūs Europos Sąjungos darnios plėtros strategijos prioritetai – pavojaus žmonių sveikatai mažinimas, pasaulinės klimato kaitos ir jos padarinių švelninimas, biologinės įvairovės apsauga, nedarbo, skurdo ir socialinės atskirties mažinimas. Svarbiausi darnios plėtros strateginiai tikslai – suderinti aplinkosaugos, ekonominės ir socialinės plėtros interesus, užtikrinti švarią ir sveiką aplinką, efektyvų gamtos išteklių naudojimą, visuotinę ekonominę visuomenės gerovę, stiprias socialines garantijas ir per darnios plėtros strategijos įgyvendinimo laikotarpį (iki 2020 metų) pagal ekonominius, socialinius ir gamtos išteklių naudojimo efektyvumo rodiklius pasiekti esamą ES valstybių vidurkį, o pagal aplinkos taršos rodiklius neviršyti ES leistinų normatyvų, įgyvendinti tarptautinių konvencijų, ribojančių aplinkos taršą ir poveikį į pasaulio klimatui, reikalavimus. Lietuvai svarbūs ir šie Europos Sąjungos darnios plėtros strategijos prioritetai – pavojaus žmonių sveikatai mažinimas, pasaulinės klimato kaitos ir jos padarinių švelninimas, biologinės įvairovės apsauga, nedarbo, skurdo ir socialinės atskirties mažinimas. 5. Socialinė apsauga kaip pagrindinis socialinės politikos elementas Socialinė politika kaip matėme yra susijusi su plačiu veiklos spektru, apimdama ir ekonominį aspektą. Socialinė apsauga, būdama socialinės politikos pagrindu, yra susijusi 588 ‘‘Societal Innovations for Global Growth‘‘, 2012, No. 1(1) ISSN 2335-2450 (online) su konkrečiomis priemonėmis, leidžiančiomis socialinės rizikos atvejais visoms visuomenės socialinėms grupėms išsaugoti garantijas į nustatytą minimalų gerovės lygį. Socialinė apsauga yra būtinas gerovės valstybės elementas. Pasak Pietrs (1998) socialinė apsauga, tai vieningai reguliuojamų ir administruojamų priemonių visuma, taikoma konkrečiam socialinės rizikos atvejui. Šiuolaikinės socialinės apsaugos ištakos yra Vokietijoje, kai valstybės kancleris Otto Bismarkas pirmasis pradėjo diegti socialinės apsaugos idėjas valstybės mastu ir jo iniciatyva pirmą kartą Europoje buvo įkurtos sveikatos ir pensijos draudimo sistemos ( Lazutka, 2001). Po to panašios sistemos buvo įkurtos ir kitose Europos šalyse. Socialinės apsaugos sistema skirtinga įvairiose šalyse, nes tam įtakos turi politinė, socialinė, ekonominė šalies raida, bei jos ekonominės galimybės. Socialiniai apsaugos modelių įvairovė gali būti klasifikuojama pagal įvairius kriterijus. Pagal danų sociologą Esping-Andersen (1990), priklausomai nuo valstybės ir rinkos reikšmės užtikrinant visuomenės gerovę, gali būti trys pagrindiniai visuomenės gerovės modelių tipai: liberalusis, konservatyvusis (korporacinis) ir socialdemokratinis. Kadangi modelio tipą lemia valstybėje įdiegti socialinės apsaugos principai, tai šią klasifikaciją galima taikyti ir socialinės apsaugos modeliams. Marginaliniame ( liberaliame) modelyje pirmenybė užtikrinant šalies gerovę teikiama rinkai, o ne valstybei. Individas skatinamas dalyvauti rinkoje ir taip pačiam užsitikrinant gerovę. Valstybė teikia tik ribotą paramą tiems, kurių pajamos yra mažesnės už nustatytą ribą arba nepajėgūs apsirūpinti patys tuo sušvelnindama skurdo, nelygybės ir nedarbo problemas. Labiausiai šiam modeliui artimos liberalios ekonomikos šalys – Kanada, JAV, Didžioji Britanija. Instituciniame (socialdemokratiniame) modelyje pirmenybė užtikrinant šalies gerovę teikiama valstybei. – teikia paramą visiems, paveiktiems socialinės rizikos, neatsižvelgiant į pajamas. Būtent valstybė prisiima didžiausią atsakomybę užtikrinant kiekvienam valstybės piliečiui materialinę gerovę, remdama visiško užimtumo politiką, šalindama skurdo nedarbo, nelygybės priežastis efektyvia mokesčių politika, didelėmis išmokomis (Bernotas, Guogis, 2003). Valstybė teikia paramą visiems, paveiktiems socialinės rizikos, neatsižvelgiant netgi į gaunamas į pajamas. Prie socialdemokratinio modelio gerovės valstybių priskirtinos Šiaurės Europos šalus – Švedija, Danija, Norvegija. Korporacinio (konservatyviojo) modelio svarbiausias bruožas – įsipareigojimas, remiantis tradicijomis, socialiai apsaugoti šeimą, t.y. socialinė parama teikiama tada, kai šeima nepajėgia išspręsti savo problemų ir palaikyti nustatytą gerovės lygį. Tačiau parama teikiama remiantis socialinio draudimo principu, t.y. šeima gali pretenduoti į socialinę paramą tik tuo atveju, jeigu jos nariai moka socialines draudimo įmokas 589 ‘‘Societal Innovations for Global Growth‘‘, 2012, No. 1(1) ISSN 2335-2450 (online) (Guogis ir kt., 2000). Tokiam gerovės modeliui artimos Centrinės Europos šalys – Austrija, Belgija, Prancūzija, Vokietija. Skirtingų modelių pasirinkimas skirtingose šalyse priklauso nuo politinių, socialinių, ekonominių, istorinių veiksnių, visuomenėje vyraujančių vertybių, tačiau įtakojant integracijos bei globalizacijos procesams, jie ima panašėti. Europoje formuojantis vieningai ekonominei erdvei, ima panašėti ir socialinė apsauga. 6. Socialinės apsaugos sistema Lietuvoje Vos tik atkūrus Lietuvos nepriklausomybę, buvo sukurta šiuolaikinė Lietuvos Respublikos socialinės apsaugos sistema, pertvarkant paveldėtą sovietinę socialinę apsaugą į šiuolaikinę. 1990-1991 metais buvo įteisinti pagrindiniai ir iki šiol galiojantys socialinės apsaugos principai ir sukurtos pagrindinės jos vykdomosios institucijos. Pagrindinės teisės į socialinę apsaugą garantuojamos Lietuvos Respublikos Konstitucijoje. 52 straipsnis numato piliečių teisę gauti senatvės ir invalidumo pensijas, socialinę paramą nedarbo, ligos, našlystės, maitintojo netekimo ir kitais įstatymo numatytais atvejais. 48 straipsnis garantuoja teisę į socialinę apsaugą nedarbo atveju, 39 straipsnis socialinę paramą šeimoms. Lietuvai įstojus į ES, buvo ratifikuoti tarptautiniai dokumentai, kurie daro įtaką Lietuvos socialinės politikos bei socialinės apsaugos raidai. Svarbiausi iš jų - Europos socialinė chartija ratifikuota 2001metais, Europos socialinės apsaugos kodeksas, pasirašytas 2005m. lapkričio 21d., kuris skatina priartinti Lietuvos socialinės apsaugos standartus prie europinių standartų bei Europos Tarybos reglamentai. Reglamentas 1408/71 reikalauja, kad ES šalių – narių migruojantys darbuotojai ir jų šeimos nariai išsaugotų visas jiems priklausančias garantijas. Reglamentai 1408/71/EEC ir 574/72/EEC – nustato, jog bet kurios valstybės narės darbuotojui taikomi tik vienos valstybės teisės aktai, tačiau vienoje valstybėje narėje įgytos socialinės teisės išsaugojamos bet kurioje kitoje valstybėje narėje. Socialinė apsauga apima visas priemones, kurių imasi valstybės arba privačios institucijos, siekdamos palengvinti namų ūkiams ir asmenims tenkančią tam tikrų rizikos veiksnių naštą. Tai gali būti visuma priemonių kaip: kompensacija už šildymą, bedarbio pašalpa ar socialinio darbuotojo slauga, nepriklausantis nuo jų pačių darbo ar uždarbio netekimas, parama ligos, negalios, motinystės, maitintojo netekimo ir kitais atvejais. Socialines paslaugas teikia valstybės savivaldybių institucijos, nevyriausybinės organizacijos, religinės bendruomenės, fiziniai bei juridiniai asmenys. Lietuvos socialinė apsaugos sistema susideda iš socialinio draudimo ir socialinės paramos. Privalomai valstybiniu socialiniu draudimu draudžiami dirbantys asmenys 590 ‘‘Societal Innovations for Global Growth‘‘, 2012, No. 1(1) ISSN 2335-2450 (online) pagal darbo sutartis, narystės pagrindais renkamose institucijose, ūkinėse bendrijose, žemės ūkio bendrovėse ar kooperatyvinėse organizacijose, individualių įmonių savininkai bei jiems prilyginti savarankiškai dirbantys asmenys, ūkininkai ir pilnamečiai jų vaikai. Motinas (tėvus), kurie turi vaikų 1-3 metų priežiūros atostogas, taip pat motinas (tėvus), kurie nedirba ir neturi atostogų, bet augina vaikus iki 3 metų, privalomai pensijų draudimu draudžia valstybė savo lėšomis. Socialinis draudimas remiasi įmokų – išmokų principu. Teisę gauti socialinio draudimo išmokas įgyja tie, kas įstatymo numatytą laiką mokėjo įstatymo nustatyto dydžio socialinio draudimo įmokas. Į kitus faktorius (gavėjo turtą ir pajamas, šeimos sudėtį ir pan.) paprastai neatsižvelgiama – svarbiausias yra draudimo įmokų mokėjimo faktas. Socialinė parama – remiasi poreikio principu. Jos priemonėmis užtikrinama, kad kiekvienas asmuo (šeima), kuris neturi pakankamai lėšų pragyvenimui ir kuris negali gauti tokių lėšų savo pastangomis, ar iš kitų šaltinių, gautų reikiamą paramą. Teisė gauti išmokas priklauso nuo gavėjo turtinės padėties ir dažniausiai suteikiama šią padėtį atitinkamai įvertinus. Socialinės apsaugos išlaidas sudaro socialinės apsaugos išmokos pinigais ir natūra asmenims, kuriems gresia susidurti su socialine rizika arba jau susidūrusiems su ja, administracinės ir kitos išlaidos. Socialinėms išlaidos padengti reikalingas finansavimas. Finansavimo šaltiniais yra dirbančiųjų ir darbdavių socialinio draudimo įmokos, vyriausybės subsidijos, savivaldybių lėšos. Socialinis draudimas finansuojamas privalomomis įmokomis, priskaitomomis nuo dirbančiųjų darbo užmokesčio. Savarankiškai dirbantieji moka fiksuotą sumą ir/ar įmokas nuo apmokestinamųjų pajamų. į savarankišką Valstybinio socialinio draudimo fondą. Sveikatos draudimui lėšos surenkamos į savarankišką Privalomojo Sveikatos draudimo fondą. Socialinė parama finansuojama nacionalinio biudžeto lėšomis (valstybės ir savivaldybių). 7. Lietuvos socialinės apsaugos sistemos pajamų ir išlaidų analizė Europos Sąjungos kontekste Socialinės apsaugos išlaidos pagal panaudojimą skirstomos į socialinės apsaugos išmokas (pinigais ir natūra) bei socialinėms paslaugoms teikti, administracines išlaidas ( gavėjų registracija, finansų administravimas ir kitos valdymo išlaidos), bei kitas išlaidas (palūkanos, pajamų ar turto mokesčiai bei panašios išlaidos). Pagal LR Statistikos departamento duomenis 2010 m. 96% visų socialinei apsaugai skirtų išlaidų buvo panaudota socialinės apsaugos išmokoms ir bei socialinėms paslaugoms finansuoti, 2% 591 ‘‘Societal Innovations for Global Growth‘‘, 2012, No. 1(1) ISSN 2335-2450 (online) buvo skirti administracinėms išlaidoms padengti, bei tiek pat kitoms išlaidoms. Tokia išlaidų struktūra buvo būdinga visam 2005 – 2010 metų laikotarpiui su nežymiais skirtumais. Kaip rodo Eurostato duomenys, panaši išlaidų struktūra yra ir kitose ES šalyse, tiesa ji šiek tiek kinta priklausomai nuo šalies. Socialinės apsaugos išmokų struktūra 2010 metais, pateikta 1 pav., rodo, jog didžiausia dalis socialinių išmokų tenka pensijoms (41 proc.), išmokos sveikatos priežiūrai (26 proc.), šeimoms (12 proc.) bei išmokoms neįgaliems asmenims (10 proc.). Kitoms išmokoms buvo skirta, palyginti nedidelė išlaidų dalis. Nedarbas 4% Būstas 0,01% Kita 4% Našlystė 3% Šeima ir (arba) vaikai 12% Liga ir (arba) sveikatos priežiūra 26% Negalia 10% Senatvė 41% Šaltinis: Statistikos departamento duomenys, prieiga per internetą www.stat.gov.lt (žiūrėta 2012 09 12). 1 pav. Socialinės apsaugos išmokų struktūra Lietuvoje, 2010 m. Socialinė apsaugos politika visose ES šalyse – narėse praktiškai remia tas pačias gyventojų grupes kaip ir Lietuvoje (2 pav.). Kaip ir Lietuvoje didžiausia dalis socialinių išmokų tenka pensijoms (39 proc.) bei išmokoms sveikatos priežiūrai (26 proc.), kurių dydžiai nedaug skiriasi nuo išmokų šioms grupėms Lietuvoje. Išmokos abiems šioms gavėjų grupėms Lietuvoje sudaro 67 proc. visos išmokų dalies, o vidutinis jų dydis Europos Sąjungoje sudaro 69 proc. Kitoms gavėjų grupėms ES socialinės apsaugos išmokos paskirstytos tolygiau negu Lietuvoje Kai kurių ES šalių socialinės apsaugos išlaidos tenkančios vienam šalies gyventojui, (eurais) pateikti 3 paveiksle. 592 ‘‘Societal Innovations for Global Growth‘‘, 2012, No. 1(1) ISSN 2335-2450 (online) Būstas 2% Liga 30% Senatvė 39% Šeima 8% Bedarbystė 6% Negalia 8% Kiti atvejai 1% Našlystė 6% Šaltinis: Eurostato duomenys, prieiga per internetą http://ec.europa.eu/social/main.jsp?langId=en&catId=89&newsId=1157&furtherNews=yes (žiūrėta 2012 09 12). 2 pav. Socialinės apsaugos išmokų struktūra ES šalių – narių lygiu, 2010 m. 10000.0 8000.0 8705.0 6208.6 6000.0 4000.0 1378.1 2000.0 785.9 1286.2 1278.1 Latvija Lietuva Lenkija 0.0 ES šaliųnarių vidurkis Estija ES šalių-narių vidurkis Estija Latvija Lietuva Lenkija Švedija Švedija Šaltinis: Eurostato duomenys, prieiga per internetą http://ec.europa.eu/social/main.jsp?langId=en&catId=89&newsId=1157&furtherNews=yes (žiūrėta 2012 09 14). 3 pav. Socialinės apsaugos išlaidos tenkančios vienam šalies gyventojui (eurais), 2010 m. 593 ‘‘Societal Innovations for Global Growth‘‘, 2012, No. 1(1) ISSN 2335-2450 (online) 3 paveiksle pateiktos socialinės apsaugos išlaidos tenkančios vienam analizuojamos šalies gyventojui bei vidutinės socialinės apsaugos išlaidos, tenkančios vienam ES gyventojui. Keturių ES šalių – Estijos, Latvijos, Lietuvos ir Lenkijos situacija panaši. Socialinės apsaugos išlaidos tenkančios vienam šių šalių gyventojui skiriasi nedaug, tačiau jos stipriai atsilieka nuo ES šalių – narių vidurkio ir dar daugiau nuo Švedijos. Pastarojoje šalyje socialinė apsauga yra kur kas stipriau išplėtota negu nagrinėjamose šalyse arba apskritai Europos Sąjungoje - čia vienam šalies gyventojui tenka 8705 eurų socialinės apsaugos išlaidų. Tai sudaro 40 proc. daugiau už ES vidurkį. 2010 metų Lietuvos socialinės apsaugos sistemos pajamų struktūrą pateikta (4pav.). Kitos pajamos, 1.4% Valdžios sektoriaus įmokos, 33.7% Darbdavių socialinės įmokos, 49.3% Apdraustų asmenų socialinės įmokos, 15.6% Šaltinis: Statistikos departamento duomenys, prieiga per internetą www.stat.gov.lt (žiūrėta 2012 09 26). 4 pav. Socialinės apsaugos pajamų struktūra Lietuvoje, 2010 m. Didžiausia dalis įplaukų socialinėms apsaugos išlaidoms padengti gauta iš darbdavių socialinių įmokų (4 pav.). Jos 2010 metais sudarė 49,3 proc. visų socialinėms apsaugos sistemos įplaukų. Valdžios sektoriaus, t.y. valstybės ir savivaldybių biudžetų, įmokos sudarė taip pat nemažą dalį visų įplaukų, t.y. 33,7 proc. visų pajamų. Iš jų 4319 mln. litų (77,9 proc.) buvo valstybės biudžeto įmokos, o 1222 mln. litų, arba 22,1 proc. gauta iš savivaldybių biudžetų. Apdraustųjų asmenų įplaukos sudarė 15,6 proc. visų įmokų sumos. Kitos pajamos sudarė nežymią dalį socialinėms apsaugos sistemos įplaukų - tik 1,4 proc. Jeigu palyginsime Lietuvos socialinės apsaugos sistemos pajamų struktūrą su ES šalių – narių socialinės apsaugos vidutinių pajamų struktūra (5 pav.), tai matysime, jog šios struktūros analogiškos mokėtojų požiūriu lygiu, tačiau procentiniai mokėtojų įmokų 594 ‘‘Societal Innovations for Global Growth‘‘, 2012, No. 1(1) ISSN 2335-2450 (online) dydžiai skiriasi. su statistiniais 2009 metais duomenimis pateikta 8 paveiksle procentiniais dydžiais nuo BVP. Kiti gavimai, 1.3% Valdžios įmokos, 11.8% Darbdavių socialinės įmokos, 11.1% Socialinės įmokos iš apdraustųjų, 6.1% Šaltinis: Eurostato duomenys, prieiga per internetą http://ec.europa.eu/social/main.jsp?langId=en&catId=89&newsId=1157&furtherNews=yes (žiūrėta 2012 09 26). 5 pav. Socialinės apsaugos pajamų struktūra, ES šalių – narių lygiu, (proc. nuo BVP), 2010 m. 5 pav. pateikti 2010 m. duomenys procentiniais dydžiais nuo ES šalių – narių BVP vidurkio. Atitinkamai perskaičiavę šiuos duomenis, gauname, jog didžiausia pajamų dalis, skirta ES šalių – narių socialinėms išlaidoms padengti, įplaukė iš valdžios sektoriaus - apie 39 proc. visų įplaukų ir tai beveik 5 proc. daugiau negu Lietuvoje. Tuo tarpu darbdavių įmokos sudarė tik apie 37 proc. visų įmokų ir tai daugiau kaip 12 proc. mažiau negu darbdavių dalis Lietuvoje. Tačiau apdraustųjų asmenų įmokų dalis apie 4,4 proc. buvo didesnė negu Lietuvos apdraustųjų ir sudarė apie 20 proc. visų įmokų. Kitos pajamos ES šalių lygiu taip pat buvo didesnės negu Lietuvoje ir 2010 metais siekė apie 4,3 proc. Išvados Straipsnyje atlikta analizė leidžia teigti, jog: 1. Europos Sąjungos socialinė politikos principus reglamentuojančiuose ir kituose strateginiuose teisės aktuose atspindėtas sąsajos tarp socialinės, ekonomikos ir užimtumo politikų. 2. Lietuvos socialinės politikos prioritetai įteisinti, atsižvelgiant į Europos Sąjungos dokumentus. 3. Lietuvos socialinės apsaugos sistema atitinka Europos Sąjungos socialinės apsaugos principus, jos pajamų ir išlaidų struktūra iš esmės atitinka Europos Sąjungos šalių vidurkio struktūrą su atskirais neesminiais nukrypimas, tačiau jos, kaip mūsų šalių – 595 ‘‘Societal Innovations for Global Growth‘‘, 2012, No. 1(1) ISSN 2335-2450 (online) kaimynių, socialinė apsaugos lygis žymiai atsilieka nuo Europos Sąjungos vidurkio ir dar daugiau nuo Europos Sąjungos šalių su išplėtota socialinės apsaugos sistema. Literatūra Bernotas, D., Guogis, A. (2003). Socialinės politikos modeliai: dekomodifikacijos ir savarankiškai dirbančiųjų problemos. Vilnius: LTU. Beržinskienė, D., Martinkus B. (2001). Nedarbas ir ekonominės bei socialinės jo pasekmės, Inžinerinė ekonomika, Nr. 2, pp. 57- 60. Dunajevas, E. (2009). Socialinių paslaugų sistemos raida gerovės pliuralizmo požiūriu. Sociologija. Mintis ir veiksmas, T.2, Nr. 25, pp. 14 – 26. Esping-Andersen, G. (1990). The three worlds of welfare capitalism. Cambridge: Policy press. Goodin, R.E., Headey, B., Mufelis, R., Dirvon, H.J. (1999). The real world of welfare capitalism. Cambridge: Cambridge University Press. Guogis, A. (2000). Socialinės politikos modeliai. Vilnius: Eugrimas. Guogis, A., Bernotas, D., Ūselis, D. (2000). Lietuvos politinių partijų samprata apie socialinę apsaugą. Vilnius. Guogis, A. (2010). Ar reikia kitokio Lietuvos visuomenės socialinio raidos modelio?, Socialinių mokslų studijos, T. 3, Nr. 7, p. 19-35. Gruževskis, B., Bartkus, A. (2010). Senatvės pensijos draudimo Lietuvoje netobulumai ir jų sprendimo galimybės. Sociologija ir socialinė politika. Socialinis darbas , T. 9, Nr. 1, p.26 -38. Indrašienė, V., Katkonienė, A. (2011). Pagalbos namuose paslaugų teikimo vertinimas. Socialinis darbas , T. 10, Nr. 2, p. 267-278. Jančaitytė, R. (2011). Pilietinės visuomenės vaidmuo priimant šeimos politikos sprendimus. Socialinis darbas, T. 10, Nr. 2, p. 289-300. Kazlauskienė, A., Ostrauskienė, I. (2010). Assessment of quality of social servises in Lithuania: context of conceptions of quality and assessment criteria. Socialiniai tyrimai, T. 1, Nr. 18, p. 76-83. Mališauskaitė, I., Lazutka, R. (2003). Europos Sąjungos PHARE programos parama Lietuvos socialinės politikos plėtrai. Vilnius: UAB „Adomo Jakšto spaustuvė“. Medaiskis, T. (2011). Socialinės apsaugos esmė ir pagrindiniai principai. Socialinės apsaugos ekonomika . Vilnius: VU. Papirtis, L.V., Bitinas, A. (2010). Socialinio teisingumo įgyvendinimo problematika finansuojant socialinės saugos sistemą. Socialinių mokslų studijos, T. 3, Nr. 7, p. 37-58. Pieters, D. (1998). Įvadas į pagrindinius socialinės apsaugos principus. Vilnius: Eugrimas. Rakauskienė, O.G., Bivainis, J. (1999). Lietuvos ūkio integracijos į Europos Sąjungą ekonominių ir socialinių pasekmių vertinimo metodologinės nuostatos. Organizacijų vadyba: sisteminiai tyrimai. Kaunas:VDU. Rodger, J.,J. (2000). From welfare state to a welfare society. London. Socialinė apsauga Lietuvoje. (2012). Vilnius. Stephan, L., Pierson, P. (2002). Social policy. Vilnius: Vilniaus universitetas, TSPMI. Tartilas, J. (2005). Socialinės saugos pagrindai. Vilnius: MRU Leidybos centras. Žalimienė, L. (2003). Socialinės paslaugos. Vilnius: VU, Specialiosios psichologijos laboratorija. LR statistikos departamento duomenų bazė www.stat.gov.lt 596 ‘‘Societal Innovations for Global Growth‘‘, 2012, No. 1(1) ISSN 2335-2450 (online) Eurostato duomenų http://ec.europa.eu/social/main.jsp?langId=en&catId=89&newsId=1157&furtherNews=yes bazė SUMMARY The Principles of Social Policy in European Union and Lithuania Prof. dr. Gediminas Davulis The article deals with main theoretical aspects of social policy in the European Union and Lithuania. The concept of social policy and its aims and tasks in EU are presented. The links between social and economic policies and priorities of social policy in EU are analysed. The aspects of social and economic policy in the strategical dokuments of European Union and Lithuania and priorities of social policy in Lithuania are considered. The social security policy in Lithuania is discussed more detailed. The content of social security policy, it courses of development, problems and aims, main models of social security are discussed. The comparative analysis of spending, income, their structure of social security in Lithuania are analyzed in the context of EU. Key words: social policy, economic policy, social security policy, sustainable development. 597 ‘‘Societal Innovations for Global Growth‘‘, 2012, No. 1(1) ISSN 2335-2450 (online) LITHUANIAN MAIN FOREIGN TRADE PARTNERS Assoc. Prof., dr. Vladas Rimkus Department of International Commerce and Duties Faculty of Economics and Financial Management Mykolas Romeris University Ateities g. 20, LT-08303 Vilnius, Lithuania E-mail: [email protected] Abstract Today all the countries carry out international trade, it is important therefore for Lithuania to develop its participation in the international trade, specialization in producing, and cooperation, all the more that the membership of Lithuania in the European Union gives an opportunity to base on the total EU market and to ensure the economic development of the country. Export development is a prerequisite for economic growth. The meaning of the foreign trade value for the Lithuanian economy was especially during the global economic financial crisis, it showed how dependent the economy of Lithuania is from the successful activity of related markets. Changes in trade also affected intra-industry trade. The growing expansion of intra-industry trade in the world trade is important for the individual countries economies and for the export and import structure. These double-sided trade exchanges occur between the most similar counties in technologically, economics and markets structure. This kind of trade concludes the largest part of world trade share. Some economists think that the intra-industry trade is based on monopolistic competition and economies of scale, which point that any countries located close to each other will trade with each other in similar products the more intensively, the more they are similar to each other both with regard to economic development and geographical resources. Various indices are used to assess the intensiveness of the intraindustry trade. Calculations provided in the article are carried out by applying the Grubel-Lloyd index, which is the most frequently used for this purpose. The largest 598 ‘‘Societal Innovations for Global Growth‘‘, 2012, No. 1(1) ISSN 2335-2450 (online) foreign trade partner countries were selected for the analysis as follows: Russia, Germany, Latvia and Poland Keywords: export, import, intra - industry trade, Grubel-Lloyd index. 1. Introduction Lithuania is a comparatively small country, it cannot therefore produce all the necessary products. The country takes a part in the international sharing process, which helps to use the available resources of a country in a more effective way, to produce a high quality and competitive production and to participate in the international exchange of goods as well as in the international trade. The Republic of Lithuania trades with many countries all over the world. Last year, it is, in 2011, goods were exported into 182 countries, and goods were imported into Lithuania from 159 countries.1 Figure 1 shows trends of the Lithuanian foreign trade and GDP for the years 2005 2011. There is distinctly seen a negative impact of the last economic financial crisis on the country's economy. In 2009 compared to 2008, GDP decreased by 18,0 percent, exports of goods - by 26,6 per cent., imports - by 37,9 per cent. On the positive side, imports contracted more than exports, leading to the decrease of foreign trade deficit. In 2010 - 2011, the situation started to improve. In 2010 compared to 2009, GDP grew by 3,4 per cent, exports – 32,7 per cent, imports – 34,5 per cent. In 2011 compared to 2010, GDP grew by 11,5 per cent, exports – by 28,9 per cent, imports - by 29,2 per cent. Calculations that during the period 2000 – 2005 both the country‘s export / GDP ratio and foreign trade turnover / GDP ratio has been constantly increasing and the last index exceeded the limit of one in 2005. Data shows that after 2005 the tendencies of both the indices used to change. Especially significant changes were caused by economic and financial crisis. In 2009 both the analyzed indices decreased, but the next two years were the period of significant growth in these indices. In 2010 the foreign trade indices exceeded the level noticed in 2007. In 2011 the foreign trade turnover exceeded the level reached in 2010 by 28,5 per cent. Such the growth was based on comprehension that exports only can help the country‘s economy to get out of the economic crisis. 1 Here and in other cases, when there is no reference to any statistical data, the data received from Lithuanian Department of Statistics is used as a source. 599 ‘‘Societal Innovations for Global Growth‘‘, 2012, No. 1(1) ISSN 2335-2450 (online) 120000 112084 100000 99229 91914 61503 60000 53274 55510 Balance 78812 73006 72402 20000 95074 83227 80000 40000 106019 69576 60952 54038 45859 45311 43192 43151 38888 38806 40732 36649 32767 29498 28295 25631 28239 Eksport Import Export of Lithuanian origin GDP 0 2005 2006 2007 2008 2009 2010 2011 -4579 -6914 -9236 -10384 -20000 -14386 -18311 -17496 Figure 1. Lithuanian foreign trade and GDP in 2005-2011 (LTL million). Changes in trade also affected intra-industry trade. Countries carry out their trading activity in two ways: trade among industrial branches – when a country sells to another country any production of any single industrial branch and purchases from it any production of any other industrial branch, and the intra-industry trade. Interest in the intra-industry trade increased about in 1960-1970, when this international trade phenomenon was noticed, which couldn‘t be explained by any traditional trade theories. Up to then, the international trade and science in the international trade were clear and simple. A trade between branches, otherwise than the intra-industry trade, is an exchange carried out among any countries with different products of industrial branches. Such the trade is called the inter-industry trade. Countries trade with each other in products, which can be produced by them more than by any other countries due to larger resources, competitive advantage etc. Specialization increases the extent of production, and any surplus is exported and the inter-industry trade grows in this way, the role of international trade therefore increases. This trade is characterized by trade in homogenous goods and perfect competition. The inter-industry trade means exchange with products with different need for production factors. Any countries having 600 ‘‘Societal Innovations for Global Growth‘‘, 2012, No. 1(1) ISSN 2335-2450 (online) large skilled labour force reserves tend to export more complex products, while any countries having large reserves of natural resources export goods of these reserves. A big part of such inter-industry trade is carried out among the countries having different resources and extent thereof and can be explained by the comparative advantage theory or any other theories. The intra-industry trade makes about a quarter of total international trade extent. Economists Balassa B. (1966), Ruffin R.J. (1999), Batiz R.L.A., Olivia M.A. (2003), H.Grubel and P.Lloyd (1975), Bernatonytė D. (2007, 2008, 2009), Carbaugh R.J. (2008), Krugman P.R., Obstfeld M. (2009) and other determined this type of trade as the trade in products of any single branch among any countries, when the countries import and export production of the same group of goods in the same industry branch. The intraindustry trade is carried out in differentiated products, it is, products which are an excellent mutual replacement of products. This trade model prevails in the countries, where the average income of citizens is similar and the demand preferences are similar. Reasons and consequence of the industrial branch production and its meaning and usefulness for the trade were the object of many researches. The most of carried out researches show that the more developed are countries, the more specialized is the structure of international trade, and the intra-industry trade prevails in the developed countries in the extent of general international trade (Bernatonytė D., Normantienė A., 2007. Despite of still increasing importance of the trade branch in the world economics, there hasn‘t been yet formed any theoretical basis, which would be reasoned and developed enough and could explain why two identical countries trade in similar products satisfying the same needs of consumers. Classical theories of international trade accentuating that trade has originated due to comparative advantage, uniqueness and singularity of countries or due to any difference in production factors, cannot explain the origin of the intra-industry trade. Otherwise, any similar countries, for example, Germany and France, are the biggest mutual international trade partners, which carry out import and export of similar products from and to each other. Some modern theories are therefore developed, which are based on monopolistic competition and economies of scale and emphasize that any countries located close to each other trade in similar products the more intensively, the more similar they are one to another both with regard to economic development level and consuming culture of citizens, and available economical and geographical resources (Ruffin J.R., 1999). Reasons for intra-industry trade and its meaning to structural regulation and trade were the topic of many studies. Traditional theories, such as comparative advantage or usefulness factors, determine that countries with different resources and production factors will trade with each other. However, empirical researches show that countries 601 ‘‘Societal Innovations for Global Growth‘‘, 2012, No. 1(1) ISSN 2335-2450 (online) of a similar level of development nowadays trade more indeed. Monopolical competition based on new theories, and increasing turnover cause the intra-industry trade among countries, and the comparative advantage is still applied to those less developed countries. Various methods are applied trying to assess the importance of the intra-industry trade. The first works on this theme were presented by Bela Balasas in 1966. But the most often used indicator to measure the extent of intra-industry trade is that put forward by H.Grubel and P.Lloyd (1975). It calculates the part of balanced trade (overlap between exports and imports) in all trade in a given industry i: i X i M i ( Xi Mi ) X i Mi IITi , AB 1 (Xi Mi ) (Xi Mi ) i (1) where i is a certain explored group of products being traded among the countries A and B. IITi – index of intra-industry trade for industry i; Xi – value of export in industry i; Mi – value of import in industry i; Xi + Mi – total value of trade; Xi – Mi – trade balance industry i. The more the value IITi is closer to 1, the more important is the intra-industry trade, and otherwise, the closer the value IITi is to 0, the more important is the interindustry trade. If Xi or Mi are equal to 0, then there is no inter-industry trade at all and the IITi index is equal to 0, and this means that a country only exports or imports the production of the branch being explored, there is no intra-industry trade among the countries A and B at all. Then they specialize in self production and are net importers of a certain group of products or net exporters. When IITi is equal to 1, then countries trade with each other: a country exports the same amount as it imports. To sum up, the closer the value IITi is to 1, the bigger is the importance of intra-industry trade. Such an index doesn‘t show any direction of those goods, but merely acknowledges the overlap level of trade in those goods among two countries. The index IITi can be expressed as a percentage. The article analyses changes in trade during the period 2005-2011 based on Lithuanian Department of Statistics data according to the Combined Nomenclature of goods. Object of the research is the trade among Lithuania and the abovementioned countries. Methods of the research as follows: analysis of scientific literature and description, Lithuanian foreign trade statistical data analysis. 602 ‘‘Societal Innovations for Global Growth‘‘, 2012, No. 1(1) ISSN 2335-2450 (online) 2. Main Lithuanian foreign trade partners In this period of development of globalization and integration the meaning of international trade grows fast. The international trade is the essential factor of economic growth and benefit of each country. It is an integral part of daily life because trade with each other trying to gain the biggest possible economic profit. The bigger is the gained profit, the better is the social life of a country. The international trade is a very complex process, which is influenced by various factors: economic situation in a country, political and legal aspects, level of economic integration, monetary policy and other factors. The international trade is especially important for small countries, which cannot produce all the necessary goods because of small available market and little production abilities. Today all the countries carry out international trade, it is important therefore for Lithuania to develop its participation in the international trade, specialization in producing, and cooperation, all the more that the membership of Lithuania in the European Union gives an opportunity to base on the total EU market and to ensure the economic development of the country. Figure 2 contains information about changes in the structure of Lithuania's exports by country groups. It should be noted that the EU share in the export structure of Lithuania in 2009 compared to 2008 increased by 4 percentage points. In the most difficult period exports to the EU declined slower than the other groups of countries. In 2010 and 2011, export development was more intensive to the CIS countries. Altogether comparing 2010-2011 with 2005-2007, the EU share of agriculture in the export structure of Lithuania decreased and that to the CIS countries increased. Figure 2 contains information about changes in the structure of Lithuania's exports by country groups. It should be noted that the EU share in the export structure of Lithuania in 2009 compared to 2008 increased by 4 percentage points. In the most difficult period exports to the EU declined slower than the other groups of countries. In 2010 and 2011, export development was more intensive to the CIS countries. Altogether comparing 2010-2011 with 2005-2007, the EU share of agriculture in the export structure of Lithuania decreased and that to the CIS countries increased. The main Lithuanian trade partner countries during long years remain the same: Russia, Latvia, Germany and Poland. The extent of export into Russia in 2011 was 16,6 per cent of total exports of the country, into Latvia – 10,2 per cent, into Germany - 9,3 per cent, and into Poland – 7,0 per cent. Beyond the limit of these four countries follow: Estonia – 6,6 per cent of total exports of the country, the Netherlands – 6,1 per cent, 603 ‘‘Societal Innovations for Global Growth‘‘, 2012, No. 1(1) ISSN 2335-2450 (online) Byelorussia – 5,2 per cent. In 2011, in comparison to the year 2010, the export increased by 28,9 per cent. Increased exports were influenced by the increased exports of petroleum products (40,2 per cent), means of land transport (42,6 per cent) and fertilizers (61,2 per cent). Exports of goods, except mineral products, increased by 25,5 per cent Exports of goods of Lithuanian origin increased by 25,2 per cent, excluding mineral products – by 20,4 per cent. Figure 3 displays changes in the import structure of Lithuania by groups of countries. Imports have changed under the influence of the crisis - the EU level decreased and the level of the CIS countries increased at the lower extent in the total imports structure. In part, this was because of decrease in the overall volume of raw materials imports at a lower degree than the total imports, thus the share of the CIS countries in the imports increased. The main Lithuanian import partner countries are Russia, Germany, Poland and Latvia. The extent of import from Russia in 2011 was 32,8 per cent of total imports of the country, from Germany - 9,7 per cent, from Poland – 9,1 per cent, and from Latvia 6,6 per cent. Beyond the limit of these four countries are the Netherlands – 4,9 per cent of total import of the country, Sweden– 3,3 per cent, and Italy – 3,2 per cent. In 2011, in comparison to the year 2010, the imports increased by 29,2 perc. Increased imports were caused by the increased imports of crude oil (30,2 per cent), means of land transport (48,5 per cent) and boilers, machines and mechanical equipment (31,3 per cent). EU 27 CIS EFTA Other counties 2011 2008 2005 0% 50% 100% EU 27 2005 65.7 2006 63.6 2007 64.8 2008 60.3 2009 64.3 2010 61.0 2011 61.3 CIS 17.8 21.2 24.5 25.7 23.4 27.0 27.7 EFTA 2.8 3.3 3.3 3.2 3.1 3.1 2.3 Other counties 13.8 11.9 7.5 10.8 9.2 8.9 8.7 Figure 2. Lithuanian exports by country union in 2005-2011, per cent. 604 ‘‘Societal Innovations for Global Growth‘‘, 2012, No. 1(1) ISSN 2335-2450 (online) EU 27 CIS EFTA Other counties 2011 2009 2007 2005 0% 20% 40% 60% 80% 100% EU 27 2005 65.7 2006 62.8 2007 68.3 2008 57.6 2009 59.1 2010 56.6 2011 56.7 CIS 17.8 27.9 21.9 33.9 32.9 35.7 35.8 EFTA 2.8 1.0 1.0 1.0 0.9 0.7 0.8 Other counties 13.8 8.3 8.7 7.6 7.1 7.1 6.7 Figure 3. Lithuanian imports by country union in 2005-2011, per cent. 3. Calculation results of intra-industry trade Based on the formula (1) the calculations of index of intra-industry trade by Combined Nomenclature sections between Lithuania and Russia, Latvia, Germany and Poland, which are provided in the Table 1 (green-colored index values equal to or exceeding 0,5; red-colored index values equal to or less than 0,1). Values of the IIT indices during the period 2004-2011 as follows: in case of trade with Russia – 0,34, with Latvia – 0,70, with Germany – 0,47, with Poland – 0,46. In this way, the biggest part of the intra-industry trade in the general trade extent with separate countries is in trade with Latvia, then with Germany, Poland and Russia. Lithuania and Latvia are neighbor countries, the size, development, cultural milieu, social aspects and size of market are similar. This causes the intensiveness of intraindustry trade. There is no group of goods, where the intra-industry trade is insignificant. Calculation results show that the most intensive intra-industry trade is in the following sections of goods: IX. Wood and articles of wood, VI. Products of chemical or allied industries, I. Live animals, XVII. Vehicles, aircraft and associated transport equipment, XVIII. Optical, photographic, medical instruments, etc., XI. Textile and textile articles, XV. Base metals and articles of base metal, and other products. The average 605 ‘‘Societal Innovations for Global Growth‘‘, 2012, No. 1(1) ISSN 2335-2450 (online) index in thirteen sections of goods of total 21 CN sections of goods in the intra-industry trade increased during the period 2008-2011 in comparison to the period 2005-2007. This shows the growing importance of intra-industry trade between Latvia and Lithuania. When Lithuania and Latvia joined the EU, some positive changes in trade among countries were observed. Data of the IIT analysis show that the character of trade has changed in certain sectors: it transformed from the inter-industry trade to the intraindustry trade. The most significant changes are observed in trade in: XVII. Vehicles, aircraft and associated transport equipment, XVI. Machinery and sectors of various appliances. One of possible reasons for the increased intra-industry trade index in these spheres is re-export. Upon entering of Lithuania and Latvia into the EU, the extent of reexport has increased: a part of re-export in the general export structure increased from 29,5 per cent in 2004 up to 45,2 per cent in 2011. Especially fast growth in the trade of both countries develops in the last years. When compared in 2011 with the year 2010, exports from Lithuania into Latvia increased by 40,7 per cent, while imports increased by 34,6 per cent during the same period. In case of trade with Germany, in eight CN sections of goods the intra-industry trade index during the period 2008 – 2011 exceeded 0,5. The only section of goods, where the index is less than 0,1, is XIX. Arms and ammunition. Lithuania hasn‘t much to offer to Germany in this section of goods and generally imports goods from another country. The most intensive trade among countries is in the following sections of goods: XI. Textile and textile articles, VII. Plastics and articles thereof, III. Animal or vegetable fats and oils, IV. Prepared foodstuffs, VI. Products of the chemical industry. Besides of the group of goods XIX. Arms and ammunition. A more one-sided trade is in the following sections of goods: XII. Footwear and headgear – the IIT index in 2008 – 2011 is equal to 0,18, XIII. Articles of stone, plaster, cement – 0,19, V. Mineral products – 0,27, XVI. Machinery, mechanical appliances – 0,33, III. Animal or vegetable fats and oils – 0,37. In case of trade in goods from the sections XIII. Articles of stone, plaster, cement, V. Mineral products, exports significantly exceeds import, and Lithuanian goods prevail in this case of trade among countries. In the sections of goods XII. Footwear and headgear, III. Animal and vegetable fats and oils, XVI. Machinery and mechanical appliances, and German goods prevail in this case of trade among countries. 606 ‘‘Societal Innovations for Global Growth‘‘, 2012, No. 1(1) ISSN 2335-2450 (online) Table 1. Intra-industry trade by CN sections between Lithuania and Russia, Germany, Latvia, Poland in 2005-2011 Russia Germany Latvia Poland 20052007 2008 2011 Change 2005 2007 2008 2011 Change 20052007 20082011 Change 20052007 20082011 Change I. Live animals; animal products 0,18 0,05 -0,13 0,64 0,85 0,21 0,71 0,90 0,19 0,59 0,82 0,23 II. Vegetable products 0,53 0,07 -0,45 0,88 0,82 -0,07 0,69 0,56 -0,13 0,28 0,50 0,22 III. Animal or vegetable fats and oils 0,41 0,44 0,03 0,27 0,37 0,10 0,54 0,78 0,24 0,74 0,45 -0,28 IV. Prepared foodstuffs, beverages and tobacco 0,27 0,17 -0,10 0,80 0,85 0,05 0,77 0,75 -0,02 0,37 0,48 0,11 V. Mineral products 0,03 0,01 -0,01 0,35 0,27 -0,07 0,19 0,26 0,07 0,20 0,34 0,14 0,66 0,74 0,08 0,54 0,80 0,26 0,97 0,94 -0,03 0,61 0,53 -0,08 0,48 0,38 -0,10 0,63 0,86 0,23 0,67 0,79 0,11 0,56 0,91 0,34 0,55 0,10 -0,46 0,36 0,51 0,16 0,77 0,84 0,07 0,82 0,91 0,08 IX. Wood and articles of wood 0,35 0,92 0,56 0,49 0,40 -0,08 0,81 0,76 -0,05 0,77 0,81 0,04 X. Pulp of wood, other fibrous celluloses material; paper 0,58 0,31 -0,28 0,23 0,38 0,15 0,89 0,96 0,07 0,29 0,37 0,08 XI. Textile and textile articles 0,29 0,04 -0,25 0,98 0,96 -0,03 0,77 0,87 0,10 0,48 0,37 -0,11 0,53 0,24 -0,29 0,15 0,18 0,03 0,70 0,72 0,03 0,35 0,43 0,08 0,41 0,41 0,00 0,26 0,19 -0,07 0,70 0,82 0,11 0,16 0,34 0,17 VI. Products of the chemical or allied industries VII. Plastics and articles thereof; rubber and articles thereof VIII. Raw hides, skins, leather, furskins and articles thereof XII. Footwear, headgear, umbrellas, walking sticks, whips XIII. Articles of stone, plaster, cement; glass, glassware, etc. 607 ‘‘Societal Innovations for Global Growth‘‘, 2012, No. 1(1) ISSN 2335-2450 (online) XIV. Natural or cultured pearls, 0,78 0,32 -0,46 0,52 0,49 -0,03 coin, etc. 0,89 XV. Base metals and articles of 0,79 0,76 -0,03 0,55 0,76 0,21 base metal 0,93 XVI. Machinery, mechanical 0,32 0,11 -0,21 0,27 0,33 0,06 appliances; electrical equipment 0,75 XVII. Vehicles, aircraft and 0,26 0,22 -0,04 0,25 0,50 0,25 associated transport equipment 0,89 XVIII. Optical, photographic, 0,47 0,15 -0,33 0,38 0,61 0,23 medical instruments, etc. 0,82 XIX. Arms, ammunition; parts and 0,32 0,29 -0,04 0,04 0,00 -0,04 accessories thereof 0,26 XX. Miscellaneous manufactured 0,29 0,11 -0,18 0,44 0,41 -0,03 articles 0,53 XXI. Works of art, collector’s pieces 0,13 0,16 0,03 0,21 0,30 0,09 and antiques 0,82 Source: Composed by author based on Lithuanian Department of Statistics data 0,63 -0,26 0,85 -0,08 0,82 0,07 0,89 0,00 0,88 0,05 0,18 -0,08 0,81 0,27 0,42 -0,40 0,04 0,18 0,14 0,34 0,54 0,20 0,39 0,42 0,03 0,37 0,68 0,31 0,40 0,80 0,40 0,14 0,09 -0,04 0,50 0,90 0,40 0,11 0,07 -0,04 608 ‘‘Societal Innovations for Global Growth‘‘, 2012, No. 1(1) ISSN 2335-2450 (online) In case of trade with Poland, the intra-industry trade index in the thirteen CN sections of goods during the period 2008 – 2011 exceeded 0,5. The most intensive trade among countries is in the following sections of goods: XI. Textile and textile articles, VII. Plastics and articles thereof, VIII. Raw hides, skins, leather, furskins and articles thereof, XX. Miscellaneous manufactured articles, I. Live animals, XIII. Articles of stone, plaster, cement. A more one-sided trade is in the following sections of goods: XXI. Works of art – the IIT index in 2008 – 2011 is equal to 0,07, in XIX. Arms and ammunition – 0,09, XIV. Pearls, jewels and precious metals – 0,18, XIII. Articles of stone, plaster, cement – 0,34, V. Mineral products – 0,34, IX. Wood and articles of wood – 0,37, XI. Textile and textile articles – 0,37. In case of trade in goods from the groups of goods XIX. Arms and ammunition, V. Mineral products, export significantly exceeds import, and Lithuanian goods prevail in this case of trade. Polish goods prevail in the following sections of goods: XXI. Works of art, XIV. Pearls, jewels and precious metals, XIII. Articles of stone, plaster, cement, IX. Wood and articles of wood, XI. Textile and textile articles. Trade between Lithuania and Russia segregates from that of other explored countries. The inter-industry trade significantly prevails here. In 3 sections of goods only the IIT index during the period 2008 – 2011 exceeds 0,5. This is trade in the sections of goods IX. Wood and articles of wood, XV. Base metals, VII. Plastics and articles thereof. One-sided trade is in the groups of goods V. Mineral products – the IIT index in 2008 – 2011 is equal to 0,01, I. Live animals – 0,05, II. Vegetable products – 0,07, XX. Miscellaneous manufactured articles – 0,11, XVI. Machinery and mechanical appliances – 0,11, XVIII. Optical, photographic, medical instruments, etc. – 0,15, XXI. Works of art – 0,16, IV. Prepared foodstuffs – 0,17. In case of trade in goods from the sections of goods I. Live animals, II. Vegetable products, XX. Miscellaneous manufactured articles, XVI. Machinery and mechanical appliances, XVIII. Optical, photographic, medical instruments, etc., XXI. Works of art, IV. Prepared foodstuffs, export significantly exceeds import, and Lithuanian goods prevail in this case of trade among countries. In the section of goods V. Mineral products Russian goods prevail. Trade between Lithuania and Russia in the most of CN sections is moving in the positive direction. CONCLUSIONS Upon the theoretical and empirical analysis, we may state that: 1. The last economic financial crisis has highlighted the meaning of export, international trade in general for the country's economy. Lithuania is a comparatively small country, it cannot therefore produce all the necessary products. The country takes 609 ‘‘Societal Innovations for Global Growth‘‘, 2012, No. 1(1) ISSN 2335-2450 (online) a part in the international sharing process, which helps to use the available resources of a country in a more effective way, to produce a high quality and competitive production and to participate in the international exchange of goods as well as in the international trade 2. It should be noted that during the peak of the crisis in 2009, the EU share in the export structure of Lithuania increased by 4 percentage points compared to 2008. During the most difficult period, exports to the EU declined slower than in other groups of countries. 3. Countries carry out their trading activity in two ways: trade among industrial branches – when a country sells to another country any production of any single industrial branch and purchases from it any production of any other industrial branch, and the intra-industry trade. The Grubel-Lloyd index is most commonly used for assessment of the intra-industry trade. Analysis of Lithuanian intra-industry trade has shown that this type of trade covers more than half of the country‘s foreign trade. 4. Statistical analysis of the Lithuanian intra-industry trade with the main trade partner countries has shown that types of trade in case of trade with the abovementioned countries are different. Latvia and Russia stand on the contrary poles. In case of trade with Latvia the intra-industry trade prevails. Lithuania and Latvia are neighbor countries, the size, development, cultural milieu, social aspects and size of market are similar. This causes the intensiveness of intra-industry trade. There is no group of goods, where the intra-industry trade would be insignificant. 5. Trade with Russia can be described as a type of inter-industry trade. In three groups of sections the intra-industry trade exceeds the half. In all the sections of goods, except those where the inter-industry trade is carried out, Lithuanian goods prevail. Russia prevails in the group of sections V. Mineral products. REFERENCES Andresen, M. A. (2003), Empirical Intra-Industry Trade: What we know and what we need to know University of British Columbia, Canada. Balassa, B. (1966). Tariff reductions and trade in manufactures among the industrial countries // American Economic Review, Vol. 56, p.466–473 Batiz R.L.A., Olivia M.A. (2003), International Trade: Theory, Strategies and evidence. New York: Oxford University Press. Bernatonytė D. (2009), Intra-industry trade and export specialization: Lithuanian case// economics & management, Nr. 14, p. 668-675. Bernatonytė D. Juškienė (2008), G. Development of Intra-Industry Trade Among the Baltic States. Socialiniai tyrimai / Social Research, Nr. 3 (13), p.32–41. 610 ‘‘Societal Innovations for Global Growth‘‘, 2012, No. 1(1) ISSN 2335-2450 (online) Bernatonytė D., Normantienė (2007), A. Estimation of Importance of Intra-industry Trade// Engineering economics, Nr. 3 (53), p. 25-34. Carbaugh R.J. (2008), International Economics. - Cincinnati: South-Western College Publishing. Fedotovs A. (2010) A small nation‘s comparative advantage: The case of Latvia. Business and Economic Horizons, april. Fontagne L., Freudenberg M. (1997), Intra-Industry Trade: Methodological Issues Reconsidered// CEPII, document de travail. –, Paris: Centre D’Etudes Prospectives et d’Informations Internationales, Nr. 01. 52 p. Grimwade N. (2000), International trade – new patterns of trade, production & investment/ 2nd ed. –London. Grubel, H., Lloyd, P.J. (1975), Intra-industry trade: the theory and measurement of international trade in differentiated products. London: McMillan.,. Krugman P.R., Obstfeld M. (2009), International Economics theory and policy. - New Jersey: Prentice Hall. Markusen R.J et al. (1995), International Trade Theory and Evidence. Irwin: McGraw-Hill. Marrewijk C. (2002), International Trade and the World Economy. – New York: Oxford University Press. Meilienė E., Snieška V. (2005), Lietuvos ekonominės politikos ir eksporto skatinimo strategijos sąveika, Viešoji politika ir administravimas,. Nr. 11. Ruffin R.J. (1999), The nature and significance of intra-industry trade// Economic and Financial Policy Review.- Federal Reserve Bank of Dallas, p. 2-9. 611 ‘‘Societal Innovations for Global Growth‘‘, 2012, No. 1(1) ISSN 2335-2450 (online) LIETUVOS FINANSŲ RINKOS PRIEŽIŪROS REFORMA Lekt. Vytautas Šenavičius Mykolo Romerio universitetas Teisės fakultetas Verslo teisės katedra Ateities g. 20, LT-08303 Vilnius El. paštas: [email protected] Santrauka Efektyvus Lietuvos finansų rinkos viešasis administravimas yra ypač svarbus Lietuvos ekonominiam vystymuisi, todėl pranešime išskiriami pagrindiniai Europos Sąjungos finansų rinkos priežiūros pakeitimai bei jų įtaka Lietuvos finansų rinkos priežiūros reformai. Pranešime nagrinėjama Lietuvoje nuo 2012 m. sausio 1 d. įsigaliojusi Lietuvos finansų rinkos priežiūros reforma, pagal kurią Lietuvos Respublikos vertybinių popierių komisija bei Lietuvos Respublikos draudimo priežiūros komisija yra likviduojamos, o jų funkcijos perduodamos Lietuvos bankui. Atsižvelgiant į tai, pranešime atskleidžiama, kodėl Lietuva pasirinko centralizuotą finansų rinkos priežiūros modelį ir vertinamas šio modelio efektyvumas. Pranešime taip pat skiriama dėmesio Lietuvos banko pareigai neteismine tvarka išnagrinėti vartotojų ginčus su finansų rinkos dalyviais. Vadovaujantis Lietuvos Respublikos Lietuvos banko įstatymo nuostatomis, vartotojas, manantis, kad finansų rinkos dalyvis pažeidė jo sutartinių ar su jais susijusių santykių teises ar teisėtus interesus, turi teisę kreiptis į teismą arba į išankstinio ginčų sprendimo ne teisme instituciją (Lietuvos banką). Tačiau ši teisė suteikiama tik laikantis tam tikrų taisyklių, o Lietuvos banko sprendimas yra rekomendacinis. Taigi, pranešime vertinamas vartotojų, veikiančių finansų rinkose, teisių apsaugos efektyvumas, kartu atskleidžiamos praktinės priežiūros problemos. Reikšminiai žodžiai: priežiūros institucijos, finansų rinkos, neteisminis ginčų nagrinėjimas. 612 ‘‘Societal Innovations for Global Growth‘‘, 2012, No. 1(1) ISSN 2335-2450 (online) 1. Įvadas Kiekvienos valstybės finansų rinkos dalyvių veiklos veiksmingas funkcionavimas yra jos finansinio stabilumo ir efektyvaus veikimo pagrindas. Besibaigianti finansų krizė parodė, kad efektyvi bei stabili finansų rinkos dalyvių veikla nėra įmanoma be finansų rinkos priežiūros sistemos. Analizuojant valstybių narių finansų rinkų priežiūros sistemą Europos Sąjungoje, pažymėtina, kad ši rinkų priežiūra turėtų būti vykdoma ir Europos Sąjungos, ir nacionaliniu lygmeniu. Neseniai Europos Sąjungos institucijų iniciatyva buvo reformuota finansų rinkų priežiūra Europos Sąjungos lygmeniu, kuri sukūrė integruotą finansų rinkų priežiūros sistemą. Tačiau ši reforma nepadarė didesnės įtakos valstybių narių finansų rinkų priežiūrai nacionaliniu lygmeniu - šiame lygmenyje rinkų priežiūra liko įvairi ir struktūriškai nevienoda, todėl galima išsamesnei teorinei analizei. Vertinant Europos Sąjungos valstybių narių įgyvendintus nacionalinius finansų rinkų priežiūros institucijų modelius, matyti, kad jos turi skirtingas nacionalines finansų rinkų priežiūros institucines struktūras. Kai kurios valstybės narės yra sukūrusios funkcijų padalijimo pagrindu (prižiūrint rizikos ribojimą ir paslaugų teikimą) decentralizuotą finansų rinkų priežiūros sistemą, kitos visas finansų priežiūros funkcijas deleguoja vienai priežiūros institucijai (Ferran, 2011). Pagal Lietuvoje nuo 2012 m. sausio 1 d. reformuotą finansų rinkos priežiūros sistemą, finansų rinkos priežiūra tapo centralizuota: Lietuvos Respublikos vertybinių popierių komisija bei Lietuvos Respublikos draudimo priežiūros komisija buvo likviduotos, o jų funkcijos perduotos Lietuvos bankui. Ši Lietuvos finansų rinkai svarbi reforma turėtų Lietuvos finansų rinkos priežiūrą padaryti labiau sisteminga, kartu optimizuoti finansų rinkos priežiūros kaštus ir taip prisidėti prie verslo teisinio reglamentavimo tobulinimo. Kita vertus, yra nuomonių, kad finansų rinkos priežiūros centralizavimas gali turėti neigiamos įtakos priežiūros kokybei. Kyla ir pagrįstų abejonių, ar, priežiūrą sukoncentravus vienoje institucijoje, Lietuvos bankas sugebės ir toliau intensyviai siekti Lietuvos finansų rinkos tobulinimo bei skaidrinimo. Straipsnio tyrimų objektas – Lietuvos finansų rinkos priežiūros reforma ir jos įtaka verslo teisinio reglamentavimo tobulinimui. Straipsnio tikslas – įvertinti Lietuvos finansų rinkos reformos įtaką efektyviam verslo teisiniam reglamentavimui. Straipsnio uždaviniai – išanalizuoti Europos Sąjungos finansų rinkų priežiūros sistemą ir Europos Sąjungos valstybėms narėms įprastus nacionalinius finansų rinkų priežiūros modelius; įvertinti po Lietuvos finansų rinkos priežiūros reformos įvykdytus pakeitimus, jų įtaką finansų rinkose teikiamų draudimo, investicinių bei banko paslaugų teikimo tinkamai priežiūrai ir 613 ‘‘Societal Innovations for Global Growth‘‘, 2012, No. 1(1) ISSN 2335-2450 (online) vartotojų apsaugai; nustatyti Lietuvos finansų rinkos priežiūros reformos galimus privalumus bei trūkumus. Analizuojant Europos Sąjungos finansų rinkų priežiūros ir Lietuvos finansų rinkos priežiūros pertvarką, straipsnyje buvo panaudoti retrospektyvinis, analizės, sintezės, lyginamasis metodai. Retrospektyvinio metodo pagalba buvo išryškintos Lietuvos finansų rinkos priežiūros reformos prielaidos ir raida, lyginamojo metodo pagalba atliktas Lietuvos finansų rinkos priežiūros reformos lyginimas su kitų Europos Sąjungos valstybių narių modeliais, analizės ir sintezės metodų pagalba įvertintas Lietuvos finansų rinkos priežiūros efektyvumas. 2. Finansų rinkų priežiūra Europos Sąjungoje 2.1. Tarpvalstybinė finansų rinkų priežiūra Europos Sąjungoje Finansų krizė išryškino sisteminį finansų rinkų priežiūros netobulumą, tad 2010 m. buvo reformuota Europos Sąjungos lygmeniu veikiančią finansų rinkų priežiūros sistema. Po reformos šios sistemos institucijas sudaro makrolygio rizikos ribojimui prižiūrėti įsteigta Europos sisteminės rizikos valdyba ir mikrolygio rizikos ribojimui prižiūrėti įsteigtos trys Europos priežiūros institucijos: Europos bankininkystės institucija, Europos vertybinių popierių ir rinkų institucija ir Europos draudimo ir profesinių pensijų institucija (Fitzgerald S., 2009) . Europos sisteminės rizikos valdyba stebi ir vertina Europos Sąjungos finansinę riziką – finansų rinkų dalyvių finansinių svertų naudojimo intensyvumą, pinigų srautų už ypač mažas palūkanas didėjimą, skolinimosi spartėjimą ir ekonominės pusiausvyros mažėjimą. Pasinaudodama gaunama informacija, Europos sisteminės rizikos valdyba teikia informaciją apie makrofinansinę Europos Sąjungos būklę, įspėja apie galimas finansinio stabilumo grėsmes (Fitzgerald S., 2009), vykdo kitas koordinavimo (Komunikatas, 2012) funkcijas. Mikrolygio rizikos ribojimui prižiūrėti įsteigtos trys Europos priežiūros institucijos tiria Europos Sąjungos teisės pažeidimus, tarpininkauja nesutariančioms nacionalinėms priežiūros institucijoms, turi teisę priimti jiems privalomus sprendimus. Kartu tarpvalstybinėms institucijoms yra išplėstas finansinių institucijų, kurioms bus taikomi Europos Sąjungos lygmeniu veikiančių priežiūros institucijų sprendimai, sąrašas, suteikta teisė kritiniais atvejais laikinai uždrausti grėsmę rinkai keliančius finansinius produktus ir veiklą, taip pat teisę prašyti Europos Komisijos parengti atitinkamų teisės aktų projektus (Dullien S., 2010). 614 ‘‘Societal Innovations for Global Growth‘‘, 2012, No. 1(1) ISSN 2335-2450 (online) 2.2. Europos Sąjungos valstybių narių finansų rinkų priežiūra Kaip matyti, tarpvalstybinė finansų rinkų priežiūros sistema yra struktūriškai ir funkciškai aiški. Tačiau ji, kad ir reformuota, negali užtikrinti visos Europos Sąjungos nacionalinių finansų rinkų sistemos stabilumo. Todėl esminiai su atskirų valstybių narių finansų rinkų priežiūra susiję sprendimų priėmimo įgaliojimai buvo palikti nacionalinėms institucijoms, kurios valstybių narių viduje vykdo rizikos ribojimo (angl. prudential supervision) ir paslaugų teikimo priežiūrą (angl. conduct of business supervision)1. Reiktų sutikti su Lietuvos Respublikos Vyriausybės 2010 m. gegužės 19 d. nutarimu Nr. 580 patvirtintoje Lietuvos Respublikos finansų rinkos priežiūros institucijų sujungimo koncepcijoje (Koncepcija, 2010) pateikta nuomone, kad Europos Sąjungoje nėra aiškaus ir vienodo finansų rinkos priežiūros institucinio modelio, kuris galėtų būti pritaikytas visose Europos Sąjungos valstybėse narėse. Tokia nuomonė dominuoja ir Europos Sąjungos akademiniame diskurse: teigiama, kad valstybės narės yra per daug skirtingos teisės tradicijomis, finansų rinkų išsivystymu. Anot Rosa M. Lastra, valstybių narių taikomi finansų rinkų priežiūros modeliai gali kardinaliai skirtis vienas nuo kito (Lastra R. M, 2003) ir drauge užtikrinti tinkamą nacionalinę finansų rinkų priežiūrą (Carmichael J., 2004). Apskirtai Europos Sąjungoje būtų galima išskirti šiuos nacionalinių finansų rinkų priežiūros modelius (Cervellati E., 2007): 1) Vienos priežiūros institucijos modelis. Įgyvendinus šį modelį viena priežiūros institucija atlieka rizikos ribojimo ir paslaugų teikimo priežiūrą visoje finansų rinkoje. Šis modelis dažniau pasitaiko besiformuojančiose finansų rinkose, kuriose centrinis bankas vykdo pagrindines (o kartais ir visas) finansų rinkų priežiūros funkcijas (Giorgio G., 2003) Šiuo metu šis modelis veikia Estijoje, Airijoje, taip pat ir Europos finansų centru laikomoje Jungtinėje Karalystėje2. 2) Vertikalusis finansų rinkų priežiūros modelis. Šis finansų rinkų priežiūros modelis, laikomas tradiciniu (Giorgio G., 2003), leidžia subjektų priežiūrą koncentruoti pagal tai, kokiame sektoriuje (bankininkystės, draudimo, investicinių paslaugų) jie veikia, t. y. skirtingos priežiūros institucijos atlieka sektorinę finansų rinkų priežiūrą. Šį modelį taiko Graikija, Ispanija, Kipras. 1 Atkreiptinas dėmesys, kad Europos Komisijos pateiktame naujame teisės akto projekte [XX] dabar siūloma sukurti bendrą priežiūros mechanizmą, kuriam vadovautų Europos Centrinis Bankas ir kuris apimtųeuro zoną ir būtų atviras visoms valstybėms narėms (Komunikatas, 2012). 2 Jungtinėje Karalystėje finansų rinkos priežiūra yra vykdoma centralizuotai, tačiau svarstoma galimybė modernizuoti finansų rinkos priežiūrą deleguojant kai kurias finansų rinkų priežiūros funkcijas kitoms institucijoms (German W., 2012). 615 ‘‘Societal Innovations for Global Growth‘‘, 2012, No. 1(1) ISSN 2335-2450 (online) 3) Horizontalusis finansų rinkų priežiūros modelis. Šis modelis yra įgyvendinamas tada, kai finansų rinkų rizikos ribojimo funkcija yra paskiriama vienam subjektui, o paslaugų teikimo priežiūra – kitam subjektui. Anot Enrico Cervellati (Cervellati E., 2007), šiam modeliui nėra būdingas atskyrimas tarp sektorių, todėl abi priežiūros institucijos vykdo visų trijų (draudimo, bankų, investicinių paslaugų) sektorių priežiūrą. Labiausiai šį modelį atitinka Olandija. Atkreiptinas dėmesys, kad Europos Sąjungos valstybių narių teisėje minėti modeliai dažnai modifikuojami pritaikant juos prie valstybės finansų rinkų specifikos (ECB, 2010). Pavyzdžiui, valstybės narės gali vertikalųjį finansų rinkos modelį įgyvendinti tik iš dalies, nes viena priežiūros institucija finansų rinkų dalyvių rizikos ribojimo priežiūrą, o kitos - draudimo, investicinių paslaugų bei bankų sektoriaus paslaugų teikimo priežiūrą. Be to, kai kuriose centralizuoto modelio šalyse (tarp jų – ir Lietuvoje) priežiūros institucijos vidinė struktūra demonstruoja horizontalaus finansų rinkų priežiūros modelio bruožus, kadangi čia rizikos ribojimo ir paslaugų teikimo priežiūrą atlieka skirtingi priežiūros institucijos departamentai. 3. Lietuvos finansų rinkos priežiūra Įvertinus kitų Europos Sąjungos valstybių narių patirtį ir atsižvelgus į tarptautinių organizacijų ir Europos Sąjungos institucijų rekomendacijas užtikrinti finansų rinkų priežiūros nepriklausomumą, Lietuvos Respublikos Vyriausybės 2008–2012 metų programoje buvo numatyta reformuoti Lietuvos finansų rinkos priežiūros sistemą, ją centralizuojant (Koncepcija, 2010). 2010 m. gegužės 19 d. Lietuvos Respublikos Vyriausybė patvirtino Lietuvos Respublikos finansų rinkos priežiūros institucijų sujungimo koncepciją, po kurios, 2011 m. lapkričio 17 d. Lietuvoje buvo priimtas finansų rinkos priežiūros sistemos pertvarkos įstatymas (Įstatymas, 2011), nustatęs, kad nuo 2012 m. sausio 1 d. Lietuvos finansų rinkos priežiūros funkcijos perduodamos Lietuvos bankui. Taigi, reformavus finansų rinkos priežiūrą Lietuvoje, visos Lietuvos Respublikos vertybinių popierių komisijos (toliau – VPK) ir Lietuvos Respublikos draudimo priežiūros komisijos (toliau – DPK) funkcijos perėjo Lietuvos bankui, kuris taip užtikrino Lietuvos finansų rinkos priežiūros centralizavimą. Reikėtų sutikti, kad finansų rinkos priežiūros sujungimo reforma yra žingsnis tobuliau ir efektyviau vykdyti finansų rinkos priežiūrą: sukurta neteisminių ginčų sprendimo nagrinėjimo procedūra, finansų rinkos priežiūros finansavimas nebepriklauso nuo viešojo sektoriaus. Kita vertus, reforma yra susijusi su tam tikromis grėsmėmis. Pavyzdžiui, dėl skirtingo atskirų finansų sektorių išsivystymo lygio po institucijų sujungimo gali vyrauti kredito įstaigų sektoriaus priežiūra (Koncepcija, 2010). Be to, 616 ‘‘Societal Innovations for Global Growth‘‘, 2012, No. 1(1) ISSN 2335-2450 (online) reikėtų įvertinti ir tai, kad Lietuvos bankas yra kelis kartus didesnė biurokratinė institucija. Tad kyla klausimų, ar, vykdydamas priežiūros funkcijas, Lietuvos bankas sugebės tai daryti laiku ir iniciatyviai, operatyviai reaguoti į rinkos pokyčius, finansų rinkų dalyvių ir kitų asmenų prašymus bei kreipimusis. Kadangi finansų rinkos priežiūros reforma įvyko prieš nepilnus metus, vertinti Lietuvos banko veiklos efektyvumą dar yra sunku. Tačiau jeigu Lietuvos bankas nevykdys aktyvios finansų rinkos formavimo ir reguliavimo politikos, reforma turės neigiamų pasekmių finansų rinkos priežiūrai (Talutis T., 2011). 3.1 Lietuvos vartotojų ir finansų rinkos dalyvių neteisminiai ginčai Vadovaujantis Lietuvos Respublikos Lietuvos banko įstatymo (LB įstatymas, 1994) 47 straipsnio 3 dalimi, vartotojas, manantis, kad finansų rinkos dalyvis pažeidė jo sutartinių ar susijusių santykių teises ar teisėtus interesus, turi teisę kreiptis į teismą arba į išankstinio ginčų sprendimo ne teisme instituciją – Lietuvos banką. Pažymėtina, kad toks ginčų nagrinėjimas yra nemokamas ir ginčas privalo būti išnagrinėtas per 3 mėnesius nuo vartotojo kreipimosi gavimo dienos. Lietuvos bankas, gavęs skundą ir pagal teisės aktus jį išnagrinėjęs, dėl ginčo esmės gali priimti vieną iš sprendimų: 1) patenkinti vartotojo reikalavimus; 2) iš dalies patenkinti vartotojo reikalavimus; 3) atmesti vartotojo reikalavimus (Aprašas, 2012). Lietuvos bankas sprendimą priima atsižvelgdamas į ginčo nagrinėjimo metu nustatytas aplinkybes bei vadovaudamasis galiojančia Lietuvos Respublikos teise ir finansų rinkos patirtimi. Pažymėtina, kad, siekdamas užtikrinti kuo operatyvesnį procesą ir apsisaugoti nuo nepagrįsto proceso vilkinimo, Lietuvos bankas gali priimti sprendimą, ir atsižvelgdamas tik į turimus įrodymus. Pavyzdžiui, jeigu ginčo šalių paaiškinimų arba pateiktų kitų įrodymų nepakanka ir šalys jų nepateikia per banko nustatytą terminą, Lietuvos bankas vis tiek privalo priimti spendimą. Svarbi ir aplinkybė, įtvirtinta Lietuvos banko 47 straipsnio 15 dalyje, kad vartotojo kreipimasis į Lietuvos banką laikantis nustatytų reikalavimų dėl ginčo išnagrinėjimo sustabdo ieškinio senaties terminą. Ši nauja aplinkybė vartotojui suteikia didesnę jo interesų apsaugos galimybę, nes vartotojas yra užtikrintas, jog Lietuvos banke užsitęsus jo skundo nagrinėjimui, jis nepraleis termino kreiptis į teismą dėl pažeistų teisių gynimo. Kita vertus, pažymėtina, kad Lietuvos banko priimamas sprendimas yra rekomendacinio pobūdžio, t. y. neprivalomas nei vartotojui, nei paslaugų teikėjui, taigi, kiekvienas iš jų išsaugo teisę kreiptis į teismą. Viena vertus, rekomendacinis sprendimas ne visada gali garantuoti, kad vartotojo finansų rinkose teisės bus tinkamai apgintos, kita vertus, netgi rekomendacinio pobūdžio sprendimas dažnai yra svarus argumentas, 617 ‘‘Societal Innovations for Global Growth‘‘, 2012, No. 1(1) ISSN 2335-2450 (online) sprendžiant klausimą, ar buvo pažeisti finansų rinkose veikiančio vartotojo interesai (Talutis T., 2011). Kaip matyti praktikoje, dažnu atveju finansų rinkų dalyviai, gavę jiems nenaudingą priežiūros institucijos sprendimą, stengiasi taikiai išspręsti tarp jų ir vartotojo kilusį ginčą. 3.2 Finansų rinkų priežiūros finansavimas Lietuvoje Pasaulio banko atlikti tyrimai rodo (Mwenda K. K., 2006), kad siekiant užtikrinti finansų rinkų priežiūros efektyvumą, būtina užtikrinti priežiūros institucijų nepriklausomumą. Tačiau nepriklausomumas čia turėtų būti suprantamas ne tik kaip institucinis (skaidri priežiūros institucijos vadovų priėmimo ir atleidimo procedūra, vadovams keliami pakankami reikalavimai, sprendimų viešumas ir pagrįstumas, nacionalinės valdžios įtakos sprendimams negalimumas), bet ir kaip finansinis – priežiūros institucija neturėtų būti išlaikoma iš valstybės biudžeto (Mwenda K. K., 2006). Reformuojant Lietuvos finansų rinkos priežiūros sistemą, į šiuos dalykus buvo atsižvelgta. Po finansų rinkų priežiūros reformos nuspręsta finansų rinkos priežiūros finansavimą vykdyti finansų rinkos dalyvių lėšomis. Lietuvos Respublikos Lietuvos banko įstatymo (LB įstatymas, 1994) 44 straipsnyje įtvirtinti principai, pagal kuriuos prižiūrimi finansų rinkos dalyviai moka įmokas Lietuvos bankui. Lietuvos banko įstatymo 44 str. 2 d. nurodyta, kad atskirų metų įmokų dydžius nustato Lietuvos bankas, pasikonsultavęs su prižiūrimais finansų rinkos dalyviais bei atsižvelgdamas į Lietuvos banko atliekamas funkcijas ir patiriamas išlaidas, taip pat - į prižiūrimų finansų rinkos dalyvių veiklos mastą ir jų prisiimamą riziką. Kai kurių teisininkų nuomone, Lietuvos banko prioritetas nustatant finansų priežiūros sistemos finansavimo dydį iš prižiūrimų subjektų įmokų yra susijęs su grėsme, kad privatūs subjektai galės daryti įtaką priežiūros institucijų veiklai. Tačiau atsižvelgiant į priežiūros funkcijų finansavimo modelio praktiką Europos Sąjungoje, Pasaulio banko siūlomą „gerąją praktiką“, finansų rinkos priežiūros institucijų finansavimas rinkos dalyvių lėšomis teisiniu požiūriu vyksta sėkmingai daugelyje Europos Sąjungos valstybių narių (Seelig S., 2008). 4. Išvados 1. Reformuota finansų rinkų priežiūros sistema Europos Sąjungos lygmeniu sukūrė Europos Sąjungai bendrą tarpvalstybinį finansų rinkų priežiūros modelį. Kita vertus, ši reforma neišsprendė efektyvaus Europos Sąjungos finansų rinkų priežiūros užtikrinimo klausimo dėl skirtingų valstybėse narėse finansų rinkų priežiūros modelių egzistavimo. 618 ‘‘Societal Innovations for Global Growth‘‘, 2012, No. 1(1) ISSN 2335-2450 (online) Manytina, kad ši problema išliks, nes sunku tikėtis, kad ateityje valstybės narės vienodintų savo nacionalinės priežiūros modelius - dėl skirtingų teisės tradicijų, skirtingo finansų rinkų išsivystymo. 2. Finansų rinkos viešojo administravimo reforma, centralizuojanti finansų rinkos priežiūros institucijų funkcijas, įneš teigiamų poslinkių, tobulinant Lietuvos finansų rinką bei harmonizuojant ją su bendra Europos Sąjungos rinka. Antra vertus, reformos efektyvumas, visų pirma, priklausys nuo paties Lietuvos banko aktyvios finansų rinkos formavimo ir reguliavimo politikos. 3. Įvykdžius Lietuvoje finansų rinkos priežiūros institucijų reformą, atsirado galimybė išspręsti svarbius klausimus, susijusius su vartotojų apsauga. Finansų rinkų vartotojų teisių neteisminės gynybos funkcijas delegavus Lietuvos bankui, buvo suformuota aiški neteisminių ginčų sprendimo sistema; kol ginčas nagrinėjamas neteisminėje institucijoje, sustabdyta ieškinio senatis. Kita vertus, rekomendacinis Lietuvos banko sprendimas ne visada gali būti pakankamas garantuoti vartotojų teisių ir jų teisėtų interesų apsaugą. 4. Finansų rinkos priežiūros finansavimas iš prižiūrimų rinkos dalyvių lėšų Lietuvos ekonomikoje turėtų užtikrinti priežiūros institucijos institucinį ir finansinį nepriklausomumą – taigi ir jos darbo kokybę bei efektyvumą. Literatūra 2012 m. rugsėjo 12 d. Europos Komisijos komunikatas Europos Parlamentui ir Tarybai “Bankų sąjungos kūrimo gairės” Briuselis, 2012 09 12 COM(2012) 510 galutinis. Carmichael J., Fleming A., Llewellyn D. T., Aligning Financial Supervisory Structures with Country Needs, World Bank Institute, 2004. Cervellati E., M., Fioriti E. Financial Supervision in EU Countries. Social Science Research Network, 2007. http://papers.ssrn.com/sol3/papers.cfm?abstract_id=873064 Dullien S., Herr H., EU Financial Market Reform Status and Prospects, Friedrich-Ebert-Stiftung International Policy Analysis, Berlin, 2010. European Central Bank, Recent developments in supervisory structures in the EU member states, 2010. http://www.ecb.europa.eu/pub/pdf/other/report_on_supervisory_structures2010en.pdf Ferran E. Understanding the New Institutional Architecture of EU Financial Market Supervision. University of Cambridge Faculty of Law Legal Studies (Paper No. 29/2011), 2011. http://www.law.cam.ac.uk/ssrn/ Fitzgerald S., The Reform of Financial Supervision in Europe, Institute of International and European Affairs, Dublin, Ireland, November 2009. German W. Financial Supervision 2012 – The Prudential Regulatory Authority, 2012. http://www.avantage.eu.com/pdfs/financial-supervision-reform Giorgio G., Noia C. Financial Market Regulation And Supervision: How Many Peaks For The Euro Area? Brooklyn Journal of International Law, 2003. 619 ‘‘Societal Innovations for Global Growth‘‘, 2012, No. 1(1) ISSN 2335-2450 (online) Lastra R. M., The governance structure for financial regulation and supervision in Europe, Columbia journal of European law, vol. 10, 2003. Lietuvos banko valdybos 2012 m. sausio 26 d. nutarimu Nr. 03-23 patvirtintas Vartotojų ir finansų rinkos dalyvių ginčų nagrinėjimo tvarkos aprašas. Lietuvos Respublikos finansų rinkos priežiūros sistemos pertvarkos įstatymas, Valstybės žinios, 2011, Nr. 145-6811. Lietuvos Respublikos Lietuvos banko įstatymas, Valstybės žinios, 1994, Nr. 99-1957. Lietuvos Respublikos Vyriausybės 2010 m. gegužės 19 d. nutarimas Nr. 580 Dėl Lietuvos Respublikos finansų rinkos priežiūros institucijų sujungimo koncepcijos patvirtinimo. Valstybės žinios, 2010, Nr. 61-2991. Mwenda K. K., Legal Aspects of Financial Services Regulation and the Concept of a Unified Regulator, World Bank, 2006. Seelig S. and Novoa A. Governance Practices at Financial Regulatory and Supervisory Agencies, IMF working paper No. WP/09/135, International Monetary Fund, 2008. Talutis T., Šenavičius V. Finansų rinkos priežiūra Europos Sąjungoje ir jos įtaka Lietuvai, Viešoji politika ir administravimas, 2012, T. 11, Nr. 1. SUMMARY Financial Market Supervision Reform in Lithuania Vytautas Šenavičius Financial regulation and supervision share the ultimate aims of ensuring financial stability, deterring malpractice and protecting consumers. However there is no unified concept of financial regulation structure. Therefore, in EU financial sector national supervisory institutions are organized in different forms in different countries. These “models” range from independent stand-alone supervisory authorities to consolidated (centralized) supervisors responsible for supervising the entire financial sector, including banks, insurance companies and securities firms. Due to the crisis and also reforms in EU level supervision, there has been an emerging trend in some countries towards restructuring the financial supervisory function. Lithuania was one of countries that significantly reformed its national financial market supervisory system. Therefore, as of 1 January 2012, Lithuania has single supervisor (central bank of the Republic of Lithuania) who is responsible for all financial market supervision in Lithuania. The article highlights the main changes in financial supervision, discusses the positive and negative aspects of non-judicial dispute settlement mechanism in Lithuania. 620 ‘‘Societal Innovations for Global Growth‘‘, 2012, No. 1(1) ISSN 2335-2450 (online) Keywords: supervisory institutions, financial market, alternative investment, nonjudicial dispute settlement mechanism. 621 ‘‘Societal Innovations for Global Growth‘‘, 2012, No. 1(1) ISSN 2335-2450 (online) MANAGEMENT INNOVATIONS IN THE HIGHER EDUCATION: THE CASE OF MYKOLAS ROMERIS UNIVERSITY Assoc. prof. dr. Agota Giedrė Raišienė Assoc. prof. dr.Tatjana Bilevičienė Mykolo Romerio universitetas Politikos ir vadybos fakultetas Vadybos katedra Valakupių g. 5, LT-10101 Vilnius El. paštas: [email protected] Mykolo Romerio universitetas Ekonomikos fakultetas Verslo ekonomikos katedra Ateities g.20 LT-08303 Vilnius El. paštas: [email protected] Prof. dr. Eglė Bilevičiūtė Mykolo Romerio universitetas Teisės fakultetas Administracinės teisės ir proceso katedra Ateities g.20 LT-08303 Vilnius El. paštas: [email protected] Abstract Management methods, leadership, criteria of return, investment and marketing strategies taken from business management have become a common challenge for high education. Universities have become an integral part of national innovation system, and able to contribute significantly to the edge of the economic progress. Mykolas Romeris University developed a new strategy to successful integration into the international area of higher education and scientific research development processes. This strategy is based on structural and social innovations. The article presents some of the aspects of management reforms carried out in MRU that are meant to improve university management processes, the quality of studies and services, and to increase the attractiveness of University for future students from Lithuania and abroad. Key words: university, management, higher education, performance and marketing strategy, Mykolas Romeris University, Lithuania 622 ‘‘Societal Innovations for Global Growth‘‘, 2012, No. 1(1) ISSN 2335-2450 (online) Introduction The social welfare is more and more reliable on industries and services promoting the use of knowledge. The knowledge today is being treated as the key factor of economic growth and ability to create and follow new technological development also (Stimic, Simac, 2012). Such dynamic environment of the higher education points to some new necessary features that it has developed: complexity of the „educational product“, complex social role of education institutions, importance of their financial performances and competition ( Maringe, Gibbs, 2009, p.47). As the educational market has undergone changes, competition among institutions of higher education worldwide was established (Kirp, 2003; Maringe, Gibbs, 2009). The competition in higher education sector was increased by the private educational institutions (OECD, 2010, p.299), and by the negative effect of demographic aging when the numbers of graduates is decreasing (European Commission, 2011). In such circumstances, higher education service quality becomes a key task for the service providers (Stimic, Simac, 2012) in all over the world. There, the quality should be understanded as evaluation of the process of education in order to reach the set goals (Barnett, 1992). Speaking about Europe, education is comprehended as one of the main supports for EU domestic politics (European Commission, 2010). The creation of the common European higher education space is a requirement for increasing the competitiveness of European higher education institutions (Svarbiausi Bolonijos..., 2008). Thus higher schools should create innovations and react proactively to the changes and challenges that take place in their environment. Mentioned challenges determine a demand to universities to reform theirs management systems and organizational procedures. Management methods, investment and marketing strategies taken from business management are becoming a common matter in higher education. Taking into consideration an actuality of a topic, the goal of the article was defined: to present main organizational changes carried out in Mykolas Romeris University that are meant to improve university’s management processes, services and studies quality and to increase the attractiveness of University for the future students. Literature analysis, document analysis and case analysis were applied in the research. 623 ‘‘Societal Innovations for Global Growth‘‘, 2012, No. 1(1) ISSN 2335-2450 (online) 1. Demand of changes in the Higher Education Globalization processes and the development of knowledge-based society change the conditions of universities performance and create new requirements for their management. New requirements for universities are formed by various stakeholders: students themselves, employers, state institutions and the whole society. In contemporary word, students can choose studies in both native and abroad universities. When finished the university students get into the global labor market (Becket, Brooks, 2006, 2008). With the reproductive and demographic crisis getting deeper, only the high schools who present modern and flexible study programs could remain in the higher education market. Universities should not confine to the attraction of the students. They should also enlist the best teachers and scientists. Essential reforms are needed in universities when seeking for higher quality of facility and attractiveness for students. The universities that will fail to start changing – due to lack of motivation, inability to carry the reforms out or due to insufficient resources – will have to overcome even a bigger obstacle in the future that will not be possible to overcome by their graduates and countries (Commission of the European Communities, 2005). The universities are becoming an immediate part of national innovational system. The execution of the so called Third Mission of the University forces the universities to create internal structures, interactions and processes that were not characteristic for high schools earlier. The traditional structures such as science departments and research centers change a lot as well by starting to carry out relevant applied researches and by hiring not only science specialists, but industry, business and other specialists as well. Business experts that are invited to researches and tuition processes help students to gain work experience faster, widen the learning strategies, become common subjects of academic life. The European Commission emphasizes the necessity of switching to social contracts between students and universities in some guidelines for development of higher education. Defining the quality of higher education management and its measurement is difficult. Despite this difficulty, higher education institutions are putting a lot of effort in to increase the management quality. Two methods for increasing the higher education quality may be predicted. Some authors suggest giving more attention to the quality of administrational and service functions. Others claim that teaching and learning quality should be concerned on. Nevertheless there could be the third way to apply an integrated approach where the main attention would be given to teaching and studying 624 ‘‘Societal Innovations for Global Growth‘‘, 2012, No. 1(1) ISSN 2335-2450 (online) without forgetting about the effectiveness and efficiency of administrational functions and services (Becket, Brooks, 2008). Speaking about the higher education quality, the pro-activity is necessary component. The pro-activity could be defined as an approach where organization leaders seek new opportunities related to current activities undertaken by the organization. The pro-activity is an element of entrepreneurship (Venkatraman, 1989). The environmental changes encourage universities to become more entrepreneurial (Mowery and Shane, 2002), but, as observe Todorovic with colleagues, little is know about the entrepreneurial orientation of academics departments, and how such an orientation might foster commercialization of activity and lead to competitiveness (Todorovic et al., 2011). Since employees of the organization create competitive advantages, deliberated institutional reforms could be best strategy to promote a market orientation (Schlosser, McNaughton, 2009). Professional lecturers and competent administration staff forms the image of the university and the quality of the student-university interaction, and generate perceived value, which in turn contributes to student satisfaction and loyalty in the educational service encounter (SanchezFernandez et al., 2010) Having in mind that competitive institutions are called only those which in the easiest way adapt to changes of the environment and first adopt innovations (Gajic, 2012), well considered innovative performance strategy might enable quality improvement in the higher education. A service that corresponds to the expectations of target market and delivers a superior value could be created after building up integrated internal management and marketing strategy. Some of universities are implementing such new strategies of performance. One of them is Mykolas Romeris University in Lithuania. 2. Institutional changes in MRU External factors of university changes influence the internal management of universities. Universities do not only execute their traditional functions, but widen them to the Third Mission of the University, that forms as a response to challenges of knowledge-based economy and helps to transform the universities into entrepreneurial organizations that are able to productively contribute to the development of economy by directly connecting science and innovations in industry, business trades, etc. (Hill, 2004). The good perception of requirements arriving from external environment leaded to the grow of Mykolas Romeris University despite decreased number of potential students in the country. 625 ‘‘Societal Innovations for Global Growth‘‘, 2012, No. 1(1) ISSN 2335-2450 (online) The mission of Mykolas Romeris University is to educate the society, store and uphold the intellectual potential, nurture leaders that would be able to create and implement innovations determining manifold development of science, culture and technology and to spread knowledge and innovations. To achieve these goals, MRU refers the traditions of European and Lithuanian universities, democracy principles and respects the human values. The main goal of MRU is to become a competitive, international university network included, demanded joint study programs offering and high international level research executing high school, that would attract students, teachers and researchers from Lithuania and abroad, prepare high qualification specialists according to the needs of the country and labor market, ensure the unity of studies and science, widen the international study exchange, deepen the integration into the academic community of Lithuania and abroad countries, form conditions for individual‘s continuous learning and apply modern management principles in the university management. The goals of higher education reforms started in Lithuania are close and acceptable for MRU as well (Mykolo Romerio universiteto..., 2010). The year 2010 was a year of structural and managerial changes for Mykolas Romeris University. MRU has become the first Lithuanian university to change its status following the Science and Research Act and from the year 2010 became a public institution. After making the reform, university formed its strategic goals: to create new attractive national and joint study programs, to establish in the market of continuous studies, widen the electronic studies and scientific work. A new structural and managerial system was modeled and realized. This system creates assumptions for realization of all the strategic goals and increasing of study quality. Management of university was optimized, resources were started to use more effectively. New marketing objectives were defined in the new MRU strategy. It was hoped that a consistent realization of marketing means would allow ensuring a purposeful movement towards the long-term MRU goals. Marketing means were firstly considered as the university‘s strengths identified. The fact that this strategy – to present the university‘s strengths in publicity – was proven to work is showed by a public opinion survey made by research agency „Factus Dominus“ (UAB „Factus Dominus“, 2011). The respondents indicated a dynamic, flexible and innovation-susceptible organization with great infrastructure, developed internationality, good communication with students, developed studies, studying perks as MRU strengths. The questioned have also marked orientation to labor market needs (updates for study programs, creation of new study programs). The research made allowed not only to identify the primary values of marketing strategy evaluation (i.e. university reputation), but also to evaluate the 626 ‘‘Societal Innovations for Global Growth‘‘, 2012, No. 1(1) ISSN 2335-2450 (online) university‘s program necessity in the target groups amongst the students of other universities, parents, employers and Lithuanians living abroad. The research results has allowed to more accurately name the priority marketing means in the year 2012 (preparation of study program packet in English language, improvement of university‘s image in the elder part of Lithuanian society. Mykolas Romeris University stays the second Lithuanian university according to priority given by individuals choosing studies. Despite a minor decrease in the number of students in recent years, university maintains the position of one on the most attractive Lithuanian universities. It seek to inform graduates and their parents about MRU study programs and achievements in science and other fields, the university is participating in the annual university fair „Learning, studying and career“ in Vilnius. Following the agreement signed with the Vilnius city municipality, the university teachers, workers of marketing department have started making presentations about the main specializations prepared in university (lawyer, economist, financier, etc.) in Vilnius city gymnasiums and secondary schools since the year 2011. Throughout the year 2011, 9 collaboration contracts were signed with the country gymnasiums and secondary schools. 2012 the scope of school-partners raised up to 12. Following contracts allow juridical opportunities for both the university and schools to establish more active connections in academic, cultural and other activities. The university is implementing an internal system of study quality assurance, based on sharing the responsibility for study quality and collaboration. In the year 2011, new Study program committee regulations were confirmed. Referring to them, study program committees, the most important function of which is the assurance of study program quality, were renewed. Study program committees analyze and fix study programs, maintain connections with students, listeners and graduates, social partners of programs; along with other responsible subdivisions choose the teachers responsible for program execution, analyze the material and informational resources of the studies, plan the reception of program students and listeners. Seeking to ensure the study quality, increasing the trust of students, social and abroad partners, 10 bachelor and major study programs were submitter for evaluation to the Accrediting agency for health and social science studies AHPGS (Akkreditierungsagentur für Studiengänge im Bereich Gesundheit und Soziales, Germany), which is a part of European higher education quality egencies register (EQAR). All of the programs were evaluated as very good. Referring to this international evaluation, SKVC has granted them a maximum accreditation term. In the year 2011, with the help of expert group from the World university association, a full-scale internationality strategy analysis (ISAS) was made in Mykolas 627 ‘‘Societal Innovations for Global Growth‘‘, 2012, No. 1(1) ISSN 2335-2450 (online) Romeris University. MRU was the first university in Europe to decide to take this step. The analysis has proven that the international standards of quality are being installed in the university. The university‘s strategy foresees transforming all the university‘s second stage study programs into joint studies that are realized along with the abroad partners. Such programs would provide the students with additional opportunities to study in abroad universities, reach additional study results and to compete in the international labor market. In the year 2011 Mykolas Romeris University was carrying out three joint study programs that were being studied by 66 students. Doctoral studies that help the most talented academic youth to integrate into national and international education environment are being widened. In the year 2011 Mykolas Romeris University and partners were granted to execute economy, management and administration, law, psychology, science of education and philology field doctoral studies. In collaboration with abroad universities following the Erasmus Mundus program, two joint doctoral study programs are being created and realized. Seeking to create conditions for high as possible number of students to study abroad and obtain international study experience, the university is especially successfully participating in the most intense programs following Erasmus, NordPlus and other programs. Following seven projects executed in the year 2011, 57 MRU students were intensively studying abroad for two to three weeks. In the year 2011, the university has submitted 19 applications for EU Learning all life, Erasmus Mundus, NordPlus and other international programs to support joint study programs and to realize international educational projects. 10 out of 19 applications were successful. In the year 2011, an increasing interest in Mykolas Romeris University is observed amongst the abroad country citizens who wish to seek for bachelor or major degree. Seeking to attract abroad students to study in exchange programs and continuous studies, The University ensured a wide supply of subjects taught in foreign languages in the year 2011: students from abroad were offered to choose from a total of 210 study subjects. Due to changes happening in the society (decreasing number of young students, high levels of emigration etc.), a need for more flexible study forms is growing. MRU is offering open remote studies during which not only new knowledge is obtained, but new challenges are being raised. In the year 2011, open remote studies in the university were chosen by 167 listeners. In the year 2011, during autumn semester, 27 percent of the listeners were living outside Lithuania. Listeners from Ireland, Great Britain, Portugal, Denmark, Norway, Switzerland, United States of America, Cyprus were studying in a remote way. The university applies various forms of remote tuition: considering the needs, synchronous remote tuition (face to face lectures and their broadcast through internet) 628 ‘‘Societal Innovations for Global Growth‘‘, 2012, No. 1(1) ISSN 2335-2450 (online) is coordinated with asynchronous (teaching material and assignments are accessed by signing in to Electronic study group servers), virtual learning environment is being developed, and conditions of electronic learning are being developed. The teaching material for open remote studies is accessible to all students in a electronic study environment Moodle. When applying modern technologies, all of the university‘s study programs are sought to make accessible remotely, and the teaching material of every study subject is being transferred to electronic environment as much as it is rational. The use of informational technologies and electronic study environment increases the study accessibility, allows to essentially decreasing the costs of knowledge transfer, use virtual modeling, simulation, electronic examination and other modern study tools. Seeking to help scientists to collaborate with each other, organize joint projects, publications, science events and to participate more purposefully in international and national science initiatives, a Scientists‘website was started to prepare. Along with the data of scientists who are participating in science programs, this website also includes calculation modules for academic exercise performance and the variable part of work payment for science publications. A university‘s graduates‘ career observance system is installed, which will help to observe, store and analyze the data about the university‘s graduates registered in SODRA (system of social insurance). According to every study program, the system allows both the university and social partners to analyze the labor market tendencies, store and systematize the information about the situation in labor market, work payment change tendencies etc. (Mykolo Romerio universitetas..., 2012). 3. Conclusions Meaningful demographic, economic and political changes require an improvement in higher education management. In the European Union, during the last five years, several program documents regulating higher education reforms were accepted. Respectively in the year 2009, a higher education reform was started in Lithuania, a new Education and Research Act was accepted. Competition in higher education and new challenges has caused the universities to reform their management. New performance and marketing strategies have become a common matter in higher education. The implementation of new performance strategy is meant to provide the students with an international standards meeting provision of knowledge, competitiveness of obtained specialty in Lithuanian and international markets, increased accessibility of studies, flexible entirety of payment, technical and technological means, 629 ‘‘Societal Innovations for Global Growth‘‘, 2012, No. 1(1) ISSN 2335-2450 (online) study environment based on human values and versatile, interesting and purposeful social and cultural living environment. In addition, highest possible conditions should be created for the teachers and other employees to expose their professionalism. Moreover, a packet of incentives and motives should be implemented and allow employees to feel competitive in Lithuanian and abroad labor markets. Also, a community environment based on human and academic values should be created, social security should be ensured. At the moment, the universities are forced to modernize their work, implement progressive methods of management in internal management systems with reference to the needs of globalization. Assuming this, a project "Vidaus valdymo tobulinimas Mykolo Romerio universitete" (Improving of internal management of Mykolas Romeris University) was executed in MRU. The project work group has presented several offers for improving the University’s work management and marketing. A wide scale survey amongst the citizens executed by an independent survey agency revealed that the chosen strategy is appropriate, because it enables the university to reach its goals, forms a good university’s reputation and increases attractiveness. Thanks to improved internal management, MRU is popular amongst those entering the university. The number of students in the University is growing quickly and is now reaching 21 000. Due to the circumstances of nowadays challenges, the internal researches ranging on performance quality are becoming very important when universities seek to remain competitive. References Barnett R (1992) Improving Higher Education: Total Quality Care. Buckingham, SRHE&OU. Becket N., Brooks M. (2006). Evaluating quality management in university. Quality Assurance in Education 14(2): 123–142. Becket N., Brooks M. (2008). Quality Management Practice in Higher Education – What Quality Are We Actually Enhancing? Journal of Hospitality, Leisure, Sport and Tourism Education 7(1): 40 – 54. Commission of the European Communities. (2005). Communication from the Commission. Mobilising the brainpower of Europe: enabling universities to make their full contribution to the Lisbon Strategy. Brussels, 20.4.2005 COM(2005)152 final. http://eurlex.europa.eu/LexUriServ/LexUriServ.do?uri=COM:2005:0152:FIN:LT:PDF. Accessed 20 Jan 2012. European Commission. (2010). Communication from the commission. EUROPE 2020. A strategy for smart, sustainable and inclusive growth. Brussels, 3.3.2010 COM(2010) 2020. 630 ‘‘Societal Innovations for Global Growth‘‘, 2012, No. 1(1) ISSN 2335-2450 (online) http://ec.europa.eu/commission_20102014/president/news/documents/pdf/20100303_1_en.pdf. Accessed 20 Jan 2012. European Commission. (2011). Commission working document on recent developments in European high educations systems. Accompanying the document. Communication from the Commission to the European Parliament, the Council, the European Economic and Social Committee and the Committee of the Regions. Supporting growth and jobs – an agenda for the modernisation of Europe's higher education systems. COM(2011) 567 final Brussels, 20.9.2011. http://ec.europa.eu/education/highereducation/doc/com0911_en.pdf. Accessed 20 Jan 2012. Gajic J. (2012) Importance of marketing mix in higher education institutions, Singidunum journal of applied sciences, Vol. 9 (1), p. 29-41. Hill R. P. (2004). The Socially-Responsible University: Talking the Talk While Walking the Walk in the College of Business. Journal of Academic Ethics 2(1): 89–100. Kirp D (2003) Shakespeare, Einstein and the Buttom Line: The Marketing of Higher Education. Harvard University Press. Cambrige. MA. Maringe F., Gibbs P. (2009) Marketing Higher Efucation, Theory and Practice. McGraw Hill. Mowery D.C., Shane S. (2002) Introduction to the special issue on university entrepreneurship and technology transfer. Management Science, Vol. 48 (1), p.5-9. Mykolo Romerio universitetas 2011. (2012). Vilnius. https://www.mruni.eu/mru_lt_dokumentai/apie_mru/dokumentai/2011_mru_rektoriaus _ataskaita.pdf. Accessed 20 May 2012 Mykolo Romerio universiteto 2010–2020 metų strateginis veiklos planas. (2010). http://www.mruni.eu/mru_lt_dokumentai/apie_mru/dokumentai/mru_strategija_2010_ 2020_lt_final.pdf. Accessed 20 June 2012. OECD (2010) Education at a glance. OECD Publishing. Sánchez-Fernández R., Iniesta-Bonillo M.A., Schlesinger-Díaz W., Rivera-Torres P. (2010) Analysis of the Value Creation in Higher Institutions: A Relational Perspective, Theoretical and Applied Economics, Volume XVII, No. 10(551), p. 25-36. Schlosser F., McNaughton R. (2009) Using the I-MARKOR scale to identify market-oriented individuals in the financial services sector. Journal of Services Marketing, Vol. 23(4), p. 236–248. Štimac H., Šimic M.L. (2012) Competitiveness in Higher Education: a need for marketing orientation and service quality, Sociology&Economics, Vol.5, No.2. Svarbiausi Bolonijos proceso dokumentai. Bolonijos–Londono laikotarpis 1999–2007 m. Lietuvos Respublikos švietimo ir mokslo ministerija. (2008). http://www.smm.lt/t_bendradarbiavimas/docs/Leidinys_Svarbiausi%20Bolonijos%20proc eso%20dokumentai%202009-2010.pdf>. Accessed 20 June 2012. Todorovic Z.W., McNaughton R.B., Guild P. (2011) ENTRE-U: An entrepreneurial orientation scale for universities. Technovation, Vol.31, p. 128-137. 631 ‘‘Societal Innovations for Global Growth‘‘, 2012, No. 1(1) ISSN 2335-2450 (online) UAB „Factus Dominus“ (2011). Socialinių ir humanitarinių mokslų specialistų poreikio ir Mykolo Romerio universiteto reputacijos tyrimo ataskaita. Kaunas. Venkatraman N. (1989) Strategic Orientation of Business Enterprises: the Construct, Dimensionality and Measurement. Management Science, Vol. 35(8), p. 942-962. 632 ‘‘Societal Innovations for Global Growth‘‘, 2012, No. 1(1) ISSN 2335-2450 (online) VEIKLOS VERTINIMO KRITERIJŲ OPTIMIZAVIMAS: LIETUVOS SPORTO ŠAKŲ FEDERACIJŲ ATVEJIS Doc.dr. Vilma Čingienė Gabrielė Vyštartaitė, magistrantė Mykolo Romerio universitetas Politikos ir vadybos fakultetas Vadybos katedra Valakupių g. 5, LT-10101 Vilnius El. paštas: [email protected] Mykolo Romerio universitetas Ekonomikos ir finansų valdymo fakultetas Tarptautinės prekybos ir muitų katedra El. paštas: [email protected] Santrauka Straipsnyje analizuojamas sporto federacijų veiklos vertinimo kriterijų optimizavimas, remiantis sudarytu veiklos vertinimo kriterijų modeliu. Sporto federacija analizuojama kaip nevyriausybinė, ne pelno siekianti, savarankiška visuomeninė sporto organizacija atsakinga už veiklos, orientuotos į tikslus bei uždavinius vystymą ir ap(si)rūpinimą finansavimo šaltiniais, kurie didžia dalimi priklauso nuo kasmetinių valstybės subsidijų (Lietuvos sporto statistikos metraštis, 2012). Lietuvoje sporto šakoms lėšos yra skiriamos organizacinėms reikmėms, organizuotam sportuojančių skaičiaus gausinimui, bet pagrindinis principas, skiriant lėšas kūno kultūros ir sporto šakų plėtros programoms yra sportininkų laimėjimai, pasiekti Europos, pasaulio čempionatuose, olimpinėse žaidynėse bei kitose svarbiose tarptautinėse varžybose. Šie kriterijai, remiantis daugelio atliktų tyrimų (Bayle ir Robinson, 2007; Chappelet, 2010; Mowbray, 2012) rezultatais, ne tik nepakankamai įvertina organizacijos išsikeltų tikslų įgyvendinimo lygį, organizacijos vadovo gebėjimą įsigyti ir tinkamai naudoti žmogiškuosius, finansinius ir fizinius išteklius organizacijos uždaviniams pasiekti, bet ir organizacijos veiklos produktyvumui bei efektyvumui nustatyti. Siekiant objektyviai įvertinti sporto šakos federacijos veiklą, yra aktualu apibrėžti kriterijus, kurie būtų orientuoti į organizacijos veiklos rezultatus. Straipsnyje nagrinėjami užsienio šalių nacionalinių sporto organizacijų finansavimo modelių pavyzdžiai (Madella ir kt., 2005; Bayle ir Robinson, 2007; Papadamitriou, 2007; Winand ir kt. 2010; Olimpinės programos komisijos, Australijos ir Kanados šalių), 633 ‘‘Societal Innovations for Global Growth‘‘, 2012, No. 1(1) ISSN 2335-2450 (online) pateikiamas jų pagrindu sudarytas modelis ir šio modelio ekspertinis vertinimas, siekiant atskleisti pateiktų veiklos kriterijų tikslingumą vertinant Lietuvos sporto federacijų veiklą. Valstybės įsitraukimas į sportą yra sietinas su sveikatos, socialinės kontrolės ir ryšių, diplomatijos bei ekonominės plėtros tikslais, kurių įgyvendinimui valstybė realizuoja funkcijas susijusias su sporto teisiniu reguliavimu, sporto plėtra, visuomenės požiūrio formavimu. Atlikto tyrimo rezultatų taikymas praktikoje, tikėtina, optimizuotų sporto šakų federacijų veiklos vertinimą ir atitiktų tiek federacijos, tiek valstybės interesus. Reikšminiai žodžiai: sporto politika, veiklos vertinimas, veiklos kriterijai, sporto šakos federacija. 1. Įvadas Lietuvos sporto vystyme reikšmingą vaidmenį vaidina nacionalinės sporto šakos federacijos. Federacijos esmė ir paskirtis yra apibrėžta Lietuvos kūno kultūros ir sporto įstatymu (2008), o vertinant juridiniu statusu – federacija yra reikšminga nevyriausybinė, nepelno siekianti organizacija veikianti įprastai pagal asociacijų įstatymą ir atsakinga už iškeltų tikslų bei uždavinių įgyvendinimą ir finansavimo šaltinius. Daugelio federacijų veiklos vystymas iš esmės priklauso nuo kasmetinių valstybės subsidijų. Europos Komisijos „Baltoji knyga dėl sporto“ (2007) ir „Komunikatas sporte“ (2009) pateikia federacijos veiklos valdymo orientuoto į rezultatus vystymo aktualumą, o atliktas tyrimas parodo federacijos reikšmę masinio sporto plėtrai (Study on the funding of grassroots sports in the EU, 2011). Šalyje veikia per šimtą sporto šakų federacijų, kurioms lėšos yra skiriamos organizacinėms reikmėms, organizuotai sportuojančių skaičiaus gausinimui, bet pagrindinis principas, skiriant lėšas kūno kultūros ir sporto šakų plėtros programoms yra sportininkų laimėjimai, pasiekti Europos bei pasaulio čempionatuose, olimpinėse žaidynėse bei kitose svarbiose tarptautinėse varžybose. Tačiau šio kriterijaus nepakanka įvertinti organizacijos išsikeltų tikslų įgyvendinimo lygmens, organizacijos vadovo gebėjimo įsigyti ir tinkamai naudoti žmogiškuosius, finansinius ir fizinius išteklius, organizacijos veiklos produktyvumui ir efektyvumui nustatyti. Esant tokiai situacijai yra sudėtinga vertinti sporto šakos federacijos veiklą, todėl tampa aktualu apibrėžti vertinimo kriterijus orientuotus į organizacijos veiklos rezultatus. Mokslinė problema. Kokiais apibrėžtais orientuotais į veiklos rezultatus kriterijais turėtų būti vertintina Lietuvos sporto šakų federacijų veikla? Ar galimi mokslu grįsti, objektyvūs kriterijai, vertinant Lietuvos sporto šakų federacijų veiklą, jeigu galimi, tai kokie? 634 ‘‘Societal Innovations for Global Growth‘‘, 2012, No. 1(1) ISSN 2335-2450 (online) Tyrimo tikslas: ištirti ir nustatyti Lietuvos sporto šakų federacijų objektyvius veiklos vertinimo kriterijus. Tyrimo uždaviniai: 1. Atlikti nevyriausybinių sporto organizacijų veiklos turinio analizę. 2. Atskleisti Europos šalių sporto šakų federacijų veiklos vertinimo modelių ypatumus. 3. Ištirti ir nustatyti Lietuvos sporto šakų federacijų veiklos vertinimo ypatumus. 4. Suformuoti Lietuvos sporto šakų federacijų veiklos vertinimo modelį. Tyrimo objektas: Lietuvos sporto šakų federacijų veiklos vertinimo kriterijų optimizavimas. Tyrimo metodai. Taikomas mišrus kokybinis ir kiekybinis tyrimo metodai. Struktūra. Teorinėje dalyje analizuojami nevyriausybinių organizacijų veiklos sporto sistemoje ypatumai bei Europos šalių sporto šakų federacijų veiklos vertinimo modeliai. Trečioji straipsnio dalis skirta tyrimo metodologijai, o ketvirtoje dalyje pateikiami tyrimo rezultatai ir išvados. 2. Nevyriausybinių sporto organizacijų veikla ir jos vertinimas 2.1. Nevyriausybinių organizacijų esmė ir veiklos sporto sistemoje bruožai Pagal nevyriausybinių organizacijų (NVO) teisės institutą nevyriausybinė organizacija – tai nepriklausomi nuo valstybės ar savivaldybės institucijų ir pelno savo dalyviams neskirstantys privatūs juridiniai asmenys, kurie savo tikslų siekia pagal iš esmės nustatytą vidaus tvarką ir kurių nariais arba dalyviais tampama ne dėl įstatymų reikalavimų ar kitų esminių objektyvių aplinkybių (Šimašius, 2007). Nevyriausybinių organizacijų veikla pasižymi tam tikromis veiklos kriterijais pagrįstomis savybėmis: 1) institucionalizavimas (steigiama pasirinkta teisine forma); 2) privatumas (institucinė nepriklausomybė nuo vyriausybės (valdžios); 3) pelno neskirstymas (nėra galimybės skirstyti pelną nariams ar dalininkams); 4) savivalda (NVO veikla remiasi apibrėžtomis vidaus procedūromis ir nėra valdomos iš išorės); 5) savanoriškumas (neprivaloma narystė NVO). Nevyriausybinių organizacijų veikla paprastai yra orientuota į įvairias socialines ir kultūrines sritis, tame tarpe ir į sportą. Remiantis atliktais tyrimais Lietuvos sporto sričiai priskiriami 9 proc. visų Lietuvos veikiančių NVO (Lietuvos ir Šveicarijos bendradarbiavimo programa, 2010). Taip pat daugiausiai narių pritraukia sporto organizacijos ir klubai, kuriems priklauso apie 3,5 proc. gyventojų. Remiantis Tamutienės ir kt. (2011) atliktu tyrimu, kuriame iš viso dalyvavo 468 NVO atstovai, 9,7 proc. atstovų priklauso sporto srities NVO. Remiantis minetų tyrimų rezultatais, galima daryti 635 ‘‘Societal Innovations for Global Growth‘‘, 2012, No. 1(1) ISSN 2335-2450 (online) prielaidą, kad sporto srityje veikiančių Lietuvos NVO skaičius vienerių metų laikotarpyje išlieka panašus ir stebima didėjimo tendencija. Išskirtinos specifinės NVO savybės būdingos nacionaliniams sporto valdymo organams (Winand ir kt., 2009), t.y. nacionalinėms sporto šakos federacijoms. Pirmoji savybė – federacijų misija yra dažnai neapibrėžta, todėl sunku jas vertinti. Antroji savybė – jiems reikia patenkinti suinteresuotų šalių įvairiapusius lūkesčius ir poreikius, kurie turi įtakos jų tikslams ir tarp šių suinteresuotų šalių bei viešosios valdžios institucijų, vaidinančių lemiamą vaidmenį organizacijos vystyme. Trečia savybė – riboti finansiniai ištekliai ir kasmet gaunami atsinaujinantys ištekliai yra iš viešojo sektoriaus institucijų. Ketvirta savybė yra žmogiškieji ištekliai, įskaitant apmokamus darbuotojus ir savanorius, kurie turi dirbti kartu valdant procesus organizacijoje, todėl kartais tarp jų atsiranda įtampa. Tailor ir O‘Sullivan (2009) teigia, kad ne pelno sporto organizacijos nėra orientuotos į pelną, jos neturi ir tradicinių savininkų. Pasak autorių, viską valdo specifinės (sudėtinės) suinteresuotosios šalys, visų pirma atsakingos už finansinius išteklius, tokius kaip nario mokestis, parama, pajamos iš fondų, valstybės subsidijos ir kt. Papadimitriou (2007) teigimu, pagrindinės gaunamos ne pelno sporto organizacijų lėšos yra kasmetinės valstybės subsidijos, o kitas mažiau reikšmingas finansavimo šaltinis yra rėmėjų parama. Papadimitriou (2007) remdamasi Herman ir Renz (2004) teigia, kad ne pelno sporto organizacijos panašiai kaip pelno siekiančios ir viešosios organizacijos jaučia nuolatinį spaudimą kurti strategijas ir naudoti vadybos praktiką, laiduojančią organizacijos efektyvumą. Dauguma ne pelno organizacijų visame pasaulyje savo prigimtimi yra nepriklausomos, tačiau tuo pačiu yra labai priklausomos nuo viešojo finansavimo, siekiant išgyventi ir teikti socialines paslaugas. Tai patvirtina ir Chappelet (2010) atlikto tyrimo rezultatai, kurie rodo, kad 30 EPAS (Enlarged Partial Agreement on Sport) narės šalys remia savo sporto judėjimus ir be valstybės finansavimo dauguma sporto organizacijų būtų mažiau išsivystę arba iš vis negalėtų egzistuoti. Pagal Lietuvos Respublikos kūno kultūros ir sporto įstatymą (2008), gali būti steigiama nacionalinė arba regioninė sporto šakos federacija atsakinga už sporto šakos plėtrą tam tikroje teritorijoje arba federacijos veikla gali būti susijusi su sportu pagal profesinės veiklos kryptį kaip sporto medicina, sporto žurnalistika ir pan. Kūno kultūros ir sporto departamento prie Lietuvos Respublikos Vyriausybės (toliau – KKSD) yra pripažintos 92 sporto šakų federacijos, asociacijos, sąjungos. Tik vieną teisės aktų numatyta tvarka Juridinių asmenų registre registruotą nacionalinę sporto šakos federaciją pripažįsta KKSD pasirašant valstybės biudžeto lėšų naudojimo sutartį. Tačiau, kiekviena sporto šakos federacija kas keturis metus pateikia atitiktį pripažinimo 636 ‘‘Societal Innovations for Global Growth‘‘, 2012, No. 1(1) ISSN 2335-2450 (online) kriterijams, o federacijai neatitinkant kriterijų ir nesilaikant jai skirtų įpareigojimų, KKSD turi teisę vienašališkai nutraukti tos federacijos pripažinimą (Kūno kultūros ir sporto departamento prie Lietuvos Respublikos Vyriausybės generalinis direktorius, 20092010). Taip pat pripažinta sporto šakos federacija savo veiklai vykdyti gali gauti valstybės subsidiją. Skiriant lėšas sporto šakų federacijų veiklai yra vadovaujamasi trimis principais: 1) vienoda dotacija federacijos organizacinėms reikmėms vieniems metams; 2) lėšos organizuotai sportuojančių skaičiaus gausinimui; 3) lėšos sportinės pamainos, t.y. didelio meistriškumo sportininkų laimėjimų gausinimui, sporto sistemos optimizavimui, kurių pagrindinis rodiklis yra laimėti apdovanojimai, užimtos kitos aukštos vietos svarbiausiose varžybose (Kūno kultūros ir sporto departamento prie Lietuvos Respublikos Vyriausybės generalinis direktorius, 2010). Valstybės subsidijos yra metinės, todėl kiekvienais metais sporto šakos federacija turi pateikti prašymus valstybės subsidijai gauti. Tokiu būdu, NVO sporto sistemoje atitinka bendruosius trečiojo sektoriaus organizacijoms būdingus bruožus, o veiklos specifika ir sukuriami rezultatai reikalauja adekvataus jų vertinimo optimizuojant viešųjų finansų naudojimo efektyvumą. 2.2. Europos šalių sporto šakų federacijų veiklos vertinimo modelių ypatumai Pastarąjį dešimtmetį įvairių šalių sporto valdymo praktika rodo, kad tampa aktualus sporto organizacijų veiklos orientuotos į pamatuojamus veiklos rezultatus vertinimas. Tiesioginiai ir pridėtinę vertę formuojantys, trumpalaikiai ir ilgalaikiai veiklos rezultatai ir jų vertintina išraiška ypač yra aktuali siekiant optimizuoti viešųjų finansų racionalų panaudojimą nacionaliniu ir vietiniu lygiu. Siekiant nagrinėti veiklos vertinimo modelius yra tikslinga apsibrėžti organizacinės veiklos sampratą sietiną su ekonomine, finansine, organizacine ar socialine nauda (Bayle ir Robinson, 2007). Madella ir kt. (2005) teigimu, organizacinė veikla – tai gebėjimas įsigyti ir tinkamai naudoti žmogiškuosius, finansinius ir fizinius išteklius organizacijos uždaviniams pasiekti. Organizacinės veiklos vertinimui turėtų būti taikomi veiklos matavimo metodai. Dažnai tai yra veiklos auditas, nes vertinant bet kokią veiklą yra neapsieinama be veiklos ekonomiškumo, efektyvumo, veiksmingumo vertinimų (Puškorius, 2010). Madella ir kt. (2005) teigimu tradicinės priemonės ir rodikliai naudojami organizacijos pasiektos naudos vertinimui yra pardavimai, informacija apie darbuotojus ir turtą. Šiuos rodiklius, pasak autorių, galima tik dalinai pritaikyti nevyriausybinėms sporto organizacijoms (ne pelno siekiančioms) dėl jų specifinio pobūdžio. 637 ‘‘Societal Innovations for Global Growth‘‘, 2012, No. 1(1) ISSN 2335-2450 (online) Puškoriaus (2010) teigimu, norint išmatuoti veiklos efektyvumą, reikia naudoti tinkamai parinktus indikatorius ir kriterijus, o bet kokie veiklos matavimai galimi tik su sąlyga, kad jie bus tiesiogiai susieti su konkrečia veikla. Įprastai veiklos efektyvumas yra daugia-aspektinis ir jis negali būti suvestas į vieną faktorių (Mowbray, 2009). Mokslinėje literatūroje analizuojami įvairūs organizacijos veiklos efektyvumo įvertinimo modeliai. Tačiau ne visus modelius galima pritaikyti ir efektyviai integruoti sudėtinį požiūrį, kuriuo remiantis veikla turėtų būti suvokiama ir įvertinta (Madella ir kt., 2005). Kyla klausimai: kaip sukurti integruotą modelį efektyviai suderinant skirtingus sudėtinius aspektus ir matavimus? kaip įvesti ir naudoti atitinkamus matavimo svertus pasirinktiems aspektams? Savo tyrime pasirinkome tris struktūriškai panašius veiklos matavimo modelius, kuriais buvo siekiama įvertinti sporto šakų federacijų veiklą skirtingose Europos šalyse, Graikija, Prancūzija, Italija, Portugalija, Belgija. Pirmasis yra Madella ir kt. (2005) veiklos vertinimo modelis, kuris buvo panaudotas plaukimo sporto šakos federacijos veiklos palyginimui Portugalijoje, Graikijoje, Ispanijoje ir Italijoje. Veiklos vertinimo modelis yra sudarytas iš penkių aspektų. Kiekvieną aspektą sudaro keli elementai. Svarbiausi yra indikatoriai (kriterijai), kurie priskiriami kiekvienam iš aspektų ir yra pagrindinis įrankis vertinant sporto šakos federacijos veiklą. Autoriai teigia, kad naudojant šį veiklos vertinimo modelį buvo iš dalies įmanoma apibūdinti federacijos veiklos situaciją išskleidžiant vidinius skirtingus aspektus ir pateikti globalų veiklos vertinimą kiekvienam aspektui. Tačiau reikia pažymėti, kad buvo naudojami tik pirminiai veiklos rezultatai ir priskiriami kiekvienam indikatoriui, nesuteikiant matavimo sverto indikatoriaus svarbumui ko pasėkoje buvo sudėtinga efektyviai apibūdinti organizacinę veiklą. Kitas veiklos vertinimo modelis yra Papadamitriou (2007), kuris buvo panaudotas 20 –ties Graikijos nacionalinių olimpinių ir neolimpinių sporto šakų federacijų veiklos vertinimui. Visų pirma Papadamitriou (2007) išskyrė penkias vidines sudedamąsias nacionalinės sporto organizacijos grupes, kurios yra visose organizacijose ir kurios skirtingai turi įtakos organizacinei veiklai: direktorių tarybos nariai, apmokamas administracinis personalas, techninis personalas, tarptautiniai ir nacionaliniai tarnautojai, generalinis sporto sekretoriatas ir didelio meistriškumo sportininkai. Autorės teigimu, efektyvumo skalė turi atspindėti veiklos matavimo priemones su prasmėmis ir vertėmis visiems anksčiau minėtiems dalyviams. Veiklos vertinimo modelis apima penkis aspektus, kuriuos sudaro 33 skirtingos matavimo priemonės (kriterijai). Pasak autorės, modelis gali būti testuojamas dėl jo pritaikomumo skirtingų šalių nacionalinėse sporto organizacijoje, priimant dėmėn, kad nacionalinės sporto organizacijos apibūdinamos pagal palyginamas organizacines struktūras ir procesus. 638 ‘‘Societal Innovations for Global Growth‘‘, 2012, No. 1(1) ISSN 2335-2450 (online) Trečias modelis yra Winand ir kt. (2010), kurių teigimu vertinant organizacinę veiklą, reikėtų vadovautis penkiais svarbiausiais aspektais, derinant misiją, kurią apibūdina du strateginių tikslų aspektai (sporto šakos plėtra ir vartotojai) ir tris sisteminius uždavinius. Vadovaujantis šiuo požiūriu buvo sukurtas organizacinės elgsenos kiekybinio vertinimo modelis. Tyrimo metu buvo įtrauktos 56 sporto šakų federacijos ir 27 olimpinės sporto šakų federacijos iš Belgijos prancūziškai kalbančios bendruomenės. Pristatomas modelis susideda iš 5 konceptualių aspektų, kurių kiekvienas apima du subaspektus. Subaspektas išskleidžiamas kiekvieno aspekto turinyje, siekiant nuosekliai išplėsti organizacijos veiklos matavimo modelį sporto organizacijoje. Kiekvienam subaspektui išskirti strateginiai tikslai, kurių išmatavimui naudojami kiekybiniai veiklos rodikliai. Pasak Winand ir kt. (2010), naudojant šį modelį, sporto organizacijos gali nusistatyti prioritetinius investicijų tikslus taip sutaupant finansinius ir žmogiškuosius išteklius ir atmetant tuos tikslus, kurie nėra strateginiai arba tiesiog neįmanomi pasiekti. Madella ir kt. (2005), Papadimitriou (2007) ir Winand ir kt. (2010) veiklos vertinimo modeliai struktūriškai yra panašūs. Visuose modeliuose yra aspektai (aspektų skaičius modeliuose skirtingas), kuriems priskiriami indikatoriai (kitaip dar vadinami kriterijai, matavimo priemonės, kiekybiniai veiklos vertinimo rodikliai) ir jų pagalba galima įvertinti organizacinę veiklą ar išmatuoti užsibrėžtus strateginius tikslus. 3. Tyrimo metodologija Naudojant turinio analizės metodą buvo sudaryta sporto šakų veiklos vertinimo kriterijų lentelė remiantis teorinius ir praktinius tyrimus analizuojančiais literatūros šaltiniais. Buvo analizuotas integruotas kelių Europos šalių patirtimi parengtas sporto šakų veiklos vertinimo modelis pagal Madella ir kt. (2005) ir naudotas lentelės pagrindui sudaryti. Organizacinės elgsenos modelio kiekybiniai veiklos rodikliai buvo įtraukti remiantis Winand ir kt. (2009), kurie pagrindė šių rodiklių būtinybę vertinant federacijų veiklą. Taip pat buvo naudoti trys veiklos pasaulio modeliai, kurie yra pripažinti kaip pažangios praktikos pavyzdžiai, tai: Olimpinės Programos Komisijos ataskaitos tarptautinių federacijų ir nacionalinių olimpinių komitetų veiklos vertinimo kriterijai (Olympic Programme Commission, 2004), Australijos sporto komisijos nacionalinių sporto organizacijų tinkamumo kriterijai 2009-2013 m. (Eligibility criteria for the recognition of national sporting organisations by the Australian sports commission 2009 – 2013, 2009) ir Kanados sporto finansavimo ir atskaitomybės sistemos nacionalinių sporto organizacijų tinkamumo kriterijai 2010-2014 m. (Sport funding and accountability framework, 2010). 639 ‘‘Societal Innovations for Global Growth‘‘, 2012, No. 1(1) ISSN 2335-2450 (online) Tokiu būdu, sporto šakų veiklos vertinimo kriterijų lentelėje išskyrėme 6 veiklos aspektus ir 40 veiklos vertinimo kriterijų (1 pav.). Siekiant išsiaiškinti veiklos vertinimo kriterijų tinkamumą pagal pagrįstus kriterijus, ekspertų buvo prašoma pateikti savo nuomonę dėl parinktų sporto šakų federacijų veiklos vertinimo kriterijų tinkamumą. Atsakymų pasirinkimui naudota Likert‘o skalė (nuo 1 „visiškai nesutinku“ iki 5 „visiškai sutinku“). Tyrimo imtis 12 svarbių strateginių sporto šakų federacijų (toliau – SSF) atstovaiekspertai, po vieną atsakingą asmenį turintį teisę veikti sporto šakos federacijos vardu (2011-2012 m. Lietuvos strateginių sporto šakų sąrašo patvirtinimas, 2011) ir 3 atsakingi asmenys-ekspertai iš Kūno kultūros ir sporto departamento (toliau – KKSD) prie Lietuvos Respublikos Vyriausybės tiesiogiai dalyvaujantys ir atsakingi už sporto šakų federacijų veiklos vertinimą. Tyrimo duomenų apdorojimui buvo naudojama SPSS 17.0 statistinės analizės ir duomenų apdorojimo programa, kuria buvo apskaičiuotas Cronbacho alfa koeficientas, Mann-Withey testo p-reikšmės, Kendall‘o konkordancijos koeficientas (W). Vidiniam pateiktų kriterijų nuoseklumui įvertinti buvo naudojamas Cronbacho alfa koeficientas. Siekiant išsiaiškinti ar dviejų skirtingų grupių ekspertų nuomonės apie pateiktus veiklos vertinimo kriterijus statistiškai reikšmingai skiriasi, buvo atliktas Mann – Whitney testas, kuriame skaičiuota p-reikšmė. Kendall‘o konkordancijos koeficientas (W) vertintas trimis lygmenimis, t.y. 1) SSF ekspertų suderinamumas vertinant kiekvieną aspektą atskirai; 2) KKSD ekspertų suderinamumas vertinant kiekvieną aspektą atskirai; 3) abiejų grupių ekspertų suderinamumas vertinant aspektų visumą. Veiklos vertinimo kriterijų lentelė 6 aspektai, 40 kriterijų Šaltinis: sudaryta autorių 1 pav. Veiklos vertinimo kriterijų modelis 640 ‘‘Societal Innovations for Global Growth‘‘, 2012, No. 1(1) ISSN 2335-2450 (online) 4. Tyrimo rezultatai Remiantis tyrimo duomenimis abiejų ekspertų grupių nuomonės dėl šešių veiklos vertinimo kriterijų aspektų iš esmės sutapo (2 pav.). Tikslinga pažymėti, kad abiejų grupių ekspertai pritarė tiems veiklos vertinimo kriterijams, kurie pagrindžia žmogiškųjų išteklių, finansų ir tarptautinių varžybų rezultatų aspektus. Taip pat, grupių ekspertų sutinka dėl nepriklausomai audituotų finansinių atskaitomybių ir metinių ataskaitų už pastaruosius trejus metus pateikimo veiklos vertinimo kriterijaus, kuris traktuojamas kaip svarbiausias vertinant sporto šakos federacijos veiklą. Abiejų grupių ekspertų nuomone netinkami yra suteiktų paslaugų apimties ir institucinės komunikacijos, partnerystės ir tarporganizacinių santykių veiklos vertinimo kriterijų aspektai. Tačiau nuomonė apie klientų aspektą įvertinančius veiklos vertinimo kriterijus yra skirtinga: KKSD grupės ekspertai pritaria, o SSF grupės ekspertai nepritaria minėtam kriterijui. Winand ir kt. (2009) teigimu, šie kriterijai gali padėti įgyvendinti organizacijos strateginius tikslus, t.y. puoselėti sportą kaip vertybes formuojantį visuomenėje reiškinį ir tikslinę veiklą, kurios plėtojimui reikalinga išlaikyti ir gausinti narius. Tačiau remiantis gautais rezultatais galima teigti, kad SSF grupės ekspertai arba netinkamai suprato šiuos kriterijus, arba jų strateginiai tikslai išimtinai yra nukreipti tik į didelio meistriškumo sporto vystymą. Tyrimas parodė, kad parinkti kriterijai yra tinkami ir koreliuoja tarpusavyje, nes vidiniam anketos nuoseklumui įvertinti buvo apskaičiuotas Cronbacho alfa koeficiento reikšmė (2 pav., raudona spalva), kuri yra 0,854 (0,854>0,6). Kadangi kiekvienam iš aspektų yra priskiriamas skirtingas veiklos vertinimo kriterijų kiekis, kuriems nebuvo suteiktas svertinis koeficientas, buvo įvertinta kriterijų koreliacija tarp kiekvieno aspekto kriterijų. Cronbacho alfa koeficiento reikšmės svyravo nuo 0,363 iki 0,890 priklausomai nuo aspektui priskirtų kriterijų skaičiaus (kuo daugiau kriterijų vienam aspektui, tuo Cronbacho alfa koeficientas yra didesnis). Kadangi nei vieno aspekto Cronbacho alfa koeficientas nebuvo mažesnis nei 0,1 – 0,2 nei vieno aspekto nereikia pašalinti, t.y. visi yra tinkami. Siekiant išsiaiškinti ar dviejų skirtingų grupių ekspertų nuomonės apie pateiktus veiklos vertinimo kriterijus statistiškai reikšmingai skiriasi, buvo naudotas Mann – Whitney testas, skaičiuojtis p-reikšmę. 39 veiklos vertinimo kriterijų atžvilgiu p-reikšmės yra didesnės nei 0,05 ir tik vienas veiklos vertinimo kriterijus iš finansų aspekto yra mažesnis nei 0,05 (0,036<0,05). Gautų duomenų analizė įgalino teigti, kad ir SSF, ir KKSD ekspertai veikos vertinimo kriterijus įvertino panašiai. 641 ‘‘Societal Innovations for Global Growth‘‘, 2012, No. 1(1) ISSN 2335-2450 (online) 0,343 Žmogiškieji ištekliai 0,646 0,363 Finansai 0,759 Tarptautinių varžybų rezultatai 0,363 0,315 0,324 0,297 0,059 0,153 0,094 Klientai 0,776 Suteiktų paslaugų apimtis 0,890 Institucinė komunikacija, partnerystė ir tarporganizaciniai santykiai 0,774 0,039 0,022 Nesutinka Nesutinka Svarbios strateginės sporto šakų federacijos grupė Kūno kultūros ir sporto departamentas prie LRV grupė 0,201 0,444 0,228 Sutinka Sutinka Nepriklausomai audituotų finansinių atskaitomybių ir metinių ataskaitų už pastaruosius trejus metus pateikimas 0,136 Šaltinis: sudaryta autorių Pastaba: spalvos bus paaiškintos tekste 2 pav. Abiejų grupių ekspertų nuomonės apie veiklos vertinimo aspektus pasiskirstymas Taip pat, analizuojant tyrimo rezultatus buvo apskaičiuotas Kendall‘o konkordancijos koeficientas (W) siekiant sužinoti ekspertų sutarimo laipsnį. Šis koeficientas buvo skaičiuojamas atskirai SSF ir KKSD ekspertų grupėse (žr. 2 pav. mėlyna spalva). Taip pat apskaičiuotas Kendall‘o konkordancijos koeficientas (W) atskiriems veiklos vertinimo aspektams skirtingose ekspertų grupėse (žr. 2 pav. žalia spalva). Gauti rezultatai rodo, kad ir SSF ekspertai, ir KKSD ekspertų vertinimai yra prieštaringi. Tą patį galima pasakyti ir apie ekspertų vertinimo suderinamumą atskiriems veiklos vertinimo aspektams skirtingose ekspertų grupėse. Tikėtina, kad žemam ekspertų suderinamumo laipsniui galėjo turėti įtakos nedidelės nepriklausomų kintamųjų imtys. SSF ekspertų grupės vertinimai (0,324) yra labiau suderinti, nei KKSD ekspertų vertinimai (0,297), t.y. 0,324>0,297. O vertinant atskirai kiekvieną aspektą, SSF grupės ekspertų vertinimas 642 ‘‘Societal Innovations for Global Growth‘‘, 2012, No. 1(1) ISSN 2335-2450 (online) labiausiai sutapo vertinant finansų (0,363) ir tarptautinių varžybų rezultatų (0,315) aspektus; labiausiai nesuderinamas ekspertų vertinimas aspektams - klientų (0,022) ir suteiktų paslaugų apimtis (0,039). KKSD grupės ekspertų vertinimas labiausiai dera vertinant tarptautinių varžybų rezultatų (0,444) ir žmogiškųjų išteklių (0,343) aspektus; labiausiai nesuderinamas ekspertų vertinimas aspektams – klientai (0,059) ir institucinė komunikacija, partnerystė ir tarporganizaciniai santykiai (0,094). Atliktus tyrimo duomenų analizę galime teigti, kad abiejų ekspertų nuomonės labiausiai suderinamos vertinant veiklą tarptautinių varžybų rezultatų aspektu. Apibendrinant tyrimo rezultatus, galima teigti, kad tiek KKSD, tiek SSF grupių ekspertai sutinka išsamiau vertinti sporto šakų federacijų veiklą pagal veiklos rezultatus remiantis pasiūlytu veiklos vertinimo modeliu. Pastaruoju metu federacijos veiklos vertinimas paremtas tik trimis principais, o ateityje turėtų būti pagrįstas argumentuotai aiškiais, skaidriais ir pamatuojamais veiklos vertinimo kriterijais. Diskutuotina ar pasirinkus didesnę tyrimo imtį, t.y. įtraukus ne tik strategiškai svarbių, bet ir strateginių bei kitų sporto šakų federacijų atstovus, būtų gauti kitokie tyrimo rezultatai, gal būt rezultatai būtų objektyvesni. Tačiau pažymėtina tai, kad atlikto tyrimo imtis statistiškai atitinka reikalavimus, todėl gauti rezultatai yra pakankami išvadų formulavimui. Išvados Atlikus nevyriausybinių sporto organizacijų veiklos vertinimo modelių analizę ir Lietuvos sporto šakų federacijų veiklos vertinimo kriterijų analizę, galima teigti, jog: 1. Nevyriausybinių sporto organizacijų veiklos ypatumai ir rezultatai turėtų pateisinti viešųjų finansų panaudojimo racionalumą ir atliepti socialinių paslaugų poreikį visuomenėje. 2. Europos šalių nevyriausybinių sporto organizacijų veiklos vertinimo modeliai struktūriškai yra panašūs pagal veiklos aspektus, atitinkančius tam tikrus veiklos vertinimo kriterijus. Kiekvieną modelį galima pritaikyti sporto šakų federacijų veiklai įvertinti atsižvelgiant į galimybę priskirti matavimo svertus pasirinktų aspektų ar kriterijų svarbai nustatyti. 3. Pateikti 6 veiklos vertinimo aspektai buvo priimtini abiem ekspertų grupėms, 32 iš 40 veiklos vertinimo kriterijų buvo vertinti bendru ekspertų sutarimu ir atskleidė žemą suderinamumo laipsnį vertinant skirtingus veiklos aspektus tarp abejų ekspertų grupių. Abi ekspertų grupės sutinka su siūlomais veiklos vertinimo kriterijais ir jų naudojimu organizacinei veiklai vertinti, palankiausiai atsiliepę tarptautinių varžybų rezultatų 643 ‘‘Societal Innovations for Global Growth‘‘, 2012, No. 1(1) ISSN 2335-2450 (online) veiklos aspektą, kuris atitinka SSF strateginius tikslus ir dabartinę KKSD lėšų skyrimo sporto šakų federacijoms praktiką. Tikėtina, jog atliktas tyrimas paskatins suinteresuotas šalis sukurti adekvatų sporto šakų federacijų veiklos vertinimo modelį, grįstą optimaliais kriterijais, kurie racionalizuos viešųjų finansų paskirtį ir prisidės kuriant pridėtinę sporto vertę visuomenėje. Literatūra Baltoji knyga dėl sporto. (2007), http://ec.europa.eu/sport/documents/white-paper/whitepapershort_lt.pdf Bayle, E., Robinson, L. (2007), ‘‘A framework for understanding the performance of national governing bodies of sport’’, European Sport Management Quarterly, Vol. 3, No 7, pp. 249 – 266. Developing the European Dimension in Sport. (2011), http://ec.europa.eu/sport/news/communication-on-sport-adopted_en.htm Chappelet, J. L. (2010), Autonomy of sport in Europe. France: Council of Europe Publishing. Eligibility criteria for the recognition of national sporting organisations by the Australian sports commission 2009 – 2013 m (2009), Interneto prieiga: http://www.ausport.gov.au/__data/assets/pdf_file/0003/336432/200913_NSO_Recognition_Eligibility_Cr iteria.pdf (žiūrėta 2012 03 23). Kūno kultūros ir sporto departamento prie Lietuvos Respublikos Vyriausybės generalinis direktorius (2010), Lėšų skyrimo 2010-2012 metams sporto šakų plėtotei principai, Nr. V-25. Kūno kultūros ir sporto departamento prie Lietuvos Respublikos Vyriausybės generalinis direktorius (2009-2010), Sporto (šakų) federacijų pripažinimas, Nr. V-180; Nr. V-243; Nr. V-180; Nr. V-378; Nr. V-391; Nr. V-402; Nr. V-420, Nr. V-363. Lietuvos ir Šveicarijos bendradarbiavimo programa (2010), Lietuvos ir Šveicarijos bendradarbiavimo programos nevyriausybinių organizacijų (NVO) subsidijų schemos galimybių studija. Vilnius. Lietuvos Respublikos kūno kultūros ir sporto įstatymas (2008), Interneto prieiga: http://www3.lrs.lt/pls/inter2/dokpaieska.showdoc_l?p_id=318298 (žiūrėta 2012 04 17). Lietuvos sporto statistikos metraštis.(2012). Lietuvos sporto informacijos centras. Vilnius. Madella, A., Bayle, E., Tome, J. (2005), ‘‘The organisational performance of national swimming federations in Mediterranean countries: A comparative approach ”, European Journal of Sport Science, Vol 4, No 5, pp. 209 – 216. Mowbray, D. (2012), The contingent and standards governance framework for national governing bodies. Robinson, L., Chelladurai, P., Bodetand, G. P. Downward Routledge handbook of sport management. London and New York: Routledge Taylor and Francis Group. Olympic Programme Commission (2004), Evaluation criteria for sports and disciplines, Interneto prieiga: http://www.olympic.org/Documents/Reports/EN/en_report_813.pdf (žiūrėta 2012 03 23). Sport funding and accountability framework (SFAF III: 2010 – 2014). National sport organisations eligibility criteria (2010), Interneto prieiga: http://www.pch.gc.ca/pgm/sc/pgm/cfrs/index-eng.cfm (žiūrėta 2012 03 23). Papadimitriou, D. (2007), ‘‘Conceptualizing effectiveness in a non-profit organizational environment. An exploratory study”, International Journal of Public Sector Management, Vol 7, No 20, pp. 571 – 584. 644 ‘‘Societal Innovations for Global Growth‘‘, 2012, No. 1(1) ISSN 2335-2450 (online) Puškorius, S. (2010), ‘‘Veiklos matavimų viešajame sektoriuje raida ir tendencijos”, Viešoji politika ir administravimas, No 34, pp. 10 – 15. Study on the funding of grassroots sports in the EU: with a focus on the internal market aspects concerning legislative frameworks and systems of financing. (2011). Eurostrategies, Brussels. http://ec.europa.eu/internal_market/top_layer/services/sport/study_en.htm Šimašius, R. (2007), Ne pelno organizacijos. Prigimtis ir reglamentavimas. Vilnius: Eugrimas. Taylor, M., O’Sullivan, N. (2009), ‘‘How should national governing bodies of sport be governed in the UK? An exploratory study of board structure”, Corporate Governance: An International Review, Vol 6, No 17, pp. 84 – 85. Tamutienė, I., Baltrušaitis, M., Civinskas, R., Jarašiūnaitė, G. (2011), Nevyriausybinio sektoriaus institucinio tvarumo, savanorių įtraukimo, tarpusavio bendradarbiavimo, indėlio į šalies ūkio augimą ir galimybių plėtojimo tyrimo atskaita. Kaunas: Factus Dominus. Winand, M., Zintz, T., Bayle, E., Robinson, L., Qualizza, D. (2010), ‘‘Organizational performance of Olympic sport governing bodies: dealing with measurement and priorities”, Managing Leisure, Vol 15, No 4, pp. 279 – 306. 2011 – 2012 m. Lietuvos strateginių sporto šakų sąrašo patvirtinimas (2011), Valstybės žinios, Nr. 71-3458. SUMMARY Optimization of Performance Measures: Lithuanian Sports Federations Case Study Prof.dr. Vilma Čingienė, Gabrielė Vyštartaitė The article analyzes the model of Lithuanian sports federations performance measures. A federation is a non-governmental, non-profit, independent public sports organization responsible for goal-oriented activities and generating financial resources that for most federations to a great extent depend on annual subsidies made by the government (Lithuanian sport statistical annual, 2012). Appropriations for sports federations are allocated for organizational activities, for increasing the number of population involved in organized sport. However, the basic principle of allocating the funding for physical education and sports development programmes is based on athletic performance in European and World championships, Olympic Games, and other significant international competitions. Nevertheless, many completed research results (Bayle ir Robinson, 2007; Chappelet, 2010; Mowbray, 2012) have shown that these criteria are not sufficient to evaluate the achievement level of the goals set by the organization, the organization manager’s abilities to acquire and adequately employ human, financial and physical resources for attaining the targets and to evaluate the 645 ‘‘Societal Innovations for Global Growth‘‘, 2012, No. 1(1) ISSN 2335-2450 (online) organizations’ effectiveness and efficiency. The assessment of a sport federation’s performance has become more complicated, therefore it is important to define organizational performance measures. The article analyzes the examples of national sport organizations financing models used in foreign countries (Madella ir kt., 2005; Bayle ir Robinson, 2007; Papadamitriou, 2007; Winand ir kt. 2010; Olympic Programm Committee, Australia and Canada) and the proposed model based on these example models. Two groups of experts gave their opinions regarding the proposed performance measurement for the evaluation of Lithuanian sports federations’ activities. The involvement of the government in sports is based on the goals in healthcare, social control and communication, diplomacy and economic growth. The government attains the said goals by implementing functions related with legal regulation of sport, sport development, and public opinion formation. The research is expected to optimize the sports federations’ performance measurement model in the interests of both federations and the government. Key-words: sport policy, activity evaluation, activity criteria‘s, national sport federation. 646 ‘‘Societal Innovations for Global Growth‘‘, 2012, No. 1(1) ISSN 2335-2450 (online) ORGANIZACIJOS LYDERIO VAIDMUO, KURIANT IR PLĖTOJANT SOCIALINĖS PARTNERYSTĖS RYŠIUS Doc. dr. Agota Giedrė Raišienė Mykolo Romerio universitetas Politikos ir vadybos fakultetas Vadybos katedra Valakupių g. 5, LT-10101 Vilnius El. paštas: [email protected] Santrauka Vertinant konceptualiai, galima išskirti keletą grynųjų tarporganizacinės sąveikos formų. Tai: integruotasis bendradarbiavimas (angl. integrated cllaboration), partnerystė, sąjunga, kooperacija, tinklai, bendradarbiavimas konkuruojant (angl. coopetition) ir konkurencija. Šiuo atveju, sąveikos skirstymo į kategorijas pagrindas yra sąveikaujančių organizacijų tarpusavio ryšių integralumas, įgyvendinant organizacinius ir tarporganizacinius tikslus. Kadangi didesnė bendradarbiavimo nauda gaunama labiau integruotose sąveikos formose, paties bendradarbiavimo vystymu turėtų būti rūpinamasi ne mažiau nei bendros veiklos tikslų siekimu. Straipsnyje diskutuojami veiksniai, leidžiantys sėkmingai vystyti tarporganizacinius santykius bei plėtoti tarporganizacinę veiklą. Diskusija grindžiama atliktu empiriniu tyrimu. Lyginamoji atvejų analizė rodo, kad vadovavimas bendradarbiaujant (angl. collaborative leadership) yra ypatingas veiksnys mąstant apie ilgalaikę tarporganizacinę partnerystę ir inovatyvius bendrus rezultatus. Nagrinėjant atvejus atrasta, kad kuo aktyvesnė neformalaus, „idėjinio“ žmogaus telkiamoji veikla ir kuo geriau subalansuotas jo dėmesys tikslams ir procesams, tuo aukštesni bendros veiklos pasiekimai. Nors socialinės partnerystės plėtrai neabejotinai svarbūs tokie veiksniai kaip vadybos procesų darna, partnerystės darbo grupės narių kompetencijų pusiausvyra, efektyvi komunikacija ir išsikelto tikslo ekonominis naudingumas bei patrauklumas partnerystės nariams, be vadovybės palaikymo partnerystė nepasižymės rezultatyvumu. 647 ‘‘Societal Innovations for Global Growth‘‘, 2012, No. 1(1) ISSN 2335-2450 (online) Straipsnyje konstatuojama, kad tarporganizacinės partnerystės sėkmė pirmiausiai priklauso nuo lyderio elgsenos ir jo tarpasmeninių gebėjimų telkti, remti ir vesti grupę link tikslo bei sudominti narius bendros veiklos vizija. Raktažodžiai: tarporganizacinis bendradarbiavimas, partnerystės plėtra, vadovavimas bendradarbiaujant Įvadas Technologiniai, demografiniai, ekonominiai ir kiti sisteminiai pokyčiai iš organizacijų reikalauja adekvataus požiūrio į laikmečio iššūkius. Ilgalaikę veiklos perspektyvą užsibrėžusioms organizacijoms tenka nuolat rūpintis pažanga ir inovacijomis, taip pat ir socialinėmis. Šiuo tikslu organizacijos vis iš naujo vertinta socialinę tikrovę, siekdamos ją pažinti ir kuo sėkmingiau prisitaikyti. Pokyčių kontekste ne tik organizacijoms, bet ir visuomenėms bei atskiriems individams svarbu suvokti, kas yra dėsninga. Tad žinios apie tai, kokiu būdu asmenys ir didesnės bei mažesnės grupės galėtų veikti efektyviau, yra nuolat aktualios. Kaip kinta socialinis pasaulis ir veiksmingos organizacinės elgsenos strategijos, gali pademonstruoti pavyzdys. Pristatydamas savo vadovaujamos mokslo grupės atliktus tyrimus, organizacijų vadybos autoritetas Warren 1967 metais teigė, kad veikdamos po vieną, organizacijos geba sukurti daugiau inovacijų nei veikdamos drauge. Tačiau jau 1974 metais šią hipotezę teko atmesti, nes organizacijų praktika rodė ką kita (žr. Waren et al., 1975). Juolab šiandien nebekyla abejonių, kad ne tik inovacijoms, bet ir apskritai sėkmingai organizacijų veiklai plėtoti yra neišvengiamas organizacijų bendradarbiavimas, nors ir skirtingu integralumo lygmeniu. Vadovo vaidmuo kintant laikmečiui taip pat keičiasi. Tačiau ar keičiasi ir kaip keičiasi tipiškos vadovo elgsenos įtaka organizacijų ir grupių veiklai? Kokios lyderystės tarporganizacinio bendradarbiavimo atveju reikalauja organizacijos šiandien? Organizacijoms, siekiančioms plėtros ir veiklos tęstinumo, svarbu gauti atsakymus į šiuos klausimus. Tad įvertinus tarporganizacinio bendradarbiavimo žinių aktualumą, straipsnyje keliamas tikslas – išsiaiškinti, koks yra formalaus lyderio vaidmuo vystant tarporganizacinius santykius bei siekiant socialinių inovacijų tarporganizacinės partnerystės struktūrose. Diskusija grindžiama atliktu empiriniu tyrimu. Straipsnyje pristatomi apibendrinti tarporganizacinės partnerystės atvejų analizės rezultatai. Tyrimo metodologinį pagrindą sudaro įžvalgos, suformuluotos atlikus tarporganizacinės sąveikos teorinę analizę. Atvejų analizei naudoti giluminio interviu, dokumentų analizės ir stebėjimo dalyvaujant metodai. 648 ‘‘Societal Innovations for Global Growth‘‘, 2012, No. 1(1) ISSN 2335-2450 (online) Pirmoje straipsnio dalyje apžvelgiamos tarporganizacinės partnerystės veiksmingumo prielaidos. Antrojoje dalyje kalbama apie šiuolaikinius lyderystės poslinkius. Trečiojoje – pristatomas atliktas empirinis tyrimas ir pateikiama diskusija pagrįsta tyrimo rezultatais. 1. Tarporganiacinės partnerystės veiksmingumo prielaidos Tarporganizacinės partnerystės veiksmingumas priklauso nuo tarpusavyje susijusių veiksnių, kylančių iš bendradarbiaujančių organizacijų vidinės bei išorinės aplinkos, o taip pat nuo bendrą veiklą vykdančios komandos narių tarpusavio ryšių ir santykių Svarbiausi išorinės aplinkos veiksniai - tai kultūrinė, socialinė bei ekonominė organizacijų veiklos terpė. Socialinei partnerystei vis tik reikšmingiausios įtakos turi visuomenės sociokultūrinis kontekstas. Pavyzdžiui, tradicinėse vakarų kultūrose didesnė reikšmė teikiama veiklos autonomijai ir individualiems individų bei organizacijų pasiekimams (Thompson, 2003; Cull, 2012). Kadangi partnerystės atveju organizacijoms tenka siekti konsensuso ir būti pasirengus dalytis bendros veiklos nauda, įgyvendinti vieningų pastangų reikalaujančius veiksmus individualistinėse kultūrose yra ganėtinai problematiška. Sunkumų kyla taip pat ir dėl to, jog organizacijų bendradarbiavimo procesų neįmanoma izoliuoti, jie yra neatsiejami nuo organizacijų vidinių procesų efektyvumo (Healey et al. 2003; Bussu, Bartels, 2011; Siegel, 2010). Todėl tarporganizacinė partnerystė iš esmės negali būti efektyvi, jei neefektyviai valdomi organizacijų vidiniai procesai Socialinė organizacijų partnerystė taip pat reikalauja palankių organizacinių sąlygų: atitinkamos kartu veikiančių šalių filosofijos, struktūros, išteklių, bendradarbiavimo pastangų rėmimo iš vadovybės pusės ir efektyvaus koordinavimo ir komunikavimo mechanizmų. Organizacijos, kuriose vertinamas dalyvavimas, iniciatyvumas, saviraiškos laisvė, sąžiningumas ir tarpusavio parama bei vyrauja atvirumo ir pasitikėjimo atmosfera, ugdo bendradarbiauti gebančius darbuotojus (Henneman et al., 1995; Grey, 2008). Tokios organizacijos dažniausiai teigiamai vertina dalijimąsi resursais ir rizika (Stichler, 1995). „Aukštos“ hierarchinės organizacijų struktūros apsunkina organizacijų partnerystės galimybes (Vigoda-Gadot, 2004). Jos pasižymi sudėtingais komunikacijos ir sprendimų priėmimo mechanizmais. Kuriant ir plėtojant organizacijų partnerystę, išskirtinį vaidmenį atlieka organizacijų vadovybė. Tarporganizacinio bendradarbiavimo tyrėjai kaip efektyviausią išskiria pagalbųjį (angl. facilitative) vadovavimą, o valdymą grįstą nurodinėjimu, kontroliavimu ir vienasmeniais sprendimais laiko netinkamu (Linden, 2002; Koschmann, 2008). 649 ‘‘Societal Innovations for Global Growth‘‘, 2012, No. 1(1) ISSN 2335-2450 (online) Pagalbusis vadovavimas skiriasi nuo tradicinio, paremto formaliu autoritetu, pirmiausia požiūriu į vadovo funkcijas. Pagalbus vadovas padeda darbuotojams išsikelti asmeninius veiklos tikslus ir suformuluoti užduotis, pataria, kaip tai veiksmingai įgyvendinti, rūpinasi ištekliais, reikalingais darbams atlikti (Morse, 2008). Tarporganizacinė partnerystė reikalauja adekvačių koordinavimo ir komunikavimo mechanizmų. Čia svarbu vieninga partnerių veiklos strategija, standartizuota dokumentacija, visų dalyvaujančių šalių susitikimai ir atviri komunikacijos kanalai (Linden, 2002). Šiais aspektais organizacinės bei grupinės sąveikos įtakos veiksniai persidengia. Tarporganizacinės partnerystės tyrėjai grupinės sąveikos veiksniams skiria didžiausią dėmesį. Mokslinėje literatūroje dažniausiai minimi šie: pozityvios nuostatos ir pasiryžimas bendradarbiauti, tarpusavio pasitikėjimas, abipusė pagarba ir pagalba, atsakomybė, efektyvi komunikacija, konsensusas priimant sprendimus, administraciniai gebėjimai. Trumpai detalizuojant šiuos veiksnius, pasakytina, kad partnerystės subjektų pozityvios nuostatos bendradarbiavimo atžvilgiu yra būtinos, siekiant realizuoti įsipareigojimą veikti nekonkuruojant. Pasiryžimą bendradarbiauti skatina grupės narių sutelktumas, kuris savo ruožtu gali būti formuojamas edukacijos priemonėmis, sėkminga bendra patirtimi ir tinkamu atlygiu. Tarpusavio pasitikėjimą dauguma autorių pripažįsta kaip esminį bendradarbiavimo elementą (Keast, Mandel, 2011). Pasitikėjimas apima ne tik įsitikinimą, kad konkretus partneris arba partnerių organizacija sugebės atlikti bendrai užsibrėžtą užduotį, bet ir viltį, kad sutaps esminės vertybės (Serva et al., 2005). Pasitikėjimui tarp grupės narių atsirasti reikalingas laikas ir pozityvi patirtis. Abipusė pagarba implikuoja tarpusavio priklausomybės bei abipusio įnašo pripažinimą, skatina prisiimti atsakomybę, dalintis rizika ir įgūdžiais (Torres, Margolin, 2003). Taip pat svarbu atvira komunikacija, profesinė kompetencija, administraciniai gebėjimai (Henneman, 1995, Vigoda-Gadot, 2004). Svarbu pažymėti, kad partnerystės veiksmingumo elementų svarbos nesuvokimas arba nepaisymas bei jų tarpusavio sąsajų neįvertinimas gali tapti reikšmingu trukdžiu, plėtojant organizacijų partnerystę tiek proceso, tiek pasiekimų prasme. Vis dėlto, ne visais atvejais organizacijoms išsikėlus bendrus tikslus būtinas intensyvus, integruotas bendradarbiavimas jiems įgyvendinti. Pavyzdžiui, jei organizacijas sieja tik tikslas keistis specifine informacija, jų ryšys nereikalauja specialių vadovavimo gebėjimų, konsensuso priimant sprendimus ir taip toliau. Kitaip tariant, santykinis bendradarbiavimo intensyvumo kriterijus leidžia identifikuoti skirtingas organizacijų sąveikos kategorijas. Grynos tarporganizacinės sąveikos formos aptinkamos 650 ‘‘Societal Innovations for Global Growth‘‘, 2012, No. 1(1) ISSN 2335-2450 (online) retai. Sudėtingiausia priartėti prie integracinio bendradarbiavimo, kuris yra sąveikos dalyvių sąmoningų, kryptingų ir ilgalaikių bendrų pastangų vaisius. Esant palankioms sąlygoms tarporganizacinei sąveikai būdingas tęstinumas ir tobulėjimas. 2. Lyderystės poslinkiai bendradarbiavimo kontekste Kai specifine informacija, aukšta dalykine kompetencija ir darbo komandoje įgūdžiais pasižymi vis platesnis specialistų ratas organizacijose, grupių vadovai neretai išgyvena vidinį konfliktą, jiems tenka vis iš naujo kelti sau klausimą: kokios mano kaip vadovo funkcijos, ką turėčiau daryti, kad šiandien būčiau efektyvus? Šie ir panašūs klausimai lėmė požiūrio į lyderystę poslinkius. Nuo įsitikinimo, jog vadovai geriausiai žino, kaip tvarkyti organizacijos reikalus, vakarietiškos vadybos praktikoje pereita prie supratimo, kad specialistai puikiai išmano kasdienius darbo turinio ir proceso klausimus, todėl jų pagalba, priimant sprendimus, yra būtina. Vadovavimas kaip pirmeivystė (angl. leadership) tampa vis mažiau efektyvi nei vadovavimas kaip sekimas kartu dirbančių specialistų rekomendacijomis (angl. followership). Kaip pažymi Keast ir Mandel (2011), vadovams būtina suvokti savo ir darbuotojų neatsiejamumą, nes vadovai patys savarankiškai, be darbuotojų indėlio, negali įgyvendinti grupės, organizacijos ar tarporganizacinių tikslų. Pastaraisiais dešimtmečiais vadovavimo teorijose išsikristalizavo lyderystės bendradarbiaujant (angl. collaborative leadership) paradigma (Rubin, Hank, 2009; Archer, Cameron, 2008; Middleton, 2007), kuriai galima priskirti koučingą, pagalbųjį vadovavimą (angl. facilitative leadership) ir tarnaujančią lyderystę (angl. servant leadership) (1 pav.). LYDERYSTĖS BENDRADARBIAUJANT PARADIGMA Principinė nuostata - siekti organizacijos tikslų, ugdant darbuotojus, vystant jų asmenines ir plėtojant organizacines galimybes veikti Tarnaujanti lyderystė Pagalbusis vadovavimas Koučingas 1 pav. Lyderystės bendradarbiaujant paradigma ir ją remiančios vadovavimo teorijos 651 ‘‘Societal Innovations for Global Growth‘‘, 2012, No. 1(1) ISSN 2335-2450 (online) Konceptualiai apibūdinant vadovavimą bendradarbiaujant, galima sakyti, kad tai yra bendras kūrybinis procesas, vykstantis bendroje aplinkoje (Vizgirdaitė, 2011). Į bendradarbiavimą orientuotas vadovas daugiausia dėmesio skiria kolektyvinei sėkmei, komandos telkimui, tinkamos bendradarbiauti aplinkos kūrimui, grupės narių interesų ir organizacijos tikslų suderinimui. Šiuolaikinis vadovas turi mokėti įžvelgti konkretaus pavaldinio geriausius gebėjimus ir juos pritaikyti ieškant sprendimų sudėtingose situacijose (Linley at. al., 2009), kitaip tariant, vadovui reikalinga pažinti kiekvieną grupės narį ir su kiekvienu „kalbėtis jo kalba“. Kita vertus, atgimsta tikėjimas, jog vadovas savo charizma turėtų įkvėpti grupę aukštiems pasiekimams, kurių darbuotojai siektų savarankiškai – prisiimdami atsakomybę už sprendimus ir rezultatus (DeRue at. al. 2010). Tarnaujančiosios lyderystės vertę Greenleaf įžvelgė dar 1970 m. Jis teigė, kad hierarchinis vadovų ir darbuotojų atotrūkis nėra naudingas organizacijai (Greenleaf, 1977). Panašaus požiūrio laikosi ir pagalbaus vadovavimo atstovai. Jų nuomone, tik bendradarbiaudamas vadovas gali sukurti palankias sąlygas sutelktomis pajėgomis ir – ilgainiui - mažiausiomis sąnaudomis įgyvendinti organizacijos tikslus (Simonin, 2009). Pagalbusis vadovas domisi grupės narių darbo lūkesčiais, tikslais, svajonėmis ir stengiasi padėti tai realizuoti, darbuotojų veiklą planuodamas ir užduotis formuodamas taip, kad galėtų atsiskleisti geriausi darbuotojų gebėjimai ir būtų panaudoti unikalūs jų įgūdžiai. Taip pat ir apibrėžiant svarbiausius koučingo principus atkreiptinas dėmesys, kad ugdantysis vadovas (koučeris) mokosi iš grupės narių ir drauge su grupės nariais. Kertinė tokio vadovo nuostata yra ta, kad darbuotojai žino geriausiai, ką ir kaip reikia daryti, kad būtų pasiekti iškelti tikslai, ir vadovui svarbiausia – juos tinkamai įgalinti (Misiukonis, 2012). Kalbant apie lyderystės bendradarbiaujant teorijas matyti, kad joms visoms yra bendras ryšių horizontalumas, kai vadovas užuot tikėjęsis, kad darbuotojas neklysdamas atliks jam pavestą darbą, kolegiškai klausia, ne tik kaip konkrečią užduotį specialistas manytų esant geriausia atlikti, bet ir kokią ją duotoje situacijoje būtų tikslinga išsikelti. Tiek tarnaujantysis lyderis, tiek pagalbusis vadovas, tiek koučeris iškilus problemoms remia ir skatina mokytis iš klaidų užuot baudęs. Organizacijoms turint tikslą patobulinti, praturtinti, atnaujinti savo veiklą, išplėsti savo galimybes, vis dažniau jungiamasi į partnerystės tinklus. Čia ypatingos reikšmės įgyja bendradarbiaujančių organizacijų lyderių orientacija į inovacijas apskritai. Deja, kalbant apie Lietuvą, čia ilgą laiką buvo silpnai išreikšta vadovų orientacija į vystymą ir inovacijas (Jucevičius, 2005, p. 15), o individualistinė kultūra ir nesuvoktas 652 ‘‘Societal Innovations for Global Growth‘‘, 2012, No. 1(1) ISSN 2335-2450 (online) bendradarbiavimo turinys bei nežinomi bendradarbiavimo įgyvendinimo įrankiai vis dar daugiau ar mažiau apsunkina realias organizacijų bendradarbiavimo galimybes. Lietuvoje optimizmo teikia naujausių lyderystės tyrimų duomenys. Lyderystės kompetencijos pradedamos laikyti aktualesnėmis nei vadovavimo įgūdžiai (Šilingienė, 2011), asmeninės ir profesinės lyderystės bei karjeros takoskyra pamažu nusitrina (Dromantaitė-Stancikiene, 2011). Skaržauskienė (2011) atkreipia dėmesį, jog vadovavimas yra susijęs su tikslų pasiekimu, o lyderystė - su įtaka. Kaip teigia Diska (2009, p.16), vadovas veikia pagal nustatytą atsakomybę ir procedūras, ir iš esmės nieko naujo nekuria. Tuo tarpu lyderis, atvirkščiai, formuoja užduotis ir siekia kurti. Jam svarbu pritaikyti naujoves ir įgyvendinti pokyčius. Apibendrinant galima teigti, kad organizacijoms siekiant inovacijų, sėkmei svarbiausias –vadovo pasirinkimas: ar būti vadovu, ar lyderiu, ir ar būti „virš grupės“, ar „drauge su grupe“. 3. Empirinio tyrimo metodika Lyderio elgsenos įtakos tarporganizacinės partnerystės veiklai ir rezultatams, ypač socialinių inovacijų iniciavimui ir įgyvendinimui, tyrimas – tai dalis platesnio longitudinio tyrimo, kuriuo siekiama pažinti ir charakterizuoti tarporganizacinės sąveikos praktikos bruožus Lietuvos viešajame ir nepelno sektoriuose. Straipsnyje aptariamas tyrimas vykdytas 2011 lapkričio mėn. – 2012 gegužės mėn. laikotarpiu, pasitelkus kokybinius metodus: giluminį interviu, atvejo analizę, dalyvavimą ir refleksiją bei dokumentų analizę. Tyrimo pasikliautinumo užtikrinimo tikslu taip pat buvo organizuotas eksperimentas – inicijuota nauja socialinė partnerystė tirtosiose organizacijose. Eksperimento rezultatai neleidžia teikti kategoriškų išvadų dėl savo vienkartinio pobūdžio ir dėl to, kad nebuvo eliminuotas partnerystės idėją teikiančio asmens poveikio veiksnys, t.y. išankstinio pasitikėjimo efektas. Vis dėl to, lyginant gautus tyrimo duomenis ir naujos partnerystės kūrimo procesą, pastebėta, kad esminiai organizacijų vadovų ir partnerystės grupės narių elgesio modeliai pasikartojo. Tai leidžia daryti išvadą, kad tyrimo duomenys pakankamai patikimi ir atspindintys realią tarporganizacinės partnerystės praktiką tirtosiose organizacijose. Turint tikslą tirti būtent lyderio elgsenos įtaką tarporganizacinei partnerystei, siekta rasti kuo panašesnes savo veiklos pobūdžiu ir tikslais organizacijas. Tam buvo apsibrėžti penki kriterijai: i) organizacijos turėtų veikti socialinių mokslų srityje; ii) organizacijos turėtų siekti mokslo tyrimų komercializavimo ir ekonominės naudos iš darbuotojų intelektinėmis kompetencijomis grįsto tarporganizacinio bendradarbiavimo; 653 ‘‘Societal Innovations for Global Growth‘‘, 2012, No. 1(1) ISSN 2335-2450 (online) iii) organizacijos turėtų pasižymėti aktyvia socialinės partnerystės plėtra; iv) organizacijų plėtojamos tarporganizacinės partnerystės turėtų būti ir sektorinio, ir tarpsektorinio pobūdžio; v) informacija apie organizacijas ir partnerystes turėtų būti prieinama ir pakankama tyrimo duomenų rinkimo ir analizės trianguliacijai užtikrinti. Tyrimui pasirinkti trys minėtus kriterijus atitinkantys socialinės partnerystės atvejai, įgyvendinti dviejose švietimo, mokslo ir tyrimų organizacijose. Tirtosios organizacijos pageidavo, jog jų pavadinimai nebūtų minimi. Todėl organizacijos straipsnyje vadinamos A ir B, o atvejai – A1, A2 ir B. Pirminiai tyrimo duomenys surinkti giluminio interviu būdu apklausiant 5 specialistus A organizacijoje ir 4 specialistus B organizacijoje. Kiekvienas interviu truko nuo 20 iki 45 minučių. Duomenys buvo transkribuoti ir analizuoti. Taip pat informacija buvo surinkta analizuojant partnerystės dokumentus, pvz., partnerystės sutartis, veiklos gaires, kvietimus į susirinkimus/susitikimus/renginius, pranešimus apie įvykdytas veiklas/renginius ir pan. Svarbu pažymėti, kad su gautais interviu ir dokumentų analizės rezultatais bei stebėjimo įžvalgomis buvo supažindinti partnerystės tinklų vadovai, ir jie patvirtino, kad duomenys interpretuoti teisingai. Tokiu būdu pavyko užtikrinti tyrimo įtikimumą. 4. Tyrimo įžvalgos ir diskusija Apibendrinti dokumentų analizės ir giluminio interviu rezultatai pateikti 1 lentelėje. 1 lentelė. Socialinės partnerytės charakteristikos A1, A2 ir B atvejuose. 1 2 Socialinės partnerystės aspektai Pasirašytų (galiojančių) socialinės partnerystės sutarčių Sąveikos forma Atvejis B Atvejis A1 Atvejis A2 18 20 36 Tinklas (nuolatinis ir abipusis dalijimasis informacija), kooperacija (bendrai vykdomos veiklos), partnerystė (jungtiniai projektai, pasidalinti resursai) Tinklas (selektyvus dalijimasis informacija), kooperacija (įnašas partnerių organizacijai vykdant savo tiesiogines veiklas) Tinklas (dalijimasis srities informacija), kooperacija (bendrai vykdomos veiklos, pvz., susitikimai, kuriuose planuojami tyrimai) 654 ‘‘Societal Innovations for Global Growth‘‘, 2012, No. 1(1) ISSN 2335-2450 (online) 3 Tarporganizacinių ryšių kryptys ir stilius Ryšiai palaikomi visame tinkle, daug dėmesio skiriama naujokų integracijai Ryšiai palaikomi diadomis, apsiribojama formaliu bendravimu 4 Augimo dinamika 2-5 nauji partneriai per metus 4-7 nauji partneriai per metus 5 Partnerių atrankos pagrindas Ta pati arba papildanti veiklos sritis, aiški bendros veiklos vizija 6 Pagrindinis bendros veiklos tikslas Socialinės inovacijos, inovacijų komercializavimas 7 Veiklos iniciatyvos kryptis 8 Veiklos gairių dokumentacija Įsipareigojimo laipsnis Iniciatyva kyla ir iš partnerių, ir iš vadovaujančios organizacijos Veiklos gairės dokumentuotos Vidutiniškas įsipareigojimas planuojant bendras veiklas. Aukštas įsipareigojimas vykdant jungtinius projektus Vidutinė rizikos tolerancija Vadovaujančiosios organizacijos lyderis Viešojo sektoriaus institucijos ir kitos organizacijos, pasižyminčios aukšta socialinės įtakos galia Socialinės inovacijos, nukreiptos į vadovaujančios organizacijos ekonominius tikslus Iniciatyva kyla iš vadovaujančios organizacijos 9 10 Požiūris į riziką 11 Jungtinės veiklos iniciatorius 12 Sąveikos turinys Intensyvus bendradarbiavimas, keičiantis informacija, generuojant naujas idėjas, planuojant veiklas bei pasiskirstant atsakomybėmis Veiklos gairės nedokumentuotos Žemas įsipareigojimas planuojant bendras veiklas Jungtiniai projektai nevykdomi Žema rizikos tolerancija Artimiausius ryšius su partnerine organizacija turintis vadovaujančios organizacijos atstovas Nėra nuolatinio bendradarbiavimo Ryšiai palaikomi visame tinkle, tačiau didesnis dėmesys naujiems nariams neskiriamas 1-2 nauji partneriai per metus, tačiau atsiranda ir nebeaktyvių narių Vietos savivaldos srityje veikiančios valstybinės ir nevyriausybinės organizacijos. Socialinės inovacijos, tyrimų komercializavimas. Iniciatyva kyla vadovaujančios organizacijos iš Veiklos gairės dokumentuotos Vidutinis įsipareigojimas planuojant bendras veiklas Aukštas įsipareigojimas vykdant jungtinius projektus Žema rizikos tolerancija Tarporganizacinės partnerių grupės lyderis Reti susitikimai, skirti keistis informacija ir planuoti bendras veiklas Informacinio pobūdžio bendri projektai 655 ‘‘Societal Innovations for Global Growth‘‘, 2012, No. 1(1) ISSN 2335-2450 (online) 13 Komunikacijos, ryšių palaikymo ir sprendimų priėmimo pobūdis Komunikacija intensyvi, nuolatinė. Ryšių palaikymo iniciatyva kyla iš vadovaujančiosios organizacijos ir partnerių organizacijų lyderių. Sprendimų priėmimo galia pasidalinta. Nėra komunikacijos periodiškumo. Ryšiai palaikomi per pavienius asmenis, turinčius artimesnius santykius su partnerių organizacijų vadovybe. Sprendimus priima vadovaujančiosios organizacijos lyderis. Komunikacija vyksta periodiškai, vadovaujančiosios organizacijos lyderio iniciatyva. Ryšių palaikymas vienpusis. Partnerystės šalių atstovai į sprendimų priėmimą įtraukti silpnai, formaliai. Tyrimo duomenimis, kuo artimesni sąveikaujančių organizacijų tikslai ir kuo geriau jie iškomunikuoti tarp partnerių, t.y. partnerystės tinkle, tuo daugiau šių organizacijų atstovų save emociškai suvokia kaip visumos – bendro darinio – narius ir tuo aktyviau organizacijų nariai imasi savanoriškos iniciatyvos veikti ir kurti bendram labui. Tyrimas taip pat atskleidė, kad bendros veiklos ir abipusiai naudingi tikslai, kai jie inicijuoti lyderių ir jų remiami, yra realizuojami sparčiau ir kokybiškiau, nei tuomet, kai lyderiai į organizacijų sąveikos procesus (ypač pradiniuose etapuose) įsitraukti vengia arba neturi pakankamai gebėjimų. Be to, svarbu pažymėti, kad 1) kai nėra sukurta organizacijos narių įtraukimo/dalyvavimo partnerystės procesuose mechanizmų, tačiau 2) lyderis atsakomybę už bendros veiklos iniciavimą perkelia darbuotojams (tai pateikdamas, pvz., kaip kolektyviškumo skatinimą ir asmeninės darbuotojų iniciatyvos rėmimą), tarporganizacinė partnerystė lieka formali. Tokiu atveju reali veikla tarp partnerystės sutartis pasirašiusių organizacijų nevyksta. Atlikta metaanalizė parodė, kad partneriams siekiant inovacijų, svarbiausias – formalaus darbo grupės vadovo apsisprendimas: ar būti „virš grupės“, ar „drauge su grupe“. Aptariamasis empirinis tyrimas patvirtino, kad inovacijų tikimybę labiausiai didina lyderis, veikiąs „drauge su grupe“, ir pasitelkiantis bendradarbiaujančios lyderystės instrumentus. Straipsnyje aptarti tarporganizacinės partnerystės atvejai rodo, kad lyderystė bendradarbiaujant yra ypatingas veiksnys galvojant apie ilgalaikę tarporganizacinę partnerystę ir inovatyvius bendrus rezultatus. Nagrinėjant atvejus atrasta, kad kuo aktyvesnė „idėjinio“ žmogaus telkiamoji veikla, tuo kokybiškesni objektyvūs bendros veiklos pasiekimai. Todėl keliama prielaida, kad bendradarbiavimo sėkmė iš esmės priklauso ne nuo formaliai „teisingos“ vadybos, bet pirmiausia nuo raktinio žmogaus 656 ‘‘Societal Innovations for Global Growth‘‘, 2012, No. 1(1) ISSN 2335-2450 (online) Vadovo dėmesio laukai tarporganizacinės socialinės partnerystės planavimo ir įgyvendinimo etapuose elgsenos ir jo tarpasmeninių gebėjimų telkti, remti ir vesti grupę link tikslo bei plėtoti bendros ateities viziją. Be to, vadovams svarbu suprasti, jog kalbant apie tarporganizacinės partnerystės veiksmingumą, jų dėmesio laukai turėtų skirtis bendros veiklos planavimo ir įgyvendinimo etapuose (2 pav.). Organizacijų vidinės prielaidos tarporganizacinės partnerystės įveiklinimui 1. Adekvatus partnerystės poreikio, galimybių bei iššūkių įvertinimas 2. Atvirais interesais paremtas, partnerystei motyvuojantis tikslas 3. Efektyvus strategijos ir pageidaujamų veiksmų retransliavimas darbuotojams 4. Iniciatyvą, kūrybiškumą ir kolegiškumą aktyviai remianti organizacijos kultūra Sąlygos tarporganizacinės partnerystės progresui 1. Konkrečiai apibrėžti ir efektyviai iškomunikuoti tarporganizacinės partnerystės tikslai ir laukiama nauda 2. Patirties, charizmos arba neformalaus autoriteto pagrindu suformuotas pasitikėjimas vadovu 3. Partnerystės dalyvių įgalinimas priimant sprendimus Prielaidos inovacijoms, plėtojant tarporganizacinę partnerystę 1. Vadovavimas remiantis bendradarbiaujančios lyderystės principais ir metodais 2. Adekvatus atlygis darbo grupės nariams ir už tikslą realizuojančius rezultatus, ir už bendradarbiavimo iniciatyvas 2 pav. Vadovo dėmesio laukai bendros veiklos planavimo ir įgyvendinimo etapuose. Ankstesniuose tyrimuose, vykdytuose viešajame sektoriuje, pastebėtas fenomenas, kai tarporganizacinės partnerystės ryšiai užmezgami neturint aiškios vizijos, neapmąsčius, kokiu tikslu tai daroma (Raisiene, 2009). Tirtosiose organizacijose pasirašant partnerystės sutartis su kai kuriais partneriais tai taip pat būdinga. Tuomet formalus lyderis veikia ne „virš grupės“ ir ne „drauge su grupe“, bet „šalia“ formalios 657 ‘‘Societal Innovations for Global Growth‘‘, 2012, No. 1(1) ISSN 2335-2450 (online) grupės, todėl realių veiksmų iš esmės nėra. Atrodo, kad tokių partnerysčių nariai pasitenkina žinojimu, jog partnerystės sutartis (kritiškai vertinant – pasikeitimas kontaktais) tiesiog suteikia galimybę veikti kartu ateityje. Tai galima vertinti ir neigiamai, ir teigiamai. Viena vertus, tokios – dirbtinės - socialinės partnerystės stabdo bendradarbiavimo kultūros plėtrą. Sutartis pasirašiusių organizacijų darbuotojai ir klientai, nematydami realios tarporganizacinės veiklos rezultatų, ima abejoti bendradarbiavimo nauda apskritai, laiko tai greičiau teoriniu, koncepciniu nei praktiškai įgyvendinamu ir apčiuopiamą vertę turinčiu dalyku. Bendradarbiavimo samprata nuskurdinama. Bendradarbiavimas lieka tarsi definicija, nurodanti nusiteikimą nekonkuruoti, ir nereikalaujanti realių partnerystės sutartimi susisaisčiusių organizacijų veiksmų ar įsipareigojimų. Žinoma, socialinėms inovacijoms ir kūrybingų pokyčių iniciatyvoms rastis toks bendradarbiavimo supratimas nepadeda. Antra vertus, būtina atsižvelgti į tai, kad Lietuvoje dar visai neseniai organizacijų bendradarbiavimas atrodė įmanomas tik politikos srityje, o pati bendradarbiavimo sąvoka turėjo neigiamą atspalvį dėl istorinės patirties. Ilgą laiką visuomenei suprantamesnė buvo kooperacija. Tačiau ir pastaroji dar prieš dešimtmetį buvo siejama su kooperatyvais ir neetišku verslu. Tad sveikintinas turėtų būti net ir pats faktas, kad šiandien Lietuvoje aktyviai kuriami socialinių partnerių tinklai, o organizacijos ima suvokti partnerystės galią, siekiant plėtros, konkurencingumo ir socialinių-ekonominių pokyčių. Taip pat pozityvu tai, kad tokias partnerystes, nepaisant jų formalumo, palaiko organizacijų vadovybė. Teigiamo vadovybės požiūrio į partnerystę dėka galima tikėtis kito tarporganizacinio bendradarbiavimo brandos etapo: kad ims rastis lyderiai iš šių organizacijų specialistų tarpo, kurie pasiryš savo idėjas realizuoti sutelkdami savosios ir partnerių organizacijos resursus ir tokiu būdu žengdami didelį žingsnį link plataus masto inovacijų iniciavimo ir įgyvendinimo. Maža tyrimo apimtis neleidžia generalizuoti išvadų. Todėl būtų tikslinga atlikti tolesnius tyrimus ir palyginti, kaip šio straipsnio įžvalgos atsispindi kituose tarporganizacinės socialinės partnerystės pavyzdžiuose. Literatūra Archer D., Cameron A. (2008). Collaborative leadership – how to succeed in and interconnected world. Butterworth Heinemann. Bussu S., Bartels K. P.R. (2011) Facilitative Leaders in Collaborative Governance: Windows of Opportunity and Window Dressing in Italy. PSA Annual Conference. London, April 19-21. 658 ‘‘Societal Innovations for Global Growth‘‘, 2012, No. 1(1) ISSN 2335-2450 (online) Cull, L. (2012) Each one is already several… Collaboration in the context of the differential self. Notes on Goat Island & Deleuze & Guattari, presented at ‘On Collaboration’, a symposium at Middlesex University, London, UK, 4th May 2012 DeRue D. S., Barnes CH.M., Morgeson F.P. (2010) Understanding the motivational Contingencies of Team Leadership. Small Group Research, Vol. 41, No.5, p. 621-651. Diska V. (2009) Vadovas – lyderis ar administratorius. Ar egzistuoja pusiausvyra? Vadovas: verslo vadyba. Vilnius, Nr. 10(155), p. 15-19. Dromantaitė-Stancikienė A. (2011) Subalansuotas lyčių atstovavimas siekiant profesinės karjeros : daktaro disertacija : socialiniai mokslai, vadyba ir administravimas. Vilnius : MRU, 2011. ISBN 9789955192916. Gray B. (2008) Intervening to Improve Inter-organizational partnerships. In: Cropper S., Ebers M., Huxham Ch., Ring P.S. (eds.) The Oxford Handbook of Inter-organizational Relations, Oxford University Press. Greenleaf R. K. (1977). Servant leadership. Mahwah, NJ: Paulist Press. Healey P., Magalhaes, C., Madanipour A. and Pendlebury, J. (2003) Place, identity and local politics: analyzing initiatives in deliberative governance. In: Hajer M., Wagenaar H. (eds.) Deliberative Policy Analysis, Cambridge: University Press. Henneman E.A., Lee J.L., Cohen J.I. (1995) Collaboration: concept analysis. Journal of Advanced Nursing, Vol.21, p.p. 103-109. Jucevičius G. (2005) Managerial Orientations in the Context of Emerging System of Vocational Training and Labour Relations of the Transformation Economy. Social issues of organization management. Socialiniai mokslai, Vol. 1(47), p. 7-15. Keast R., Mandell M. (2011) The Collaborative Push: Pushing Beyond Rhetoric and Gaining Evidence. In 15th Annual Conference of the International Research Society for Public Management. Queensland University of Technology. Koschmann M.A. (2008) Communication in Collaborative Interorganizational Relationships: A Field Study of Leadership and Stakeholder Participation, ProQuest. Linden R.M. (2002) Working Across Boundaries. Making Collaboration, Work in Government and Nonprofit Organizations. San Francisco: Jossey-Bass, A Wiley Imprint. Linley P.A., Woolston L., Biswas-Diener R. (2009) Strength Coaching with Leaders. International Coaching Psychology Review: The British Psychological Society, Vol. 4, No. 1, p. 20-31. Middleton J. (2007). Beyond Authority – Leadership in a changing world. Palgrave Macmillan. Misiukonis T. (2012) Asmeninio ugdymo praktika vadovams, Vilnius: Vaga. Morse R. S. (2008) Developing leaders in an age of collaborative governance. In Innovations in public leadership development, eds. Ricardo S. Morse, Terry F. Buss, 79-100. Armonk, N.Y.: M.E. Sharpe. Raisiene A.G. (2009) In Quest of Integrated Collaboration. LAMBERT Academic Publishing, Saarbrucken. Rubin H. (2009). Collaborative Leadership: Developing Effective Partnerships for Communities and Schools. Corwin Press. Serva M.A., Fuller J.S. Mayer R.C. (2005) The reciprocal nature of trust: a longitudinal study of interacting teams. Journal of Organizational Behaviour, Vol. 26(6), 625-648. Siegel D.J. (2010) Organizing for Social Partnership: Higher Education in Cross-Sector Collaboration, Taylor & Francis. Silingienė V. (2011) Lyderystės kompetencijos raiška individualios karjeros kontekste. Ekonomika ir vadyba. No. 16, p. 961 – 968. 659 ‘‘Societal Innovations for Global Growth‘‘, 2012, No. 1(1) ISSN 2335-2450 (online) Simonin B. L., Ozsomer A. (2009) Knowledge processes and learning outcomes in MNCS: an empirical investigation of the role of HRM practices in foreign subsidiaries. Human Resource Management, Vol. 48, No 4, p. 505-530. Skaržauskienė A. (2010) Sisteminis mąstymas organizacijų valdyme. Vilnius: MRU. Stichler J.F. (1995) Professional interdependence: the art of collaboration. Advanced Practice Nursing Quarterly, Vol. 1 (1), p.53-61. Thompson J.D. (2003) Organizations in action: social science bases of administrative theory. New Brunswick, NJ : Transaction Publishers. Vigoda-Gadot E. (2004). The case for collaboration: A road map based on the Carmelite project in Israel and some lessons for revitalizing democracies. Public Administration and Management Journal, Vol.9, No.1, p.p.1-14. Vizgirdaitė J. (2011) Meaning of Collaboration: from Different Social Contexts to Common Understanding. Socialiniai mokslai., Vol. 4, No.74, p. 70-83. Waren R.L., Burgunder A.F., Newton J.W, Rose A.M. (1975) The Interaction of Community Decision Organizations: Some Conceptual Considerations and Empirical Findings. In: Interorganization theory (Negandhy A.R. ed.), Center of Business and Econimic Research, Kent State University. Warren R. (1967) Interorganizational Field as a Focus for Investigation. Administrative Science Quarterly, Vol. 12, p.590-613. SUMMARY Organization Leader‘S Role In Creating And Developing Social Partnership Relations Assoc. prof. dr. Agota Giedrė Raišienė The article discusses factors that enable a successful nurture of interorganizational relations as well as to develop inter-organizational work. Discussion is based on an empirical research made. A comparative analysis shows that collaborative leadership is a very important factor in a context of long-term inter-organizational partnership and innovative joint results. Having examined the cases, it was found that the more active the informal assembling activity of the „ideological“ person is, and the better balanced is his attention to goals and processes, the higher results are achieved in joint activity. Despite the fact that factors such as consistency of management processes, balance in group members’ competence, effective communication and the economical benefit and attractiveness of a set goal to the members of partnership are very 660 ‘‘Societal Innovations for Global Growth‘‘, 2012, No. 1(1) ISSN 2335-2450 (online) important for social partnership development, without management’s support the partnership will not be as distinguish very effective. The article ascertains that the success of inter-organizational partnership is firstly influenced by the leader’s behaviour and his inter-personal skills of recruiting, supporting and leading the group towards the goal as well as enthusing the members in the joint activity vision. Key words: interorganizational collaboration, partnership development, collaboratiove leadership. 661 ‘‘Societal Innovations for Global Growth‘‘, 2012, No. 1(1) ISSN 2335-2450 (online) ECONOMIC IMPACTS OF HUNGARIAN MEMBERSHIP IN THE EUROPEAN UNION Dr. Bozsik Norbert Institut of Economics, Methodology and Informatics Károly Róbert College Mátrai út 36. Gyöngyös, Hungary E-mail: [email protected] Abstract This paper analyses some macroeconomic aspects of the accession of Hungary to European Union. Accessing the EU Hungary accepted the obligation that after the necessary preparation time it would satisfy all criteria of the third stage Economic and Monetary Union and introduce the Euro. In compliance with it the Hungarian law and legislations, especially the ones concerning the National Bank of Hungary, were brought into line with EU requirements. One of the important elements of the convergence programme is the preparation of the accomplishment of the Maastricht criteria. Since the beginning of the crisis the budget deficit did not grow significantly in Hungary. However, Hungary has never been able to accomplish, since its accession to the EU, the Maastricht criteria on the 3% deficit, therefore there has been an excessive deficit progress in place against us. One of the important elements of the convergence programme based on the Széll Kálmán Plan is the stable and steady decrease of the national debt. Together with its EU membership Hungary accepted the obligation that it would strive to join ERM-2 exchange rate mechanism when shaping its exchange rate policy. This decision created the total financial independence of the monetary policy thus the central bank could focus solely on inflation when deciding on its monetary policy. Convergence or catching up in a narrow sense means that the real economy performance of less developed countries et closer to that of the more developed member states. 662 ‘‘Societal Innovations for Global Growth‘‘, 2012, No. 1(1) ISSN 2335-2450 (online) Keywords: accession, convergence, economic impacts, exchange rate, factor mobility 1. Introduction When accessing the EU Hungary accepted the obligation that after the necessary preparation time it would satisfy all criteria of the third stage Economic and Monetary Union and introduce the Euro. In compliance with it the Hungarian law and legislations, especially the ones concerning the National Bank of Hungary, were brought into line with EU requirements. The independence of the central bank and the prohibition of monetary financing are guaranteed by law and state organisations are precluded from having access to the resources of financial institutions. The EU standards were taken into consideration and in harmony with them the organisational and operational standards on monetary and exchange rate policy remained in place. (Oblath, 1999) Hungary, unlike Denmark and Great Britain, does not have the right to opt-out that is we are obliged to introduce the Euro. Since its accession Hungary has been participating in the activities of the European System of Central Banks and also in the work and decision making aiming to formulate Integrated Guidelines (IG). In compliance with EU regulations Hungary has made its convergence program every year since 2004. (Erhart, 2009) On the basis of the Council and the Committee it has established that there is excessive deficit in the country and the rules of excessive deficit procedure must be applied. The Council issued a recommendation on 5 July, 2005 about the tasks to be completed in order to terminate excessive deficit. The Council suggested that our country submit the modification of the updated convergence program by 1 September, 2006 “in which it presents its measures which are concrete, structured, and completely consistent with the country’s medium-term adjustment path.” In the autumn of 2006 the new government submitted the revised programme. The Council judged the program focusing on the consolidation of the budget was suitable to terminate excessive deficit. In July 2007 it established that Hungary had taken the necessary measures in order to terminate excessive deficit. The 2007 and 2008 convergence programmes confirmed the aims of the 2006 program stabilizing the already achieved results. The programme submitted in December 2008 – reacting to the unfolding crisis – contained the more rapid decrease of the financing needs of the budget. The 2008 program also considered (together with the Council) that the budget deficit would go beyond the 3% Maastricht threshold level. However, owing to the crisis the budget deficit which had been decreasing since 2006 started to rise again and in 2009 it reached 4.5% of the GDP. Then the Council 663 ‘‘Societal Innovations for Global Growth‘‘, 2012, No. 1(1) ISSN 2335-2450 (online) reinterpreted the previous situation and in its recommendation issued in July 2009 it obliged Hungary to terminate excessive deficit by 2011. In this paper I analyse the development of the Maastricht criteria since the EU accession. In details the four indices (budget deficit, national debt, inflation and longterm interest rate). Then I evaluate the development of the closing-up of the real economy and the exchange rate policy since 2004. Finally, the state of factor mobility is compared to the European Union. The investigated period is between 2004-2011. 2. The development of the Maastricht criteria since the EU accession One of the important elements of the convergence programme is the preparation of the accomplishment of the Maastricht criteria. Since the beginning of the crisis the budget deficit did not grow significantly in Hungary. However, Hungary has never been able to accomplish, since its accession to the EU, the Maastricht criteria on the 3% deficit, therefore there has been an excessive deficit progress in place against us. Figure 1. shows the development of the Hungarian budget deficit measured to the GDP. (Bozsik, 2011) (The horizontal line shows the reference level.) 10.00 9.00 8.00 7.00 6.00 5.00 4.00 3.00 2.00 1.00 0.00 2004 2005 2006 2007 2008 2009 2010 2011 deficit/GDP Source: Created by author based on Eurostat (2011) data Figure 1. The development of the Hungarian budget deficit in ratio to the GDP % The level of the Hungarian budget deficit was increasing continuously from the 59% level in 2004 and in 2010 it exceeded 80% of the GDP! The increase of the national 664 ‘‘Societal Innovations for Global Growth‘‘, 2012, No. 1(1) ISSN 2335-2450 (online) debt became dynamic since the beginning of the crisis. This is attributable basically to two things. On the one hand macroeconomic demand dropped significantly due to the crisis thus nominal GDP grew only slightly which was unfavourable for the public debt/GDP quotient. On the other hand the Hungarian government took a €20 billion loan from the IMF, World Bank, and European Union which significantly exceeded its financing needs. It is true that by this move Hungary obtained a sufficient reserve to fulfil its obligations even amid extreme market conditions. Because of the high national debt the repayment of interest became one of the largest items of expenditure of the budget. In 2009 for example it reached HUF1153 billion, which was 4% of the GDP! What is more, since the national debt of Hungary is based on foreign currencies the changes in the exchange rate have a serious influencing effect. Figure 2. shows the development of the Hungarian national debt in relation to the GDP since our accession to the EU. (The horizontal line indicates the Maastricht reference level (60%) here as well.) 90.00 80.00 70.00 60.00 50.00 40.00 30.00 20.00 10.00 0.00 2004 2005 2006 2007 2008 2009 2010 2011 államadóság/GDP national debt/GDP Source: Created by author based on Eurostat (2011) data Figure 2. The development of Hungarian national debt in relation to GDP % One of the important elements of the convergence programme based on the Széll Kálmán Plan is the stable and steady decrease of the national debt. The major part of the revenue from the pension reform is spent on the reduction of the national debt. Concerning the medium-term budgetary objective the Hungarian government aims to 665 ‘‘Societal Innovations for Global Growth‘‘, 2012, No. 1(1) ISSN 2335-2450 (online) achieve a 64% level in relation to the GDP by 2015. In 2012 September the national dept was 77,7% in Hungary. Since 2000 the Netherlands, Finland, and Germany have produced most often the lowest inflation rates. Between 2000 and 2007 the reference rate varied between 0,8% and 1,9% but in 2008 it rose to 2,6% and it 2009 it fell to -1% (because prices decreased in Spain, Portugal, and Ireland). Therefore the maximum 1,5% difference from this value was an extremely great challenge for Hungary. Hungary has never been able to fulfil the inflation criteria since its accession to the EU, what is more the Hungarian inflation values moved in a significantly more uneven manner than the Maastricht reference rates. Until 2006 the rate of economic growth was explicitly high in Hungary and the inflation trends were also favourable. After that, however, the substantial increase of the energy- and food prices in the world market played an important role in increasing inflation in Hungary. From the end of 2007 factors that moderated price increase came into prominence. It was facilitated by the fact that the country got onto the growth path designated in the convergence programme. The economic recession caused by the 2008 crisis resulted in the decrease of the price level but in respect of inflation we have not been able to reach the reference level. Inflation was very high in 2009 (5,6%). It is noteworthy because the economic recession was a great deal higher than the EU average, thus the demand effects should have pushed prices down to the greatest extent in Hungary. The reason for this enduring high level price index is that the tax rate was increased in the past years (regarding primarily VAT). During this period the exchange rate of HUF did not change significantly thus did not affect inflation seriously. Figure 3. shows the development of inflation in Hungary. 9.0 8.0 7.0 6.0 5.0 4.0 3.0 2.0 1.0 0.0 2004 2005 2006 2007 magyar Hungar y 2008 2009 2010 2011 EU 666 ‘‘Societal Innovations for Global Growth‘‘, 2012, No. 1(1) ISSN 2335-2450 (online) Source: Created by author based on Eurostat (2011) data Figure 3. The development of the Hungarian inflation performance since the EU accession The central bank’s inflation target in the medium-term is 3%. In the 2011-2015 convergence program the government also counted with a 3% inflation. Hungary could not reach the Maastricht reference level in the case of the long-term interest rates either. Interest rates are influenced by the inflation and also by how the state of a given economy is judged by the markets. Long-term interest rates have been quite volatile in the past seven years. Figure 4. shows the hectic changes in the Hungarian exchange rates. It is clearly visible that in the rising interest rates the market seriously calculated the price of the Hungarian market risks at the beginning of the crisis. 10 9 8 7 6 5 4 3 2 1 0 2004 2005 2006 2007 2008 2009 2010 2011 Hungary EU magyar Source: Created by author based on Eurostat (2011) data Figure 4. The development of the long-term Hungarian interest rate in relation to the Maastricht convergence criteria The comprehensive Table 1. shows the development of the Maastricht criteria in Hungary since 2004. It can be stated that Hungary has not showed convergence since 667 ‘‘Societal Innovations for Global Growth‘‘, 2012, No. 1(1) ISSN 2335-2450 (online) the EMU accession and its EU membership. In respect of the national debt it even moved away significantly from the 60% Maastricht reference level. Table 1. The development of the Maastricht criteria in Hungary (2004-2011) criteria 2004 2005 2006 2007 2008 2009 2010 2011 deficit/GDP (%) -6,4 -7,9 -9,3 -5,0 -3,7 -4,5 -4,2 -3,2 national debt/GDP (%) 59,1 61,8 65,7 66,1 72,3 78,4 80,2 80,6 inflation (%) 6,8 3,5 4,0 7,9 6,0 4,0 4,7 3,9 interest rate (%) 8,2 6,6 7,1 6,7 8,2 9,1 7,3 7,6 Source: Eurostat 2011 Thus in the present situation it very much seems – contrary to the previous more optimistic ideas – the introduction of the euro will be postponed considerably, which can be further delayed by the uncertain effects of the current crisis. Furthermore, the Euro Zone is currently fighting for its own existence. 3. Exchange rate fluctuation Together with its EU membership Hungary accepted the obligation that it would strive to join ERM-2 exchange rate mechanism when shaping its exchange rate policy. Selecting the exchange rate is the common responsibility of the government and the Monetary Council of the National Bank of Hungary. However, the national bank is solely responsible for controlling the exchange rate. At the time of our EU accession formally the +-15% exchange rate system was applied with a HUF 282,36 medium rate, which is in compliance with the ERM-2 mechanism. Although this 30% interval (between HUF240 and HUF325) provided a broad scope for action for exchange rate fluctuations but it also carried its dangers. On the one hand since Hungary is a small and open economy this exchange rate interval allowed the risk of serious speculation and on the other hand it also hindered the National Bank of Hungary in achieving its inflation targets. Considering all this and in compliance with the decision of the government and the Monetary Council Hungary switched over to the independent floating of the Forint on 25 February, 2008. This decision created the total financial independence of the monetary policy thus the central bank could focus solely on inflation when deciding on its monetary policy. 668 ‘‘Societal Innovations for Global Growth‘‘, 2012, No. 1(1) ISSN 2335-2450 (online) Since our accession the HUF/Euro exchange rate fluctuated between HUF265 and HUF290 with the exception of some short periods. (Figure 5.) 290 270 250 230 210 190 170 150 2000 2002 2004 2006 2008 2010 Source: Created by author based on KSH 2011 data Figure 5. The development of the HUF/Euro exchange rate between 2001 and 2010 4. The development of the closing-up of the real economy Convergence or catching up in a narrow sense means that the real economy performance of less developed countries et closer to that of the more developed member states. The most often used index number to measure the performance of the real economy is the GDP per capita in purchasing power parity. Hungary’s real convergence to the EU27 average made very little headway during the first eight years after our EU accession. Considering GDP per capita in 2004 Hungary stood at 63% of the EU average and by 2011 this figure rose only to 66%. In 2004 the GDP measured at purchasing power parity (PPP) per capita was 13 600 Euro/capita which rose to 16 500 Euro/capita by 2011. Hungary’s economy was very sensitively affected by the crisis. The first three years after the accession showed a 4-5% growth and after a two-year 669 ‘‘Societal Innovations for Global Growth‘‘, 2012, No. 1(1) ISSN 2335-2450 (online) stagnation the economy fell back by 6,8% in 2009. In 2010 and 2011 there was a slight increase again. The comprehensive table 2. shows the development of the main macroeconomic indicators since the EU-accession. Table 2. The main macroeconomic indicators of Hungary Indicator GDP (in million PPS at current price) GDP/capita (PPP in Euro at current price) Economic growth (%) Unemployment rate (%) Employment rate (%) Current balance of payments (GDP %) 2004 2005 137812 143331 13600 2006 2007 2008 2009 2010 2011 150045 154517 160349 152259 158080 164905 14200 14900 15400 16000 15200 15800 16500 4,9 4.0 3,9 0,1 0,9 -6,8 1,3 1,7 6,1 7,2 7,5 7,4 7,8 10,0 11,2 10,9 56,8 56,9 57,3 57,3 56,7 55,4 55,4 55,8 -8.3 -7.2 -7.4 -7.3 -7.3 -0.1 1.2 1,4 Source: Eurostat 2012 The table reveals that compared to 2004 there was improvement regarding only one indicator. The -8,3% deficit of the balance of payments in 2004 totally disappeared by 2010, what is more the account balance was positive in 2011. 5. The state of labour mobility The flexibility of factor markets plays an important role in fending off asymmetric shocks. The flexibility of capital markets is given due to the nature of capital, what is more the Hungarian economy has by now integrated into global capital markets. Furthermore, in order to fulfil EU requirements – apart from temporary restriction on land purchase – Hungary has implemented a total capital market liberalisation. In connection with the international integration of the labour market we have to mention labour market flexibility. The mobility of the Hungarian work force – comparing it to 670 ‘‘Societal Innovations for Global Growth‘‘, 2012, No. 1(1) ISSN 2335-2450 (online) Europe – is average. The net migration rate was 16 migrants/1000 population in 2009. (Pula, 2005) International observations strongly question the cardinal importance of labour mobility (or its positive effects!) concerning the adjustment to asymmetric shock. The Hungarian labour market is flexible in European Union respects. Basically it is characterised by a high degree of wage adjustment. The costs of hiring and firing workers are fairly low in Hungary that is the protection of employees is low. Employees are moderately organised and trade unions are weak. Only about 20% of all people employed in Hungary are members of a trade union, while this figure is 50% in the EU! These factors enable employers to adjust wages to company revenues in unfavourable circumstances. Labour market processes were unfavourable. Since the EU accession until 2008 the unemployment rate was between 6-8%. However, due to the crisis it rose above 11% by 2010. The truly unfavourable fact is that Hungary had the lowest employment rate in the EU in 2011 (55,8%). Conclusions After empirical time series analysis, it can be stated that: 1. Hungary has never been able to accomplish, since its accession to the EU, the Maastricht criteria on the 3% deficit. 2. The increase of the national debt became dynamic since the beginning of the crisis and it exceeded 80% of the GDP in 2010. 3. Hungary has never been able to fulfil the inflation criteria since its accession to the EU, what is more the Hungarian inflation values moved in a significantly more uneven manner than the Maastricht reference rates. The reason for this enduring high level price index is that the tax rate was increased in the past years (regarding primarily VAT). 3. Hungary could not reach the Maastricht reference level in the case of the longterm interest rates either. 4. Hungary switched over to the independent floating of the Forint on 25 February, 2008. This decision created the total financial independence of the monetary policy thus the central bank could focus solely on inflation when deciding on its monetary policy. 5. Hungary’s real convergence to the EU27 average made very little headway during the first eight years after our EU accession. (From 63% (in 2004) to 66% (2011).) 6. The mobility of the Hungarian work force – comparing it to Europe – is average. The Hungarian labour market is flexible in European Union respects. Basically it is characterised by a high degree of wage adjustment. 671 ‘‘Societal Innovations for Global Growth‘‘, 2012, No. 1(1) ISSN 2335-2450 (online) References Bozsik, N. (2011), Az Európai Unió gazdaságtana. SALDO kiadó Zrt. Budapest, pp. 192-217. Dienes – Oehm, E. (2009), Magyarország az Európai Unió belső piacán. Európai Tükör, pp. 74-87. Erhart, T. (2009), Fél évtized a Gazdasági és Monetáris Unióban Európai Tükör pp. 184-199. Hungarian Statistical Office database (2011) Eurostat database (2011) Oblath, G. (1999), A maastricht-i szerződés fiskális kritériumai és a hazai államháztartási helyzet értelmezése. Közgazdasági Szemle XLVI. évf. pp. 851-872. Pula, G. (2005), Az euro bevezetésével járó struktúrális politikai kihívások:munkapiac. MNB tanulmányok 41. Magyar Nemzeti Bank pp. 1-62. 672 ‘‘Societal Innovations for Global Growth‘‘, 2012, No. 1(1) ISSN 2335-2450 (online) ACTUAL ASPECTS OF ENVIRONMENTAL OBLIGATIONS ENTERPRISES Docent, PhdKoblianskaOlena Assistant, PhdKoblianskaGalyna Department of Accounting and Audit The University of Banking of the National Bank of Ukraine Andriivska Str., 1, 04070, Kyiv, Ukraine E-mail: [email protected] Department of Accounting and Audit Faculty of Economics Taras Shevchenko National University of Kyiv Vasylkivska Str., 90a, 03022, Kyiv, Ukraine E-mail: [email protected] Abstract In today's challenging environmental conditions import role is given to the accounting of the economic and environmental performance of enterprises and enforcement of environmental safety. Despite the fact that the practice of environmental accounting is quite common in the world, in Ukraine it is still underdeveloped. Proof of this is the fact that information about the level of pollution and environmental performance of companies in Ukraine not made public. This information is very important for the survival of the nation because of poor ecological situation in the country. Therefore, the questions of environmental or "green" accounting, preparation of environmental reporting are becoming more important. The article investigates the organizational and methodological aspects of accounting environmental liabilities of enterprises. Justified and identify ways to improve the legislative and regulatory environmental obligations to eliminate methodological and legal inconsistencies and contradictions. Based on the analysis of information on environmental liabilities in accounting, it was concluded that the current P (S) BU 11 "Commitments" only defines the general principles of accounting liabilities of enterprises in general. It was proved, that the existing definition of commitment is desirable to supplement with the environmental component, which occurs at the company in some cases of violation of environmental safety. An approach to the delineation of the obligations into two types: conventional and real, which will improve the methodological support of environmental liabilities. It was examined the practice, investigated the problems and shown the direction of improving the chart of accounts in connection with the specific consideration of 673 ‘‘Societal Innovations for Global Growth‘‘, 2012, No. 1(1) ISSN 2335-2450 (online) environmental obligations, justified the need of separate accounts for the integration of environmental liabilities. Keywords: accounting, environmental liabilities, ecological tax. 1. Introduction Market operating conditions require new approaches to economic management companies who manufacture and violate environmental safety. The main sources of information management, making effective management decisions at the company in the implementation of economic and environmental performance of the enterprise is a system of accounting and auditing. Increasing sizes of violations in the pollution of the environment in Ukrainian enterprises put forward new requirements for the methodology and organization of accounting of environmental liabilities. The current national accounting system is largely divorced from the world practice, that made difficult to record environmental liabilities and the process of Ukraine's integration into the world economy. As the experience of the companies that comprise environmental liabilities, accounting such operations causes many questions, despite the fact that they are complex, risky and can lead to significant gains as well as to significant losses. There is an urgent need to develop theoretical and methodological foundations of environmental operations accounting as one of the components of the business enterprise. The problems of environmental accounting enterprises are in the focus of economists. The study of environmental accounting involved such prominent scientists: V.D. Bazylevych, I.V. Zamula, H.I. Kupalova, P.M. Maidanevych, L.M. Pelyno and others. Analysis of research scientists and economists shows that scientific researches of accounting of environmental liabilities reflect an understanding of issues related to the reform of the national system of accounting and auditing. However, there is a need for further development of improving accounting of environmental liabilities enterprises. Politics, theoretical and practical importance in solving the problems, the lack of research, and the need to find ways to improve the integration of environmental liabilities stipulated choice of topic research paper. The aim of the article is a synthesis of theoretical and organizational framework of accounting environmental liabilities and the implementation of environmental commitments and to develop recommendations for improving the methodology and organization of environmental liabilities to form reliable information about the state of environmental liabilities in the financial reporting of domestic enterprises. To achieve the above objectives were as follows: 674 ‘‘Societal Innovations for Global Growth‘‘, 2012, No. 1(1) ISSN 2335-2450 (online) - Clarify the meaning of "environmental liabilities", to determine their species for the theoretical study of approaches and accounting such transactions in the modern business environment; - Justify the need of the introduction individual accounts to reflect environmental liabilities; - Offer the scheme of accounting of environmental liabilities and the mechanism of disclosure of information about them in the forms of statements; - Identify ways to improve the legal and regulatory environmental liabilities to address methodological and legal disagreements and contradictions. The object of study is environmental liabilities domestic enterprises - economic entities. The subject of the study is a set of theoretical, methodological and organizational principles of accounting environmental liabilities of companies and their improvement in terms of reforming the national accounting system. Methods. To attain these objectives, it is used general scientific methods of cognition and specific. The methodological basis of the study is the dialectical method, which allowed investigate the genesis of the system of environmental liabilities in the dynamics and quantitative and qualitative changes. Decisive in solving the tasks were so general scientific methods of cognition: induction, deduction, abstraction and formal logic (for disclosure of the contents of the conceptual apparatus on objects of environmental liabilities); observation, comparison, grouping, method of averages (for array processing statistics for environmental liabilities of domestic enterprises), analysis, synthesis (with refinement and study accounts of environmental liabilities enterprises); comparative characteristics (in determining the main parameters of financial and tax accounting of environmental liabilities enterprises); graphical method (for scientific presentation of research results in the form of tables, charts). Information base research is legal and normative documents, national accounting standards, publications in periodicals, works of local and foreign scientists, the State Statistics Committee of Ukraine. 2. Assessment of Social Value Concepts Acquisition of environmental problems the global status tends to considering environmental factors in economic systems. Another essential component of permanent development of Ukraine is the state policy in the field of greening of economic systems. Environmental policy in the modern scientific literature considered as a system of goals and measures realized by state and local authorities aimed to ensure ecological balance 675 ‘‘Societal Innovations for Global Growth‘‘, 2012, No. 1(1) ISSN 2335-2450 (online) and environmental protection, which requires consideration of environmental factors in all sectors of activity, and to ensure ecological safety of living conditions by methods that taking into account the specific areas. 2.1 Value creation for an organization It is described the ecological problems at the enterprise level in terms of accounting and taxation. A significant part of the promotion of enviromentally-balanced environmental management and key ensure of environmental safety at all levels of management is an adequate accounting system that provides all members of society with reliable, timely and useful information about economic activity of enterprises and organizations, the state of their assets, liabilities and equity. Accounting provides an opportunity to have a numerical description of factors and can be a source of information, and thus encourage environmental protection measures1. Ecological crisis has caused the emergence of the concept of stable development, which provides the harmonization of relations of human activity and the environment, economy and ecology, nature and technology. The most important element of the concept is the environmental efficiency that is measured by cost accounting for environmental measures and by environmental liabilities accounting2. 2.2 Value creation for a consumer Growing environmental liabilities evidenced by an increase in pollution. Question nation's survival today depends entirely on the harmony between man, nature, cosmos as a whole. Today, more than ever, it is important to consider a person (its development, health, morality, spirituality) in close contact with the environment, with the real environment. A living organism - is the main component of ecological society. Without harmony of nature - man - space - can not be normal, healthy human development. The question of the relationship between man and nature are particularly relevant in connection with the severe environmental condition, which today has emerged in Ukraine. One of the obvious criteria of ecological situation in the state is health of its population. Unfortunately nation of Ukraine back in 1991 dies, which no doubt reflects the ecological state of crisis. 2.3 Conception of social value creation for consumer Great importance in solving complex environmental problems is environmental education of the population. 1 Zamula,I.V., (2011), “Environmental income and commitments in the accounting system”, Bulletin of the University of Banking of the NationalBank of Ukraine, Issue1, pp.257-259. 2 Maidanevych,P.M., (2009), “The role of accounting and reporting in the modern environmental management”, Accounting and Finance AIC, No2, pp.52-54. 676 ‘‘Societal Innovations for Global Growth‘‘, 2012, No. 1(1) ISSN 2335-2450 (online) Unfortunately, today we have to admit that the educational level of the population, especially on human ecology is very low. There is no clear system of education in human ecology. That is the theme of environmental liabilities closely connected with environmental protection, which requires consideration of environmental factors in all sectors of activity, and ensuring ecological safety conditions of the population using methods that take into account the specific areas. 3. The Empirical Research Methodology In general, environmental liabilities for 2005-2010 in Ukraine have increased (Table 1). In 2010, they increased by 58.4% compared to 2005. Table 1.Statistics of accrued environmental liabilities in Ukraine (millionhrn) № 1 2 3 4 Environmental liabilities Fees for pollution Fines for administrative violations in the field of nature protection Claims for damages or losses caused as a result of violation of the legislation on nature protection Total 2005 787,3 2,5 2006 863,5 2,8 2007 955,7 1,8 2008 1065,3 2,5 2009 1198,7 2,1 2010 1246, 7 1,9 3,8 5,1 22,8 3,6 8,8 8,7 793,6 871,4 980,3 1071,4 1209,6 1257,3 Here we can see visual representation presented as a graph that will highlight a trend, if it exists. The graph (Figure 1) clearly shows that there is a clear tendency of fees for pollutionimprovement. Their absolute growth from 2004 to 2010 amounted to 545.2 million hrn. The total volume of accrued environmental liabilities has almost identical schedule, only slightly changed by fines for administrative violations in the field of nature protection and claims for damages or losses caused as a result of violation of the legislation on nature protection. Average absolute annual growth was 90.9 million. And the average growth rate of accrued environmental liabilities totaled 109.3% annually (Table 2). 677 ‘‘Societal Innovations for Global Growth‘‘, 2012, No. 1(1) ISSN 2335-2450 (online) Статистика нарахованих екологічних зобов'язань в Україні 1400 1300 1200 Обсяг, млн. грн Volume, million hrn 1100 1000 900 Fees за forзабруднення pollution Збори навколишнього середовища Total volume of accrued Загальний обсяг нарахованих екологічних зобов'язань environmental liabilities 800 700 600 500 400 300 200 100 0 2002 2004 2006 2008 2010 2012 Рік Year Figure 1. Statistics of fees for pollution and total accrued environmental liabilities in Ukraine (millionhrn) Table 2.Dynamics of accrued environmental obligations liabilities in Ukraine (%) № Environmental liabilities Growth rate 1 Fees for pollution 2 Fines for administrative violations in the field of nature protection 3 Claims for damages or losses caused as a result of violation of the legislation on nature protection 4 Total 2005 2006 2007 2008 2009 2010 122,2 108,7 109,7 112,0 110,7 64,3 111,5 112,5 138,9 84,0 104,0 90,5 181,0 134,2 447,1 15,8 98,7 112,4 109,8 112,5 109,3 112,9 244,4 103,4 Despite the fact that the environmental liabilities accounting is fairly common and it is a necessary condition for Ukrainian enterprises in the global environmental crisis, there still is no clear interpretation of environmental liability in the national legislation. The Law of Ukraine "About Accounting and Financial Reporting in Ukraine" defined liability as "enterprise debt that arised as a result from past events, the settlement of which in the future is expected to lead to a reduction of the company's resources that 678 ‘‘Societal Innovations for Global Growth‘‘, 2012, No. 1(1) ISSN 2335-2450 (online) are embodying economic benefits"1. Accounting Regulations (Standards) of Ukraine help to expand understanding about liabilities in part of their recognition, measurement and payment. In AR(S) of Ukraine №11 "Liabilities" is defined the need other liability recognition if it can be reliably measured and there is probability of reduction of the economic benefits as a result from liabilities settlement in the future. That gives a general definition of commitment. 4. The Empirical Research Results/Findings We believe that the above definition of liabilities should be supplemented with the environmental component, describing the conditions of their occurrence at the enterprise. According to scientific literature environmental liabilities arise in three cases: 1) charging for the use of natural resources, 2) failure to comply with applicable environmental laws, making it necessary to compensate for damages, payment of fines, and 3) elimination of negative effects of business on environment. In our opinion, it should be identified as two separate cases of taxing environmentally harmful products (so-called negative incentives) and the opportunity of defining entities for tax benefits for their implementation of environmental programs, providing ecosafety engineering and production technology. There are two types of environmental liabilities: contingent and real. Contingent environmental liabilities are potential liabilities that a company will acquire in the future as a result of environmental pollution today. It is difficult enough to estimate such a liability, in contrast to the real, which may be reflected in accounting. This is due to several reasons: difficulties in establishing emission sources (downthrows), and therefore take actions to remedy the situation; the complexity of determining the level of pollution, and thus the level of expenditures required their elimination; the absence of the allocation of costs between polluters, if there is a couple of them; the imperfect environmental legislation2. 1 Law of Ukraine “On Accounting and Financial Reporting in Ukraine” 16.07.1993 № 996-XIV, access via Internet: http://www.zakon.rada.gov.ua/cgi-bin/laws/main.cgi?nreg=996-14 2 Zamula,I.V., (2011), “Environmentalincomeand commitmentsin the accounting system”, Bulletin ofthe University ofBanking of the NationalBank of Ukraine, Issue1, pp.257-259. 679 ‘‘Societal Innovations for Global Growth‘‘, 2012, No. 1(1) ISSN 2335-2450 (online) If the company’s scale of environmental activities is small, and those activities are not structurally isolated, then environmental liabilities should be reflected in the accounts "Long-term environmental liabilities" and "Current environmental liabilities"1. In large companies with significant scale of business operations concerning environmental activities it is appropriate to reflect environmental liabilities according to analytical sections shown in the table. At large companies with significant business transactions concerning environmental protection of environmental commitments are appropriate, in our view, to reflect in accordance with sections of analytics highlighting relevant subaccounts: Subaccount to synthetic account 1 - liabilities acquired as a result of pollution; Subaccount to synthetic account 2 - liabilities acquired as a result of mining; Subaccount to synthetic account 3 - acquired as a result of damage from technogenic disasters that are given in the table. Table3.Analytical accounting of real environmental liabilities Synthetic Account Account “Tax Payable and Payments” Subaccount to synthetic account Subaccount “Income Tax” Subaccount “Personal Income Tax” Subaccount “Value added tax” Directions of analytical accounting Source of repayment Liabilities acquired as a Cost of production result of pollution (labour, services) Liabilities acquired as a if within the Subaccount result of mining specified size, or “Environmental Tax” financial result if Liabilities acquired as a liabilities over the result of damage from specified size technogenic disasters Source: ZamulaI.V. Environmental incomeand commitmentsin the accounting system, 2011. The reflection in the accounting and tax accounting is necessary to consider that the source of repayment of these liabilities may be the cost of goods (works, services), if the commitment within your size or financial performance if the liability over the amount specified: 1 Pelyno,L.M., (2008), “Place ofenvironmental accountingin the modern systemof accounting and itsimportance inenvironmental”, Scientific BulletinNLTUUkraine, Issue18.2., pp.70-75. 680 ‘‘Societal Innovations for Global Growth‘‘, 2012, No. 1(1) ISSN 2335-2450 (online) Debet "Expenses" or "Income" and Credit "Environmental Liabilities". In financial reporting the environmental liabilities shown under "Long-term liabilities" or "Short-term liabilities" in passive balance. As the recognition and assessment of environmental liabilities is not just important, but also an integral part of accounting, we think it is appropriate to develop accounting standards" Environmental Liabilities". Regarding the environmental tax payers and its rates, this information can be found in the Tax Code of Ukraine1. According to the Code, environmental tax payers are entities that do not do business, government agencies, permanent establishments of non-residents during activities of which on the territory of Ukraine (including the continental shelf and the marine economic zone) air and water pollution, waste placing in designated areas, and a formation of radioactive waste, etc. is done. Tax rates vary depending on the scope of pollution and the type of pollutant. They vary from quite small amounts (a few UAH per ton) to the rates that exceed 150,000 UAH per ton. It is important to know that because the issue of environmental accounting has not yet been widespread in Ukraine, the laws have so-called "holes". For example, in section III "Income Tax" of the Tax Code the expenditures on conservation of ecological systems living under the negative influence of economic activity of the taxpayer can be recognized as costs. In other words, it is a possible interpretation that the taxpayer may expense any spending on maintenance of ecological systems that are owned by other taxpayers. Besides, there is no explanation of the term "living under the negative influence of economic activity," which allows taxpayers regardless of the degree of such influence to pay any modern factory to support any storages of waste, sewage system and other similar expenses in excess of the norm, regardless the state of implementation of environmental protection activities at the plant. That is, if the plant failed to take appropriate steps to preserve ecosystems in order to obtain extra profits, then adjacent businesses and other taxpayers may transfer funds for the restoration or construction of nature protectors to this plant. Clearly, these transfers are made by reducing the volume of budget revenues, as they relate to the expenses, which reduces profits and, hence, income tax. Conclusions 1 Tax Code of Ukraine: as of 19.01.2012, access via Internet: http://zakon2.rada.gov.ua/laws/show/275517 681 ‘‘Societal Innovations for Global Growth‘‘, 2012, No. 1(1) ISSN 2335-2450 (online) The study set of theoretical, methodological and organizational principles of the environmental liabilities of companies allowed to form conclusions that illuminate tackle major issues paper according to the purpose. 1. In today's ecological crisis implementation of environmental accounting, especially the recognition and measurement of environmental liabilities is not just important, but even an integral part of accounting firms. This in turn leads to the need to develop methods of accounting ecological debt. 2. To solve the problems existing accounting treatment of liabilities it is proposed adding an environmental component, taking into account the conditions of the business and further develop a standard "Environmental Liabilities". Display environmental liabilities in the accounts of the 5th and 6th grade chart of accounts in accordance with the proposed cuts analytics will improve the organization of the accounting process, the quality and transparency of reporting, strengthen enforcement of environmental legislation and environmental conservation. 3. Feature construction accounting operations with environmental liabilities is the need for clear delineation of balance sheet items for play and real, as well as long-term and short-term liabilities. These schemes structure the information about environmental liabilities depending on the balance sheet, the type of environmental performance and impact on the financial result. The proposed structuring of environmental liabilities can significantly reduce the volume of data flow, increase visibility and control over the completeness and timeliness of recording the financial results of the environmental component of the enterprise. 4. Scheme accounting of environmental liabilities is proposed in order to gain a clear reflection of the facts of economic and environmental performance of enterprises and enforcement of environmental safety, combining the process of production and subsequent environmental impacts. That shows a schematic display of accounts and their relationship in chronological and systematic recording. 5. It is proposed to improve the current regulatory methods of accounting and tax accounting of environmental liabilities that can eliminate the differences and problematic aspects of the legislation. These findings could be used by that form the legal basis of national accounting and reporting. References Zamula,I.V., (2011), “Environmentalincomeand commitmentsin the accounting system”, Bulletin ofthe University ofBanking of the NationalBank of Ukraine, Issue1, pp.257-259. 682 ‘‘Societal Innovations for Global Growth‘‘, 2012, No. 1(1) ISSN 2335-2450 (online) Maidanevych,P.M., (2009), “The role ofaccounting and reportingin the modernenvironmentalmanagement”,Accounting and FinanceAIC, No2, pp.52-54. Pelyno,L.M., (2008), “Place ofenvironmental accountingin the modern systemof accounting and itsimportance inenvironmental”, Scientific BulletinNLTUUkraine, Issue18.2., pp.70-75. Law of Ukraine “On Accounting and Financial Reporting in Ukraine” 16.07.1993 № 996-XIV, access via Internet: http://www.zakon.rada.gov.ua/cgi-bin/laws/main.cgi?nreg=996-14. Regulations (Standard) 11 "Commitments": Approved bythe Ministry ofFinance of Ukraine of31.01.2000№ 20, access via Internet: http://www.zakon.rada.gov.ua/cgi- n/laws/main.cgi?nreg=z0085-00. Tax Code of Ukraine: as of 19.01.2012, access via Internet: http://zakon2.rada.gov.ua/laws/show/275517. 683 ‘‘Societal Innovations for Global Growth‘‘, 2012, No. 1(1) ISSN 2335-2450 (online) TRUST IN GOVERNMENT AND TAX COMPLIANCE Assoc. prof. dr. Liucija Birškytė Department of Finance and Taxation Faculty of Economics and Financial Management Mykolas Romeris University Ateities str.20, Vilnius, Lithuania Email: [email protected] Abstract The paper explores the relationship between the taxpayers’ trust in government and their willingness to pay taxes voluntarily. The recent literature on tax compliance agrees that there are two elements to the answer of why people pay taxes. First is that taxpayers are deterred from tax evasion by the enforcement policies and actions of tax administrations. The other element refers to tax morale, or the willingness of citizens to pay their taxes correctly as a part of honoring their share of a larger social contract with the government. In this article, index of trust in government produced by the American National Elections Studies (ANES) serves to measure tax morale. The AGI (gross adjusted income) gap is used to measure tax compliance or tax evasion. This gap equals the unexplained difference between adjusted gross income (AGI) measured by the Department of Commerce’s Bureau of Economic Analysis (BEA) and adjusted gross income reported to the Internal Revenue Service (IRS). The paper contributes to the existing research on the determinants of tax morale in society and its effect on tax compliance by building and testing an empirical model if the reported perceptions about the trustworthiness of the government translate into actual tax payments. Keywords: trust, compliance, tax morale, tax evasion. 1. Introduction The question of what induces better tax compliance is relevant to tax administration charged with responsibilities to collect the legally due amount of revenue with the least cost. It is equally important for the society at large and for each individual 684 ‘‘Societal Innovations for Global Growth‘‘, 2012, No. 1(1) ISSN 2335-2450 (online) taken separately. It is not the same if large amount of taxes due is not collected and the dishonest citizens “free-ride” at the expense of honest taxpayers or that certain valuable public goods are not delivered. However, the tax gap—the difference between the annual amount of taxes owed and the amount voluntarily paid on time—persists at 1617% for individual income taxes in the USA for decades (U.S. Department of Treasury, 2009). Though the measures of the gap may be less sophisticated in other countries it can be stated with high degree of certainty that other governments face the same problem. The tax gap constitutes 9% of total tax liability in the UK, and reaches 16% for indirect taxes (HM Revenue&Customs, 2010). The problem is even graver in emerging economies and economies that recently underwent transition from the command economy to a free market economy, where the level of shadow economy reaches as high as 32% in Lithuania, 29% in Latvia, and 31% in Estonia (Murphy, 2012). Therefore as policy makers struggle with best strategies to improve tax compliance, the researchers continue to puzzle over what makes people evade taxes, and what motivates people to pay taxes. The research question pursued in this paper is whether, on average, low trust in government has a negative effect on tax compliance in the United States. An empirical model is built based on the existing theory to test whether trust of people in the government has effect on tax evasion. The research design is time series analysis using archival data for the USA from year 1959 to 2008. The method of multiple regression analysis is used to test the empirical model. In Section 2 of the paper literature review on tax compliance is presented. In Section 3 model and data are described. In Section 4 the results of the empirical findings are presented and discussed. Finally conclusions are drawn at the end of the paper. 2. Literature Review The recent literature on tax compliance agrees that there are two elements to the answer why people pay taxes. First theory states that taxpayers are deterred from tax evasion by the policies and actions of tax administrations. The other element refers to tax morale, or the willingness of citizens to pay their taxes correctly as a part of honoring their share of a larger social contract with the government. Attempts have been made to build both theoretical and empirical foundations to these two broad views on tax compliance. The deterrence or Taxpayer-as- Gambler (TAG) model is grounded in the economics of crime theory pioneered by Garry Becker (1968) and adopted for tax compliance by Allingham and Sandmo (1972) (Allingham & Sandmo, 1972; Becker, 1968).The view that there is more to tax compliance than a simple 685 ‘‘Societal Innovations for Global Growth‘‘, 2012, No. 1(1) ISSN 2335-2450 (online) rational calculation or a mere reaction to the “stick” was offered rather early by Georg von Schvanz (1890) who said that it is relevant to see taxpayers as partners in the contract between the state and its citizens (Martinez-Vazquez & Torgler, 2005). However, little research has been done in this area until quite recently except for a brief interest in tax morale by “Cologne school of tax psychology” in 1960s. The revival of the interest in tax morale is witnessed by a number of empirical works using data from World Values Survey (Alm & Torgler, 2004; Martinez-Vazquez & Torgler, 2005; Torgler, 2002, 2004a, 2004b, 2005; Torgler & Schaltegger, 2005; Torgler & Schneider, 2005). However, tax administration’s contribution to fostering a higher tax morale is limited. Tax morale is embedded in a broader culture of the country, and depends upon its political and legal institutions. In their current research Benno Torgler and James Alm (2004) define “tax morale” as the intrinsic motivation to pay taxes. Using the World Value Survey they analyze tax morale as a dependent variable and find that tax morale to a great extent depends upon the level of trust in government in general. They found that there’s significant positive relationship between tax morale and trust in legal system and trust in parliament. (Alm and Torgler, 2004). Cheating on government is found less justifiable in societies with a greater degree of trust in government and its institutions. This study attempts to carry the research on trust in government and tax morale one step further, i.e. to see if higher tax morale translates into actual tax payments. It is not exactly the same to declare that cheating on taxes is immoral and to declare the correct amount of income on your tax return. The research aims to find the relationship between the reported perceptions about the trustworthiness of the government and the willingness to pay taxes, measured in actual dollars. 3. Theoretical Model The empirical research is based on Allingham and Sandmo (1972) theoretical model of Taxpayer- as –Gambler. In this model a taxpayer is risk averse and chooses to declare an amount of income so as to maximize expected utility. The individual can be audited with a random probability. If an individual is audited, all under-reported income is discovered, and an individual is to pay a penalty on each dollar that he had to pay in taxes but did not pay. This model concludes that increase in the audit rate and penalty rate increase declared income. However, this model alone does not account for observed level of tax compliance (Alm & Martinez-Vazquez, 2003). The observed level of tax compliance is higher than the basic model predicts. Therefore the basic economic 686 ‘‘Societal Innovations for Global Growth‘‘, 2012, No. 1(1) ISSN 2335-2450 (online) model has been extended to account for tax morality that is determined by the trust in government institutions, among other things. 4. Empirical Model and Data This section describes the empirical test of the extended model of income tax evasion. The model is used to explain the variation in the income reporting behavior of nonfarm proprietors for the period 1959- 2008. The regression equation to be estimated is: TRUSTt 2 ARt 2 3 PINCt 4 ATRt 5 t GAPt = 0 + 1 + + + + T+ Where GAP is the natural log of non-farm sole proprietors’ income gap TRUST is the index of the trust in government AR is the natural log of audit rate ATR is the natural log of average effective individual income tax rate PINC is the natural log of percent of non-farm proprietors income in total privately earned income. T stands for time trend t is an error term. 4.1. Dependent variable There is large amount of evidence that opportunities to evade may present a single most important factor in tax compliance behavior (Alm, Blackwell, & McKee, 2004; Bloomquist, 2003a; IRS, 2006). Therefore we can expect that the taxpayer behavior will vary by source of income they receive. Taxpayers that receive highly visible income (wages and salary) and income subject to third party reporting (dividends and interest) may respond to tax enforcement strategies (like audit) and the change in the economic and political environment differently than the taxpayers who largely receive income that is not subject to withholding or third party reporting. Therefore this study tests the basic extended tax compliance model on a single taxpayer class based on income, i.e. nonfarm proprietors1. Nonfarm proprietors’ income consists of the income received by nonfarm sole proprietorships and partnerships and the income that is received by tax-exempt co-operatives. (BEA, 2005) 1 687 ‘‘Societal Innovations for Global Growth‘‘, 2012, No. 1(1) ISSN 2335-2450 (online) The noncompliance of nonfarm proprietors constitutes the largest portion of the overall tax gap. The tax gap estimates for 2001 reveal that as much as 57% of nonfarm proprietor income was misreported (Internal Revenue Service, 2006). Therefore the non-compliance of nonfarm proprietors has been chosen as a dependent variable. The variable is measured by the adjusted gross income (AGI) gap. AGI gap is the difference between personal income in national income accounts (NIPA) and income reported for taxation purposes as a percentage of income in national accounts. This gap equals the unexplained difference between adjusted gross income (AGI) measured by the Department of Commerce’s Bureau of Economic Analysis (BEA) and adjusted gross income reported to the Internal Revenue Service (IRS). While the national accounts data compute the purchasing side, the tax data indicate income accrual. Difference between both indicate that more is spent than earned officially and thus suggest that some of that difference is due to tax evasion. The measure has been criticized on several grounds. However, Engel and Hines (1999) find that he AGI gap measure captures the dynamics of tax evasion in the U.S. extraordinarily well(Engel & Hines, 1999). BEA provides data on the relative AGI gap by type of income from 1959 to 2008. 4.2. Explanatory Variables Tax morale. Trust in government is used as a good proxy for tax morale. If the state acts in a trustworthy way, then taxpayers are more willing to pay taxes (Alm & Torgler, 2004). In this research index of trust in government produced by the American National Elections Studies (ANES) is used to measure the impact of tax morality on tax compliance .The Trust in Government Index is constructed from answers to the following questions (1): "How much of the time do you think you can trust the government in Washington to do what is right-- just about always, most of the time or only some of the time?" (2) "Would you say the government is pretty much run by a few big interests looking out for themselves or that it is run for the benefit of all the people?" (3) "Do you think that people in the government waste a lot of money we pay in taxes, waste some of it, or don't waste very much of it?" (3) "Do you think that quite a few of the people running the government are a little crooked, not very many are, or do you think hardly any of them are crooked at all?" These questions closely capture the perceptions about the “exchange inequity”, i.e. the perception that the value of public goods and services received is less than the taxes paid, that government may be corrupt (“crooked”) and the government is not responsive to the needs of the voters in general (the voters preferences are disregarded). All these perceptions are deemed as important determinants of taxpayer behavior (Bloomquist, 2003b; Frey & Feld, 2002; Torgler, 688 ‘‘Societal Innovations for Global Growth‘‘, 2012, No. 1(1) ISSN 2335-2450 (online) 2004a). The major limitation of ANES data is that surveys are biennial, i.e. carried out as a rule only on election years. The missing values had to be replaced by mean of nearby points. Audit rate. Audit rate represents probability of detection. The study assumes that variation in tax compliance over time as measured by the AGI gap may be attributed to the variation in the audit rate. Audit rate represents tax enforcement measure used by tax administration to detect tax cheaters and to deter future noncompliance. In this study “Audit rate” is defined as a “face-to-face” audit of individual income tax returns conducted by revenue agents and tax auditors. The data is obtained from IRS Commissioner’s Annual Report for years 1959 to 1980, Transactional Records Access Clearinghouse, Syracuse University for years 1981 to 2000, and U.S. Treasury Inspector General for Tax Administration (TIGTA) for years 2001 to 2008 (TIGTA, 2008). Correspondence audits are not included when calculating tax audit rate. Since the effect of audit rate on compliance is not linear, variable “audit rate” logged is used in the analysis. Percent of Non-farm Proprietors Income in Total Privately Earned Income. The effect of income on compliance is ambiguous in basic theoretical model. The standard evasion studies usually assume declining absolute risk aversion. From that follows that higher –income taxpayers should be more willing to evade than low-income taxpayers, all else equal. The prevailing finding of empirical work is that larger income is associated with more opportunities to evade and thus lower tax compliance. Average effective tax rate. Theoretical studies indicate that tax rates have an ambiguous effect on compliance depending upon taxpayer attitude to risk, the structure of the penalty function, and other criteria (Andreoni, Erard, & Feinstein, 1998). The results of empirical research are equally mixed. The tax rate used in this study is average effective tax rate obtained by dividing total individual income tax receipts by personal income (NIPA, BEA). “Time” variable is included to detrend the time-series data (Gujarati, 2003). Definition of variables, and data sources are summarized in Table 1. 689 ‘‘Societal Innovations for Global Growth‘‘, 2012, No. 1(1) ISSN 2335-2450 (online) Table 1. Definition of variables and data sources Variable name GAP TRUST Definition The difference between nonfarm proprietor income reported to IRS (Internal Revenue Service) and income measured by BEA (Bureau of Economic Analysis) divided by the income measured by BEA Index of Trust in Government AR (audit rate) Number of tax returns audited divided by the number of total returns PINC (percent income) Percent of nonfarm proprietors income in national private income Average effective tax rate obtained by dividing federal individual income tax receipts by national personal income ATR (average tax rate) Source U.S. Department of Commerce, Bureau of Economic Analysis American National Elections Studies (ANES) IRS Commissioner’s Annual Report (years 1959 to 1980) Transactional Records Access Clearinghouse, Syracuse University (years 1981 to 2000, and TIGTA (years 2001 to 2008) U.S. Department of Commerce, Bureau of Economic Analysis U.S. Department of Commerce, Bureau of Economic Analysis Source: author 5. Results of Empirical Research The model has been estimated by ordinary least squares (OLS) estimator. The results are presented in Table 2. The table lists variables included in the equation as well as the manner in which some explanatory variables were transformed (e.g. to logarithmic form to account for nonlinear relationships). The model has a fairly high predictive power with an adjusted R-squared equal to 0.82. This means that explanatory variables explain 82% of the variance in the dependent variable. The overall model significance is quite strong, represented by F= 66.46. The variable “TRUST” has an expected negative sign and is marginally statistically significant at the 0.1 level. If the index of trust increases by one point, the tax evasion is reduced by .004%, all else equal. Another explanatory variable “Audit rate” is 690 ‘‘Societal Innovations for Global Growth‘‘, 2012, No. 1(1) ISSN 2335-2450 (online) statistically significant at 0.05 level and has an expected negative sign. Increasing audit rate by 1% reduces tax evasion by 0.13%, controlling for other variables. The variable income is negatively related to tax gap and significant at 0.01 level. This finding would suggest that higher percent of income earned by nonfarm proprietors reduces tax evasion. In theory, the relationship between income and tax evasion depends upon the assumptions about the risk aversion of an individual. This finding indicates that nonfarm sole proprietors are rather risk averse and their tax compliance increases as income grows. The average tax rate has a positive sign in accordance with previous empirical findings (Alm, Bahl, & Murray, 1993). However, the results are not statistically significant. Table 2. Ordinary least squares compliance Variable TRUST LnAR LnPinc LnAtr N = 50 Adjusted R-sq Model significance Source: author regression results for the impact of trust on tax Coef. -.0043 -.1352 -1.444 .2077 t -1.74 -2.52 -9.67 1.04 p 0.088 0.016 0.000 0.302 0.82 F= 66.46 , p<0.001 Conclusions The results of empirical analysis clearly indicate that: 1. There’s a positive relationship between the trust in government and tax compliance. If taxpayers do not believe that the government is representing their interests, and not the interests of the selected few, they are less likely to pay their taxes correctly and on time. Trust is also based on the belief that government does “the right thing” most of the time and that the nation’s representatives do not waste taxpayers’ money. There needs to be a perception of “equal exchange” for citizens to honor their part of the larger social contract with the government. 691 ‘‘Societal Innovations for Global Growth‘‘, 2012, No. 1(1) ISSN 2335-2450 (online) 2. The efforts of tax administrators to detect noncompliant taxpayers pay off. The more tax returns are audited, the smaller the tax gap. People are deterred from cheating on their taxes if they know that they can be caught at it and punished. 3. Taxpayers are motivated to pay taxes if they believe their government is trustworthy. References Allingham, M. G., Sandmo, A. (1972). Income Tax Evasion: A Theoretical Analysis. Journal of Public Economics, No.1, pp. 323-338. Alm, J., Bahl, R., Murray, M. N. (1993). Audit selection and income tax underreporting in the tax compliance game. Journal of Development Economics, No.42, pp.1-33. Alm, J., Blackwell, C., McKee, M. (2004). Audit Selection and Firm Compliance with Broad-based Sales Taxes. National Tax Journal, Vol. 57, No.2 pp. 209-227. Alm, J., Martinez-Vazquez, J. (2003). Institutions, paradigms, and tax evasion in developing and transition countries. In J. Martinez-Vazquez, J. Alm (Eds.), Public Finance in Developing and Transitional Countries. (1st ed., pp. 146- 178). Northampton, Ma: Edward Elgar. Alm, J., Torgler, B. (2004). Culture Differences and tax Morale in the United States and in Europe. Working Paper No. 2004-14. Andreoni, J., Erard, B., Feinstein, J. (1998). Tax Compliance. Journal of Economic Literature, No.36, pp. 818 - 860. ANES. (2012). Trust in Government Index 1958 - 2008. Acces via Internet http://www.electionstudies.org (referred on 10 October 2012) BEA. (2005). State personal income methodology. Access via Internet http://www.bea.gov/regional/pdf/spi2004/05%20Proprietors%20income.pdf (referred on 1 October 2012) Becker, G. S. (1968). Crime and Punishment: An Economic Approach. The Journal of Political Economy, No.76, pp.169-217. Bloomquist, K. M. (2003a). Trends as Changes in Variance: The Case of Tax Noncompliance. Access via Internet http://www.irs.gov/pub/irs-soi (referred 15 January, 2005) Bloomquist, K. M. (2003b). U.S. Income Inequality and Tax Evasion: A Synthesis. Access via Internet http://web.lexis-nexis.com/universe/document (referred 28 February, 2005) Engel, E., Hines, J. R. (1999). Understanding tax evasion dynamics. NBER Working Paper No.6903. Frey, B. S., Feld, L. P. (2002). Deterrence and Morale in Taxation: An Empirical Analysis. CESifo Working Paper No. 760. Gujarati, D. N. (2003). Basic Econometrics (4th ed.). New York: McGraw-Hill. HM Revenue&Customs, U. K. (2010, 16 September 2010). Measuring tax gaps 2010. An official statistics release. Internal Revenue Service. (2006). Tax Year 2001 Federal Tax Gap. Acess via Internet www.irs.gov/pub/irsnews/tax_gap_figures.pdf (referred on 19 September 2006) IRS. (2006). Tax Gap Figures. Access via Internet http://www.irs.gov/pub/irs-news/tax_gap_figures.pdf (referred on 23 April 2006). 692 ‘‘Societal Innovations for Global Growth‘‘, 2012, No. 1(1) ISSN 2335-2450 (online) Martinez-Vazquez, J., Torgler, B. (2005). The Evolution of Tax Morale in Modern Spain. [Working Paper No.2005-33]. Working paper No. 2005 -33.Center for Research in Economics, Management and the Arts, Basel. Murphy, R. (2012). Closing the European tax gap. Access via Internet www.socialistanddemocrats.eu/gpes/media3 (referred on 11 October 2012) TIGTA. (2008). Trends in Compliance Activities Through Fiscal Year 2008. Access via Internet http://www.treasury.gov/tigta/oa_auditreports.shtml (referred on 26 September 2012) Torgler, B. (2002, November 14-16, 2002). Direct Democracy Matters: Tax Morale and Political Participation. Paper presented at the 95th Annual Conference on Taxation, Orlando, Florida. Torgler, B. (2004a). Tax Morale, Trust and Corruption: Empirical Evidence from Transition Countries. Working paper No. 2004-05, Center or Research in Economics, Management and the Arts, Basel. Torgler, B. (2004b). Tax Morale, Trust and Corruption: Empirical Evidence from Transition Countries. Center for Research in Economics, Management and the Arts (CREMA). Torgler, B. (2005). Tax Morale in Latin America. Public Choice(122), 133-157. Torgler, B., Schaltegger, C. A. (2005). Tax Morale and Fiscal Policy. Unpublished Working paper. Center for Research in Economics, Management and the Arts (CREMA) Torgler, B., Schneider, F. (2005). What Shapes the Attitudes Towards Paying Taxes? Evidence from Switzerland, Belgium, and Spain. Unpublished Working paper. Center for Research in Economics, Management and the Arts (CREMA) U.S. Department of Treasury. (2009). Update on Reducing the Federal Tax Gap and Improving Voluntary Compliance. Access via Internet http://www.irs.gov/pub/newsroom/tax_gap_report_-final_version.pdf (referred on 22 July 2012) 693 ‘‘Societal Innovations for Global Growth‘‘, 2012, No. 1(1) ISSN 2335-2450 (online) INFLUENCE OF GLOBALIZATION PROCESSES ON UKRAINIAN STOCK MARKET Candidate of Economics, Assoc. Prof. Irina Pasechnik Banking Department Kharkiv institute of banking of the University of banking of the National bank of Ukraine Peremogy av. 55, 61174, Kharkiv, Ukraine E-mail: [email protected] Oksana Kovalova, student Kharkiv institute of banking of the University of banking of the National bank of Ukraine Peremogy av. 55, 61174, Kharkiv, Ukraine E- mail: [email protected] Abstract This paper analyzes investigation the state of Ukraine's stock market, the analysis of its compliance trends in the global stock market under globalization. As globalization as a process of creating a liberalized and integrated world market for goods and capital, as well as the formation of a new international institutional system that serves as the development of production, trade and financial flows on a global scale need to be studied. Especially concerning the improvement of the stock market of Ukraine to the world accumulation and attract new investors. In this influence of globalization is analyzed from the two different sides with their own results. Thus, analyzing the state of Ukraine’s stock market in the paper, we can conclude that it is fully consistent with trends in the global stock market under globalization. Because the impact of globalization on the one hand, stimulating investment process, technological development and broadened cooperation with other countries. On the other hand - the global financial crisis has affected most developed market firstly and then Ukrainian one. Stock market of Ukraine, which at that time was only at the stage of development, could not stabilize and maintain their performance so experienced significant losses and discontinuities. Therefore, NKSSM at 2012-2014 developed a program to help stimulating market development. Keywords: globalization, stock market, securities, investment process. 694 ‘‘Societal Innovations for Global Growth‘‘, 2012, No. 1(1) ISSN 2335-2450 (online) 1. Introduction As a term of globalization is as a process of creating a liberalized and integrated world market for goods and capital, as well as the formation of a new international institutional system that serves as the development of production, trade and financial flows on a global scale it needs to be studied. Especially concerning the improvement of the stock market of Ukraine to the world accumulation and attract new investors. Such Ukrainian scholars as G.V. Karpenko, M.A. Rychko, M.A. Kozoriz, K.S. Kalynets, M. Burmaka, V. Galanova, O. H. Korniychuk have studied problems of Ukrainian stock market in the globalization process. In particular G.V. Karpenko studied the problem of exchange activity and the stock market in Ukraine [4]; M.A. Rychkor - role of stock exchanges in the European Union and Ukraine in the managing of financial resources [7]; M.A. Kozoriz - the role and function of capitalization in ensuring economic development entities menages [5]; M. Burmaka - state regulation of the securities market in Ukraine [1]; V. Galanova - business on the stock market [3]; O. H. Korniychuk systemic problems Ukraine's stock market and their impact on the implementation national interests in the financial sector [6]. Despite the significant achievements of modern scientific thought and mobility stock market there is a need of his constant study. Research purposes of this paper are to investigate the state of Ukrainian stock market under the globalization processes and the consequences of this influence. Research object is the stock market of Ukraine. According to the object there were used such research methods as the historical approach to research (Section 1, the analysis of stock market position in the economy and the influence of globalization on this market) , qualitative research, structural analysis (Section 2 is analyzed the consequences of the global crisis for USA and Europe and for Ukraine). Also there were used such methods as correlational research, observational research, true experiments and quasiexperiments. 2. Assessment of Social Value Concepts The stock market has a very large impact on the welfare of the population as well as in Ukraine and in other country of the world. Stock market boundless prospects and its development has a significant impact on the economy and welfare. Once the active expansion of brokers and funds was aimed to inclusion of large mass of the population of Ukraine to exchange activity. Time has passed since then quite a lot, and the activity of the population in this area is not impressive [4]. Nowadays value creation in the 695 ‘‘Societal Innovations for Global Growth‘‘, 2012, No. 1(1) ISSN 2335-2450 (online) analysing the influence of globalization processed on Ukrainian stock market is very big as it will help us to understand the consequences of the globalization processes on the specific market as stock market for Ukraine and in some aspects for other countries. As Vatamanjuk Z.G. said in his research stock "Stock market in Ukraine”, the main function performed by the stock market in the economy, is the redistribution of investment resources and monetary capital needs. To perform this function must operate infrastructure stock market introduced by wide range of tools, and effective mechanisms of market participants. During the development of stock market of Ukraine has achieved in this direction some positive results [8]. In particular, the efforts of the Commission on Securities and Stock Market and Infrastructure Development Agency stock market is actively developing the regulatory framework, continues development of infrastructure, introduced monitoring and disclosure, improved system protection to investors, increased awareness of the public on the stock market. Also, due to the widespread use of new information technologies in the stock market the system of electronic filing reporting issuers and an unified information database of the stock market. However, globalization as one of the elements of the global catalyst market development, making adjustments to the functioning of the Ukrainian stock market. Thus, the impact of financial globalization on the economy can be seen from two sides: on the one hand, the abolition of restrictions on capital inflows allows to better meet entities in the financial capital and stimulate investment process, on the other, it is complicated by the maintenance of a stable exchange rate under increased vulnerability of the economy to negative external factors, at opportunities conjunction central bank in the execution of monetary policy. 3. The Empirical Research Findings The global crisis affected on the stock market in Ukraine very negative, despite the small proportion of the Ukrainian market globally. As you know, the major indices, which reflect the state of the U.S. stock market in 2008 year showed a significant drop. The situation on the European stock markets since the beginning of August 2008 was not better than the U.S. market. Major indexes in Europe in the end of August 2008 showed a mixed trend [9]. Indexes supported expectations of market participants possible growth of mergers and acquisitions. In September, the European stock market indices tended to increase due to injections by central banks in developed countries, the funds to the financial system. The situation prevailing in global stock markets can be seen in Fig. 1. The changes that occurred were quite protracted, because even today some of the world markets can not regulate and stabilize their performance. As noted 696 ‘‘Societal Innovations for Global Growth‘‘, 2012, No. 1(1) ISSN 2335-2450 (online) by the International Monetary Fund, in case of deterioration of the situation on the stock market and slowing economic growth in the eurozone, analysts admit the likelihood of a reduction in its gross domestic product by 5% in the next 2 years (2012, 2014). At the same time the U.S. economy could shrink by 2%, and Japanese - 1%. This may worsen the situation in our country [12]. Figure 1. Dynamics of falling global stock market indices in 2008 [12] Against the backdrop of the global financial crisis, the Ukrainian stock market does not remain on the sidelines. For 1ta 2 quarters of 2008 stock market in Ukraine has undergone significant losses. Index of First Securities Trading System (FSTS) in seven months has lost 43.5% of their positions, and the last two months were recorded fall another 43% of their positions. This decline is mainly due to the release of the Ukrainian market of foreign investors, called speculators, which is also a consequence of the financial crisis. In such a situation occurred and a significant reduction in the value of securities firms that were part of the FSTS quotation list. As a result, in September 2008 the management FSTS was forced to halt trading on the Exchange. This decision caused a huge landslide quotes of all liquid stocks PFTS. However, the suspension of trading 697 ‘‘Societal Innovations for Global Growth‘‘, 2012, No. 1(1) ISSN 2335-2450 (online) prevented the market falling by more than 7%. However, the FSTS index fell to the level of December 2006 Market completely "gone to the bottom." World and Ukrainian stock markets are experiencing post-crisis period. There, the recovery in global financial markets in the world, which positively affected the Ukrainian. Stock Index Standard & Poor's 500 reached in June 2012 four-year maximum. Indicator rose 28.65 points (2.03%) and amounted to 1432.09 points. Index Dow Jones Industrial Average rose 242.98 points (1.86%) - to 13,290.46 points. Nasdaq Composite index increased by 66.54 points (2.17%) - to 3135.46 points. As for Ukraine, as of early August 2012 index of FSTS "FSTS Stock Exchange" was 391.45 points (0.45%). Turnover on the exchange amounted to USD 149.77 million. But we can see that the dynamics of FSTS trading fir 1-3 quarters of 2012 was quite choppy and chaotic, so securities market is unstable and can be influenced by many factors (Figure 2) [10]. 620 1 360 570 1 210 1 060 910 470 760 млн грн. пунктів 520 610 420 460 310 370 160 320 41 05 4 41 ,0 0 05 6 41 ,0 0 05 8 41 ,0 0 06 0 41 ,0 0 06 2 41 ,0 0 06 4 41 ,0 0 06 6 41 ,0 0 06 8 41 ,0 0 07 0 41 ,0 0 07 2 41 ,0 0 07 4 41 ,0 0 07 6 41 ,0 0 07 8 41 ,0 0 08 0 41 ,0 0 08 2 41 ,0 0 08 4 41 ,0 0 08 6 41 ,0 0 08 8 41 ,0 0 09 0 41 ,0 0 09 2 41 ,0 0 09 4 41 ,0 0 09 6 41 ,0 0 09 8 41 ,0 0 10 0 41 ,0 0 10 2 41 ,0 0 10 4 41 ,0 0 10 6 41 ,0 0 10 8 41 ,0 0 11 0 41 ,0 0 11 2 41 ,0 0 11 4 41 ,0 0 11 6 41 ,0 0 11 8 41 ,0 0 12 0 41 ,0 0 12 2 41 ,0 0 12 4,0 0 10 Обсяг торгів, млн грн. Індекс, пунктів Figure 2. Dynamics of FSTS trading for 1-3 quarters of 2012 [11] Leaders of the growth are: Avdeyevka Coke Plant (AVDK) +2,63%; Ukrsotsbank (USCB) +1,61%; Azovstal (AZST) +0,88%; Centrenergo (CEEN) +0,86%; Alchevsk Iron (ALMK) +0,72%. Somewhat worse situation in MotorSich (MSICH) -0,53%; Yenakivskyy Steel Plant (ENMZ) -0,40%; Ukrnafta (UNAF) -0,24%; Raiffeisen Bank Aval (BAVL) -0,10%. 698 ‘‘Societal Innovations for Global Growth‘‘, 2012, No. 1(1) ISSN 2335-2450 (online) For 1 and 2 quarters in 2012 by the National Commission for Securities and Stock Market of Ukraine (NKTSPFR) registered 138 issues shares worth USD 28.87 billion. Compared to the same period in 2011, the registered share issues fallen USD 11.99 billion. Commission registered 110-issue of bonds worth USD 16.78 billion. Commission registered 110-issue of bonds worth USD 16.78 billion. Since 2012 NKTSPFR registered 17 issues of options worth USD 1.21 million, which compared to the same period in 2011 more by 1.12 million. In 2012, were registered 5 issues of municipal bonds Kyiv City Council in the amount of 3.50 billion, which compared to the same period in 2011 to more than 3.10 billion. Since the beginning of 2012 compared to the same period in 2011, the exchange contracts (agreements) with the securities trade organizers declined by 11.92% (or USD 16.27 billion) (January - July 2011 - UAH 136 480 000 000). It should also be noted that in recent years, the domestic market has undergone qualitative and quantitative changes. Trading volumes have increased tenfold, new investment products (futures on UX, this option futures, etc.), created a new technological product like Online Trading - a mechanism that gives investors access to stock information in real time, and the ability to make their own agreements on the exchange. Also, we are seeing increased interest of Russian investors in the stock of infrastructure facilities. For example in 2009 Russian stock exchange RTS together with leading Ukrainian investment companies established a new stock exchange - "Ukrainian Exchange", majority of which belongs to the RTS Stock Exchange and in 2010. Another Russian exchange MICEX bought a controlling stake in Exchange "FSTS". The emergence of new players with much experience do new for Ukraine and software technologies in the market brokerage services will increase competition in this segment and have a positive impact on the development of the market in general [11]. Conclusions After theoretical research of globalization processes on the stock market of Ukraine and empirical analysis of the consequences, it can be stated that: Impact of globalization on the one hand, stimulating investment process, technological development and broadened cooperation with other countries; On the other hand - the global financial crisis has affected most developed market first and then Ukrainian. Stock market of Ukraine, which at that time was only at the stage of development, could not be stabilized and maintain its performance as experienced markets to prevent losses and discontinuities. Therefore, NKTSPFR at 2012-2014 developed a program to help stimulate market development. 699 ‘‘Societal Innovations for Global Growth‘‘, 2012, No. 1(1) ISSN 2335-2450 (online) References M. Burmaka (2008) "State regulation of the securities market in Ukraine" Securities of Ukraine N. 1, pp. 34-40. Condon D. (2003), Playing the Market: Stocks and Bonds, Heinemann V. Galanova (1996) "Business on the stock market" Dnepropetrovsk, Smena.4. K.S. Kalynets (2008) "Features of the development and dynamics of stock market operations in Ukraine" Region Economy N. 3, pp. 183-197. G.V. Karpenko (2007), "Experience of stock market development in Europe and its use in Ukraine" Finance of Ukraine N. 6, pp. 90-96. M.A. Kozoriz (2007), "The role and function of capitalization in ensuring economic development entities menages" Region Economy N. 2, pp. 42-48. O. H. Korniychuk (2006) "Systemic problems Ukraine's stock market and their impact on the implementation national interests in the financial sector" Economic Annals-XXI N. 3-4. M.A. Rychko (2009), "The role of stock exchanges in the EU and Ukraine in the management of financial resources" Economic Space N. 21, pp. 191-198. Vatamanjuk Z.G. (2008), „Stock market in Ukraine” Finance of Ukraine, Vol. 85, N. 5, pp. 75-85. Rumyantsev S. (2008), „Overcoming the crisis in the stock market” Securities ofUkraine N. 41, pp 22-29. Stock market of Ukraine in financial crisis, access via Internet: http://www.bne.eu (10 January 2009). Trading Results of FSTS , access via Internet: http://www.pfts.com (1 January 2012). NSSMC Annual Reports, access via Internet: http://nssmc.gov.ua (Annual report 2008 - 2011) 700 ‘‘Societal Innovations for Global Growth‘‘, 2012, No. 1(1) ISSN 2335-2450 (online) SCARCITY, SUSTAINABILITY AND LAND UTILISATION habil. Dr. Robert Magda Department of Economics and Law Faculty of Economics and Social Sciences Károly Róbert College Mátrai s. 36, HU-3200 Gyöngyös, Hungary E-mail: [email protected] Abstract The aim of this paper is to show the economic importance of land sustainability. This topic is very complex, because we it is relevant universally - land utilisation has industrial, agricultural production, energy- and environmental security aspect. The focus of the analysis is the relationship between land usage and scarcity, and sustainability. The land as an economic resource is mostly utilised by the agriculture. It could be seen as an asset, but also as production factor that serves production and consumption purposes and have three important characteristics: scarcity, immobile, and durable. It is constitutes part of the national wealth and it must be used in an optimal way. The land utilization is a complex category, and agricultural utilization is only one part of it – however, it may be the most important one. The land utilisation is needed being in accord with sustainability. The root of the problem is the population growth, which will be more than 3,5 times bigger in 2050 than it was in 1950. Keywords: land usage, scarcity, sustainability, competitiveness 1. Introduction Although, the world’s resource base is limited, it contains a complex, and interrelated, set of ecosystems that are currently exhibiting signs of fragility. It is increasingly questioned whether the global economic system can continue to grow without undermining the natural system which is its ultimate foundation. 701 ‘‘Societal Innovations for Global Growth‘‘, 2012, No. 1(1) ISSN 2335-2450 (online) For the moment we can say that the problem of sustainability is: how to alleviate poverty without negatively affecting the natural environment in such a way that future economic prospects suffer. The current global economic crisis may well become the longest in three generations. If trust in finance and economy does not return rapidly, economic reform, socio-economic growth and political stability will suffer. While some confidence in the financial system will return in due course, a new financial architecture is required to strengthen the global economy and increase economic and financial fairness. In this connection, it is critical that the needs for global food and environmental security are taken into account. World population growth is the biggest trend-making factor: 70 to 80 million more people a year, exceeding 7 billion by 2012. Population growth creates a rapidly growing demand for food products including animal feed which arises from increasing meat consumption. Other major global trends are globalization and urbanization. Moving production to the most competitive regions causes the food trade to become more liberalized and also more concentrated. Growing energy demand and climate change will also influence food production. Agriculture contributes to emissions of GHG into the environment and also suffers or benefits from changing climates, depending on climatic zones. The additional challenges are increasing market volatility resulting from yield and stock fluctuations and consumer sensitivity to food quality, safety, and price. Finally I raise the question of who will pay for agricultural public services provided by land managers that the market does not pay for, such as rural landscape maintenance, environmental protection of biodiversity, and animal welfare. These challenges are aggravated by global irresponsibility related to food security, water and environmental sustainability - and energy security. (Magda R., 2011) Joseph Stiglitz and Nicholas Stern made a joint appeal to use the financial crisis as an opportunity to lay the foundations for a new wave of growth based on technologies for a low carbon economy (Financial Times, 2009). The investments would drive growth over the next two or three decades and ensure its sustainability. They noted that "providing a strong, stable carbon price is the single policy action that is likely to have the biggest effect in improving economic efficiency and tackling the climate crisis." Lord Stern calculated that governments should spend at least 20% of their stimulus on green measures to achieve emission targets (Stern, 2006). 2. Scarcity, land utilization The environmental resource scarcity issues are entirely real. As a result of climate changes, most agricultural patterns may become disrupted and the poorest countries 702 ‘‘Societal Innovations for Global Growth‘‘, 2012, No. 1(1) ISSN 2335-2450 (online) are the most vulnerable to such disruptions. Over the long term, environmental security is the mirror image of food security, because we have no food without substantial clean water resources, productive soils, and appropriate climate. Climate change subjects all businesses and society in general to cumulative, long-term risk. The failure of agriculture alone would lead to widespread hunger in developing countries and mass migration of people (half a billion according to the United Nations), mostly to developed countries. In this period when the world economy has been decreasing rapidly, it is necessary to analyse the different possibilities which help us change this negative tendency, and find the right way. So we need to valuate our resources from the human capital to the natural resources. That is the reason why I focus on one of the most important resources, namely arable land. The land as an economic resource is mostly utilised by agriculture. Land usage occurs in a competitive environment (market competition) and economic factors are primary for all farmers. However it should not be forgotten that land is a natural resource at the same time. No matter who the owner of a given piece of land is land is part of the national wealth and it must be used in an optimal way. Regulation of the land use activities is governmental task (e.g. environmental protection). In my opinion, land usage can be defined as a fine balance between sophisticated and inter-related activities, a precise order and harmony of biological, physical and chemical processes. This system of relations can only be described by using the rules of system theory and its adaptation to the specific conditions of land usage. It is important that land usage is defined on the basis of system theories by the fact that the whole system and the relationship between certain elements must be clearly specified and quantification must also be done. On the one hand, I have to emphasize that land utilization is a complex category, and agricultural utilization is only one part of it – albeit the most important one. What is more, the present type of agricultural land usage give us examples that support the fact that this question area cannot be defined on its own, rather only in a complex system compared with other land utilization possibilities. It holds true for both micro and macro levels as well. The aim is to find the best solution of land utilization in the most effective way. In a narrow sense land utilization is part of global utilization, because its use is limited to certain aspects only. Nevertheless in some cases it is a wider category because it includes those lands which are needed for both the processing industry and the services industry. Global utilization can provide answers only to questions that are in connection with the comprehensive relations of economical development. We will have to separate the different forms of land usage and point out its extern and internal relationships. 703 ‘‘Societal Innovations for Global Growth‘‘, 2012, No. 1(1) ISSN 2335-2450 (online) Once the best utilisation has been found, our task is to produce in a sustainable manner. Nowadays it is very important - when we use so much limited resources such as oil, gas, and arable land. It is a generally accepted fact that we are borrowing land from our grandchildren, so we must return it unharmed. 3. Definitions and meanings of sustainability There is no universally agreed definition of the concept of sustainability. On the contrary, in the literature one finds a vast array of definitions, meanings, and interpretations. Many writers deduce that sustainability follows from a moral obligation: the present generation has a moral obligation to the succeeding. Such an obligation implies that we should not act in ways that jeopardise the chances of the future generations of having equal opportunities to those that are currently enjoyed. At times, arguments for sustainability seem to have a different basis. Let us suppose that ecological diversity is believed to be an important objective in its own right. In this case economic activity which threatens to reduce biodiversity would be intrinsically undesirable. We should organise our behaviour so as to avoid serious ecological disruption, to make economic activity more consistent with ecological diversity. Once again there are different ways in which an ecological case for sustainability could be argued, possibly in terms of ecological stability or integrity rather than diversity. Nevertheless any such arguments remain fundamentally an ethical one. If an ecological objective is to be pursued, it must be placed on ethical principle. 3.1 Sustainable development In my opinion a reasonable definition of sustainable development might be as follows: it involves maximising the net benefits of economic development, subject to maintaining the services and the quality of natural resources over time. Mankind is directly influenced by the loss of biodiversity. The right to development implies the right to improvement and advancement of economic, social, cultural and political conditions. Improvement of global quality of life means the implementation of change that ensures every person a life of dignity; or life in a society that respects and helps realize all human rights. These changes must include the eradication and alleviation of widespread conditions of poverty, unemployment, and inequitable social conditions. Sustainable development ensures the well-being of humans by integrating social development, economic development, and environmental conservation and protection. 704 ‘‘Societal Innovations for Global Growth‘‘, 2012, No. 1(1) ISSN 2335-2450 (online) Social development implies that the basic needs of the human being are met through the implementation and realization of human rights. Basic needs include access to education, health services, food, housing, employment, and the fair distribution of income. Social development promotes democracy to bring about the participation of the public in determining policy, as well as creating an environment for accountable governance. Social development works to empower the poor to expand their use of available resources in order meet their own needs, and change their own lives. Special attention is paid to ensure equitable treatment of women, children, people of indigenous cultures, people with disabilities, and all members of populations considered most vulnerable to the conditions of poverty. Source: http://www.google.hu/search?q=sustainable+development&hl=hu&prmd=imvnsb&tbm=isch&tbo=u&sou rce=univ&sa=X&ei=EHWrUP_1Kcem4gTXnIHwCA&ved=0CEcQsAQ&biw=1680&bih=918 (referred on 20th of September) Figure 1. Sustainable development Economic development expands the availability of work and the ability of individuals to secure an income to support themselves and their families. Economic development includes industry, sustainable agriculture, as well as integration and full participation in the global economy. Social and economic developments reinforce and are dependent on one another for full realization. It is impossible to separate the wellbeing of the human person from the well-being of the earth. Therefore truly sustainable development places just as much importance on the protection and of the Earth and as on its resources. International documents that include the environmental aspect of development affirm and reaffirm that "human beings are at the centre of concern for sustainable development. They are entitled to a healthy and productive life in harmony 705 ‘‘Societal Innovations for Global Growth‘‘, 2012, No. 1(1) ISSN 2335-2450 (online) with nature…". As the goal of sustainable development is to permanently improve the living conditions of human beings, social and economic developments must be carried out in a way that is environmentally and ecologically sound; ensuring the continual rejuvenation and availability of natural resources for future generations. Active participation in sustainable development ensures that those who are affected by the changes are the ones determining the changes. The result is the enjoyment and sharing of the benefits and products generated by the change. Participation is not exclusive, ensuring equitable input, self-determination and empowerment of both genders and all races and cultural groups. 3.2 Poverty and sustainable development Many people live in conditions that do not meet reasonable standards. This is particularly true for people living in the poor nations of the world, but it is by no means restricted to them. Even in the richest countries, income and wealth in equalities are such that many people live in conditions of material and social deprivation. For many years it was thought that the eradication of poverty required well-designed development programmes that were largely independent of considerations relating to the natural environment. The goal of economic and political debate was to identify growth processes that could allow continually rising living standards. Economic development and nature conservation were seen as quite distinct and separate problems. Perspectives have changed significantly since the 1970s. While the pursuit of economic growth and development continues, it is recognised that the maintenance of growth has an important environmental dimension. During the 1970s, a concern for sustainability began to appear on the international political agenda. The common theme was the interrelationship between poverty, economic development and the state of the natural environment. On the supply side, the principle of limited food production capacity is exemplified by the fact that the principal grains exporters - the United States, Canada, Australia, Argentina, and the European Union - seem to have reached a plateau. Together, they produce about 85 percent of the world's grain exports. The notion of developing comprehensive policies that promote sustainable use of natural resources, maintain resource production capacity and prevent resource degradation was subsequently adopted by various UN conferences and supported by many international development agencies. This is especially critically important to underdeveloped nations with the least discretionary income to purchase essential food commodities, to prevent declining 706 ‘‘Societal Innovations for Global Growth‘‘, 2012, No. 1(1) ISSN 2335-2450 (online) production capacity or to reverse trends in environmental degradation. Therefore they are likely to face spiralling effects of economic decline, as depicted below (Figure 2). UNSUSTAINABLE POPULATION GROWTH AND RESOURCE DEPLETION RATES EXCESS RESOURCE DEMAND ENVIRONMENTAL STRESS AND NATURAL RESOURCE BASE DEGRADATION REDUCED RESOURCE ENDOWMENT AND INCREASED PRODUCTIVITY CONSTRAINTS IMPACTS ON GNP. DECLINING RESOURCE PRODUCTION CAPACITY AND EFFICIENCY DETERIORATION OF PHYSICAL AND SERVICE INFRASTRUCTURE COMMODITY PRICES AND SOCIAL EQUITY DECLINING INCOME AND SAVINGS RATES CYCLIC DECLINE OF QUALITY OF LIFE AND INCREASED SECURITY RISK DECLINING PURCHASES AND INVESTMENTS CAPITAL DEFICIENCY Gradual change Cyclic change Source: Schultink, 2001 Figure 2. Balancing Natural Resources Supply and Demand Land utilisation and sustainability When we focus on sustainability, in relation with the land we need to think in the long run. The basic condition for sustainable agriculture is that it must be in harmony 707 ‘‘Societal Innovations for Global Growth‘‘, 2012, No. 1(1) ISSN 2335-2450 (online) with the environment, which means that the land use should be optimised for production at an intensity that may cause no harm whatsoever. Similarly, in The Limits to Growth (Meadows et al., 1972) the results of global computer analysis compared rates of population and industrial growth to declining natural resources. It concluded that modern industrial society might not survive this disparity within the next century. Critics argued that this scenario was unduly pessimistic because the study failed to take into account the ingenuity of evolving science and technology. Others argued that it provided an early warning - a wake up call indicating that if present growth trends of world population, industrialization, pollution, food production, and resource depletion continued unchanged – a potential dramatic, possibly uncontrollable decline in both population and production capacity would take place. In their research we can find a lot of problems, but I would like to focus on only three which are in close relationship with land utilisation. First of all population growth must be mention. Analysing the table I can see a huge increase in the number of the world population which will be more than 3,5 times bigger in 2050 than it was in 1950. It will present a great problem because nowadays about 1 billion people are starving and this number will increase in the future. (Bozsik, 2011) Table 1 reveals that the biggest problem occurs in the case of the less- and least developed countries, where this increase is considerably higher than the average. (Table 1) Table 1. World population (1950-2050) Total (million) Developed countries Less developed countries Least developed countries 1950 2519 813 1706 200 2000 6071 1194 4877 668 2003 6301 1203 5098 718 2050 8919 1220 7639 1675 Source: UN (2003) World Population Prospects: The 2002 Revision. Highlights. New York:United Nations. Less developed countries: each African, Asian countries instead of Japan, LatinAmerica and Caribbean region Developed countries: each European countries, North-America, Australia, NewZealand and Japan 708 ‘‘Societal Innovations for Global Growth‘‘, 2012, No. 1(1) ISSN 2335-2450 (online) The second problem is the increase in natural resource extraction. It started in the 18th century after the industrial revolution and has increased step by step, but with a higher rate. In table 3 we can see the production of the primary energy in the last decade. In this period in the EU countries – including Hungary – it was decreasing by a small proportion, but the increase in China during the same period was approximately 70%, which was shocking. The production in the USA and Japan was fairly even. Table 2. Primary energy production (billion tons, oil equivalence) EU-27 USA Japan China Hungary 2000 933,0 1678,8 105,8 1073,0 11,32 2001 932,2 1699,9 104,7 1104,5 10,8 2003 926,4 1634,5 84,0 1331,3 10,7 2005 890,2 1629,9 99,8 1640,9 10,4 2007 859,5 1665,2 90,5 1814,0 10,2 2010 878,3 1740,9 95,0 2186,4 10,9 Source: http://data.worldbank.org/indicator/EG.EGY.PROD.KT.OE?order=wbapi_data_value_2010+wbapi_data_v alue+wbapi_data_value-last&sort=asc (referred on 20th of September) Last but not least we could see a great decrease in the territory of the agricultural areas all over the World except for China. It is very dangerous because the population has increased in a high ratio and thus more territories are needed for producing basic materials for the food industry. (Table 3) Table 3. Agriculture area (1000 ha) World Europe USA Japan China Hungary 2000 4960102,0 486189,0 414399,0 5258,0 544358,0 5854,0 2001 4967137,1 483612,6 414944,0 4793,0 543356,0 5865,0 2003 4937312,0 479373,0 416902,0 4736,0 541851,0 5865,0 2005 4945770,4 476634,4 412878,0 4692,0 547340,0 5863,0 2007 4931862,0 474273,5 411158,0 4650,0 552832,0 5807,0 Source: Faostat 2008 709 ‘‘Societal Innovations for Global Growth‘‘, 2012, No. 1(1) ISSN 2335-2450 (online) These three factors are interconnected. In her survey Daniella Meadows suggests zero economic growth, so according to her it will be necessary to decrease growth rates of the first two components by 30-70% and increase the third one by the same ratio. Conclusions Population growth creates a rapidly rising demand for crop products. Increasing energy demand and climate change will also influence food production; agriculture will contribute to emissions released into the environment and also suffer or benefit from changing climates, depending on climatic zones. The additional challenges are the increasing market volatility resulting from yield and stock fluctuations as well as consumer sensitivity to food quality, safety, and price. The challenges are aggravated by global irresponsibility related to food security, water and environmental sustainabilityand energy security. The exploitation of our entire ecosystem and the depletion of natural resources carry a price that must be paid today to compensate future generations for the losses they will face in the future. The food crisis affected more people more severely than the macroeconomic issue because the populations most affected by sharply rising food prices spend larger shares of their income on food. The global food crisis produced an extraordinary human impact, larger and more adverse than the global financial crisis. Resource productivity should become the core of our next industrial revolution. There are five factors in close relationship with the land utilisation. These are the following: rapid population growth, increasing utilization of natural resources, expansion of industrial production, increasing environmental pollution, and the decrease of agricultural areas. The land as an economic resource is mostly utilised by the agriculture. It can be deemed as an asset, but also as a production factor that serves production and consumption purposes and have three important characteristics: scarcity, immobility, and durability. It is an important part of the national wealth and it must be used in an optimal way. The land utilization is a complex category, and agricultural utilization is only one part of it – however, it may be the most important one. The land utilisation must be in accord with sustainability. The root of the problem is the growing population of the Earth, which will be more than 3,5 times bigger in 2050 than it was in 1950. It will be a great problem because nowadays about 1 billion people are starving and this number will increase in the future. Only about forty years ago when the price of oil went up in the world did economists suddenly realise that some of the resources are limited. In addition, other crucial problems emerged such as the increase in natural resources extraction, the expansion of industrial production, and the environmental pollution, all 710 ‘‘Societal Innovations for Global Growth‘‘, 2012, No. 1(1) ISSN 2335-2450 (online) of which has been increasing exponentially. It carries a great deal of risks since the population has increased at such a high ratio that these days considerably more areas are required for the production of basic materials for the food industry than in the past. References Bozsik, N. (2011), Az Európai Unió gazdaságtana. Budapest SALDO kiadó Zrt. pp. 9-26. Faostat database (2008) Magda, R. (2011), „ A zöldgazdaság és a foglalkoztatás” Európai Tükör No 4 pp. 85-96. Meadows, H et al., (1972). The Limits to Growth. The Club of Rome Report. Universe Books, New York. Schultink, G., (2001), “Comparative Environmental Policy and Risk Assessment: Implications for Risk Communication, International Conflict Resolution and National Security” In: Responding to Environmental Conflicts: Implications for Theory and Practice. Kluwer Publishers, Netherlands Stern, N. (2006), The Economics of Climate Change. Cambridge: Cambridge University Press. pp. 645. United Nations (2003) World Population Prospects: The 2002 Revision. Highlights. New York:United Nations. The World Bank Database: Energy production (kt of oil equivalent): http://data.worldbank.org/indicator/EG.EGY.PROD.KT.OE?order=wbapi_data_value_2010+wbapi_data_v alue+wbapi_data_value-last&sort=asc (referred 20th of September 2010) Ecology Society Economy diagram: http://www.google.hu/search?q=sustainable+development&hl=hu&prmd=imvnsb&tbm=isch&tbo =u&source=univ&sa=X&ei=EHWrUP_1Kcem4gTXnIHwCA&ved=0CEcQsAQ&biw=1680&bih=918 (referred on 20th of September 2010) 711 ‘‘Societal Innovations for Global Growth‘‘, 2012, No. 1(1) ISSN 2335-2450 (online) DARBO EFEKTYVUMO DIDINIMO METODAI IR JŲ VERTINIMAS DARNIAI EKONOMIKOS PLĖTRAI Doc. dr. Rimvydas Jasinavičius Lina Karlienė Mykolo Romerio universitetas Ekonomikos ir finansų valdymo fakultetas Verslo ekonomikos katedra Ateities g. 20, LT-08303 Vilnius Mykolo Romerio universitetas Ateities g. 20, LT-08303 Vilnius El. paštas: [email protected] El. paštas: [email protected] Santrauka Darnios ekonomikos plėtra yra sudėtingas finansų, idėjų ir laiko reikalaujantis procesas, todėl, verslo kelias į darbo efektyvumą turi būti susietas su įmonių efektyviausių įrankių, priemonių panaudojimu, siekant bendro tikslo – pridėtinės vertės, jos didinimo ir generavimo. Darbo efektyvumas įgalina pagausinti darbo rezultatus, naudojant tuos pačius ar net mažesnius išteklius. Todėl jis turėtų tapti pagrindiniu veiksniu visose mūsų visuomenės veiklos baruose. Tyrimo metu buvo apžvelgti moderniausi darbo efektyvumo didinimo metodai - SPS, Six sigma, LEAN ir TOC, nagrinėtos įvairios priemonės, įtakojusios papildomos ekonominės vertės sukūrimą. Parodyta, kad nuolat besikartojančioje srautinėje veikloje geriausiu jos efektyvumo rodikliu yra to srauto pralaidumas (angl. - The throughput). Atskirų išteklių, vadinamų kapitalu, panaudojimo efektyvumą atskleidžia to kapitalo grąža – (ROI). Panagrinėjus įmonių, kurios savo veiklos vertinimui ėmė naudoti šiuos rodiklius, ekonominius rezultatus, pastebėtas ženklus jų ekonominių rezultatų padidėjimas. Tų įmonių vadovams ir darbo kolektyvams ėmus fokusuoti savo pastangas pralaidumo ir kapitalo grąžos didinimui, pakilo veiklos pelningumas, konkurencingumas, atsirado naujų išteklių veržliai ir harmoningai plėtrai. Reikšminiai žodžiai: darbo ir verslo efektyvumas, efektyvumo rodikliai, pridėtinė vertė, pralaidumas, darni plėtra. 712 ‘‘Societal Innovations for Global Growth‘‘, 2012, No. 1(1) ISSN 2335-2450 (online) 1. Įvadas Verslo sėkmė, konkurencingumas ir plėtra tiesiogiai priklauso nuo jo veiklos efektyvumo, kuris yra vertinamas gaunamų rezultatų ir jame naudojamų išteklių santykiu. Siekiami rezultatai ir naudojami ištekliai būna įvairūs, todėl ir efektyvumo rodikliai, ir jų matavimų būdai ir priemonės yra skirtingi. Jeigu verslas siekia ženklaus ekonominio „derliaus“ augimo, pagrindiniu jo veiklos vertinimo rodikliu privalo būti jo veiklos ekonominis efektyvumas. Kai pagrindinis verslo sistemos tikslas yra pridėtinės vertės gausinimas, tada jo veiklos efektyvumą galima vertinti dviem pagrindiniais rodikliais: pralaidumu ir investicine grąža. Tiek Lietuvoje, tiek ir visoje Rytų Europoje verslas savo ekonominiais rezultatais, generuojamų pajamų ir pridėtinės vertės dydžiais bei efektyvumu ženkliai atsilieka nuo Vakarų pasaulio verslo. Todėl verslui labai sunku konkuruoti ir įsitvirtinti pasaulinėje rinkoje. Jo eksportinės galios daugiausiai pasireiškia žemesnėmis produkcijos kainomis, kas sumažina veiklos ekonominį efektyvumą ir neišvengiamai priveda prie pridėtinės vertės sumažėjimo. Nepakankamai sukuriamos pridėtinės vertės versle apimtys sumenkina jo galimybes naujų technologijų diegimui, inovacijoms, investicijoms į darbuotojų kompetencijų ugdymą, didesnėms socialinėms garantijoms, akcininkų pelnui, dividendų išmokėjimui, taip pat mokesčių bazės padidinimui, taip prisidedant prie visos visuomenės gerovės. Todėl neretai kyla klausimai - kaip užtikrinti darbo efektyvumo kėlimą, pastovų organizacijos tobulėjimą ir jos darnią plėtrą, kokios priemonės ir metodai ženkliai pagerintų verslo veiklos efektyvumą ir būtų sukuriama pakankamai pridėtinės vertės? Todėl yra svarbu apžvelgti ir įvertinti verslo įmonių naudojamus moderniausius veiklos efektyvumo didinimo teorinius bei praktinius metodus, tokius kaip LEAN sistemą, Šešios sigma, SPS ir TOC metodikas. Nagrinėjama mokslinė problema – nepakankamas verslo įmonių darbo efektyvumas. Mokslinis naujumas pasireiškia tuo, kad Lietuvoje nebuvo pakankamai gvildenami, taikomi verslo įmonių pridėtinės vertės generavimo metodai. Mokslinis susidomėjimas yra, tačiau praktinių pavyzdžių pateikta tik keletas. Tyrimo eigoje buvo siekiama: Apžvelgti pagrindinius verslo sėkmės veiksnius, įmonės veiklos ekonominio efektyvumo rodiklius; Atskleisti verslo įmonių naudojamas veiklos procesų tobulinimo bei jų efektyvumo didinimo metodikas; Išanalizuoti konkrečios įmonės darbo efektyvumo ir pralaidumo didinimo problemas, perspektyvas ir rezultatus, pritaikius mokslinę Apribojimų teorijos metodiką - TOC. 713 ‘‘Societal Innovations for Global Growth‘‘, 2012, No. 1(1) ISSN 2335-2450 (online) Pagrindinis darbo rezultatas – efektyvių metodų, padedančių didinti darbo efektyvumą padidinus jų ekonominį pralaidumą, išskyrimas bei įvertinimas, remiantis praktinio panaudojimo įmonėje rezultatais. 2. Efektyvumas – sėkmės pagrindas Mokslinėje literatūroje verslo veiklos efektyvumas ir sėkminga veikla vertinama jo sugebėjimu augti ir konkuruoti rinkoje. (Barkauskas, 2009; Matkevičienė, 2007) Kompanijų sėkmė paprastai įvardijama vadybiniais įgūdžiais, mokymu ir išsimokslinimu bei lyderių asmenine kvalifikacija, žinių vadyba, darbuotojų kompetencija ir intelektinio kapitalo svarba (Vaitkevičius, 2007; Keršienė, 2009; Uzienė, 2010; Ruževičius, 2005; Jasinavičius, 2007; Ulvidienė, Bučienė, 2009; Mačerinskienė ir Survilaitė, 2011). Pasak Petravičiaus (2008) veiklos efektyvumas yra dalis to, ką suinteresuotas asmuo laiko vertingu. Bendru atveju įmonės veiklos efektyvumo koncepcija pagrįsta idėja, kad įmonė yra apgalvota produktyvaus turto, įskaitant žmogiškuosius, fizinius ir kapitalo resursų derinys, kuris panaudojamas norint pasiekti nustatytą tikslą. ( Meyer, 2002, Herbst, 2002) Visa organizuota veikla yra pagrįsta kūrimu vertės, o pelningumas yra efektyvumo išraiška. (Bartkiene L.2009; Draker P., 1994) Net ir esant vienodam pavyzdžiui atsižvelgiant į vertės koncepciją, matoma, kad efektyvumas daugialypis leidžiantis kurti vertę skirtingais lygiais. (Robinson, 1998; Murphy ir kiti, 1996). Todėl, apibendrinant galime teigti, jog pridėtinės vertės kūrimas turi būti pagrindinis veiklos efektyvumo kriterijus bet kuriai įmonei, siekiant darnios ekonominės plėtros. 3. Modernūs vertės generavimo metodai XX a. pabaigoje buvo sukurtos procesų tobulinimo metodikos, tokios kaip LEAN gamyba, Šešios sigma , Apribojimų teorija – jų nuoseklus taikymas verslo įmonėse leido pasiekti aukštesnį jų veiklos efektyvumo lygį ir ženkliai pagerinti ekonominius rezultatus. Sinchroninės gamybos sistemos (angl. Synchonised Production System - SPS) pagrindas - visiškas nuostolių eliminavimas ir nuolatinis tobulinimo gamybos būdo siekimas. Taikant SPS metodą, akcentuojama kokybė, kuri turi būti užtikrinta pačiame gamybos procese. Vienas iš reikšmingų skirtumų, lyginant su vakarietiška LEAN gamyba – SPS įgyvendinimas yra ilgas ir nuoseklus procesas, reikalaujantis vadovų, gamybos operatorių, darbuotojų dalyvavimo. (Cox et al., 2010).Pagal Lean instituto mokslinių tyrimų, diegimo praktiką - statistika rodo, kad tik apie 10 proc bando įvesti šį gamybos sistemą yra sėkmingas, o likę 90 proc ketinimai nepavyksta. (Lean institutas, Vokietija). 714 ‘‘Societal Innovations for Global Growth‘‘, 2012, No. 1(1) ISSN 2335-2450 (online) Šešios sigma (ang. Six sigma) metodika padeda pagerinti verslo procesus, mažinant atliekas ir išlaidas, susijusias su prastos kokybės produkcija. Ši tobulinimo programa sulaukė labai didelio dėmesio įvairių pasaulio mokslininkų tarpe: (Breyfogle, 1999; Bergman ir Kroslid, 2000; Klefsjo et al, 2001; Chen et al., 2005; Thomas, 2008; Zu et. al., 2008; Leea et al, 2009;. Kytösaho ir Liukkonen.,2009; Hung and Sung 2011; K. H., 2009). Pasak Pyzdek (2008) Six sigma skirta spręsti problemas ir suteikia vertingus matavimo metodus, kai dėmesys sutelkiamas į procesų gerinimą ir variacijos mažinimą per konkrečius projektus. Ši metodika išsiskiria tuo, kad sprendimai priimami remiantis tiksliai pamatuotais duomenimis ar įvykiais ir siekiant pilniau patenkinti klientų lūkesčius. Pritaikius šį metodą daugiau darbuotojų įtraukiama į įmonės veiklą, labai sumažėja išlaidos kokybei užtikrinti, padidėja gamybos apimtis, sumažinamas laikas užsakymui įvykdyti. Kaip teigia autoriai Sehwail ir DeYong (2003), naudojant Six Sigma siekiama didinti dėmesį klientui, gerinti produktų ir paslaugų našumą, gerinti finansinius rezultatus ir pelningumą sumažindama kokybės išlaidas ir defektus, pasiekti ir išlaikyti išmatuojamus kokybės standartus. Efektyvios metodikos LEAN sistemos pagrindas - Toyota gamybos sistema. Įdiegus šį metodą, organizacija užtikrina savalaikį užsakymų įvykdymą, geresnį apyvartinių lėšų panaudojimą. Jo dėka sutrumpėja įrengimų prastovos operacijos pasiruošimo metu, žmonės įtraukiami į nuolatinį veiklos gerinimo procesą, padidėja operacijų našumas. Norint, kad kompanija veiktų pagal LEAN metodiką, reikia pakeisti aukščiausios vadovybės mąstymą ir vertybes, pakeisti įmonės veiklos principus bei darbų organizavimo būdus. (Carreira B., 2004) Daugelis kompanijų imasi diegti LEAN metodiką. Jos mokosi LEAN metodų, gilina žinias, diegia naujoves, tačiau joms ne visada pasiseka. Joms nepavyksta sukurti būtinų sąlygų, be kurių ši metodika įmonėje veikti negali. Vakarų šalyse pagrindine kliūtimi tampa netinkama nuostata, kad norint įdiegti LEAN sistemą reikalingi didelės apimties darbuotojų mokymai, kurie turėtų pakeisti darbuotojų tradicinį skeptišką požiūrį į gamybos procesų tobulinimo galimybes ir paskatinti imtis realių pokyčių. Japonijoje dažniausiai taikoma agresyvesnė procesų tobulinimo praktika. Procesų tobulinimo komandoms yra iškeliami ambicingi tikslai, suformuojami motyvaciniai svertai jų siekti, o reikiama metodinė pagalba teikiama pagal poreikį. Dažnai taikoma Pareto 20/80 logika – greitai realizuojama 20% veiksmų, kurie duoda 80% galimo rezultato. Tai užtikrina greitus ir rezultatyvius pokyčius. Terminas „LEAN“ yra tapęs bendriniu ir yra tapęs aukšto efektyvumo lygio sinonimu. (Carreira B., 2004) 715 ‘‘Societal Innovations for Global Growth‘‘, 2012, No. 1(1) ISSN 2335-2450 (online) 4. TOC efektyvumo matavimai Pasak TOC teorijos kūrėjų (Goldratt, 1994, 1997, 2002, 2003, 2009; Cox 2010; Corbett, 2005; McMuller ,1998 ; Detmer, 1997; Moss, 2007) svarbiausia įmonių problema tai, kad vadovai remiasi neteisinga prielaida ir stengiasi didinti rodiklius, kurie nėra teisingi visos įmonės ekonominių rezultatų atžvilgiu. Tipinė jų klaida yra tai, kad nėra atsižvelgiama į pridėtinės vertės generavimo pralaidumo apribojimus. Ši teorija pritaikyta sprendžiant strategijos kūrimo, projektų valdymo, marketingo, finansų, kokybės valdymo, gamybos sinchronizavimo ir kitus imonės valdymo aspektus. Kaip teigia Cox (2010) - kiekvieną priežastį, mažinančią bet kurios organizacijos veiklos efektyvumą, galima vadinti apribojimu. Apribojimų teorija remiasi prielaida, kad bet kurios sistemos bendrąjį pralaidumą (angl. throughput) lemia didžiausias sistemos apribojimas, tiesiogiai lemiantis pinigų generavimo greitį. Pralaidumas yra pagrindinis Apribojimų teorijos metodikos veiksmingumo rodiklis. Jis apibrėžiamas kaip greitis, kuriuo sistema generuoja tikslo vienetus. Versle - tai pinigai iš sukurtos pridėtinės vertės. Stebint šio rodiklio pokyčius, vadovai gali greit nustatyti, ar jų sprendimai didina kompanijos pelningumą, ar ne (Corbett, 2005). Verslo pralaidumas - tai jo generuojamos pridėtinės vertės greitis arba kuriamas ekonominio „derliaus“ augimas. Pagal TOC - bet kurios kompanijos ekonominiai rezultatai gali būti atskleidžiami naudojant šiuos tris rodiklius: 1. Pralaidumas (T). Jis parodo kiek pinigų kompanija generuoja. Bendru atveju, pralaidumas reiškia pinigus ar pagamintos produkcijos kiekį per išteklių vienetą. 2. Investicijos (I). Tai visi pinigai, kuriuos sistema investuoja į pirkimą daiktų, kuriuos vėliau ji ketina parduoti. 3. Veiklos išlaidos (OE). Visi pinigai, kuriuos sistema išleidžia (sunaudoja), investicijas paversdama pralaidumu. Pasak Goldratt, (1994, 1997, 2002, 2003, 2009) ir McMuller (1998), bendros įmonės išlaidos yra lygios visų padalinių išlaidų sumai taip pat, kaip visos grandinės svoris yra lygus visų jos elementų svorių sumai. Goldratt (2009), Dettmer (1997) ir McMullen (1998) nurodo esminę valdymo problemą, t.y. įmonės veiklos vertinimo rodiklių suderinamumą. Tiekiamų žaliavų apimtys neturi viršyti „butelio kaklelio“ pralaidumo. Kai žaliavų tiekimas į „butelio kaklelį“ yra spartesnis už jo pralaidumą, ties juo susidaro srauto „kamštis“. Tai padidina išlaidas, skirtas pirkti žaliavas bei sandėliuoti nebaigtos gamybos ar prekių likučius. Tik pagerinus padalinio, esančio „butelio kakleliu“ veiklą, bendrieji įmonės rezultatai pagerėja. Pasak Jasinavičiaus (2009), visos organizacijos efektyvumas priklauso būtent nuo silpniausio grandies pajėgumo. Ir visai 716 ‘‘Societal Innovations for Global Growth‘‘, 2012, No. 1(1) ISSN 2335-2450 (online) nesvarbu, kad kitos grandys pagamina elementų kur kas daugiau – visa įmonė galutinės produkcijos pagaminss tik tiek, kiek leidžia siauriausia jos veiklos vieta – vadinamasis „butelio kaklelis“. Visa anksčiau minėta rodiklių sistema turi būti pritaikyta įmonės valdymo apskaitoje, norint, kad priimami sprendimai didintų įmonės pelningumą. Apskaita, pagrįsta TOC, literatūroje vadinama Pralaidumo apskaita. Pralaidumas turi dvi puses pajamas ir visiškai kintamas išlaidas. Pateikiame pagrindines Pralaidumo apskaitos formules: Tu = P- TVC, (1) kur: Tu - Pralaidumas produkcijos vienetui; P - Produkcijos vieneto kaina; TVC – To vieneto visiškai kintamos išlaidos. TTp = Tu x q, (2) kur: TTp - Bendras visos produkcijos pralaidumas; q - per tą laikotarpį parduotų prekių kiekis; Kompanijos bendrasis pralaidumas = ΣTTp Apskaičiavus kompanijos gaminių Pralaidumą , ir žinant jos Veiklos išlaidas bei Investicijas, galima sujungti Grynąjį pelną (NP) ir Investicijų pelningumą (ROI) su vadovo kasdieniniais veiksmais. Tai iliustruoja sekančios formulės: NP=T-OE, (3) ROI = (T-OE)/I, (4) kur: T - suminis pralaidumas, OE - suminės veiklos išlaidos, Isuminės investicijos. Turėdami tris rodiklius (T, I ir OE), galime apskaičiuoti sprendimo poveikį kompanijos galutiniam rezultatui. Idealus būtų sprendimas, didinantis T ir mažinantis I ir OE. Svarbu, kad pralaidumas greitėtų tolygiai per visus grandinės elementus, tuo atveju, jei pas nors vieną grandinės dalyvių – mažėja pralaidumas - automatiškai kitų grandinės dalyvių pralaidumas pradės mažėti taip pat. Tai yra vienas iš sąlyčio su ekonomika taškų. Praktiniais pasiekimais įrodyta, kad Apribojimų teorija gerai dera ir papildo kitas valdymo metodologijas, tokias kaip JIT (Just-In-Time), LEAN, Six Sigma. 2006 metais APICS (The Assosiation for Operations Management) atlikta praktinė studija patvirtina faktą, kad naudojant Six Sigma ar LEAN kartu su Apribojimų teorija gaunamas sinerginis efektas, kuris yra 24 kartus efektyvesnis negu vien tik Six Sigma ir 10 kartų efektyvesnis negu vien tik LEAN. Pasak Jasinavičiaus (2007), Apribojimų teorija atveria kelią mąstymo bei valdymo pritaikymui, taigi norint didinti įmonės efektyvumo problemas, reikia spręsti sparčiai, būti lanksčiam, kad galėtum būti konkurencingas ir pranašesnis už savo partnerius, o ne rytoj, kai išspręsta problema gali būti niekam nereikalinga ir nenaudinga. Sarapinas ir kt. (2009) pateikė išvadą , jog naudojant Apribojimų teoriją projektinėse struktūrose didinamas jų efektyvumas. Pasak Jundzilaitės ir Vijeikio (2011), Apribojimų teorijos metodika padeda nagrinėti ir perduoti kitiems ne tik objektyvios realybės esmę, bet ir rasti geriausius problemų sprendimo būdus. Broga (2005) pritaikė Apribojimų teoriją, apibūdindamas viešojo sektoriaus neefektyvumo priežastis. Čiegis ir 717 ‘‘Societal Innovations for Global Growth‘‘, 2012, No. 1(1) ISSN 2335-2450 (online) Jasinskas (2006) Apribojimų teoriją panaudojo vertinant valstybės paramą verslui. Moksliniame tyrime „Efektyviai smulkiojo ir vidutinio verslo veiklai Lietuvoje taikomų šakninių apribojimų nustatymas ir jų įveikimo strategija” taikant moderniąsias apribojimų teorijos metodikas SVV priežasčių ir pasekmių ryšių analizei buvo sudaryti Lietuvos SVV realios dabarties apribojimų ir pažangios ateities apribojimų medžiai, taip pat buvo sudarytos priemonių programos, kurias įgyvendinus galėtų pagerėti SVV veiklos efektyvumas ir plėtra.(Jasinavičius, 2008) 5. Praktinis TOC metodikos pritaikymas įmonėje Šiandieniniame versle norint būti nuolat konkurencingu, reikia būti itin lanksčiam ir mokėti nuolat keistis bei tobulėti savo verslo aplinkoje - reikalinga sisteminga veiksmų seka, nuolatinis tobulėjimas, mokėjimas nenukrypti nuo siekiamo tikslo, o blogėjant situacijai, būtina tiksliai nustatyti bei pašalinti šaknines problemas. Kitaip tariant, nuolatinis žmonių ir organizacijų tobulėjimas turi tapti įprastiniu elgsenos būdu. Tačiau, dažniausiai būna taip, jog ilgą laiką nesikeičiančios organizacijos, patenka į savo pačios spąstus, sąlygojančius nuolat krintančius efektyvumo rodiklius. Dažniausiai tokių įmonių vadovai vadovaujasi saugumo principu, siekdami „išgyventi“ bent trumpuoju laikotarpiu. Tokios įmonės susidūrusios su problemomis bando kovoti simptomais, o ne priežastimis, kurios sukėlė tuos simptomus. Tai - trumpalaikė ir nenaudinga taktika. Lietuvoje įmonės, pasirinkusios efektyvią verslo procesų gerinimo metodiką, nėra linkusios apie tai viešai kalbėti. Jos mano, kad konkurentai nukopijuos efektyvios veiklos modelį, o įmonė praras konkurencinį pranašumą. Todėl tyrimui atlikti buvo pasirinkta žinoma Kišiniovo mažmeninės prekybos tinklo kompanija „Zolusca“. Net ekonominio bumo metu 2006-2007 metais įmonės finansiniai rezultatai buvo prasti. Prarandamos pozicijos konkurencinėje erdvėje, mažėjančios pardavimų apimtys, nepakankama pridėtinė vertė, sumažėjęs pelningumas šioje įmonėje sukūrė krizinę situaciją. Todėl kompanijoje „Zolusca“ buvo nuspręsta nuo 2008 metų įdiegti Apribojimų teorijos metodiką. Pagrindinė įmonės „Zolusca“ veikla - mažmeninė prekyba skalbimo milteliais, plovikliais ir valikliais, higienos priemonėmis ir kosmetika. Ji savo veiklą vykdo jau nuo 1999 metų. Įmonėje dirbo 122 žmonių: centrinėje būstinėje - 34 (28%) sandėlio darbuotojų -16 (13%), 72 pardavėjai (59%). Prekybos tinklą sudarė 28 parduotuvės Kišiniove. Parduotuvių plotai itin riboti iki 20 kv.m., o parduodamos produkcijos asortimetas siekė apie 1500 prekių. Atlikus įmonėje “Zolusca” veiklos auditą išaiškėjo vyraujančios tiekimo grandinės ir atsargų valdymo problemos, kurios ir sukėlė nepageidaujamas pasekmes ir 718 ‘‘Societal Innovations for Global Growth‘‘, 2012, No. 1(1) ISSN 2335-2450 (online) simptomus. Didžiausios atsargų valdymo problemos buvo susijusios su netinkamo atsargų valdymo pasekmėmis: atsargų trūkumu arba pertekliumi. Paprastai įmonė “Zolusca“ , siekdama sumažinti prarastus pardavimus, palaikydavo dideles produkcijos atsargas, nes atsargų papildymas užtrukdavo ne vieną savaitę, o ir tiekėjai ne visada pasižymėdavo patikimumu. Informacija apie prekių atsargas nebuvo pasiekiama internete, užsakymai buvo formuojami rankiniu būdu bei vykdomi telefonu iš trisdešimties taškų. Prekės nebuvo suskirstytos į asortimentus, taip pat neefektyviai buvo išnaudojamas lentynų plotas – sustatytos tos pačios prekės atlikdavo tik prekių sandeliavimo funkciją. Įmonė dažnai susidurdavo su prekių nuvertėjimu, fiziniu ir moraliniu susidėvėjimu, galiausiai prekės galiojimo laiko pasibaigimu ir jos nurašymu. Nesuplanuotas prekių kiekis akcijų metu, prastas atsargų valdymas tiek centriniame sandelyje, tiek prekybos taškuose bei dažnos inventorizacijos prekybos taškuose sukeldavo pardavimų kritimus. Pagrindinės „Zolusca“ tiekimo grandinės ir atsargų valdymo problemos pavaizduotos tyrimo autorių pagal Apribojimų teorijos metodiką sudarytame Realios Dabarties Medyje (RDM): Šaltinis: sudarytas autorių 1 pav. „Zolusca“ tiekimo grandinės ir atsargų valdymo problemų RDM 719 ‘‘Societal Innovations for Global Growth‘‘, 2012, No. 1(1) ISSN 2335-2450 (online) Daugelis įmonių teigia neprarandą pardavimų, tačiau praktika rodo, jog prarasti pardavimai dėl prekių trūkumo sandėliuose vidutiniškai svyruoja nuo 10 iki 20 nuošimčių visų įmonės pardavimų. Norint neprarasti pardavimų - būtina mažinti paklausių prekių trūkumus, tuo pačiu mažinant atsargas ir pagerinant jų apyvartumą, taipogi reikia naikinti nuostolius dėl prekių moralinio ir fizinio pasenimo. Kaip matome iš 1 paveikslo įmonė “Zolusca” buvo priversta balansuoti situaciją tarp dažnų prekių trūkumu ir atsargų pertekliu. Pirmieji žingsniai, kas buvo padaryta, taikant TOC metodiką, tai - kompiuterizuotas pardavimų fiksavimas prekybos taškuose, optimizuotas asortimentas, pakeista užsakymų vykdymo ir realizavimo sistema, prekių tiekimo tik iš centrinio sandėlio tvarka, visas realizuojamų prekių asortimentas suskirstytas į A, B, C grupes pagal pralaidumą ir apyvartumą, pradėtos formuoti smulkių užsakymų paraiškos, paspartinti siuntų iš sandėlio paruošimo, pakrovimo ir pristatymo darbai. Įdiegus TOC sistemą, pralaidumo stebėjimo duomenys leido geriau prognozuoti ir modeliuoti alternatyvius veiklos vykdymo scenarijus. Kitaip tariant, leido susieti ir suderinti įvairius veiksmus ir taip pasiekti geresnį bendrą veiklos rezultatą, sistemiškai vertinti organizacijos rezultatus, įvairias veiklos galimybes ir perspektyvas, apsisaugoti nuo išorinės aplinkos keliamų grėsmių. Įmonė ne tik pagerino pardavimo rezultatus, bet ir optimizavo asortimentą, įdiegė efektyvią prekių užsakymo bei vykdymo veiklos procesų sistemą ir juos pagreitino, kurių pagalba darbuotojų darbo našumas padidėjo kelis kartus, užsakymo įvykdymo laikas ženkliai sumažėjo kelis kartus. Buvo atsisakyta nebūtinos, vertės nekuriančios veiklos. Tinkamai sutvarkius procesus buvo išvengta prastovų, atsargų ir produkcijos pertekliaus ar trūkumo, pakartotinio darbo. Pagerėjo santykiai su tiekėjais ir klientais, taipogi teigiamų pokyčių buvo pasiekta pakeitus nusistovėjusį pasenusį požiūrį, atsisakius klaidingų įpročių ir prielaidų bei pertvarkius procesus. Išskirsime įmonės pagrindinius lūkesčius bei rezultatus, taikant TOC šiuolaikinę metodiką: (žr. 1 lentelę) Apibendrinant galime teigti, jog pasiekti rezultatai leido padidinti įmonės pralaidumą, sukuriant palankias sąlygas kurti didesnę pridėtinę vertę, siekiant susieti įmonės vidinius ir išorinius procesus į vieningą kompleksą, bendrų įmonės tikslų ir eliminuojant atskirų verslo procesų tarpusavio prieštaravimus. Sprendimų priėmimo procesas įmonėje tapo daug skaidresnis, įdiegti valdomi, išmatuojami procesai ir užtikrintas ilgalaikis įmonės konkurencinis pranašumas. 720 ‘‘Societal Innovations for Global Growth‘‘, 2012, No. 1(1) ISSN 2335-2450 (online) 1 lentelė. Įmonės „Zolusca“ pagrindiniai lūkesčiai ir rezultatai diegiant TOC metodą Prognozuojami rezultatai, prieš įdiegiant TOC metodiką Rezultatai, įdiegus TOC metodiką Pagerinti prekių tiekimą iki 30% Užsakymų laiku atlikimas pagerėjo 45% Pardavimų augimas iki 20 %. Pardavimai prekybos taškuose išaugo nuo 30% iki 45%. Prekių atsargas centriniame sumažinti iki 20 dienų. sandėlyje Geresnis atsargų judėjimas centriniame sandėlyje nuo 8 iki 12 dienų iki užsakymo įvykdymo. Prekių atsargas prekybos taškuose sumažinti Paklausių prekių atsargos sumažėjo iki 4 , o iki 4 dienų ypač paklausių prekių ir iki 10 mažiau paklausių iki 7 dienų. Bendras dienų mažiau paklausių prekių. atsargų kiekis pinigine verte nesumažėjo, prasiplėtė optimalus asortimentas. Sumažinti morališkai susidevėjusių prekių Sumažėjo morališkai susidevėjusių prekių apimtis 1,5 karto kiekiai (daugiau nei 2 kartus). Išplėsti parduotuvių skaičių bent 10% Prekybos taškų parduotuvių, 36% išaugo nuo 28-38 Pardavimai mažiesiems didmenininkams ir viešajam sektoriui išaugo iki 10 kartų. Naujų parduotuvių atidarymai nepareikalavo papildomų investicijų. Šaltinis: sudarytas autorių 2 Paveiksle pavaizduotas Pokyčių Medis, kuris padėjo įmonei „Zolusca“ įdiegti TOC metodiką, leidusią atsikratyti klasikinių tiekimo grandinės valdymo problemų ir pasiekti puikių rezultatų: ženkliai padidėjęs įmonės pralaidumas, darbo efektyvumas, augančios galimybės, didėjantis rezultatyvumas, užtikrinamas pridėtinės vertės bei verslo procesų efektyvumo didinimas. 721 ‘‘Societal Innovations for Global Growth‘‘, 2012, No. 1(1) ISSN 2335-2450 (online) Šaltinis: sudarytas autorių 2 pav. Nuoseklaus TOC metodikos taikymo verslo įmonėje Pokyčių Medis. 722 ‘‘Societal Innovations for Global Growth‘‘, 2012, No. 1(1) ISSN 2335-2450 (online) Išvados 1. Pridėtinės vertės kūrimas įmonėse užtikrina veiklos ir darbo efektyvumo kėlimą. 2. Nuoseklus vertės generavimo metodų (SPS, Six sigma, LEAN) taikymas verslo įmonėse leidžia pasiekti aukštesnį jų veiklos efektyvumo lygį ir pagerinti ekonominius rezultatus. 3. Naudojant Apribojimų teorijos (TOC) metodiką įmonės gali įgyti didesnį rinkoje konkurencinį pranašumą. Ši teorija pritaikyta spręsti strategijos kūrimo, marketingo, finansų, kokybės valdymo, gamybos sinchronizavimo ir kitus įmonės valdymo aspektus. Apribojimų teoriją galima taikyti bet kokioje srityje: projektų valdyme, gamyboje, prekyboje ir paslaugų versle. 4. Diegdama TOC metodiką, įmonė „Zolusca“ (Kišiniovas, Moldova) sutvarkė ir patobulino tiekimo grandinės ir atsargų valdymo procesus, išplėtė prekybos taškų realizacinį pralaidumą, įdiegė efektyvią prekių užsakymo bei vykdymo veiklos procesų sistemą ir juos pagreitino, kurių pagalba darbuotojų darbo efektyvumas padidėjo kelis kartus, padidino pardavimų apimtis, pakėlė savo veiklos ekonominį rezultatyvumą ir iš papildomai sukaupto kapitalo išplėtė prekybos tinklą. Literatūra Barkauskas, V. (2009), “Intelektualaus kapitalo įtaka įmonių konkurencingumui”, Ekonomika ir vadyba, Nr. 14. Bartkienė, L. (2009), “Organizacijos veiklos efektyvumo didinimas. Mokslas – Lietuvos ateitis, T. 1, Nr. 3. VGTU, Vilnius. Bergman, B., Kroslid, D. (2000), “Six Sigma: a revival of the Profound Knowledge of variation”, Proceedings of the 3rd International Conference on Building People and Organizational Excellence (Aarhus, Denmark), pp. 260- 266. Breyfogle, F. W. (1999), Implementing, Six sigma: Smarter solutions using statistical methods, John Wiley & Sons, New York. Broga, Š. (2005), Viešojo sektoriaus neefektyvumo priežasčių beieškant, naudojant Apribojimų teoriją, Interneto prieiga, http://www.toc.lt/lit/Viesojo_sektoriaus_neefektyvumo_priezasciu_ beieskant_naudojant_Apribojimu_teorija./271, (žiūrėta 2012 10 03). Carreira, B. (2004), Lean. Manufacturing That Works: Powerful Tools for Dramatically Reducing Waste and Maximizing Profits, JAV, Amacom. Chen, S. et. al. (2005), “Promoting customer satisfactions by applying six sigma: An example from the automobile industry”, Qual. Manage. J., No 12(4), pp 21-33. Corbett, T. (1998), Throughput Accounting: TOC’s management accounting system, North River Press. Corbett, T. (2005), Pralaidumo apskaita. Toc valdymo apskaitos sistema, Vilnius. Cox, J. F. (1997), The constraints management handbook, J. F. Cox, M.S. Spencer, St Lucie Press. Cox, J. F., Schleier, J. G. JR. (2010), Theory of Constraints Handbook, McGrawHill, JAV. 723 ‘‘Societal Innovations for Global Growth‘‘, 2012, No. 1(1) ISSN 2335-2450 (online) Čiegis, R., Jasinskas, E. (2006). ”Theory of Constraints and its Usage to Evaluate the Governmental Support for Business”, Engineering economics. The economic conditions of enterprise functioning, No 4 (49). Dettmer, H. W. (1997), Goldratt’s Theory of Constraints: a systems approach to continuous improvement, ASQC Quality Press. Goldratt, E.M. (2002), Kritinė grandinė, Goldratt Baltic Network, Vilnius. Goldratt, E.M. (2002 ), Tikslas II: sėkmė priklauso ne nuo laimės, Vilnius, Goldratt Baltic Network. Goldratt, E.M. (2003), Tikslas III: būtina, bet nepakankama, Vilnius, Goldratt Baltic Network. Hsiang et. al. (2011 ), “Applying six sigma to manufacturing processes in the food industry to reduce quality cost Department of Industrial Engineering and Management, I-Shou University, Taiwan”, Scientific Research and Essays, Vol. 6(3), pp. 580-591. Jasinavičius, R. ir kt. (2007), Efektyviai smulkiojo ir vidutinio verslo veiklai Lietuvoje taikomų šakninių apribojimų nustatymas ir jų įveikimo strategija: Taikomasis mokslinis tyrimas. Užsakovas: Lietuvos Respublikos ministerija, Interneto prieiga, http://www.ukmin.lt/lt/strategija/studijos.php, (žiūrėta 2012 10 03). Jasinavičius, N. (2009), “Apribojimų teorija – išsigelbėjimas nuo ekonominės krizės”, Business&Exhibitions. Lithuanian Economic Review, Interneto prieiga, http://www.toc.lt/publikacijos, (žiūrėta 2012 11 03). Jasinavičius, N. (2009), “Kodėl viešasis sektorius bijo dirbti geriau?”, Valstybės tarnybos aktualijos, Nr. 17. Jundzilaitė, V., Vijeikis, J. (2011), Lietuvos užsienio prekybos tyrimas taikant apribojimų teoriją, Vilniaus edukologijos universitetas, TILTAI, 4. Keršienė, R. (2009 ), “Konkurencingumo išsaugojimo veiksniai globalizacijos sąlygomis aspektas”, Ekonomika ir vadyba: mokslo darbų žurnalas,Nr. 14, Kaunas, Kauno technikos universitetas, pp.819 – 824. Klefsjoť, B. et. al. (2001), “Six Sigma seen as a methodology for total quality management. Measuring Bus”, Excellence, No 5, pp 31-35. Leea, K.L. et. al. (2009), “Reducing exposed copper on annular rings in a PCB factory through implementation of a Six Sigma project”, Total Qual. Manage., No 20(8), pp. 863-876. Mačerinskienė, I., Survilaitė, S. (2011), “Intelektinis kapitalas kaip pagrindinis įmonės pridėtinės vertės didinimo veiksnys”, Intelectual economics, Vol. 5, No. 4(12), pp. 560–574. Matkevičienė, R. (2007), “Verslo organizacijos informacinės aplinkos tyrimas”, Informacijos mokslai, Nr. 41, pp. 58-69. McMullen, T.B.C. (1998), Introduction to the theory of constraints (TOC) management system, St. Lucie Press. Petravičius, T. (2008), Kapitalo investicijų vertinimas siekinat įmonės veiklos efektyvumo. Daktaro dizertacija. Socialiniai mokslai, Ekonomika ,Vilnius. Pyzdek, T. (2003), The Six Sigma Handbook, McGraw-Hill. Ruževičius, J. (2005), “Kokybės vadybos ir žinių vadybos sąsajų tyrimas”, Informacijos mokslai, Nr. 2(6). Sarapinas, M., Sudzius, P. (2009), “Apribojimų teorijos taikymo organizacijų projektinėse struktūrose specifika”, Mokslas – Lietuvos ateitis, T. 1, Nr. 3. VGTU, Vilnius. Skrudupaitė, A., Jucevicius, R. (2011), “Critical Success Factors for the Implementation of the Synchronized Production System”, Socialiniai mokslai, Nr. 2 (72). The following pages are sampled from the Theory of Constraints: Concepts and Principles Workshop, Interneto prieiga, 724 ‘‘Societal Innovations for Global Growth‘‘, 2012, No. 1(1) ISSN 2335-2450 (online) http://www.apics.org/apics/SearchResults.aspx?query=THEORY%20OF%20CONSTRAINTS (žiūrėta 2012 05 05). Thomas, A. et. al. (2008), “Methodology and theory. Developing a Six Sigma maintenance model”, J. Qual. Mainten. Eng., No 14(3), pp. 262-271. Ulvidienė, E., Bučienė, R. (2009), Jaunimo vertybinių nuostatų ir verslumo analizė, Vilniaus universitetas, Ekonomikos fakultetas, Lietuvos ekonomikos dėstytojų asociacija, Interneto prieiga, http://www.leda.lt, (žiūrėta 2012 09 10). Uziene, L. (2010), “Model of Organization's Intellectual Capital Measurement”, Inžinerinė Ekonomika, Nr. 21(2), pp. 151-159. Vaitkevičius, S. (2007), “Application of Strategic Management Tools in Lithuania: Managers Knowledge and Experience”, Inzinerine Ekonomika - Engineering Economics, No (4), pp.70-77. SUMMARY Rise of Work Efficiency – Necessary Factor For Sustainable Development Assoc. prof. dr. Rimvydas Jasinavičius, Lina Karlienė Economic development of the state or the region is possible by raising work intensity or efficiency. The first method requires the use of more resources and therefore pose a threat to ecological and social sustainability. Work efficiency enables to multiply work performance using the same or even less resources. Therefore it should be a major factor in all sections of activity of our society. The research has reviewed various methods of work performance evaluation (measurement), various measures affecting the creation of additional economic value were examined. It is shown that the throughput (TOC) is the best indicator of efficiency in constantly recurring streaming activity. Use efficiency of individual resources called the capital is revealed by the return of this capital (ROI). A significant increase in economic performances of various companies has been observed when analyzing performance of the companies that began to use these indicators in the self-evaluation. When the heads and labor collectives of the companies started to focus their efforts on the throughput and increase of the return of the capital, the profitability and competitiveness has increased, new forces for the aggressive and harmonious development has emerged. Keywords: efficiency, indicators of efficiency, throughput, value added, sustainable development. 725 "Societal Innovations for Global Growth", 2012, No. 1(1). (Stream A p. 1-287, Stream B p. 288-478, Stream C p. 479-725, Stream D p. 726-1004, Stream E p. 1005-1166). ISSN 2335-2450 (online) Stream C ‘National Sustainable Development under Globalization Conditions’’ Texts are not edited. Published by Mykolas Romeris University, Ateities g. 20, LT-08303 Vilnius, Lithuania


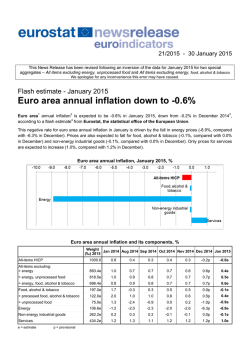

© Copyright 2026