
The Economics and Management of Thai Marine Fisheries
~'~~.,.
- I- I
SH
2!07
-
r
I
ICLARM STUDIES AND REVIEWS14
SR76.J
#14
.
1
c.2
j
.
The Economics and Management of
Thai Marine Fisheries
"
,-
/'
Theodore Panayotou
""'-:
Songpol Jetanavanich
,
II!'
-.
.,
'"
II
'
I
I
.."
L~
U ][)lbt1~M
,
.
INtERNATIONAL
CENTER FOR
LI riNG AQUATic RESOURCESMANAGEMENT
WINROCK INTERNATIONAL
INSTITUTE
FOR AGRICULTURAL DEVELOPMENT'
The Economics and Management of
Thai Marine Fisheries
onomics and Management of
Thai Marine Fisheries
AYOTOU
Harvard
ational Development
Harvard University
One Eliot Street
Cam bridge, Massachusetts 021 38
USA
SONGPOL JETANAVANICH
5 8 0 Commonwealth Ave.
NBR 2 0
Boston, Massachusetts 0221 5
USA
WINROCK INTERNATIONAL INSTITUTE FOR AGRICULTURAL DEVELOPMENT
ARKANSAS, USA
INTERNATIONAL CENTER FOR LIVING AQUATIC RESOURCES MANAGEMENT
MANILA, PHILIPPINES
The Economics and Management
of Thai Marine Fisheries
Published by the International Center for Living Aquatic
Resources Management, MC P.O. Box 1501, Makati,
Metro Manila, Philippines and Winrock International Institute for Agricultural Development,
Route 3, Petit Jean Mtn., Morrilton, Arkansas
72110-9537, USA
Printed in Manila, Philippines
Panayotou, T. and Songpol Jetanavanich. 1987. The economics
and management of Thai fisheries. ICLARM Studies and
Reviews 14, 82 p. International Center for Living Aquatic
Resources Management, Manila, Philippines and Winrock
International Institute for Agricultural Development,
Arkansas, USA.
ISSN 0115-4389
ISBN 971-1022-25-7
Cover: Thai trawlers in dock, Sri Racha,
Cholburi, Inner Gulf of Thailand.
Photo by R.S.V. Pullin.
ICLARM Contribution No. 384.
CONTENTS
Acknowledgements ...........................................................
Abstract
...................................................................
vi
1
.....................................................
2
. Review of Relevant Literature ........................................
4
Chapter 3. Historical Developments ............................................
8
Chapter 1. Introduction
Chapter 2
Chapter 4. Theoretical Framework ............................................. 1 4
Chapter 5. Cost and Earnings I: The Largescale Fishery
............................
21
.
........................... 31
Chapter 7. Economic Analysis ................................................ 41
Chapter 8. The State of the Resources .......................................... 44
Chapter 9 . Optimal Resource Use .............................................. 5 1
Chapter 10. EEZs and Joint Ventures ........................................... 58
Chapter 11. Policy Implications ................................................. 65
Chapter 12. Summary and Conclusions .......................................... 70
Chapter 6 Cost and Earnings 11: The Small-Scale Fishery
References.................................................................. 71
AppendkTables ............................................................. 74
ACKNOWLEDGEMENTS
ICLARM gratefully acknowledges receipt of a special grant from the United States Agency
for International Development (Bangkok, Thailand) which has made publication of this report
possible.
During the time when initial work on this manuscript began, both authors were affiliated with
Kasetsart University in Bangkok. The first author was there as Research Associate of the Agricultural Development Council (A/D/C) and was a member of the Faculty of Economics and Business Administration. The second author was a Research Associate at the Asian Institute of Technology and a graduate student of Dr. Panayotou who conducted his thesis research on Thai fisheries.
Both authors and publishers are indebted t o several anonymous colleagues, including several
in Thailand, who kindly reviewed the manuscript and made a number of constructive suggestions,
many of which have been incorporated in the final text. Final responsibility for contents of the
publication remains with the authors.
ABSTRACT
While still an economically developing country, Thailand possesses a commercial fishery comparable to those of the economically developed nations. The Thai fishing industry, one of the
world's ten largest, with a fleet of over 20,000 modem vessels and a catch of about 2 million tonnes
annually, supplies 20 kg of fish per capita to a population of 50 million and earns the country half
a billion dollars in foreign exchange annually. However, Thailand's fishery management capabilities
continue t o be those of a developing country, lagging far behind the industry's exploitation capabilities. Moreover, the rapid development of the Thai trawl fishery and the stagnation of the small-scale
coastal fishery have resulted in a dualistic structure with small-scale fisheries employing over 70% of
the total number of fishermen, but landing less than 30% of the total catch.
Though somewhat unique, Thailand's experience is of particular relevance to developing countries that are trying to develop large-scale fisheries capable of exploiting fully their extended fisheries jurisdictions, often without paying attention to developing commensurate management capabilities. Several lessons can be learned from studying Thailand's overextended and refractory trawl
fishery, depleted demersal resources and depressed coastal fishing communities.
The study documents the profitability of the trawl fishing, the poverty of small-scale fishermen, the heavy overfishing of the Gulf of Thailand, and the discrepancy between the catching power
of the Thai fishing industry and the management and enforcement capabilities of Thailand and its
neighbors. The study concludes that an effective strategy for the solution of Thailand's fisheriesrelated problems would involve the immediate halt to the construction of new trawlers, the licensing and control of the activities of existing vessels, assistance t o small- and large-scale fishermen
through fisheries enhancement projects, such as artificial reefs, community fishing rights, conclusion of more joint fishing ventures and development of alternative sources of animal protein, income and employment.
CHAPTER 1
INTRODUCTION
Thailand, a developing country in Southeast Asia, with a population of fifty million and a per
capita income of roughly US$700, boasts one of the ten largest fishing industries in the world and
the fifth largest in Asia, a distinction accomplished with little, if any, government assistance. The
local fishing grounds along a coastline of 2,670 km are heavily exploited and a distant-water fleet
employing highly sophisticated vessels and gear is deployed throughout the South China Sea and the
Indian Oceah. In addition to annually supplying about 20 kg per head to a population of fifty
million, the Thai fishery is one of the country's largest foreign exchange earners (US$440 million or
6%of the total value of exports in 1982). Thus, while still an economically developing country,
Thailand possesses a commercial fishery comparable to those of the economically developed nations,
a unique accomplishment within the Third World.
However, this disparity in development between the fishing industry and the rest of the
economy is not without consequence. First, the capital intensity of the fishing industry is out of
line with the country's relative factor endowments of abundant labor and scarce capital, a sheer
misallocation of resources. Second, the development of the fishing industry has not been balanced
but lopsided towards the trawl fishery creating a dualistic structure. Side by side with the heavily
mechanized and highly profitable trawl fishery which accounts for over 70% of the catch but
employs under 30% of the fishermen, operates a crowded coastal fishery using some of the most
primitive gear and resembling the artisanal fisheries of the least developed countries. Third, Thailand's fisheries exploitation capabilities, being those of a long-distance fishing nation, far exceed
its resource management capabilities which are still those of a developing country. As a corollary,
because of its technological sophistication, financial strength and mobility, the large-scale fishery is
virtually immune to regulation and government control.
Though unique, Thailand's experience is of particular relevance to developing countries that
are trying to develop large-scale fisheries capable of exploiting fully their extended fisheries jurisdictions, often without paying attention to developing commensurate management capabilities. Several
lessons can be learned from studying Thailand's overextended and refractory trawl fishery, depleted
demersal resources and depressed coastal fishing communities.
Yet, a study of the development, economics and management of the Thai fisheries is also of
interest in its own right. The literature on the subject is very limited and scattered and leaves unanswered many important questions concerning the spectacular rise and near fall of one of the
world's largest fishing industries. What led to the transformation of Thailand from a developing
country of subsistence rice farmers and coastal artisanal fishermen to a long-distance fishing nation
in less than two decades? What accounts for the persisting dualism in Thai fisheries? Why did
coastal fishermen neither extend their fishing range by upgrading their technology nor find better
employment opportunities in the rapidly growing trawl fishery or elsewhere in the economy? How
profitable is the trawl fishery today after 20 years of relentless expansion? What is the state of the
Thai fishery resource? Is it overfished and how severely? How has the fishing industry adjusted to
the two unprecedented external shocks of the 1980s, the precipitous rise in the oil prices and the
loss of some 300,000 km2 of traditional fishing grounds as a result of the declaration of extended
fisheries jurisdictions by neighboring countries? Is the Thai' fishing industry overcapitalized as a
result, and how much relief does the opportunity for joint fishing ventures with other countries
offer to Thailand? What are the prospects and policy alternatives?
These are some of the questions we will attempt to answer or at least to illuminate. They
are not easy questions and the database is not solid enough for a firm stand on every issue. Yet, the
success of any policy initiative or management scheme will depend squarely on understanding past
developments, the current situation and future prospects of the Thai fisheries within both the
national and the regional contexts.
Inevitably, the study is not without limitations. First, the scope is limited; it does not deal, for
instance, with some economic aspects such as infrastructure, marketing, processing and exports or
sociocultural and human factors such as values and attitudes or group behavior and community
organization, except t o the extent that they have a pronounced and direct effect on the economics,
the state of the resource or the prospects for successful management. This is not t o say that they are
less important but t o admit that we cannot do justice to them in a study of this length.
Second, the issues covered will not be investigated as deeply as one would have liked because a
study of this length and scope is inevitably a compromise between breadth of coverage and depth of
analysis. Ultimately, our information base is limited t o the amount and quality of the available data.
Some time series are too short to afford reasonable degrees of freedom for statistically valid inferences while others have gaps or inconsistencies. Still, these are the best fishery data we have, not
only in Thailand but possibly throughout the developing world. Whenever the database is weak,
warnings will be given t o view the findings with caution.
CHAPTER 2
REVIEW OF RELEVANT LITERATURE
There are literally hundreds of studies on technical and biological aspects of the Thai fisheries,
particularly of the demersal resources and the trawl industry. Very few studies, however, investigate
the economics and management of the industry and even fewer attempt to integrate the economic
and biological aspects of the fishery and determine the optimality of the prevailing allocation of
resources. Here, we will review, chronologically and selectively, only the latter group of studies
since the former are too numerous and too specialized t o be reviewed. Since, however, we built on
the findings of these (technical and biological) studies we will have cause to refer to some of them
in later sections of the study.
One of the first economic studies of the Thai fisheries is by Huvanandana (1973) who estimated production functions for the Indo-Pacific chub mackerel (Rastrelliger) fishing industry. He
also estimated and compared the costs and earnings of Thai and Chinese purse seines and encircling
nets and concluded that the latter was the more profitable gear for exploiting the Indo-Pacific chub
mackerel.
The Department of Fisheries (DOF) has conducted three cost-and-earnings studies for the
trawl fishery, the first in 1969 (unpublished), the second in 1974 (DOF 1974) and the third in 1977
(Rientrakt 1979). The 1969 survey found profits across the board while the 1974 survey reported
that all sizes of vessels suffered losses except for the large otter and pair trawlers (> 1 8 m long). In
contrast, the 1977 survey found that all sizes of vessels earned substantial profits except for small
otter trawlers (< 1 4 m). A more recent survey by the Office of Agricultural Economics (OAE 1983)
found that large trawlers continue to enjoy high profits. Chapter 5 analyzes and interprets the
results of these surveys.
Marr et al. (1976) made a detailed review of the fisheries sector in Thailand, including profitability analysis (based on the 1969 and 1974 DOF surveys), determination of maximum sustainable
yield, investment requirements and institutional arrangements. It is one of the first studies to
recognize the dualistic structure of the sector, to draw attention to the misallocation of resources
and the encroachment of foreign fishing grounds and to recommend remedial policies. While the
study did not receive the attention it deserves, it has drawn attention to economic and other factors
beyond the conventional biological and technical aspects of the fishery and has stimulated further
studies. The findings of this rather dated study will be compared with ours in the relevant sections.
Vattanavengpanit (1979) estimated the supply and demand functions for marine shrimp. The
price coefficients of both the supply and domestic demand were found to be statistically insignificant. In contrast, the coefficients on both price and income were statistically significant in the case
of export demand.
Panayotou (1980) in recent study reviewed the development of the Thai fisheries, analyzed the
1969,1974 and 1977 DOF survey results and the state of the Thai fishery resources and discussed
the sector's prospects and some policy options. Among the findings of the study were the profitability and resilience of the large-scale fishery, the depressed socioeconomic conditions of smallscale fishermen, the overexploited state of fishery resources in the Gulf of Thailand and the bleak
prospects for joint ventures without effective management and enforcement capability by both
Thailand and its neighbors. The present study is an extensive revision, update and extension of that
earlier study in the light of the findings of Jetanavanich (1981) and more recent information.
Jetanavanich (1981) reviewed extensively the Thai fishing industry and made the first attempt
t o determine the levels of catch and effort that will give rise to the maximum economic yield
(MEY). He did this by estimating econometrically demand and supply functions for demersal and
pelagic fish and equating price to the marginal cost of fishing. His main finding is that the catch in
recent years has surpassed both the MEY and MSY (maximum sustainable yield) and that to obtain
the maximum net benefit from fishing in the long run fishing effort for both demersal and pelagic
fish must be reduced by about 70%. He concluded that economic management of the fishery would
give rise to an annual surplus value or social benefit of US$112 million.
Rientrairut (1983), after a detailed review of the fisheries sector (both marine and inland)
including marketing and utilization, focuses on the fisheries development planning process and
fisheries legislation, and concludes with a review of current issues and policies. It is the most up-todate review of the sector across the board in the same league as the Marr et al. (1976) review. It is
also the first complete account of: (a) the numerous departments and agencies involved in fisheries
planning and their respective roles; (b) existing and proposed fisheries legislations; and (c) government policies and projects. Though non-analytical, the study contains very useful information, not
available elsewhere.
Of the numerous technical and biological studies, two relatively recent reviews summarize
earlier findings as well as present very useful information for this study. Pauly (1979), after a brief
review of earlier studies dealing with the decline of catch rates in the Gulf of Thailand, focuses on
stock interaction as reflected in the changes of the composition of the catch over time. Using Gulf
of Thailand data, he finds that at high levels of effort the small prey fishes disappear leaving no food
for their predators, which also decline, while opportunistic species such as flat fishes and invertebrates
increase their biomass both in absolute and relative terms in the multispecies stock despite the
heavy fishing pressure. He concludes that because of the species interaction "there is no single optimum level of effort which will simultaneously produce the MSY for all . . . stocks" and therefore
the simple total biomassltotal effort estimates of MSY in the Gulf of Thailand are unreliable. He
calls for models accounting for stock interactions, for example by dividing the stock into different
trophic levels, determining the trophic level at which economic returns are maximized and selecting
the appropriate fishing techniques (mesh size and gear selectivity).
Boonyubol and Pramokchutima (1982) estimate an MSY of 750,000 t for demersal fishery
resources in the Gulf of Thailand to the depth of 50 m and infer that the Gulf has been overfished
since 1973 with the number of trawlers growing from 5,000 during that year to 10,000 in 1982
(estimations of MSY by other studies will be reviewed in Chapter 8). They also present evidence
showing that despite the manyfold increase in total catch, the catch of food fish increased only
slightly since 1963, most increases being of trash fish (63% in 1980). Even more alarming is the
evidence that trash fish is comprised of a high and rising proportion of juvenile food fish (37% in
1981). The small-scale or artisanal fishery is reported to account for 13%of fishing effort and 37%
of the catch of edible fish from the Gulf. The authors conclude that the most cost-effective measure
for protecting the demersal resources of the Gulf is to, control the number of trawlers.
There are several studies of small-scale fisheries-Cole and Anand (1974), DOF (1978,1979),
Panayotou (1980), Kumpa (1981),Panayotou et al. (1982 and 1985) and Panayotou and Panayotou
(1985). Cole and Anand (1974) estimate annual income to be 7,500 baht (US$ = 20 baht in 1974)
for a Buddhist family and 4,200 baht for a Muslim one. These estimates compared unfavorably with
both the income of crewmen of large trawlers (over 12,000 baht) and the national average for all
occupations that year (over 30,000 baht).
The DOF (1978) on the other hand, found a wide spectrum of annual earnings (8,000 to over
20,000 baht) among small-scale fishermen in Ban Ta Sao fishing village in Songkhla Province depending on type of gear. Bamboo screens and set bags occupying premium locations were far more profitable than either cast nets or gill nets. The DOF (1979) found that a "typical" household in a fishing
village in Pathalung Province operated a gill net and earned an annual income of 11,900 baht (compared to a national average over 30,000 baht in 1979), with location again appearing to be a crucial
determinant of earnings.
Panayotou (1980) reviews the socioeconomic conditions of small-scale fishermen and their
conflicts with larger scale fishermen, evaluates their benefits from government policies and examines
their prospects. Emphasis is placed on the need for non-fishing activities to raise the small-scale fishermen's opportunity cost so that their incomes might be improved and fishery resources allowed to
recover.
Kumpa (1981) analyzed the productivity, cost structure and profitability of small-scale fishing
operations in Chumphon Province. She found that the most important determinants of catch and
earnings were experience, size of boat and fishing time, and that fishermen were efficient in their
use of inputs but their earnings varied according t o the type and size of gear. The pelagic gear, purse
seines and (drift) gill nets in particular, were found to be considerably more profitable than the
demersal gear (trawls and push nets). The author infers that this is due t o the overexploitation of
demersal resources and recommends government assistance for the conversion of trawlers into
pelagic gear and for creation of supplementary sources of income such as brackishwater fish culture
for coastal fishermen.
Panayotou et'al. (1985) compared and analyzed income levels and other indicators of wellbeing among four coastal provinms in Thailand-Chumphon, Nakhon Si Thammarat, Phangnga and
Trat (Fig. 2.1). I t was found that the average coastal fishing household with an annual income of
about US$2,500 (1978) was at least as well off as the average Thai household. However, there was
'.
!
Thai l a n d
Fig. 2.1. Coastal provinces of Thailand and bordering countries and seas.
considerable variation among locations (and types of gear); Trat and Chumphon households earned
incomes that were two to three times higher than those of the other two provinces. Nakhon Si
Thammarat, in particular, suffering from both an unprofitable fishery and lack of alternative
employment opportunities, was identified as a priority area for government assistance.
Tokrisna et al. (1985) estimated fishing production functions by type of gear and by location
as well as for combined gears and locations. They found that technical efficiency varied among gears
operating in the same location and for the same type of gear operating in different locations.
Overall, the most productive gears were shell rakes in Trat, purse seines in Chumphon, push nets in
Nakhon Si Thammarat and set bag nets in Phangnga. In terms of price efficiency, it was profitable
for fishermen with less traditional gear to increase the size and engine power of their vessel, and for
more traditional types to increase the use of labor. In terms of social profitability, however, virtually all types of gear should be gliven incentives to employ more labor.
Panayotou et al. (1982) compared indebtedness, cost structure and profitability between
small- and medium-scale gear groups (according to fishing assets) in the same four provinces as in
the previous two studies. Isolation rather than scale of operation was found to be responsible for
high interest rates. The cost share of fuel, the main cash cost item, was lower for small-scale units
which were more labor intensive although very little labor was hired outside the family. Therefore,
cheap fuel and cheap labor policies tend to favor the medium- and large-scale fishermen who use
relatively more of both these inputs. While limited capital is usually the binding constraint for
small-scale operations, subsidized credit would not necessarily solve the problem because of fisheryresource constraints. Economic overfishing was found to exist in relation to certain combinations of
gears and fishing grounds (e.g., trawls in Chumphon, wing set bag in Nakhon Si Thammarat, push
net in Phangnga and fish gill net in Trat). For the small-scale fishery as a whole, there were still
some, but not substantial, rents (net profits above all fishing costs).
Panayotou and Panayotou (1985) have studied geographical and occupational mobility among
small-scale fishermen in Chumphon and Phangnga based on two extensive surveys carried out five
years apart. They found that fishermen are responsive to economic incentives and move between
occupations and locations to take advantage of earning differentials. Yet, this mobility is far from
perfect. Labor is quite mobile between occupations but less so between locations. Capital tends to
be less mobile than labor at least in the short run, Fishermen expressed a certain attachment to their
occupation and place of residence but they were prepared to change both if a better paying oceupation could be found having some of the most valued features of their current occupation and
location, such as the freedom and independence of "being one's own boss" and the rural setting of
their communities. Religion and distance were also found to constrain mobility. In general, mobility
of labor out of fishing was greater than mobility into fishing; outmigration was rather temporary
and in response to economic incentives while inmigration was more permanent but less significant,
and socially rather than economically motivated. This is to be expected in the light of the finding of
the study that rents from fishing have been dissipated, especially in Chumphon.
CHAPTER 3
HISTORICAL DEVELOPMENTS
Unlike the great maritime nations of Japan, Norway and the Soviet Union, which have had a
long history of fisheries development, Thailand's large-scale fishery is of a very recent origin. Prior
to the early 1960s, the Thai marine fisheries were concentrated along the coast and employed
mostly small-scale gear, such as bamboo traps, which remained unchanged for centuries. Following
the successful introduction of trawl fishing in 1960 with assistance from West Germany, the structure of the Thai fisheries underwent radical changes (Tiews 1965,1973). In 1959 the entire marine
fishery of Thailand consisted of 1,490 bamboo traps, 192 Chinese purse seines and 187 Thai purse
seines and landed a total catch of less than 150,OQQt. Four years later, in 1963, the same fishery
employed over 2,000 trawlers and 500 encircling gill nets while the number of bamboo traps
dropped to 662, purse seines to 211; the catch more than doubled (see Table 3.1).
While the cost of the new technology, about half a million baht per unit in the early 1960s1,
was far beyond the meagre resources of bamboo trap fishermen, its profitability attracted financially powerful investors from the urban centers (especially Bangkok) in what for centuries used to
be a poor man's occupation. The trawling fleet expanded rapidly from less than 100 trawlers in
1960 to about 6,000 by 1973 while less than 200 bamboo traps remained in operation (Table 3.2).
The annual catch increased more than tenfold during the period compared with less than twofold
during the preceding period of equal span (Table 3.3), while the catch per unit of effort declined by
83% between 1961 and 1973 (see Fig. 8.1).
Not only was the new technology more costly and at the same time more profitable, but it also
opened up new more abundant offshore resources which required a longer fishing range and faster
and larger vessels. The new technology was clearly neither scale-neutral nor obtainable through
gradual capital accumulation and progressive upgrading of existing technology. Not only was the
required investment large and the departure from the traditional technology radical, but also the
open-access status of the offshore resources underlined the importance of speed of investment and
technological change. Only those with substantial venture capital of their own or ready access to
inexpensive institutional credit, up-to-date information and entrepreneurial experience had a
competitive advantage in joining the race for the open-access resources, a race which called for
increasingly longer fishing trips to deeper and rougher seas.
Soon enough (early 1970s) the race was carried out to the fishing grounds of other nearby
countries and the deep seas, necessitating not only larger vessels, but also more sophisticated navigation equipment, echo sounders for locating fishing grounds and radars for detecting pirates and the
patrol vessels of neighboring countries, as well as armaments for self-defense. The capital cost of a
fishing unit rose virtually overnight from few hundred baht (mostly in terms of local material and
labor) to several hundred thousand baht. The total capital stock of the industry rose from less than
a billion baht in 1963 to over 11billion baht in 1982, both measured in constant 1976 prices.1
'
From figures estimated by the Fishing Vessel Development Section, Marine Fisheries Division, Department
o f Fisheries, Bangkok, Thailand.
Table 3.1. Number of selected types of gear (fishing units) registered, and marine fish caught (t) in Thailand during .
1949-1966.
Year
BST
Marine gear
Pelagic
CPS
TPS
EGN
Marine catch
(t x l o 3 )
Demersal
Pelagic
Demersal
trawlers
Total
- Not in use.
'Slightly lower figures, 494.2, 529.5, 635.2 and 762.2, respectively, are given in Department of Fisheries, Fisheries Record of Thailand, various issues.
Notation : BST = bamboo stake traps; CPS = Chinese purse seine; TPS = Thai purse seine; and EGN = Encircling
gill net.
Source
: Phasuk (1978) and Department of Fisheries, Thai Fisheries Vessel Statistics, various issues.
-
The small-scale coastal fishermen had clearly no competitive advantage in large-scale offshore
fishing. They had special skills in constructing small boats, repairing nets, locating fish in shallow
coastal waters and operating traditional gear, useful skills for a crewman on a large trawler but
neither necessary nor sufficient for joking the race for offshore resources. The latter calls for access
to venture capital, entrepreneurial skills and up-to-date information on technology, fishing grounds
and markets, all of which are more readily available to the investors of Bangkok and of large coastal
towns than to the coastal fishermen in remote fishing communities. Moreover, the necessary infrastructure, such as ports, landing facilities, roads and markets was made available only to Bangkok
and large coastal towns.
Economic theory predicts that, in the presence of exchange; factor (i.e., labor and capital)
mobility and growth, dualism cannot be but a short-run disequilibrium phenomenon. This, however,
presupposes well-functioning product and factor markets, and this can hardly be said of markets in
Thailand. Markets are said not to be well-functioning when they are either uncompetitive, fragmented or distorted. Of particular importance are the imperfections and distortions of the capital
market. In theory, all producers, small and large, should have access to the same capital markets at
the same rate of interest without the need of collateral.
The market may be said to be imperfect if it provides lower-cost credit to those who already
have substantial amounts of capital of their own than to those who do not, thereby exacerbating
rather than mitigating initial disparities in factor endowments. Factor markets are said to be distorted when government interventions in the market result in prices which do not reflect the true
scarcities of resources. For example, in Thailand, investment privileges, interest rate ceilings, trade
policies, public expenditures and minimum wage policies favor the use of scarce capital and penalize
the use of abundant labor; at the same time they make subsidized credit available to large-scale
operations through investment privileges and dry up rural credit to small-scale operations through
interest rate ceiling;.
Table 3.2. Number of fishing boats registered by type of fishing method, Thailand, 1967-1982.
-
-
Type of gear
-
-
--
-
-
-
-
-
-
-
-
1967
1968
1969
1970
1971
1972
1973
1974
1975
1976
1977
1978
1979
1980
1981
1982
Otterboard trawl
Pair trawl
Beam trawl
Subtotal trawl
Thai purse seine
Chinese purse seine
Anchovy purse seine
Luring purse seine
Sllbtotal seine
Spanish mackerel gill net
Pomfret gill net
Encircling gill net
Shrimp gill net
Other gill nets
Subtotal gill net
Push net
Luring liftnet
Long line
Other nets
Squid cast net
Total
Type of gear
Otterboard trawl
Pair trawl
Beam trawl
Subtotal trawl
Thai purse seine
Chinese purse seine
Anchovy purse seine
Luring purse seine
Subtotal seine
Spanish mackerel gill net
Pomfret gill net
Encircling gill net
Shrimp gill net
Other gal nets
Subtotal gill net
Push net
Luring liftnet
Long line
Other nets
Squid cast net
Total
-
: Nil or negligible.
n.a.
: Not available.
Sources : Data for.1967-1982obtained from Marr et al. (1976);others from Department of Fisheries Thai Fishing
Vessels Statistics, Bangkok, various issues.
Table 3.3. Annual catch (t) by fishing ground, Thailand, 1957-1982.
Year
The Gulf of
Thailand
The Indian
Ocean
Total
1957
1958
1959
1960
1961
1962
1963
1964
1965
1966
1967
1968
1969
1970
1971
1972
1973
1974
1975
1976
1977
1978
1979
1980
1981
1982
159,435
137,215
139,338
135,740
227,746
256,649
314,962
472,226
513,096
605,020
647,664
841,810
909,423
1,098,562
1,232,721
1,318,060
1,246,822
1,107,098
1,172,420
1,295,742
1,724,818
1,633,173
1,493,943
1,306,893
1,465,480
1,561,039
11,965
7,784
8,431
10,731
5,529
13,060
8,411
21,970
16,387
30,145
114,524
162,248
270,172
237,128
237,368
230,097
291,194
244,492
222,188
256,050
342,718
324,612
319,215
341,060
358,964
425,532
170,900
145,000
147,770
146,471
233,275
269,709
323,373
494,196
529,483
135,165
762,188
1,004,058
1,179,595
1,335,690
1,470,289
1,548,157
1,538,016
1,351,590
1,394,608
1,551,792
2,067,533
1,957,785
1,813,158
1,647,953
1,824,444
1,986,571
Source : Department of Fisheries, Ministry of Agriculture and Co-operatives, Fisheries Record of Thailand, various
issues.
Unfavorable initial factor endowments and lack of access to capital markets suffice to explain
the inability of many coastal fisheken to upgrade their technology and extend their fishing range
to other, potentially more abundant coastal resources. With few exceptions of wealthy small-scale
fishermen, it was the fish traders and other nonfishermen with access to capital who acquired fhe
new technology. Unlike the large-scale fishermen who, in addition to their own high profits, have
access to low-interest, often government-subsidized loans, the small-scale fishermen borrow from
informal credit markets (e.g., fish traders and middlemen) at rates which, though only implicit in
marketing arrangements, are a multiple of those charged by banks. The high profits from offshore
fishing, supplemented by easy access to subsidized capital and government-provided landing facilities, enabled the trawling industry to increase its fishing range and expand to fishing grounds outside the Thai waters as the harvest in Thai waters declined due to heavy fishing.
Having failed to expand their fishing range by upgrading their technology and joining the race
for the offshore resources, the small-scale fishermen could only lose from the advent of the new
technology. The biological interdependence between coastal and offshore resources became increasingly evident. The coastal resources became gradually depleted as trawlers enroached on coastal
fishing grounds for high-value species (e.g., shrimp). At the same time, coastal fishermen's stationary
or relatively immobile fishing gear suffered damage from the hit-and-run operations of trawlers in
coastal fishing grounds. Last but not least, the massive landings of trawlers depressed the price of
fish and hence the incomes of coastal fishermen whose catch remained at best stagnant. For example,
the price of fish fell in real terms during most of the 1970s (see Table 3.4).
Under these circumstances, one would expect that small-scale fishermen would seek and obtain
employment as crewmen in the rapidly expanding trawl fishery or abandon fishing for other more
lucrative employment opportunities. Though up-todate reliable figures are not available, it is
apparent from interviews with fishermen (see Panayotou and Panayotou 1985) that some did
take employment in the offshore fishery and others abandoned fishing altogether, but clearly most
small-scale fishermen stayed on. According to Table 3.5, fishing households with two or fewer
employees declined by 29% between 1967 and 1976 and fishing laborer households declined by
34%during the same period.
Table 3.4. Fish prices (bahtlkg) in Thailand, 1971-1982.
Year
Demersal fish
'Squid and cuttlefish.
b ~ h r i r n pand crab.
'Weighted average price =
Pelagic fish
Xn
Crustaceanb
cephalopoda
Weighted
average
priceC
Real
""'price
Yf'
Pisi where Si = proportion of species i to total amount of demersal resources
i=1
caught by a research vessel (Prarnong 11), i.e., 0.70, 0.07, 0.20 and 0.03 for demersal fish, pelagic fish, cephalopod
and crustacean, respectively.
d ~ e f l a t e dby the consumer price index (1976 = 100).
Source : Computed from Appendix Table A.3.
Table 3.5. Recorded number of fishing households, fishermen and vessels in the marine fishery of Thailand for
selected years.
--
1. Fishing households
Fishing operator households
with 3 or more employees
('enterprise')
with 2 or fewer employees
('subsistence')
Fishing laborer households
2. Fishing population and fishermen
Fishing population
Fishermen
Occupied solely in fishing
Occupied mainly in fishing
Occupied partly in fishing
3. Fishing vessels
Non-powered vessels
Powered vessels
Inboard engine
Outboard engine
-
50,968
38,292
43,660
33,631
43,520
34,903
38,702
31,587
40,536
32,207
2,352
3,268
2,660
5,524
6,311
35,940
12,6 76
30,423
9,969
32,243
8,6 17
26,063
7,115
25,558
8,329
315,897
75,676
269,009
77,886
271,132
74,086
56,708
11,985
5,393
249,618
64,277
48,519
12,027
3,731
257,254
69,927
51,198
13,754
4,999
27,521
8,313
19,208
8,760
10,448
26,439
6,918
19,521
10,550
8,971
26,135
5,367
20,768
10,435
10,333
-
35,631
16,584
19,047
-
-
-
-
-
-
-
Data not available.
Source : DOF 1967;Marine Fisheries Inventory Survey 1970,1973 and 1976; and Marr et al. (1976).
Why do not more coastal fishermen find employment in the trawl fishery or move to other
sectors of the economy? The combination of four reasons appears responsible.
First, the trawl technology is intrinsically capital intensive. It has been more so in Thailand
than in some other countries because of the distorted relative factor prices which favor capital and
penalize labor; capital of large-scale investments is subsidized through tax privileges; large borrowers
with collateral have access to subsidized low-interest institutional credit; the government tacitly
encouraged investment in large capital-intensive vessels to increase Thailand's share of distant-water
resources; fishing vessels have access to duty-free capital equipment from neighboring countries such
as Singapore; and government provided landing facilities and exploration research. At the same time
the use of additional labor is hindered by minimum wage legislation, labor union activities and the
customary arrangement of providing crewmen with food and a share of the catch in addition to
wage.
Second, the large-scale fishery has had easy access to inexpensive labor from labor surplus
areas such as the northeast; impoverished and adventurous youth travel around the major coastal
towns in search of employment and adventure often found on the offshore and distant-water
fishing fleet. Small-scale fishermen with families living in remote fishing communities are less willing
to join long and arduous fishing trips for a comparatively unattractive wage.
Third, alternative employment opportunities have not been easily forthcoming to remote
fishing communities.
Fourth, fishermen are not particularly known for their mobility although given a sufficiently
attractive alternative many if not most would have made a move (see Panayotou and Panayotou
1985). Attractive employment opportunities are scarce in a country with surplus labor, especially.
when one takes into account the costs of retraining and relocation and the psychological and other
nonquantifiable costs involved.
Thus, a combination of distorted factor prices, easy access to a pool of inexpensive non-fishing
labor, limited occupational and geographic mobility among small-scale fishermen and scarcity of
alternative employment opportunities can explain why they continue operating in the traditional
fishing grounds with the traditional technologies. They still manage to earn incomes which, however
meagre, are higher than what they can earn from their next best alternative, net of the costs of
change and the perceived risk.
As a result, a dualistic structure has emerged and persists with a mobile and rapidly growing
trawling industry alongside an immobile and stagnating coastal fishery. The income earning positions of the two fishing subsectors differ greatly reflecting disparities in opportunity costs, which in
turn result from varied factor endowments, differential access to capital markets and disproportionate shares in government benefits, as well as differential mobility.
A second not unrelated factor contributing to a wide divergence in incomes is the differential
ability of the two subsectors to maintain their profits in the face of the open-access nature of the
resources and recurring economic shocks. Profits (or rents), defined here as revenues above all costs
of fishing, are expected to be competed away by new entrants or unfavorable changes in economic
circumstances. However, despite the open-access status of the Thai resources and the steep rises in
fuel costs that ought to have hastened the dissipation of profits, the resilient trawl fishery appears
to be as profitable as ever while the relatively immobile coastal fishermen are literally fishing for
subsistence.
CHAPTER 4
THEORETICAL FRAMEWORK
Cost and Earnings
An economic activity, to be worthwhile and viable in the long run, must earn sufficient revehues to cover both variable and fixed costs. These include the cost of not only purchased inputs but
also imputed costs for own labor, as well as depreciation and interest on capital. In other words,
the revenues must be high enough to cover the opportunity costs (foregone earnings from alternative uses) of all inputs including own and borrowed capital and family and hired labor. If there are
no barriers to entry and exit and no recurring external shocks, an economic activity would tend, in
the long run, to an equilibrium characterized by equality between revenues and costs (and hence
zero excess profits) and a more or less stable number (and size) of economic units engaged in the
activity. Such a state of affairs is usually characteristic of a mature industry operating in a competitive market. From both the individual firm and the society's point of view it is rational to expand
the activity to the point of zero marginal profit (assuming no side effects) as this will maximize
both the individual and the social returns from the activity.
Fishing, however similar to exploitation of other renewable resources such as forests, is an
economic activity with a difference. One of the inputs into this activity, the fish stock, though a
scarce resource (often more scarce than labor and capital), is available to the individual fisherman
free of charge. While scarce to the society the fish stock is a free good to the individual fisherman.
It is in the society's interest to economize the use of the fish stock, in the same way that the use of
other scarce resources is economized, but the individual fisherman has no incentive to economize a
resource to which he has essentially open and free access. To the society the fish resource is scarce
and its use involves a social cost (user cost); t o the individual fisherman the fish resource is abundant and its use involves no cost.
Thus, the total costs of fishing are lower for the individual than for the society and hence the
fishing activity (i.e., levels of fishing effort) is carried beyond the level that is socially worthwhile.
The individual fisherman may still be adding to his profits while the society is incurring increasing
losses as the fishing activity expands (and hence total costs increase) beyond a certain point. Eventually, if there are no barriers t o entry, the equilibrium of zero excess profits for the fishing industry would be reached. Fishermen would still cover all their costs, including opportunity costs, but
the society would not. The latter suffers a net loss by not covering the user cost of the fish stock, a
resource at least as scarce and valuable as labor and capital.
These ideas are shown diagrammatically in Fig. 4.1, which depicts the relationships between
costs and fishing effort and revenues and fishing effort. The cost-effort relationship (TC) is linear
because unit costs are assumed constant and, therefore, total costs (which do not include the user
cost of the resource) are proportional to effort. The revenue-effort relationship (TR) is dome-shaped
because as effort expands revenues rise less than proportionately reflecting the progressive depletion
of the fish stock. Eventually, a point (M) is reached beyond which further expansion of effort
produces a decline rather than a rise in revenues, Point M corresponds to what is known as the
maximum sustainable yield (MSY), i.e., the maximum catch which can be sustained over the long
run with a stable fish stock and a constant level of effort.
0
E
M
B
Effort
Fig. 4.1. A fixed price model of a fishery indicating the maximum economic
yield (MEY), maximum sustainable yield (MSY) and bionomic equilibrium (BE)
under open access. TR = total revenue; TC = total cost.
If the fishery is worth exploiting at all, revenues at low levels of effort exceed costs, that is,
excess profits do exist. Profits attract additional fishing effort and while the profit per unit of effort
falls steadily the total profit of the fishery as a whole rises up to a point, E, beyond which additional effort reduces both the individual fisherman's and the industry's profit. Point E corresponds
to what is known as the maximum economic yield (MEY), i.e., the maximum economic return or
profit that can be sustained over the long run with a stable fish stock and constant effort.
Under conditions of open access, however, effort will continue to expand until all profit is
dissipated and a level of effort, B, is reached where total revenues equal total costs, known as bionomic equilibrium at which both effort and fish stock stabilize. At B there is no incentive for
expansion of effort and if, for some reason, effort expands beyond B there would be losses inducing
exit and return to B. Open-access fisheries operating in a stable economic and physical environment
without barriers to entry are expected to gravitate towards a bionomic equilibrium (see Gordon
1953; Scott 1955). If they do not, there must be either barriers to entrylexit or recurring external
shocks such as changes in economic and environmental parameters that prevent the system from
completing the adjustment process.
At the bionomic equilibrium fishermen continue to earn the opportunity costs of their inputs
but the society does not. The dissipated profit represents precisely the user cost which ought to
have been paid by the users of the resource (fishermen) and received by the owner (the society).
Seen from another angle, the society as owner of the fish resource, like the owner of land or other
resources, is entitled to a rent for its use. Since the rent reflects thegcarcity value of the resource,
the more scarce the resource the higher the rent to which the society (or any other owner) is
entitled. It is precisely this increase in rent with scarcity that helps rationalize the use of the resource and conserve it at its "optimal" level. At the bionomic equilibrium, however, the society
earns no rent as if the fish resource were ubiquitous or useless.
Were the society to charge fishermen a rent or user cost for the resource, the total costs of
fishing, which now include only labor and capital costs, would rise substantially above current
levels. The higher fishing costs would make part of current fishing unprofitable thereby reducing
fishing effort and conserving the resource at the level which maximizes the net benefit to the
society from its scarce fishery and non-fishery resources. Fishermen would still cover all their
(opportunity) costs but there will be less fishing effort, i.e., fewer fishing trips, fewer boats and
fewer fishermen.
What about the loss of employment? If the fishing industry is small relative to the national
economy, there would be no significant effect on employment since the released fishermen (and
capital) would find employment in the rest of the economy at their opportunity cost which, in
equilibrium, is not below their current fishing income. There would be a negative employment
effect if the fishing industry is relatively large and the opportunity cost of labor (and capital) are
not independent of the level of employment in the fishing industry (see Anderson 1977). In most
cases, however, including Thailand, the fishing industry is small relative to the rest of the economy
especially in terms of employment.
A second case in which the incomes af fishermen might be affected by the reduction of effort
is when the fishery is in short-term disequilibrium either on its way towards a long-run equilibrium
or following external shocks. Under these circumstances fishermen may be earning short-term
excess profits, that is rent due to but not appropriated by the society. Taxation of total incomes
so that these rents accrue to the government or other taxing authority (acting on behalf of the
society) would cut the (short-term) incomes of both the remaining and departing fishermen down
to their true opportunity costs (or long-term incomes).
It is, therefore, of both analytical significance and policy relevance to determine the private
and social profitability of the industry by calculating and comparing costs and earnings. This may
be done for a number of years to establish the trend in profits or rents, which is indicative not only
of the profitability but also the maturity and stability and openness of the industry. A number of
poss'ibilities are shown in Fig. 4.2 and discussed briefly here. Steadily rising (excess) profits are
reflections of either an immature fishery (I in Fig. 4.2) or of favorable changes in economic, technological or biological parameters (I,), e.g., rise in prices, fall in costs or improved productivity of
the stock. Persisting stable profits (11) may reflect underlying barriers to entry which prevent their
dissipation by new entrants. Steadily declining profits (111) under stable economic and biological
conditions is an indication of movement towards a long-term bionomic equilibrium; otherwise they
may reflect unfavorable changes in bioeconomic parameters. Persisting zero or near zero profits (IV)
are evidence of the attainment of a bionomic equilibrium. Persisting losses (V) suggest the presence
of barriers to exit which prevent unprofitable units from leaving the industry. Finally, widely
fluctuating profits (anywhere between I and V) reflect unstable economic and/or biological environment, or an unstable response to external shocks, such as the EEZs or the enactment of fisheries
0
Effort
Fig. 4.2. A fixed price model of a fishery indicating rising profits (I and 1'), persisting profits (11), declining profits (111), zero profits (IV) and persisting losses (V).
TR = total revenue; TC = total costs. See text for further explanation.
regulations. The horizontal arrows indicate the tendency of an unregulated fishery towards dissipation of rents and open-access bionomic equilibrium. The vertical arrows show the magnitude of
profits (rents) or losses at the corresponding level of fishing effort. TR' and TR" are total revenue
curves corresponding to higher fish prices and/or increased productivity of the stocks. Such changes
may generate profits where previously there were zero profits as losses. The reverse changes are also
possible and can be depicted as downward shifts of the TR curve.
Correspondingly, the policy implications would differ depending on the profit picture of the
fishery. Rising profits call for controlled expansion of the fishery while falling profits call for interventions to limit entry; zero profits suggest the need for reduction of effort while negative profits
call for promotion of mobility and assistance for resettlement of surplus fishermen; finally, widely
fluctuating profits call for stabilization policies to enable a planned expansion or contraction of the
industry and improved information flow to induce more stable responses to external shocks.
Optimal Resource Use
If fishing effort must be controlled to prevent dissipation of economic rents or be reduced to
reverse it once it has taken place, the question arises as to what constitutes an optimal level of effort
at which the fishery should operate. From the economic point of view, the optimal level of effort is
the level at which economic rents are maximized, that is, the level of effort which generates the
maximum economic yield (MEY), which is the return to the scarcest factor of production, the fish
stock. Of course, a managing authority may define as optimum yield that which maximizes other
benefits such as "employment, equity or stability" but for the purpose of the present paper we will
assume that the managing authority's objective is to maximize the economic return from the fishery
(MEY).
How is MEY and the corresponding level of effort determined? By maximizing the spread
between total fishing revenues and costs which is accomplished by equating the marginal revenue
(MR) of effort to the marginal cost (MC) of effort as shown in Fig. 4.3. This in turn requires estimation of revenue and cost functions. Assuming constant cost per unit of effort (c), the cost function
(TC) presents no difficulty. The total marginal and average costs may be written, respectively, as:
However, estimation of the revenue function involves estimation of the underlying sustainable yield
function which is a relationship between sustainable catch (Y) and effort (E). In the case of singlespecies fisheries a sustainable function could be easily estimated by fitting a logistic growth curve
to catch and effort data, or, equivalently, a linear function between catch per unit effort (Y/E) and
effort:
where a and b are estimated parameters.
The level of effort generating the maximum sustainable yield (MSY) can be easily obtained
from (3) through simple differentiation as:
MSY itself is obtained by combining equations (3) and (5) :
MSY = a2/4b
. . (6)
a
Catch ( Y
Fig. 4.3. A variable price model indicating the maximum economic yield (MEY),
the maximum sustainable yield (MSY), the monopoly position and the bionomic equilibrium (BE) under open access. MR = marginal revenue; AR =
average revenue; MC = marginal cost; AC = average cost; P = price. (Source:
Copes 1970)
Then the total, marginal and average revenue functions may be written, respectively, as:
As stated earlier the optimum, or MEY, level of effort is obtained by equating MR and MC of
effort, i.e.,
p {a - 2bEMEY)= C,and
. . . (9)
By comparing equations (5) and (10) we obtain:
and since c, b, p > 0 we conclude that EMEY< EMSY,that is, economic yields are maximized at a
lower level of efforc (and larger stock) than physical yields.
MEY itself may be obtained by combining equations ( I ) , (7) and (10):
MEY = TRMEy -TCMEy = p {aEMEy - b ~ $ E y}- cEMEy
=
(pa-c-b
pa-c
2bp
pa-c
)
2bp
By combining equations ( I ) , (5) and (7) and comparing the result with ( l l ) , it can be shown that
excess profits or economic rents (TR-TC) are lower at EMsY than at EMEY.Profits are clearly
maximized at EMEY level of effort. This is the level an exclusive and secure owner of the resource
will select in order to make the most of his/her resource.
Under open access too, fishermen attempt to maximize their profits but because of lack of
exclusive property rights over the resource they have no incentive to take into account the effect of
their fishing effort on other fishermen's catch. The guiding variable for expansion of effort is the expected average revenue of effort rather than the marginal revenue. That is, under open access the
profit-maximizing rule for the individual fisherman (but not society as a whole) is to expand effort
as long as the average revenue (AR) of effort exceeds the average cost (AC) of effort, no matter
what this might do t o other fishermen's revenues and to his own future revenues. Thus, the effort.
for the fishery as a whole expands to the point where AR = AC, or
Solving equation (12) for E we obtain the open-access or bioeconomic equilibrium level of effort
(EBE) :
pa-c
...
EBE = pb
By comparing equations (13) and (10) we establish that the bionomic equilibrium is obtained at
substantially higher level of effort than MEY but not necessarily at higher level than MSY (it
depends on the price-cost relationship). Moreover, by combining equations ( I ) , (7) and (12) we see
that at EBE level of effort profits are totally dissipated:
At EBE level of effort neither the fishermen earn excess profits nor the society earns economic rents
for its scarce fishery resource. All potential surplus of revenues over costs has been totally dissipated
in excessive effort. Reduction of effort from EBE down t o EMEY would generate substantial
profits to the remaining fishermen (or rents t o the society), and at the same time increase the size of
the fish stock (it might even increase if at EBE the stock is severely depleted).
The preceding analysis assumes that the fishery under consideration is sufficiently small
relative t o the market in which it sells for changes in catch not to affect the price of fish. It is a
fixed price model which is appropriate in the case of a local fishery selling in a national market, or a
national fishery selling in the international market. For species such as prawns and squid which are
exported from Thailand this model is applicable. However, for other species such as the Indo-Pacific
mackerel which are consumed domestically, a more appropriate framework is a variable price model.
Such a model is best described in terms of revenues and costs per unit of catch rather than per unit
of effort. This is done by solving equation (3) for E to obtain:
The AC and MC in terms of catch are obtained as:
and
In order to derive the AR and MR functions it is necessary to estimate the relationship between
catch and price or the demand function for fish since the TR curve is now written as:
TR = p(Y)
Y where dp/dY < 0
. . . (18)
that is, the price of fish is not independent (but a declining function) of the catch.
The demand function for fish may be specified as:
where a is a constant embodying all variables other than catch that might have an influence on price
such as incomes, prices of substitute products, population growth and changes in tastes; P is the
slope of the demand function reflecting the effect of changes in catch on price. Now (19) may be
written as:
The AR and MR functions are then obtained as:
Again we may determine the MEY and bionomic equilibrium levels of effort by setting, respectively,
p = MC and p = AC. This is shown diagrammatically in Fig. 4.3 by superimposing the revenue and
cost curves. Social benefits (profits plus consumer benefits) not just profits, are maximized at
EMEY.Profits, which include both resource and monopoly rents in this case, are maximized at a
lower level of effort (where MR = MC) while they are completely dissipated at EBE (AR = AC).
One limitation of the fixed and variable price models just described is in the estimation of the
sustainable yield function which assumes a single-speciesfishery, in contrast with the multispecies
composition of Thai (and other tropical) fisheries. In the absence of interspecies interactions it is
still valid to estimate a total biomass yield curve. If, however, there are significant interdependencies
among species, such estimates become unreliable because it is always possible to increase the stock
and catch by depleting less prolific higher-value species and thereby stimulating the growth of
their more prolific lower-value preys and competitors. Panayotou (1982) has suggested direct
estimation of a sustainable value function as a way around the multispecies problem. The sustainable value curve of a multispecies fishery is constructed by multiplying the sustainable yield curve
of each species by its price and summing up over all species. The maximum value is attained at a
level of effort lower than that required for the maximum yield because of the depletion of highvalue sizes and species as the fishing intensity increases. However, estimation of a sustainable value
function is beyond the scope of the present study.
CHAPTER 5
COST AND EARNINGS I: THE LARGE-SCALE FISHERY
Ideally, we would like to have a long time-series on costs and earnings to calculate the profitability of fishing and its changes over time. Our methodology calls for establishing trends for
profits (Fig. 4.2). Are profits rising, falling or persisting at a more or less fixed level over time, or
have they been completely dissipated? Unfortunately, the existing cost and price data on Thailand's
fisheries do not allow the construction of the necessary time-series for establishing reliable trends.
At most, we were able to compute cost and earnings for the Thai trawl fishery for the years 1969,
1974,1977 and 1982 drawing on three surveys by the Department of Fisheries (1969,1974,1977)
and a more recent, though limited, 1982 survey by the Office of Agricultural Economics (OAE
1983). Because of the limited scope and unrepresentativeness of the 1982 survey most of the
following discussion will focus on 1977 as the last year, except where more recent information is
available.
The 1982 OAE survey used a limited sample of 40 vessels, which included only otter trawlers
14-25 m in length and pair trawlers 14-18 m in length to the exclusion of the numerous small trawlers (< 1 4 m) and the very large otter (> 25 m) and pair (> 1 8 m) trawlers. Even for the classes of
trawlers that were included the capital costs and catch figures were apparently overestimated. To
reduce the upward bias of the catch we combined the cost and price figures of the 1982 survey
(which appear reasonable) with alternative catch figures from "The Marine Fishery Statistics Based
on a Sample Survey 1982" (unpublished preliminary results of the Thai Department of Fisheries).
The latter may err on the conservative side. Unfortunately, there are no alternative figures for
capital costs. Thus, using the conservative DOF figures for catch and the overestimated OAE figures
for capital cost we obtain very conservative profit figures (see Tables 5.1 and 5.2). If, on the other
hand, we use only OAE figures we obtain grossly overestimated profits and unreasonable catch and
effort figures for the fishery as a whole (see Appendix Tables A.9 and A.lO). Therefore, the 1982
figures reported in this chapter should be regarded and interpreted with caution.
In the next chapter, we present two 'snapshots' of the costs and earnings situation of the
small-scale fisheries based on two surveys (1978 and 1983) which we carried out as part of other
projects.
The Trawl Fishery
The trawl fishery of Thailand grew from just over 2,600 registered vessels in 1969 to over
11,000 in 1982 (see Table 3.2). These figures are somewhat misleading since not all active trawlers
are registered and those which are may not all be in operation. Moreover, of those which are in
operation not all are operating in Thai territorial waters. Increasingly, over the years the fishing
grounds for Thai vessels expanded from Thailand's shallow coastal waters to the high seas. As the
number of vessels which are operating outside the Thai waters is unknown and varies according to
circumstances, the resource base of the industry is not fixed and well defined. By implication catch
and effort data are not as accurate and reliable as one would like to have for a cost and earnings
study, but, by and large, they are indicative of the changing fortunes of the industry.
Table 5.1 presents a summary picture of the catch and effort and the cost and earnings situation of the trawl fishery as a whole. The total fishing effort, measured in standard research vessel
(Pramong 11) hours, has expanded almost sevenfold between 1969 and 1977 to attain a threefold
increase in catch reflecting a precipitous fall (from 103 kg/hr to 47 kg/hr) in the catch per unit of
effort (CPUE) as shown in Table 5.3. A further decline in CPUE from 47 to 39 kg/hr and, if the
1982 survey is to be believed, effort occurred between 1977 and 1982.
Withv&sevenfold increase in effort and only a threefold increase in catch, between 1969 and
1977, one would expect a larger rise in costs than revenues and hence erosion of the profit margin
of the industry. In fact, the reverse has happened; revenues in 1977 were almost seven times larger
than in 1969 while costs increased only six times over their 1969 level; again the spread in 1982 was
in the same direction but larger (see Table 5.1).
Table 5.1. Catch, effort. revenues, costs and profits (in million baht) of the Thai trawl fishery for selected years.
Year
No. of
vessels
Total
catch
(t x 103)
Total
effort
Total
(St hr x 1 0 6 ) ~ revenues
Total
costs
Profits
Capital 1
Capital 2
Net
profitsC
Net
profits
illio ion standard hours.
b ~ h 1982
e
figures include otter trawlers 1418 m and 18-25m and pair trawlers 1418 m, while the 1969.1974 and 1977 figures
include also otter trawlers < 14 m and > 26 m and pair trawlers < 14 m and > 18 m. Not only are the 1982 figures not strictly comparable to the three earlier years but they should also be regarded with caution since they are derived from different souices, The
1982 profit figures in this and all other tables in this chapter are very conservative estimates, as we use the conservative catch per
vessel figures of the Department of Fisheries. The catch figures of the Office of Agricultural Economics put profits at 2,920 million
bahi and net profit at 1.906 million baht (see Appendix Table A.lO).
dNet profits 1 = profits minus opportunity cost of capital assumed to be 20% of capital 1 (= current value of fishing assets).
Net profits 2 = profits minus opportunity cost of capital assumed to be 20% of capital 2 (= original purchase value of fishing
asweb).
fClearly an overestimate but it is the only figure available.
Clearly an underestimate because of reasons given in footnotes b and e (see also Appendix Table A.lO).
Source : Computed from figures reported in Tables 5.2 and 5.3.
In both 1977 and 1982 the fishery earned substantial profits (gross of the return to capital),
but suffered considerable losses in 1974 because of a sudden surge in fishing costs as a result of the
steep rise in fuel prices during 1973-1974. Two different rates of return have been calculated; one
based on the current value of fishing assets as appraised by the fishermen and the other on capital
cost estimates; the first is thought to be more appropriate in explaining why existing vessels stay in
or leave the industry while the second in explaining why new vessels enter (or refrain from entering)
the industry. By 1977, the capital cost of the fleet had reached 3.6 billion baht in current prices (a
ninefold increase from 1969). Fishermen's own estimates placed the current value of their fishing
assets at 2 billion baht.
Both in 1969 and 1977 the industry earned a sufficiently high return, over 40% on the current
value of assets or over 20% on capital cost (Table 5.2) to keep existing vessels in the fishery, and
perhaps to attract a modest number of new entrants. In 1974, the trawl fishery suffered considerable losses that forced many vessels out of the industry. Each of these three years marks a new era
in Thai fisheries.
Around 1968-1969, following a decade of relentless entry (1,000 trawlers entered in 1967
alone) under stable economic conditions, the trawl fishery, still confined to Thai waters was approaching a bionomic equilibrium (a situation of zero profits). In fact, in 1969 over 300 trawlers or
13%of the fleet left the industry in the first net exit since the introduction of trawling in Thailand
(see Table 5.4 and Fig. 5.1). It was about this time that the Thai fishermen began in large numbers
to encroach on the fishing grounds of neighboring countries, and the Department of Fisheries began
to explore actively long-distance fishing grounds as an alternative to the depleting local stocks. The
underexploited waters of neighboring countries and the success in locating new fishing grounds in
the open seas have enlarged the resource base shifting upwards the sustainable yield and revenue
curves and creating new economic rents. The industry was quick to recover its buoyancy: the
number of trawlers more than doubled between 1969 and 1973 (Table 5.4) and the catching power
per vessel, defined as the ratio between standard and nominal effort, almost tripled (Table 5.3).
Table 5.2. Revenues, costs and profits (in thousand baht) per vessel and average return t o capital, Thai trawl fishery,
selected years.
Return
on
capital lb
Year
Revenues
Costs
Profits
Capital 1
Capital 2
(%)
Return
on
capital 2'
(a)
Net
profits ld
Net
profits 2e
aThe 1982 figures include otter trawlers 14-18 m and 18-25 m and pair trawlers 14-18 m, while the 1969, 1974
and 1977 figures include also otter trawlers < 1 4 m and > 25 m and pair trawlers < 1 4 m and > 1 8 m. Not only are
the 1982 figures not strictly comparable to the three earlier years but they should also be regarded with caution
since they are derived from different sources. The 1982 profit figures in this and all other tables in this chapter are
very conservative estimates, as we use the conservative catch per vessel figures of the Department of Fisheries. The
catch figures of the Office of Agricultural Economics put profits (per vessel) at 645,000 baht and net profits at
373,000 baht (see Appendix Table A.lO).
b ~ r o f i t sdivided by capital 1(= current value of fishing assets).
'Profits divided by capital 2 (= current purchase price of fishing assets).
d ~ r o f i t minus
s
opportunity cost of capital assumed equal to 20% of capital 1.
eProfits minus opportunity cost of capital assumed equal t o 20% of capital 2.
f ~ l e a r l yan overestimate but it is the only recent figure available.
g ~ l e a r l yunderestimates because of reasons given in footnotes a and f above (see also Appendix Table A.10).
Source : Computed from Tables 5.3 and 5.6.
Table 5.3. Average catch and effort per vessel, catch and cost per unit of effort and price, cost and profit per unit
of catch, Thai trawl fishery, selected years.
Year
Catch per vessel
(t) (% trash)
Effort per vessel
(hr) (St hr)a
Cost per
unit of
effort
(@/st hr)
CPUE~
(kglhr) (kglst hr)
Catching
power
index
Price
Cost
Profit
(@/kg) (@/kg) (8/kg)
aStandard hours.
(catch per unit of effort) here is not necessarily equal t o the CPUE of the research vessel given in Table
8.2 because of the smaller mesh size used by the commercial fleet.
'The 1982 figures include otter trawlers 14-18 m and 18-25 m and pair trawlers 14-18 m, while the 1969, 1974
and 1977 figures include also otter trawlers < 1 4 m and > 25 m and pair trawlers < 14 m and > 1 8 m. Not only are
the 1982 figures not strictly comparable to the three earlier years but they should also be regarded with caution
since they are derived from different sources (see sources to Table 5.5 from which this table is derived).
b~~~~
It was about this time that the oil crisis shocked the industry. The price of fuel rose by 138%
between 1972 and 1974. More damagingly, there had been no warning. The sudden and successive
price rises took the industry by surprise following its heavy investment in a fuel-intensive distantwater fleet with engines, gear and nets designed for an era of low fuel prices. With fuel accounting
for over 50% of fishing costs, the more than doubling of fuel prices meant at least a 50% increase in
fishing costs. Between 1969 and 1974, the cost per unit of catch rose by 77% or 13%above the rate
of inflation. By comparison, the price of fish rose by only 47% or 17% below the rate of inflation.
Not only were all profits dissipated but also the industry is estimated to have suffered losses between
230 and 400 million baht (Table 5.1) despite the exit of about 500 trawlers (Table 5.4). Exit continued into 1975 and the industry did not return to its 1973 size of fleet until 1977.
By 1977 the necessary adjustments to the new realities of depleted local stocks and high fuel
prices were made and the industry had recovered sufficiently to turn in a profit and attract 3,000
additional trawlers into the fishery over the following three years. In fact, 1977 is a sort of landmark in the historjr of the Thai fishery because of its all-time record catch of over 2 x lo6 t (Table
3.3). No doubt, much of this catch, 40-60% according to some estimates (Rientrairut 1983), came
from outside the Thai territorial waters despite the high fuel prices which discriminate against
distant-water fishing.
But the cost of distant-water fishing was to be raised again soon. Country after country, Thailand's neighbors began to declare and enforce 200-mile exclusive economic zones: Vietnam in 1977,
Kampuchea and Bangladesh in 1978, the Philippines in 1979 and Indonesia and Malaysia in 1980.
And then came the second oil price shock of 1979-1980. These events combined to raise the cost of
fishing, especially in distant waters and to reduce the fish stocks at home. The declaration and
Smaller than
14 m otter trawler
2,800
2,600
-
-
14-18 m otter trawler
2,200 2,000 1,800 1,600 1,400 1,200 2,400
,14-18 m pair trawler
,------*c-
Larger than
25 m otter trawler
Smaller than
14 m pair trawler
1967 68 69 70 71 72 73 74 75 76 77 78 79 80 81 82
Year
Fig. 5.1. Time trends in the numbers of Thai trawl vessels, 1967-1982.
Table 5.4. Registered trawling vessels of various sizes, Thailand, 1967-1983.
-
Year
< 14 m
Otter trawlers
14-18 m
18-25 m
-
> 25 m
< 14 m
Pair trawlers
14-18 m
> 18m
'Figure includes other trawlers 18-25 m and over 25 m in length,
Source : Department of Fisheries, Thai Fishing Vessels Statistics, various issues.
- Zero or negligible.
enforcement of EEZs by neighboring countries increased the risk of loss of life, capital and catch
and made necessary investment in faster vessels and more sophisticated detection equipment to
avoid arrest. At the same time it must have forced others to retreat into.the Thai territorial waters
t o avoid the extra cost.
While data on these developments are not available, the 1982 survey provides some indication
of what may have happened. First, as shown in Table 5.3 the cost per kilogram of fish caught
doubled from 2.36 baht in 1977 to 4.77 baht in 1982, the catch per unit of effort dropped from 47
to 39 kg/hr, and the cost per unit of standard effort increased by at least 40% over the same period.
The losses that must have occurred in 1980 and early 1981 forced almost 2,000 trawlers to leave
the fishery (Table 5.4 and Fig. 5.1). As a result, the completion of adjustments to the new realities
and the rise in fish prices during 1981-1982, substantial profits gross of the opportunity cost of
capital were earned in 1982 attracting almost 3,000 additional trawlers into the fishery during that
year alone. According to our conservative estimates based on the costs and prices given in the latest
survey by the Office of Agricultural Economics (OAE 1983) and the catch and effort statistics of
the Department of Fisheries, the trawl fishery (excluding otter trawlers below 1 4 m and above 25 m
and pair trawlers below 1 4 m and above 18 m) earned a profit of almost a billion baht or a return of
20% on its capital (Table 5.1) despite the entry of 5,000 new vessels since 1977. (When only OAE
figures were used, the estimated 1982 profits reached 3 billion baht or 58% on assets as shown in
Appendix Table A.lO.).
However, this aggregate picture may be somewhat misleading. The 1982 survey focused on
trawlers above 1 4 m in length which have access to distant-water fishing grounds, and ignored the
numerous small (< 1 4 m) trawlers with little or no access beyond the heavily exploited local fishing
grounds. The difference in profitability between trawlers of different scale can be dramatic. In
1974, for example, the only vessels that registered substantial profits were large otter trawlers over
18 m in length; smaller trawlers suffered catastrophic losses. It is, therefore, important to disaggregate the industry by type of vessel. This is done in Tables 5.5 and 5.6. A number of observations
can be made from these tables.
First, small trawlers have been generally less profitable than larger ones and less able to adjust
to changing circumstances partly because of their limited access to offshore resources. Even with
the most conservative estimate of capital costs, the otter trawlers less than 1 4 m had reached a
bionomic equilibrium around 1969. In 1974 they suffered losses from which they were not able t o
recover even in 1977 which was a generally goad year for the industry as a whole. In fact, in 1977
they incurred losses at least twice as large as in 1974, failing even to cover their variable costs. Yet,
despite a limited temporary exit (in 1970,1975 and 1978) following these losses the fleet of small
trawlers continued to grow and reached 5,200 vessels by 1982 (see Table 5.4). This paradoxical
behavior can be explained by the low mobility of existing trawlers out of the fishery in response t o
losses and the high mobility into the fishery of new trawlers in response to large profits from
operating in underexploited coastal waters of neighboring countries, especially Kampuchea and
Burma. Evidence for the validity of this explanation is provided by the relative stability of the fleet
in depressed fishing areas and the rapid expansion of the fleet in provinces neighboring Kampuchea
and Burma such as Trat and Ranong, respectively.
The next size (14-18 m) otter trawlers with a longer fishing range performed somewhat better
than the smaller trawlers. While they also were around bionomic equilibrium in 1969 and suffered
heavy losses in 1974 they returned to bionomic equilibrium around 1977 and enjoyed substantial
profits in 1982. Their fleet grew at a slower but more steady pace from 900 vessels in 1969 to 2,400
vessels in 1982 with entry and exit following profits and losses closely (see Tables 5.4 and 5.6). The
most resilient of the otter trawlers turned out to be the larger sizes, 18-25 m and over 25 m in
Table 5.5. Catch and effort per vessel, catch and cost per unit of effort. and price, cost and profit per unit of catch, by type and size
of trawler, Thailand, selected years.
Year
No. of
vessels
Catch
per vessel
(t) (% trash)
Effort
Cost per
pervessel
unitofeffort
(hr) (st hr)a
(B/st hr)
CPUE
(kgmr) (kglst hr)
Catching
power index
Price
(8lkg)
Cost
Profit
(BFg) (8lkg)
< 1 4 m otter trawler
14-18 m otter trawler
18-25 m otter trawler
> 25 m otter trawler
< 14 m pair trawler
14-18 m pair trawler
> 18 m pair trawler
:standard hours.
The 1982 figures should be regarded with caution, since they have been calculated based on figures from different sources (see
sources below).
Soume :
Number of vessels and CPUE (per standard hour) from Tables 5.4 and 8.2, respectively. All other figures for 1969,1974
and 1977 from Appendix ~ a b l e $ ~ . and
2 A.3. The 1982 figures are from Appendix Tables A.6 (costs per standard hour
and price per kg of catch). A.7 and A.8 (catch per vessel and nominal fishing effort).
length, presumably because of their longer fishing range and, hence, access to less heavily exploited
fishing grounds. Larger trawlers managed to earn profits even in 1974, the worst year in the history
of the Thai fisheries. It is apparently easier t o adjust to higher fuel prices than depleted fishing
grounds. Large vessels, despite their large fixed costs, manage to adjust to changing circumstances
because they have more degrees of freedom, more options to choose from. When one fishing ground
Table 5.6. Revenues, costs and profits per vessel and rates of return to capital by type and size of trawler, Thailand,
selected years.
Year
Revenues
Costs
(Bxlo3) (Bxlo3)
Profits
(Bxlo3)
Capital 1
(px103)
Capital 2
(Bx103)
Return
on
capital 1
Return
on
capital 2
(%)
( %
Net
profits I
( B Xl o 3 )
Net
profits 2
(BX l o 3 )
< 1 4 m otter trawlers
14-18 m otter trawlers
18-25 m otter trawlers
>
25 m otter trawlers
< 1 4 m pair trawlers
14-18 m pair trawlers
> 1 8 m pair trawlers
n.a. = Data not available.
'The 1982 figures should be regarded with caution since they are derived from different sources (see sources t o
Table 5.5 from which this table is derived).
b ~ s s u m i n gthe two rates of return for intermediate size trawlers bare the average relationship of the two rates of
return for smaller and larger pair trawlers, i.e., R2 = R1 (0.615 + 0.348)/2 = (29) (0.481) = 14.
Source : Revenues and costs from Table 5.5; capital from Table 8.4.
becomes depleted they can move to another; when fuel prices in Thailand increase they refuel
elsewhere and land their catches in nearby ports to minimize fuel cost, to take advantage of higher
fish prices and/or t.0 avoid taxes. They also enjoy lower risk from rough seas, pirates and neighboring countries' patrol vessels because of their sheer size, powerful engines and sophisticated detection
and defense armory. The higher profitability of large vessels accounts for their high growth rate. In
1969 there were only 200 vessels over 18 m in length; in 1982 there were over 1,700 of them, In
the late 1960s there were only a score of vessels larger than 25 m; in 1982 there were as many as
103 (Table 5.4). It is also of interest t o note that these giant trawlers enjoyed a reduction in the
proportion of trash fish in their mtch from 71% in 1974 t o 60% 1977 because of the ability to
explore and exploit new fishing grounds (Table 5.5). An alternative explanation is that giant trawlers continued to catch similar amounts of fresh fish in their catches, the only difference being the
proportion discarded at sea.
The superiority of larger vessels, however, does not apply to pair trawlers. Pair trawlers over
18 m long, while very costly in terms of capital and fuel consumption, are too cumbersome and
inflexible for the modern day 'opensea' fishing which takes the form of a 'hit-and-run' operation.
Thus, large pair trawlers have not been able to recover from their 1974 slump as rapidly as the
medium (14-18 m) trawlers have. Yet, in 1982 both size groups were earning substantial profits as
reflected in the 26% return on capital for medium trawlers (Table 5.6) and the massive entry of new
vessels in both groups (Table 5.4).
A second observation from Tables 5.5 and 5.6 is the changed fortunes of the small (< 1 4 m)
pair trawlers, once the most profitable gear. In 1969 small pair trawlers enjoyed at least a 60%
return on capital, by far the largest in the industry and saw their fleet grow from 19 vessels in 1968
to 153 in 1973. In 1974, they suffered such catastrophic losses, by far the largest in the industry,
that their fleet dwindled to 70 vessels in 1977 and 50 vessels by 1982, despite a temporary recovery
in 1979. One reason behind this dramatic change has been the rise in fuel prices that affected
disproportionately the small pair trawlers which use two vessels usually fitted with inefficient
second-hand automobile engines. Between 1969 and 1974 the cost per unit of effort rose by 250%
and the cost per kilogram of fish caught by 550%.
In conclusion, resource rents appear to have been dissipated over time for small trawlers and to
have risen for all other groups, which have been able to adjust to the changing circumstances of high
fuel prices, depleted local stocks and the declaration of EEZs by neighboring countries. In general,
it could be said that profitability and size tend to be correlated because of the greater mobility and
wider range of options for adjustment to changing circumstances that larger size can afford. Of
course, it is not just vessel length but also engine power, speed, tonnage, technology and financial
capital which are correlated with size that account for the greater resilience of the large-scale trawl
fishery. In the following chapter, we turn to the other end o 3 h e spectrum, the traditional smallscale fishery, which lacks not only size but also modern technology and capital, and is confined to
the coastal fishing gruunds around isolated fishing communities.
A Note on the Pelagic Fishery
While the focus of this study is on the dualism between the small-scale coastal fishery and the
large-scale offshore trawl fishery and their interactions and conflicts, another subsector, of an
intermediate scale, deserves some attention: the pelagic or purse-seine fishery. The two terms are
not synonymous since trawlers, though primarily a demersal gear, also catch some pelagic fish and
seiners, though primarily a pelagic gear, also catch some demersal fish (see Table 5.7). In this note,
we briefly discuss the pelagic fleet and catch. An indication of the profitability of the pelagic
fishery (purse seines and gill nets) is given in Chapter 6 where the small- and medium-scale fisheries
are compared (see Table 6.3). A more indepth economic analysis of the pelagic fishery is not
intended. The state of pelagic resources is discussed in Chapter 8.
The pelagic catch accounts for roughly 20% of the total catch and 35% of the edible catch.
Seines, the main pelagic gear, land nearly 20% of the total catch and 90% of the pelagic catch (see
Table 5.7). In 1981 seine nets caught 337,000 t of fish, which represents a 35% increase over 1980
and a 25% decline from 1977. One feature of the purse seine fishery is its volatility, both in terms
Tsble 6.7, Annual production by fishing gear typea, 1974-1981( t x lo3).
--
Gear type
Otter trawl
variety
1974
1975
1977
1978
1979
1980
1981
Pelagic
Demersal
Crustacea
Cephalopods
Trash
Total
Pair and
beam trawl
Pelagic
Demersal
Crulrtacea
Cephalopods
Trash
Total
Seine nets
Pelagic
Demersal
Crustacea
Trash
Total
Luring
lift nets
Pelagic
Demersal
Total
Gill nets
Finfish
Crustacea
Total
Push nets
Fish
Crustacea
Cephalopods
Trash
Total
Other small-scale gear
Total
'1976 data unavailable.
Source : ADB 1985.
of the stocks and effort, which is translated into large fluctuations in the catch. For example, the
seine catch jumped from 102,000 t in 1975 to 436,000 t in 1977 to decline to 291,000 t in 1979.
The variations in the purse seine catch and, therefore, in the pelagic catch partly reflect the
historical development of the fishing industry in Thailand. Before the introduction of the trawlers,
the Thai and Chinese purse seines and gill nets were the most prevalent marine fishing gears. With
the introduction of trawling, many purse seiners were converted for trawling with consequent
decline of the pelagic catch. Since the mid-1970s, the introduction of modified "luring purse
seining" techniques, the declining catch rates of trawlers and the location of new pelagic fish
grounds in the Central Gulf gave new impetus to the pelagic fishery which has since become again a
significant subsector of the Thai fisheries (ADB 1985).
The main pelagic gears in the past have been the traditional Thai and Chinese purse seines and
the anchovy purse seines. These gears are now increasingly replaced by the luring purse seine which
is becoming the predominant pelagic gear of the Thai fishery. Other important pelagic gears are
encircling giil nets and drift nets. In 1982, the licensed pelagic fleet consisted of 840 seine net
vessels (15% under 1 4 m in length) and 4,760 gill net vessels (over 90% under 1 4 m in length). The
changes over time in the numbers and types of registered pelagic gear units in the Gulf of Thailand
are given in Table 5.8, side by side with the pelagic catch attributable to these units. It is worth
noting that while the number of fishing units remained constant between 1977 and 1981 and
effective effort increased as a result of the replacement of Thai purse seine by luring purse seine, the
pelagic catch has declined steadily.
Table 5.8. Pelagic catch in the Gulf of Thailand, and changes in the numbers of fishing gear units for small pelagic
species.
Pelagic catch
(t)
Thai
purse seine
Registered fishing gear units
Luring
Anchovy
Encircling
purse seine
purse seine
gill net
Total
gear units
Source : ADB 1985.
The most important pelagic species caught in the Gulf of Thailand are sardines, round and
hardtail scads and Indian and Indo-Pacific mackerels which account for 39%,31%and 10%of the
pelagic catch of luring purse seines, respectively. Encircling gill nets and drift nets catch mainly
Spanish mackerels. On the Andarnan Sea the most important pelagic species are the Indian and
Indo-Pacific mackerels (ADB 1985).
CHAPTER 6
COST AND EARNINGS 11: THE SMALL-SCALE FISHERY
Until recently, there was only fragmentary information on the costs and earnings from smallscale fishing by some 300,000 small-scale fishermen in Thailand scattered along a coastline of 2,600
km. The spectacul& development of the trawl fishery during the past 25 years has overshadowed
the small-scale coastal fishery, which has managed to survive despite the keen competition from
trawlers and the relative neglect by the government. Chapter 2 reviewed some of the earlier fragmentary information on the socioeconomic conditions of small-scale fishermen.
This chapter discusses the results of two more recent and more systematic surveys of the cost
and earnings situation of small-scale fisheries. The two surveys conducted in 1978 and 1983 are
comparable (though the second is not as extensive as the first) in the strict sense of having surveyed
precisely the same sample (or a subsample) for the purpose of identifying the changes that have
occurred between 1978 and 1983. In what follows is a discussion, first, of the 1978 findings in
some detail (by province and type of gear) and then a presentation of a community by community
comparison of incomes and rents between 1978 and 1983. A more detailed account of the results of
the 1978 survey is given in Panayotou (1982) and of the 1983 survey in Panayotou and Panayotou
(1985).
Analysis by Scale of Operation
The 1978 survey was conducted by Kasetsart University staff members (including the authors)
for a study on the "Socioeconomic Conditions of Coastal Fishermen", which was supported financially by the International Development Research Centre of Canada. Four coastal provinces, Chumphon, Nakhon Si Thammarat, Trat and Phangnga were then selected as a cross-section representation
of coastal fisheries in Thailand. Geographically, the four project sites were so selected that two,
Chumphon and Nakhon Si Thammarat, are located on the west coast of the Gulf of Thailand; Trat,
on the east coast and Phangnga on the Andaman Sea coast. Religion was also a factor in selecting
the four provinces: Chumphon and Trat consist of purely Buddhist communities, Phangnga is
predominantly Muslim and Nakhon is mixed. In terms of level of development the fisheries of
Nakhon and Phangnga are smaller in scale and more primitive in technology than the other two. A
total sample of 891 households was drawn randomly from predominantly fishing villages. Data were
collected on catch and effort, costs and prices, fishing and non-fishing employment and assets,
incomes and expenditures and several sociodemographic variables including occupational and
geographic mobility.
Scale is defined in terms of current value of fishing assets: fishing units with fishing assets
valued at less than 20,000 baht in 1978 were classified as small scale while those with more than
20,000 baht were classified as medium scale and those with assets worth over 100,000 baht as large
scale. The Department of Fisheries uses length of vessel as a criterion of scale: vessels under 1 4 m in
length but excluding trawls, purse nets, purse seines are classified as small scale, the rest large scale.
The two definitions, of course, may give rise to different results regarding the numbers and economic
conditions of small-scale fishermen. While the surveys and background studies to this chapter were
based on the "asset" definition of scale and the results presented here in that format, it would be
useful t o translate the results, to the extent possible, into the DOF definition of scale. This is done
later in this section.
Table 6.1 presents the cost structure of the coastal fishery by province and scale of operation
Unlike the large-scale fishery (assets above 100,000 baht) where fixed costs (depreciation and
interest on capital) often dominate, in the coastal fishery, which includes both small and medium
scale (including otter trawlers under 1 4 m), fixed costs rarely exceed 15%of total costs. Labor costs
are relatively more important, especially in the small-scale fishery where they range between 29 and
41% of total costs reflecting the labor intensity of the coastal fishery. It should be noted, however,
that these labor costs are not actually paid expenses for hired labor but imputed opportunity costs
for family labor, unlike the labor costs of the medium- and large-scale fisheries. Labor is most
important in the small-scale fishery of Phangnga where capital accounts for only 8%of total cost.
Fuel is an important cost item accounting for 1 4 to 42% but not as important as in the large-scale
trawl fishery where it accounts for over 50% of total costs. Least fuel-intensive are the small-scale
fishing vessels in Chumphon, Trat and Phangnga, some of which are non-mechanized, while most
fuel intensive are the medium-scale trawlers of Trat which venture into Kampuchean waters.
Most striking are differences in the cost of borrowed capital (see Table 6.1). In Phangnga
which is predominantly Muslim and in Trat which has well-developed institutional credit by virtue
of its proximity to Bangkok, the interest rates paid by fishermen, small and medium scale alike,
were in line with the institutional rates of interest paid by the large-scale trawl fishery. In Chumphon and Nakhon the coastal fishermen borrowed mainly from informal sources which charged them
interest rates three t o five times as high as those charged by banks. The interest rate ceiling of 12%
imposed on bank loans by the government, ostensibly to help poor farmers and fishermen, dries up
rural credit which is generally more costly and forces fishermen to borrow from fish traders and
middlemen at high interest rates often hidden in preemptive marketing arrangements. This is a
Table 6.1. Cost structure, debt and current capital cost by scale of operation, four coastal provinces, Thailand, 1978.
Debt
Location
Sample
size
Current
capital
cost
Amount
Interest
Chumphon
Small scale
Medium scale
Average
Nakhon
Small scale
Medium scale
Average
Phangnga
Small scale
Medium scale
Avqrage
Trat
Small scale
Medium scale
Average
Source : Panayotou et al. (1985) based on the 1978 survey.
% of
capital
cost
% of total cost
Fixed
cost
Labor
cost
Fuel
cost
Other
costs
particularly restrictive constraint for coastal fishermen who borrow up to 50% of their fishing
capital which ranged between 4,600 baht for the small-scale fishery in Phangnga to 55,000 baht for
the medium-scale fishery in Trat (see Table 6.1). The latter, however, borrows only 23% of its
capital because it generates sufficient profits for reinvestment from its operation in the lightly
exploited Kampuchean waters.
Table 6.2 reports the revenues, costs and returns for the coastal fishery, again by province and
scale of operation. Revenues ranged between 35,000 baht in the small-scale fisheries of Chumphon,
Nakhon and Phangnga to 250,000 baht in the medium-scale fishery of Chumphon and 360,000 baht
in the medium-scale fishery of Trat. Costs were equally varied ranging between 17,000 baht in the
small-scale fishery of Nakhon and 200,000 baht in the medium-scale fishery of Trat. Imputed costs
(the part of the cost that is incurred but not paid out in cash because it involves the use of owned
inputs such as family labor and capital) ranged between 36 and 48% of total costs for the small-scale
fishery and 1 9 to 25% for the medium-scale fishery (see Table 6.2). As we would expect, the larger
the scale of a fishing operation the less it relies on its own factors of production and more on hired
labor and borrowed capital.
Gross family income defined as revenues minus cash costs, is the maximum income that the
household can consume in the short run. It is not sustainable over the long run since no allowance
for the depreciation of fishing assets is made. Gross family income ranged between 16,000 baht
earned by small-scale fishermen in Nakhon to almost 200,000 earned by medium-scale fishermen in
Trat. Net family income, which allows for depreciation and therefore is sustainable over the long
run, was only marginally lower than gross income because of the low capital intensity of the coastal
fishery. By comparison to a national average of 8,390 baht per capita (see NESDB 1977,1981) and
assuming no other source of income, the small- and medium-scale fishermen to Nakhon were worse
off than the average Thai citizen. The small-scale fishermen in the other three provinces earned net
incomes comparable to the national average. The medium-scale fishermen of Chumphon and Trat
were substantially better off than the average Thai citizen.
Table 6.2. Annual revenues, costs and returns (@ x l o 3 ) per coastal fishing unit by type of technology in four provinces, Thailand, 1978.
Location/
scale
Revenues
Cash
Costs
Imputed Total
Incomea
Gross Net
Chumphon
Small scale
Medium scale
Average
Nakhon
Small scale
Medium scale
Average
Phangnga
Small scale
Medium scale
Average
Trat
Small scale
Medium scale
Average
Source : Panayotou et al. (1985) based on the 1978 survey.
profitb
Gross Net
Return Return
to
to
Resource capital labor
%
(@/day)
rents
Gross profits, defined as the difference between revenues and variable (operating) costs, were
positive for both small- and medium-scale vessels as groups, ensuring their continued operation over
the short run since all operating costs were covered. Similarly net profits, defined as gross profit
minus fixed costs, were positive, ensuring continued operation over the long run as well. Pure profits
or resource rents, obtained as the difference between net profits and the opportunity cost of
management (that is, what owner-operators could earn by hiring out their managerial skills approximated here by the average earnings of hired skippers), were positive for both groups in all locations
except for small-scale fishermen in Trat. The opportunity cost of management as an imputed cost
is relevant to all fishing units regardless of capital or management intensity, but admittedly operators
of large and modem vessels and gear have more marketable management skills. Here, we assume that
the opportunity costs of management vary only across locations but not across gear types. However, in most cases, these rents were not substantial enough to refute the hypothesis that the fishery
had reached a bionomic equilibrium. The only exceptions were the medium-scale fishermen of
Chumphon and Trat who earned 94,000 and 147,000 baht in rents, respectively.
The return to capital was highest in Phangnga where many vessels are non-powered and have
very low capital cost and in Trat for medium-scale vessels which earned the highest resource rents
because of their operation in the rich fishing grounds of neighboring Kampuchea. In the latter case,
however, a very high return is necessary to compensate for the substantially higher risk of loss of
life and vessel borne by encroaching fishermen. However, returns to capital are high for all gear
groups in all locations, even for those with negative resource rents because of the very low capital
cost involved in coastal fishing. For this reason, the concept of return to capital makes little sense in
the case of small-scale fisheries.
More appropriate is the concept of return to labor, since coastal fishing is a labor-intensive
activity. Fishermen and other members of their family engaged in coastal fishing earned daily wages
of 21 to 100 baht. The minimum daily wage for unskilled labor in 1978 in southem Thailand was
35 baht. Since fishermen are not totally unskilled and also tend to face higher risk at sea than do
unskilled laborers on land, they are expected to earn over 35 baht a day. Medium-scale fishermen in
Chumphon and Trat and small-scalefishermen in Phangnga did, but the rest did not. Most unsatisfactory were the wages of fishermen in Nakhon, small and medium scale alike, which averaged
22 baht per day. This is a reflection of both the low profitability of fishing in Nakhon and the lack
of alternative employment opportunities.
As in the case of the trawl fishery, averages may be misleading when variances are large. Table
6.3 breaks down these averages by type of gear. While on the average, coastal fishermen had positive
incomes and profits, fish gill nets in Trat had negative income and both fish gill nets in Trat and
push nets in Phangnga had negative gross profits and would have been better off not operating at all
even in the short run since they did not cover their operating costs. In the long run, in addition to
these two groups of gears, trawl nets in Chumphon were also unprofitable and hence economically
non-viable since they failed to cover their fixed costs in addition to variable costs. When the opportunity cost of management was deducted from net profits three additional types of gear turned out
to earn negative resource rents: crab gill net in Chumphon and Phangnga and winged set bag in
Nakhon. In total, six gear groups, at least one in each location, had negative rents, which if they
persist over the long run would imply geographic and/or occupational immobility.
It is of interest to examine how sensitive our results are to the particular definition of scale
used by reassemblmg the 1978 survey data according to the definition of scale: small-scale fisheries
are those which are carried out by small fishing gears operating on a subsistence basis from vessels
less than 1 4 m in length with engines not greater than 30 hp deployed in the vicinity of the home
base with mostly family labor on board; trawls, push nets, purse seines, mackerel gill nets and even
bamboo traps are excluded regardless of size. This leaves only non-powered gear, cast nets, lift nets,
winged set bags, crab traps, non-mackerel gill nets and other traditional fish catching devices, to be
included in small-scale fisheries. The economies of these individual gear types are given in Table 6.3.
When the 1978 survey data were reassembled based on the DOF definition of scale and aggregated into a "small-scale" fishery group the results were not significantly different from those
obtained earlier based on "our" definition of scale (and, thefore, they are not repeated here). This is
hardly surprising. In Chumphon, the two definitions give rise to the same classification of fishing
units and, therefore, no differences in the results should be expected. A small difference arises for
Table 6.3. Profitability per fishing unit by selected types of technology. four coastal provinces. Thailand. 1978.
-
-
-
--
-
Gmss
Technology
(Type of gear)
Fishing
months
Gross
revenues
-
Pure profit
Net
f-y
family
income
income
Operating
profit
Net
profit
(economic
rent)
Return
to capitala
Retto labor
(%)
(%)
Chumphon
Cast net (S)
Shrimp gill net (S)
Crab gill net (S)
Fish gill net (M)
Push net (M)
Purse seine (MI
Trawl net (M)
Nakhon
Lift net (S)
Winged set bag (5)
Shrimp giu net (S)
Trawl net (S)
Push net (M)
N o ~ p o w e r e d(S)
Push net (S)
Wiwed set bag (S)
Crab gill net (S)
Shrimp giU net (S)
Txat
Crab trap (S)
Fiah gill net (S)
Shrbnp gill net (S)
Crab gill net (S)
Push net (M)
Trawl net (M)
S = anal3 wale. M = medium scale.
;orilinal
cost of capital.
Family labor.
Source : Panayotou et 81. (1985) based on the 1983 survey.
Nakhon, Phangnga and Trat where trawl nets, push nets and fish gill nets, respectively, were included
under our definition of scale and are now excluded under the DOF definition. Since all these three
types of gear were doing worse than the average gear in the group, in terms of return to both labor
and capital, their exclusion from the group would raise rather than lower the average profitability of
the small-scale fishery. Therefore, our results overestimate somewhat the plight and numbers of
small-scale fishermen compared to the results on the official classification of scale. However, the
difference is small because the sample (and population) size of push nets in Phangnga and fish gill
nets in Trat is very small and the performance of trawl nets in Nakhon, which are more numerous,
diverges only marginally from that of the group as a whole.
Thus, it matters little which definition of scale is adopted, at least for the sample and time
frame of this study. What matters more is that any assistance towards the sector should not be
indiscriminate for the entire coastal fishery but targeted to benefit those in need of assistance t o
improve their fishing performance or to move to other more profitable activities.
Analysis by Fishing Community: Changes Over Time
In order to investigate the persistence of rents (whether positive or negative) and the extent of
mobility in and out of the fisheries, in 1983 we carried out a survey of a subsample of the 1978
survey.
Table 6.4 presents a comparative picture of fishing, non-fishing and total income per household in seven villages in Chumphon, during 1978 and 1983. The average fishing income per household in Chumphon dropped from 25,600 baht in 1978 to 23,600 in 1983, an 8% decline in nominal
termssr a 45% decline in real terms (the consumer price index rose by over 40% during the period).
This decline was not uniform across the seven villages; in fact, in three out of seven fishing incomes
rose substantially, but the decline in the other four was sufficiently strong to average in an overall
decline. In contrast, non-fishing incomes rose in all villages except one. On the average non-fishing
incomes rose by 165% in nominal terms or by 59% in real terms.
The total household income averaged 32,000 baht in 1978 and 40,000 in 1983, a 25% increase
in nominal terms or a 25% decline in real terms despite a 17.5% increase in effort (measured in
man-days of work). Moreover, there has been a change in the composition of total household
income; in 1983 only 60% was derived from fishing compared to 80% in 1978. Overall, the sampled
fishing villages of Chumphon in 1983,were on the average poorer and less dependent on fishing than
five years earlier. The cause behind this rise in poverty was clearly the decline in the profitability of
fishing. As seen from Table 6.5 the fishing wage rate declined by 3.5% while the non-fishing wage
rate (that is, the opportunity cost of fishing) rose by 54%, both in nominal terms. These developments amount to a 93% drop in fishery resource rents from 30 baht per man-day in 1978 to 2 baht
per man-day in 1983; that is, by 1983 virtually all rents were dissipated. In only two villages did
fishermen earn positive rents. In the other five they suffered considerable losses ranging from 4 to
36 baht per man-day.
How much shifting to other occupations took place in response to the diminished profitability
of fishing vis8-vis non-fishing occupations? Tables 6.5 and 6.6 show that a 3.5% reduction in the
fishing wage rate is associated with a 4.3% reduction in the number of man-days devoted to fishing
by the household. On the other hand, a 54% increase in the non-fishing wage rate corresponds to a
76% increase in the number of man-days devoted to non-fishing activities. These changes imply a
mobility "elasticity" (percentage change in working hours over percentage change in wage) of 1.23
for fishing and 1.41 for non-fishing, that is, there was substantial, though not infinite, mobility out
Table 6.4. Changes in fishing. non-fishing and total incomes (average per household, in baht) between 1978 and 1983 in selected
villages in the Muang District. Chumphon Province, Thailand.
Subdistrict1
village
Sample
size
Fishing incomea (baht)
1978
1983
%A
Village 2
3
13.918
20.280
(15,435)~ (13.595)
Village 3
2
22,324
(19.341)
Village 5
7
18,230
(14.593)
35.511
(26,623)
Village 7
3
26.430
(28,289)
56,511
(44,768)
Village 3
14
34.205
(27.413)
Village 4
7
27,667
(22,026)
45.7
Non-fishing incomea (baht)
1978
1983
%A
21,718
40.280
-19.5
36,679
28,614
-22.0
23,916
(29.708)
649.0
21.423
58.707
174.8
12,583
(2,184)
14,600
(22,491)
16.0
39,013
71.111
82.3
16,702 -51.2
(10.500)
4.977
(6.156)
10,312
(11.729)
107.2
39.182
27,014
21,960 -20.3
(23,612)
2,490
(1.748)
8.135
(7.622)
229.3
30.037
30.095
0.2
6,066
16.054
164.6
31.655
39,695
25.4
9.48
113.8
20.000
(18.330)
14.356
(6,852)
11.550
(3,818)
3,193
(2,554)
Total income
1983
%A
156.4
17,064 -23.6
(7,161)
7,800
(7,275)
1978
85.5
Natoong
Total
44
25.589
23.641
-7.6
%et of depreciation and opportunity cost of capital.
in parentheses are standard deviations from the mean.
b~igures
%A
: Percentage change between 1978 and 1983.
Source : Panayotou and Panayotou (1985) based on the 1978 and 1983 surveys.
-31.1
Table 6.5. Changes in fishing, non-fishing and total wage and resoume rents (average per household) between 1978 and 1983, in
selected dlages in the Muang District, Chumphon Province, Thailand.
Subdistrict1
village
on-fishinga
Fishing
wage (baht /man-day)
1978
1983
%A
Sample
size
wage (bahtlman-day
1978 1983
9bL
Average wage
1978 1983
%A
1978
"Rents"
1983
9A
Paknam
Village 2
Village 3
V i e4
Village 5
Village 7
Natoong
Village 3
Village 4
Total
4ncludes farming, hired labor, mining, retail trade, construction, etc.
Source : Panayotou and Panayotou (1985)based on the 1978 and 1983 surveys.
Table 6.6. Changes in fishing, non-fishing and total employment per household between 1978 and 1983 in selected villages in Chumphon Province, Thailand.
-
Subdistrict
village
Sample
size
-
-
-
-
-
-
-
Fishing
employment (man-days
1978
1983
96
h
Non-fishing
employment (man-days
1978
1983
9
6
6
Paknam
Village 2
Village 3
Village 4
Village 5
Village 7
Natoong
Village 3
Village 4
Total
a~igures
in parentheses are standard deviations from the mean.
%A
: Percentage change between 1978 and 1983.
Source : Panayotou and Panayotou (1985)based on the 1978 and 1983 surveys.
Total
employment (man-days
1978
1983
9
6
6
of the fishery and into other occupations. Geographic mobility, however, was considerably more
limited except for temporary outmigration of hired fishing labor to other southern provinces with
better employment opportunities (see Panayotou and Panayotou 1985).
Table 6.7 presents a comparative picture of income levels in 1978 and 1983 in another province, Phangnga on the Andaman Sea. The average fishing household income which was 26,500
bahtlyear in 1978 (compared to 25,600 in Chumphon) fell only slightly to 26,300 baht in 1983
which amounted to a decline of over 40% in real terms. Of the five sampled villages only one had
experienced a rise in real fishing incomes while three villages suffered a decline in both real and
nominal incomes. Non-fishing incomes have suffered a decline in all five villages averaging 53% in
nominal terms or 72% in real terms. As a result, the percentage of total household income derived
from fishing rose from 53 t o 71%. Total annual household income declined from 50,000 baht in
1978 to 37,000 baht in 1983, a 25% decline in nominal terms or a 54% decline in real terms.
The decline of fishing income in Phangnga was strictly the result of a reduction in fishing
employment rather than of the wage rate which rose 21% between 1978 and 1983 (Table 6.8). As
shown in Table 6.9 the number of man-days devoted to fishing was reduced by 19%implying either
a perverse response to the higher (nominal) fishing wages or the absence of money illusion since real
fishing wage dropped by 27%. Non-fishing employment was reduced even more, by 33%,in response
t o a 32% decline in the nominal non-fishing wage rate. This decline in the non-fishing wage rate was
largely due to the slump of the tin mining industry.
The average nominal wage rate from all activities of the sampled households remained unchanged between 1978 and 1983 but in real terms it fell by 40% "inducing" a 25% reduction in
labor supply by the household (Table 6.9). As a result of the rise in nominal fishing wages and the
steep decline of non-fishing wages, resource rents from fishing rose substantially, from 4 baht per
man-day in 1978 to 50 baht in 1983, although in one village they continued to be negative and in
another negligible. Again, labor mobility appears to be considerable but the response in Phangnga
Table 6.7. Changes in fishing, non-fishing and total incomes (average per household) between 1978 and 1983 in
sele-cted villages in the Muang District, Phangnga Province, Thailand.
Sample
size
Fishing income (baht)a
1978
1983
9% A
Non-fishing (baht)a
1978
1983
%A
Punyee
Village 1
5
Village 2
26
Village 3
17
Bangtae
Village 5
4
Village 6
21
Total
73
a ~ e of
t depreciation and opportunity cost of capital.
b~iguresin parentheses are standard deviations from the mean,
%A
: Percentage change between 1978 and 1983.
Source : Panayotou and Panayotou (1985) based on the 1978 and 1983 surveys.
Total income (baht)'
1978
1983
%A
Table 6.8. Changes in fishing, non-fishing and total wage rate and resource rents (average per household) between 1978 and 1983,in
selected villages in Muang District of Phangnga Province, Thailand.
Sample
size
1978
Fishing
1983
%A
Non-fishing
1978 1983
%A
Wage rate (baht /manday)
1978 1983
%A
"Rents" (baht /--day)
1978 1983
%A
myee
Village 1
Village 2
ViUage 3
Bangtae
Village 5
ViUage 6
Total
Source : Panayotou and Panayotou (1985)based on the 1978 and 1983 surveys.
Table 6.9. Changes in fishing, non-fishing and total employment per household between 1978 and 1983, selected
villages, Phangnga Province, Thailand.
Subdistrict/
village
Sample
size
Fishing
employment (man-days)
%A
1978
1983
Non-fishing
employment (man-days)
1978
1983
%A
Punyee
Village 1
Village 2
Village 3
Bangtae
Village 5
Village 6
Total
a ~ i g u r e in
s parentheses are standard deviations from the mean.
%A
: Percentage change between 1978 and 1983.
Source : Panayotou and Panayotou (1985) based o n the 1978 and 1983 surveys.
Total
employment (man-days)
1978
1983
%A
appears to be more to changes in real rather than nominal incomes. It is also of interest to note that
the large disparity of 18,400 baht between Chumphon and Phangnga in 1978 was reduced t o 2,400
baht in 1983.
In conclusion, the rents from fishing were dissipated in Chumphon and regenerated in Phangnga
not as much because of the change in the profitability of fishing (which in real terms declined in
both locations) as from the change in the profitability of non-fishing alternatives. This contrasts
with the large-scale trawl fishery where rents were dissipated mainly as a result of rising fuel costs
and depleted resource stocks and were regenerated through technological adjustments and expansion to new fishing grounds farther offshore. As we have seen earlier, small-scale fishermen lack
access to low-cost credit to upgrade their technology and, hence are confined to the relatively fixed
coastal fishing grounds. As a result, their incomes depend on the competition over these grounds
and the availability and profitability of non-fishing alternatives in the surrounding area. Unlike the
large-scale fishermen whose incomes rise in direct proportion with the rents from fishing, small-scale
fishermen's total income may decline with a rise in rents if the latter is more the result of a decline
in the profitability of their non-fishing employment rather than of an increase in the profitability of
fishing. Thus, rents and poverty are compatible, especially for small-scale fishermen whose opportunity costs are very low. A further decline may create rents from fishing but these are rents of
poverty not wealth; what should matter is the total real income not nominal increases of one source
"at the expense" of another.
CHAPTER 7
ECONOMIC ANALYSIS
To recapitulate, the calculation of revenues, cost and returns in Chapters 3 and 4 yielded the
following results: (1) the returns to fishing vary widely, among both large- and small-scale fishermen,
depending, in the first case, on size of vessel and type of gear and, in the second, on location and
type of gear; (2) the large-scale fishery is, on the average, far more profitable because of its resilience
to changing economic and biological conditions; (3) among the different vessel-classes the large
otter trawlers and small pair trawlers, being the most resilient groups, continued to be profitable
while the numerous small otter trawlers steadily lost ground to the point of negative returns in 1977;
and (4) small-scalefishermen combine a variety of fishing and non-fishing occupations to earn, on
the average, a subsistence income, somewhat lower than the average rural income in the country.
The economic theory of open-access resource exploitation (reviewed in Chapter 4) predicts
that: (1) in the absence of barriers to entry, resource rents (revenues in excess of the opportunity
cost of fishing inputs) would attract new entrants; and (2) entry, under static biological and economic conditions, tends to reduce and in the long run eliminate these rents allowing labor and
capital to earn no more than their opportunity costs. As a corollary, fishermen operating in regulated
fisheries are expected t o earn some rents if the latter are not taxed by the government. To what
extent is the described situation of the Thai fisheries in agreement with these predictions? Does
either the absence of rents in the small-scale fishery (despite the regulation of access to coastal
waters) or the long-term persistence of rents in the large-scale fishery (despite the open access status
of the noncoastal resources) constitute a refutation of economic theory? Are not 20 years of rapid
growth of the industry sufficient to deplete rents? Should not one at least observe a gradual decline
in these rents over time as effort expands?
The first point to be made is that the available information of a few points in time, some under
exceptional circumstances, does not suffice t o answer these questions conclusively. Second, the
tumultuous years under study (1960-1982) hardly fit the static world of unchanging economic and
biological conditions. Environmental parameters have been altered by rising pollution levels in the
Gulf of Thailand while fish resources expanded through a gradual shift to fishing grounds outside
the Thai waters. Fuel prices and labor costs have been rising dramatically inducing discrete changes
in technology. The catch per unit of effort may have been falling as a result of incessant entry
but fish prices have been rising under domestic population pressures and strong foreign demand.
These multiple shifts may have overshadowed any tendency towards dissipation of rents due to
entry as new rents were cxeated (or old ones dissipated) as a result of these developments.
For the trawl fishery, we have already, in Chapter 5, tested and failed t o reject the first prediction of the theory that rents would induce entry and losses exit by comparing the time profile of
registered vessels in each class given in Table 5.4 against that of the rent situation depicted in Table
5.6. Only in the case of small trawlers did we observe perverse behavior, entry following losses (e.g.,
otter trawlers during 1975-1977) and exit following rents (e.g., pair trawlers 1976-1979).
Unfortunately, there is no nationwide information on entry into and exit from the small-scale
fishery. However, based on our survey in two provinces we have concluded that there was considerable mobility between fishing and non-fishing occupations in response to income differentials
(profits and losses), as long as no change of location was involved. Geographic mobility was rather
limited. There was considerable outmigration to other districts and provinces where seasonal fishing
was more profitable but on a temporary basis (3-4 months/year). Permanent outmigration or immigration was more in response to social rather than economic factors, e.g., marriage and education.
The depletion of rents in the coastal fishery of Chumphon and their persistence under openaccess exploitation are not at odds with the theory. While access to coastal resources is 'regulated'
(for instance, trawling within 3 km from the shore is prohibited), rules and regulations have not
been enforced and where they were, their effect was simply to create a new group of rent-claimants
(the local enforcement officials) and hasten the dissipation of rents. Despite their mobility the
trawlers did not abandon the coastal waters altogether for a number of reasons: (a) the coast is rich
in shrimp and other high-value species; (b) coastal fishing by comparison with distant-water operations involves lower traveling and operating costs; and (c) the coast provides supplementary fishing
grounds for utilization of excess fishing capacity during seasons when offshore fishing is highly risky
or simply not possible. The escalation of fuel prices and shortages coupled with the increased abundance of certain coastal species, especially crustaceans, often induces increasing coastal activity by
trawlers as is evidenced by the increasing frequency of conflicts with coastal fishermen (see Bangkok Post 1979a, 197913).
One of the anonymous reviewers of the present study commented that it has been observed
that while the Penaeus stocks have decreased in abundance in the Gulf of Thailand, Metapenaeus
stocks have increased and that the baby trawlers and push nets have benefited to some extent.
Unable to extend their fishing range and expand 'seaward', and with their limited fishing
grounds being encroached by trawlers, the coastal fishermen often seek supplementary sources of
income 'landward' which, however, are hard to obtain without initial capital. Inability to convert
fixed fishing assets to non-fishing capital, as well as educational or emotional attachment t o the
fishery often result in short-run deviations of incomes from opportunity costs. What appears as
a continual drift of fishing incomes is a reflection of declining opportunity costs due to increasing
unemployment and landlessness outside the fishery. Unlike the legendsry open-access fishermen
who regard resource rents as part of the remuneration for their productive services, it may be said
that coastal fishermen in Thailand came to regard everything they might get out of the fishery as
'rent'.
In contrast, the large-scale fishery, because of its mobility, even to areas far outside Thai
coastal waters, and ability to continuously upgrade its technology, managed t o maintain and even
expand its rent earning position despite the incessant entry into the fishery. The economic theory
of rent dissipation in openaccess resource exploitation holds over a well-defined, limited resource
and under static conditions. In the case of the Thai large-scale fishery, technological progress and
the opening of new fishing grounds proceeded fast enough to more than offset the effect of entry
on resource rents. As coastal fishing grounds became increasingly crowded, catch declined, and cost
rose, the large-scale fishery was able to upgrade its technology thus lowering the travel and operation cost of distant-water fishing so that new rents were created farther and farther away from the
coast.
With ample rents for reinvestment (not to mention the easy credit) and with the government
unwilling or unable to intervene, the Thai trawling fleet moved into both the open sea and the
lightly fished and lightly guarded fishing grounds of neighboring countries establishing,in retrospect,
historical fishing rights over much of the Bay of Bengal and the South China Sea. Given the extent
of these new fishing grounds and the absence of competing large-scale fisheries (with the possible
exception of Taiwan), the continuing entry on the part of Thailand alone is not likely to dissipate
the rents in distant-water fishing as long as technological progress continues t o keep costs down and
growing demand maintains the upward trend of fish prices.
The vulnerability of these rents to general economic conditions, as well as the fishing industry's
ability to make the necessary technological adjustments to cope with them, has been aptly demonstrated during the energy crisis of the early 1970s. While after a 138%rise in fuel prices between
July 1973 and February 1974,virtually all vessel groups (except for the very large trawlers) incurred
losses or just broke even, three years later, in 1977, virtually all (with the exception of small-scale
trawlers) were making substantial profits despite a new fuel price increase of 13%in March 1977.
In conclusion, it could be said that the inshore fishery, as far as the small-scale fishermen and
small and medium otter trawlers (less than 18 m) are concerned, is overexploited in the economic
sense of rent dissipation even if temporary rents are occasionally recreated by the depression of
non-fishing activities (e.g., tin mining) in remote fishing communities. This eventuality, however, is
not yet in sight for larger vessels with an ever-expanding fishing range that already stretches from
the Thai coast though the Andaman and South China Seas to the coasts of India, China and Indonesia. The large-scale fishery will continue to enjoy healthy rents regardless of the economic conditions in the rest of the economy as long as neighboring countries lack the capability to enforce
respect of their Exclusive Economic Zones (EEZs). Fish and fuel price fluctuations may affect
temporarily the profitability of the industry but not its long-term viability. What threatens the longterm viability of the fishing industry in Thailand, as we know it, is the increasing capability of
neighboring countries to both police and exploit their EEZs and Thailand's growing concern over its
relations with its neighbors who resent the encroachment on their fishing grounds and its international image. Unless Thailand succeeds in negotiating increasing numbers of joint ventures and other
long-term arrangements with other countries, the Thai fleet sooner or later will have to retreat into
Thai waters, and its long-term viability will be determined by the state of the Thai fishery resources.
CHAPTER 8
THE STATE OF THE RESOURCES
Before considering the prospects of the fishery (Chapter 9), it is necessary to examine the
state of the Thai fishery resources on which the future of the industry inevitably depends. A given
fish stock is said to be biologically overfished (underfished) if the annual catch exceeds (falls short
of) the maximum sustainable yield (MSY) or maximum net natural growth. The latter depends on
environmental conditions, such as food availability, temperature, salinity, currents, as well as the
biological traits of and interaction among the species of which the stock is composed. While economic underexploitation (operation of a fishery below the level that maximizes rents) precludes
biological overfishing, rent dissipation does not necessarily imply biological overfishing nor does the
presence of rents preclude it (Fig. 5.1). It is, therefore, of interest to examine whether the fishery
resources have been optimally exploited in both the biological and economic sense.
Earlier biological evidence (SCS 1973a) indicates that the inshore (< 50 m deep) zone of the
Gulf of Thailand has been overfished since 1966-1967 with the 1970s catch being 605,000 t compared to an MSY of only 447,000 t. The reverse was true of the offshore zone (50-500 m deep)
where only 49,000 t were caught out of an MSY of 164,000 t. The inshore catches of the early
1970s did not involve biological overfishing by comparison with the new estimates of MSY. However, by 1973 the inshore catch reached 803,000 t which is indicative of overfishing not only when
compared to the MSY but also when the declining catches in subsequent years are considered
(although economic factors such as the oil crisis are at least partly responsible for the fall in catches
during 1974-1975). Further, it has been estimated that the 1972 level of 6.7 x lo6 standard (research
ves'sel),fishing hours would have sufficed to catch the MSY while actual fishing effort exceeded 8.5
x lo6 hours in 1973 and continued to exceed 7.5 x lo6 hours in 1975 (Table 8.1). The SCS (1978b)
results have been corroborated by further reestimations (Boonyubol and Hongskul1976 and 1977;
Pauly 1979; Boonyubol1979) the most recent of which employed 1961-1977 data to arrive at an
MSY of 685,684 t per annum and a corresponding optimal effort of 6.4 x lo6 standard fishing
hours. The demersal catch in 1977 reached 875,360 t with a fishing effort of 9.6 x lo6 standard
hours.
As for the offshore resources of the Gulf, the earlier (SCS 1973a) result that they are biologically underfished has been corroborated by the newer SCS (197813) study as only 28,000 t were
caught in 1972 and 61,000 t in 1975 compared to the estimated MSY of 127,000 t (Table 8.1) although the latter estimate is considerably below the 1973 estimate of 164,000 t. Finally, in the
Straits of Malacca (including the relevant portions of the Andaman Sea), the combined catch of
about 428,000 t was judged approximately equal to the estimated MSY of the area as a whole. A
similar study (SCS 1973b) of the pelagic resources infe&ed from fragmentary evidence that some
pelagic species such as the Indo-Pacific mackerel were underfished at.the time.
Three subsequent studies (SCS 1976,1978aY1978b) based on longer time series of catch and
effort by commercial and research vessels, with appropriate adjustments for catches outside the
Thai waters, have produced a more complete and, hopefully, more accurate
fish resources. Their results, with some ramifications, are summarized in
fish resources of Thailand extending over an area of 350,000 km2 are found to total a virgin biomass (in the absence of fishing) of 1,810,000 t with a mean density of 5.2 t/km2. More than twothirds of this biomass is contributed by the 179,000 km2 of the inshore (< 50 m deep) zone of the
45
Table 8.1. The demersal and pelagic fish resources of Thailand.
Demersal fish resources
Gulf of Thailand
Andaman
< 50 m deep > 50 m deep
Sea
Total
Pelagic fish resources
Gulf of
Andaman
Thailand
Sea
Area (km2)
Mean density
(t/km2
Virgin biomass, B,, (t)
Maximum sustainable
yield, MSY (t)
Effort for MSY (hr)a
Peak catch
- Year (up to
1975)
- Catch (t)
- Effort (hr)
Peak effort
- Year
- Catch ( t )
- Effort (hr)
aIn standard research-vessel fishing hours unless otherwise stated.
b~alculatedfrom the corresponding MSY by assuming the same relationship as in the Gulf of Thailand (50 rn
deep, i.e., MSYIB, = 0.482).
'Calculated from the corresponding MSY by assuming the same relationship between MSY and needed effort as
in the Gulf of Thailand ( < 50 m deep, i.e., 96.2 kg/hr).
Sources: SCS (1976, 1978a); Menasveta et al. (1973) and Bahtia et al. (1983) for the pelagic resources of the Gulf
of Thailand and the Andaman Sea, respectively.
Gulf which has mean density of 7.4 t of fish/km2 compared to 2.1 t/km2 of the offshore zone, and
4.9 t/km2 of the Andaman Coast.
In terms of MSY, these studies estimated that 641,000 t could be caught on a sustained basis
from the inshore zone of the Gulf, 127,000 t from the offshore zone and about 200,000 t from the
Andaman Sea. Thus, earlier studies may have underestimated the potential catch from the inshore
zone. The SCS (1978b) MSY estimate of 200,000 t for the demersal resources of the Thai portion
of the Andaman Sea indicates that some overfishing incurred as early as 1969 when 216,000 t were
landed. In contrast, the pelagic resources as appraised by SCS (1976) and SCS (1978a) continue to
be underexploited especially those of the Gulf's East Coast and of the Andaman Sea (see Table 8.1).
Related indications of the advancing depletion of the demersal resources in the Gulf of Thailand have been the rapidity with which the catch per unit of effor't (CPUE) fell and the composition
of catch changed since the introduction of trawlers. Table 8.2 and Fig. 8.1 show that the catch per
hour of the research vessel Pramong 11, operating in the Gulf of Thailand fell steeply during the
1961-1966 period of massive entry of trawlers (interval B in the figure). It levelled off when entry
was halted and fishing into international waters began during 1966-1969 (interval C) and declined
sharply again during the rapid entry of 1969-1972 (interval D). The exit of vessels following the
1973-1974 oil crisis halted further declines in CPUE until 1977. The precipitous rise in the number
of trawlers in 1976 and 1977 precipitated no more declines in CPUE as the fleet did not exceed its
peak 1973 size until some time in mid-1977. Moreover, at least some of the new vessels, especially
the larger ones, were directed towards distant-water fishing grounds. The catch per hour of the
research vessel in 1977 was only 16% of its 1961 volume (obtained with the use of a commercial
trawler), and in 1982 dropped to 13% (see Table 8.2).
A marked change in the composition of catch towards a greater percentage of trash fish and a
smaller percentage of edible fish as well as larger percentage of cephalopods (squid, cuttlefish and
octopus) among the latter may be indicative of past (and present) overfishing of the edible species if
Table 8.2. Demersal catch, catch per unit of effort and comparison of proportion of trash fish between commercial
fleet and research vessel (Pramong 11), Gulf of Thailand, 1960-1982.
Commercial catch
Total
Trash fish
(%I
(t)
Year
n.a.
=
Pramong I1 research vessel
Average catch
Edible fish
Trash fish
(kglhr)
(n)
('%I
not available.
'For 1962.
b~reliminarydata.
Source : Boonyubol and Pramokchutima (1979) and Phasuk (1978). The proportion of trash fish in the cornrnercial catch was obtained by dividing the commercial catch by the sum of quantities of fish used for
fishmeal, fertilizer, fish sauce and 'other' as recorded in the Fisheries Record of Thailand, Table 2.
11,250
-
1,500r
10,500 -
350 -
@I
1,300 -
300-
1,200-
9,7509,000 -
4,500 -
0
150 -
I00 -
2,250 1,500-
600 500 -
3,750 3,000 -
+
No. trawlers
400 300 -
50-
200-
1958
60
62
64
66
68
70
72
74
76
78
80
82
Year
Fig. 8.1. Time trends in the number of trawlers, catch per hour and total dernersal catch in the Gulf of
Thailand, 1958-1982.
not of the total biomass as well. The results of the research vessel surveys underestimate the proportion of trash fish in the total catch and distort its time trend because of the larger and fixed (4 cm)
cod-end mesh size of the trawler net used by the research vessel compared to the variable, less than
2.5 cm mesh size of the commercial trawlers. The latter is sensitive to economic parameters such as
the prices of fish and fuel and hence the proportion of trash fish (consisting of the juveniles of
edible fish and smaller non-edible species) may change independently of biological parameters and
in turn effect a change in them. In 1977, the proportion of trash fish in the research vessel catch
was only 29% compared to 47% for the commercial fleet as a whole (Table 8.2) and 63% for the
commercial trawlers (see Table 5.3).
Table 8.2 presents conflicting time trends in the proportion of trash fish in the total catch
from research and commercial vessels (due partly to different definitions of trash fish), but, on
balance, the evidence suggests an increasing trend up to 1974 and a rather ambiguous trend thereafter. The most pronounced changes among vessel classes were the decrease in the proportion of
trash fish among large otter board trawlers from 71% in 1974 to 60% in 1977 and the increase for
the small pair trawlers from 56% in 1974 to 87% in 1977 (see Table 5.5 and DOF 1979a). Incidentally, these two classes fared best in terms of return during 1977 (see Table 5.6) for different but
not dissimilar reasons. Both were exploiting a new resource: the former, new fishing grounds
outside the Thai waters; the latter, the booming stocks of squid and cuttlefish. It is, however,
difficult to ascertain to what extent the changes in the composition of the catch were the result of
changes in the composition of the stocks due to overfishing and/or expansion into new fishing
grounds and to what extent they were the result of a deliberate choice by fishermen to discard more
(or less) trash fish at sea.
The latter development is part of an ongoing process of changing relative abundance of individual fish populations within the multispecies fisheries of the Gulf of Thailand under the ecological
impact of small meshes and intense fishing effort. Marr et al. (1976) reported that striking changes
occurred between 1963 and 1972 in the number and identity of the dominant species or groups of
species in the catch from the Gulf of Thailand: catfish, rays and slipmouth fell from 9.21,12.66
and 34.41% of the catch, respectively to 1.51,0.94 and 6.60%, while jacks, lizard fish and threadfin bream rose from 2.60,1.56 and 4.44%, respectively to 7.02, 7.14 and 7.86%. Even more spectacular was the increase in the percentage of squid itom less than 1% in 1963 to over 27% in 1972
(Marr et al. 1976). An even more dramatic upsurge in the stocks of squid and other cephalopods has
been observed which resulted in an almost doubling of their catch between 1976 and 1977 (DOF,
1977). Such developments not only are indicative of overfishing of the predators and/or competitors
of the 'booming' species, but may also render overly optimistic the estimates of MSY based on
'overall biomass/overall effort' data which ignore the between-species interactions as Pauly (1979)
convincingly argued on the basis of evidence from the Gulf of Thailand.
While estimates of MSY based on aggregate biomass are less than satisfactory in the case of
multispecies tropical fisheries, a more appropriate model is lacking for estimating the potential and
evaluating the current state of the resources. Pauly (1979) and Panayotou (1982) proposed sonie
alternatives which are not yet sufficiently operational to be used in this study. We will instead, use
the conventional approach of estimating MSY for the tstal biomass of the Gulf of.Thailand. This
approach admittedly ignores interspecies interaction. This is to update earlier estimates of MSY in
the light of more recent observations.
A Schaefer-type sustainable yield function was used to obtain estimates of the MSY for two
different mesh sizes, 2.5 cm and 4 cm, using 1963-1982 data. Two alternative mesh sizes are used to
account for the difference in mesh size between the commercial fleet (2.5 cm) and the research
vessel (4 cm), since the catch data come from the commercial fleet while the catch per unit of effort
data come from the research vessel. The estimated equation is a parabolic function of the form:
where Y is catch and E is standardized fishing effort, while a and b are parameters to be estimated.
Estimations for the two mesh sizes were derived by first dividing equation (1) by effort to
,
obtain the catch per unit of effort (CPUE) as a function of effort and using the CPUE of the research vessel to standardize commercial vessel effort. We then regressed CPUE on standardized
effort to obtain estimates of the parameters a and b. The following results were obtained for mesh
sizes of 4 cm and 2.5 cm, respectively.
R2 = 0.95,
F = 382,
D.W. = 1.66,
N
R2 = 0.96,
F = 3.99,
D.W. = 2.64,
df
=
20
=
20
where E~is the coefficient of determination adjusted for degrees of freedom, F is the F-ratio, D.W.
is the Durbin-Watson statistic for autocorrelation, and df are degrees of freedom. The figures in
parentheses are t-ratios. Based on these statistics the fit of the model is very good: one variable, E,
and its square explain over 95% of the annual variation in the catch. All coefficients are statistically
significant at the 0.01 level and the D.W. statistic indicates absence of autocorrelation. Based on
these estimates we have calculated the maximum sustainable yield and the corresponding level of
effort using equations (6) and (5) of our theoretical framework (Chapter 4), i.e., MSY = a2/4b and
EMSY= a/2b, where a and b are the coefficients of the estimated sustainable yield function above.
The results are reported and compared with the 1982 levels of catch and effort in Table 8.3.
The maximum sustainable yield of the demersal fishery of the Gulf of Thailand is found to
range between 796,000 and 958,000 t depending on the mesh size used. The MSY level of effort
ranges between 15.7 and 20.6 x lo6 standard hours, depending on the,mesh size used. The actual
catch and effort in 1982 were, respectively, 1,000 t and between 19.2 and 25.6 x lo6 hours (depending on mesh size). Therefore, the demersal fishery resources of the Gulf of Thailand do appear
to-be biologically overexploited in the sense of catch and/or effort exceeding significantly their
MSY 'levels.
Table 8.3. The maximum sustainable yield (MSY) of the demersal fishery of the Gulf of Thailand and corresponding
effort at different mesh sizes based on 1963-1982data and compared to the 1982 situation.
Mesh size
Maximum sustainable yield
Catch
Effort
(St hr x lo6 )a
(t x lo3)
Catch
(t x lo3)
1982 situation
Effort
(St hr x 1 0 ~ ) ~
illio ion standard hours.
This result corroborates the findings of earlier studies which, as we have seen, have found that
the Gulf of Thailand has been overexploited since 1972 when the catch was 738,000 t compared
with the estimated MSY of 641,000 t. The catch today is 36% higher than in 1972 but also our
estimate of MSY is almost 50% higher than earlier estimates. This upward revision of MSY which
has been done repeatedly as new data became available, casts doubts on the reliability of MSY
estimates and the usefulness of the concept of MSY for fisheries management. This is an area which
calls for further research to arrive at a more suitable model for multispecies fisheries with interspecies interaction,
The discussion thus far has focused on the demersal resources. However, the pelagic resources,
which contribute about 20% of the catch, suffer from more or less the same level of overexploitation, at least in the Gulf. The rapid increase of the pelagic catch during 1971-1977 and its steady
decline thereafter (Table 5.8) despite the continued rise in effective effort suggests that the pelagic
resources of the Gulf of Thailand are overexploited, and this could be due to a large extent to their
vulnerability to fish attraction devices such as the luring purse seines. In contrast, the pelagic fishery
resources of the Andaman Sea are believed to be underexploited (Bhatia et al. 1983) although
the pelagic catch shows a downward trend as well as wide fluctuations. Menasveta et al. (1973) has
estimated the maximum sustainable yield (MSY) of the pelagic resources of the Gulf of Thailand
to be 365,000 tlyear compared to a 1977 catch of 476,000 t and a 1980 catch of 286,000 t.
Bhatia et al. (1983) estimated the MSY of pelagic fish and squid of the Andaman Sea at 71,000
t/year compared to a 1973 catch of 57,000 t and a 1981 catch of only 14,000 t (see Table 8.1).
Since the Thai trawl fishery is not confined to the Gulf of Thailand (and the Andaman Sea)
but operates in the Bay of Bengal-andthe South China Sea, among other areas, it is of interest to
present a brief account of the state of the resources in these areas. Tables 8.4,8.5 and 8.6 present
rough estimates of the density, standing stock and mid-1970s landings of both demand and pelagic
stocks in the Bay of Bengal and the South China Sea by area including the Gulf of Thailand. Again,
these figures are likely to be underestimates and should be regarded with caution. They give, however, a rough picture of the relative abundance of the fish stocks in the areas where much of the
Thai fishing industry has been operating since the early 1970s and continues to operate today.
Table 8.4. Fish stocks off Burma and in the Bay of Bengal (above 2 0 ' ~ ) .
Subarea
Area
(km2 x l o 3 )
Burma Coast
250
Density
(t/km2
Standing
stock
(t x l o 3 )
Landing
( t x lo3)
Potential
Present
Index of
fishery
expansion
Pelagic
Demersal
Bay of Bengal
105
Pelagic
Demersal
Source : Hunting Technical Services Limited (1974).
Table 8.5. Demersal fish stocks in the South China Sea.
Standing stock ( t x l o 3 )
Subarea
Areaa
(km2 x lo3 )
Density
(t/km2
Maximum
Optimum
Potential
catch
Northern Sunda Shelf
Central Sunda Shelf
Gulf of Thailand
Southern Sunda Shelf
Eastern Sunda Shelf
Kalimantan Strait
Total potential catch
Present catch
Index of fishery expansion
aWaters < 200-m deep.
Source : Shindo (1973).
2,042
1,308
1.56
Table 8.6. Pelagic fish stocks in the South China Sea.
Subarea
Area
(km2 x lo3 )
Density
(t/km2)
Off Mekong Delta
Gulf of Thailand
East coast of West
Malaysia
West coast of West
Malaysia
Sarawak Bay
Kalimantan Strait
East Sarawak and
Sabah
Central Basin
Total potential
catch
Present catch
Index of fishery
expansion
Source : Huntings Technical Services Limited (1974).
Standing
stock
(t lo3 )
Catch
(t x lo3)
Potential
Present
Index of
fishery
expansion
CHAPTER 9
OPTIMAL RESOURCE USE
Having already described the economics of the Thai fishing industry (Chapters 5-7) and the
state of Thai fishery resources (Chapter 8), it is appropriate now t o combine the two within an
optimizing framework to determine the optimum resource use which should be the objective of
fisheries management. Such an optimizing framework was provided in Chapter 4. The optimal
resource use was postulated to be attained at the level of catch and effort that maximize the (sustainable) economic yield (MEY) or rents from the fishery, that is, the excess of revenues over costs.
Of course it is always possible to increase current economic rents (profits) beyond this level but, in
the same way that catch above MSY cannot be sustained for long, profits above MEY cannot be
sustained for long. Thus, abstracting from adjustment and enforcement costs which could be
substantial, fisheries management should aim at the attainment of MEY level of effort as it can be
shown to be superior t o all other levels of effort, including MSY and open access, in terms of
returns to a resource in limited supply. The purpose of this chapter is to determine MEY for the
Gulf of Thailand and the corresponding levels of effort, catch, revenues, costs and profits and compare them to those prevailing under open access and MSY management. Following our theoretical
framework we d o this estimation both under fixed and variable price assumptions.
Fixed Price Model
Recall that the level of effort yielding the maximum economic yield, EMEY was given in
equation (10) of Chapter 4 as:
where p is the price of fish per kilogram, c is the cost per unit of effort and a and b are the parameters of the sustainable yield function. The 1982 values for p and c have been estimated in Chapter
5 : p = 6.2 baht/kg or 6,200 baht per tonne and c = 183 baht per standard fishing hour (for mesh
size of 4 cm). The values of the parameters a and b were estimated in Chapter 8 : a = 77.1 and b =
1.868 (for mesh size of 4 cm). A note of caution is in order. The validity of the results which follow
rest squarely on the robustness of these parameters and the validity of the surplus production
model (on which they are based) for multispecies fisheries. Substituting these values into the equation above we obtain: EMEY= 12.8 x lo6 standard hours with a mesh size of 4 cm. The corresponding catch is obtained by substituting the value of EMEY in equation (3) of Chapter 4 t o obtain:
To obtain MEY itself, that is maximum total profit or rents, we apply equation (11) (Chapter
4) which gives MEY as a function of EMEY:
MEY
= aEMEy - b
=
~
1,880 baht x
- cEMEY
&
~
~
lo6
These results are compared in Table 9.1 with the corresponding actual 1982 figures, and the
estimated MSY and open-access figures. The MEY level of effort is about one-half the actual 1982
level and 62% of the MSY level. The MEY catch is 68% of the actual catch and 86% of the MSY
catch. Profits are, as expected, highest at MEY amounting to 1,880 million baht or 24% higher than
actual and 61% higher than at MSY. According to these findings, MEY management will earn the
industry and the country an additional 365 million baht in profits, gross of management costs. If the
fishery is left unmanaged, it is expected to reach a bionomic equilibrium (i.e., zero profits) at 25.5 x
lo6 standard hours with a sustainable catch of 752,000 t, and society would lose 1,880 million baht
in resource rents.
Table 9.1. Comparison of catch, revenues, costs and profits at different levels of effort based on a fixed price model,
4-cm mesh size and 1963-1982data, Gulf of Thailand.
Effort
(St hr x 1 0 ~ ) ~
Actual (1982)
MSY
MEY
Bionomic equilibrium
25.6
20.6
12.8
25.5
Catch
( t lo3)
1,000
796
681
752
Revenues
(bl x lo6)
Costs
(P x lo6)
6,200
4,935
4,222
4,662
4,685
3,770
2,342
4,662
Profits
(@x
w6
1,515
1,165
1,880
0
'Million standard hours.
Based on 1982 data, the industry appears to put forth the bionomic equilibrium (BE) level of
effort but the catch is higher than the BE level of catch by 250,000 t and substantial profits are
earned, which implies that the fishery is operating on a short-run production curve (Fig. 9.1); that
is, the current catch and profits are derived from liquidation of part of the stock and, therefore,
they are not sustainable over the long run. Whether this is actually the case remains to be seen and
depends on: (a) the assumptions of 4 cm mesh size and fixed price and (b) the validity of the
aggregate biomass model for multispecies fisheries.
Let us first investigate the sensitivity of our results to the specific mesh size we have assumed,
which is the one used by the research vessel rather than the actual mesh size of the commercial
fleet. We follow the same procedure to obtain EMEY,YMEYand MEY for the commercial mesh size
of 2.5 cm. The parameters used are: P = 6,200 baht per tonne, c = 244 baht per standard fishing
hour (adjusted for 2.5 cm mesh size), a = 122.4 and b = 3.914 (for the latter two parameters see
equation (3), Chapter 8). The values obtained are EMEY = 10.4 x lo6 standard hours, YMEY=
847,000 t and MEY = 2,7 13 million baht. The results are compared with the corresponding actual
1982 figures, and the estimated MSY and open access figures in Table 9.2. Again, the MEY level of
effort is about 50% of the actual level of effort in 1982 which is only 10% lower than the openaccess equilibrium level where all profits are dissipated. Catch at MEY is only 15% lower than the
actual catch but profits are 80% higher. By comparison with the MSY, the MEY catch is 12% lower
and the corresponding effort 34% lower, and profits 29% higher. If the fishery is left unmanaged, it
is expected to reach a bionomic equilibrium at about the same sustainable catch as MEY but with
Irt -run production
j revenue function
,
'7 i
0
12.8
20.6
I)
Non-sustainable catch
/TC=CE
Sustainable revenue
function
T R = PY
i
I
I
25.5
Effort
Fig. 9.1. Fixed price model applied to the Gulf of Thailand fishery (PI9,, = 86.20/kg,
mesh size = 4 cm). TC = total cost; c = average cost; E = effort; TR = total revenue; P =
price of fish; Y = annual catch; MSY = maximum sustainable yield; MEY = maximum
economic yield; BE = open access bionomic equilibrium.
Table 9.2. Comparison of catch, revenues, costs and profits at different levels of effort based on a Tied price model,
2.5-cm mesh size and 1963-1982 data, Gulf of Thailand.
-
Actual (1982)
MSY
MEY
Bionomic equilibrium
-
-
Effort
(St hr x lo6 )'
Catch
(t x l o 3 )
19.2
15.7
10.4
21.2
1,000
958
847
836
-
Revenues
Costs
(Ix lo6
(Ix lo6
6,200
5,940
5,251
5,183
4,685
3,831
2,538
5,183
Profits
(Ix lo6 1
1,515
2,109
2,713
0
'Million standard hours.
more than twice as much effort; the potential loss from this excessive effort would be about 2,713
million baht (Fig. 9.2).
A comparison between the results of the two mesh sizes indicates the following: (a) a larger
resource becomes accessible with the smaller mesh size as indicated by the 20% higher MSY in the
case of the commercial mesh size; (b) as a consequence, the unsustainable portion of current catch
is reduced from 250,000 t to 93,000 t ; and (c) the MEY level of catch with 2.5 cm mesh size is 24%
higher than with 4 cm mesh size and profits are 44% higher. To the extent that these gains from the
finer mesh size are sustainable, there is no reason why it should not be used. However, since our
model ignores interspecies interactions there is always the danger that the implied gains from a finer
mesh size would prove to be unsustainable if the ecological balance is thereby disturbed. Most
biologists would predict an increase in the availability of more valuable species if a larger mesh size
were used (see also Pauly 1979 and Panayotou 1982). Hence, there is a need for more sophisticated
models t o account for such interactions.
Effort
Fig. 9.2. Fixed price model applied to the Gulf of Thailand fishery
86.20/kg, mesh size = 2.5 cm). See Fig. 9.1 for abbreviations.
=
The Variable Price Model
The fixed price model just discussed is appropriate only when the fishery concerned accounts
for €00 small a share of the market for variations in catch t o affect fish prices. Otherwise, a variable
price model should be used. The case with the Gulf of Thailand is not so clear-cut. While the Gulf of
Thailand accounts for a very small share of the world fish market where part of the Thai catch is
sold, the catch from Gulf accounts for over 50%of the domestic market which includes the market
for trash fish. Therefore, although the variation in the Gulf catch is unlikely to affect world prices,
it is likely t o have some effect on the domestic fish prices since the link between the two markets is
not a strong one except in the case of major export species such as crustaceans, cephalopods and
molluscs. Thus, we estimate MEY and other factors with a variable model as well.
In order to apply the variable price model developed in Chapter 4, it is necessary to estimate
first a demand function for fish which expresses quantity demanded as a function of price, the
prices of substitute products and the consumers income. Alternatively, price may be expressed as a
function of quantity, substitute prices and incomes. We estimated both linear and log-linear functions and selected the latter as it fits the data best, though the price of substitute products was
statistically insignificant in both functions and was dropped. The estimated log-linear model with
1971-1982price (P), quantity (Y) and real income ( 2 ) data is as follows:
E2 = .92
F = 64.8
D.W.
=
1.12
N
= 12
Equation (3) may then be reduced t o a price-quantity relationship by substituting the relevant
value of Z; in our case, the 1982 real income level of Thailand, since we will be comparing our
results t o the 1982 figures. Following this substitution, the reduced form of equation (3) becomes:
From equation (4) we derive the total revenue (TR), average revenue (AR), and marginal revenue
(MR) functions as follows:
To obtain MEY we also need cost (AC) and marginal cost (MC) functions, which are given by
equations (16) and (17) of Chapter 4. Assuming a 4 cm mesh size and using the corresponding cost
and sustainable-yield-function parameters we obtain:
We may now proceed t o estimate the level of effort which maximizes social benefits (MEY) by
setting P = MC as described in Chapter 4. Similarly we obtain the bionomic equilibrium where all
profits are dissipated by setting AR = AC. Finally, the monopoly position where profits are maximized is obtained where MR = MC. The results are reported and compared in Table 9.3 and Fig. 9.3.
Catch ( t x
lo3
Fig. 9.3. Variable price model applied to the Gulf of Thailand fishery
(mesh size = 4 cm).
Table 9.3. Comparison of annual catch, revenues, costs and profits in million baht at different levels of effort bared
on a variable price model, 4-cm mesh size and 1963-1982data, Gulf of Thailand.
Effort
(St hr x lo6 )'
Catch
(t x lo3 )
25.6
20.6
15.6
37.0
10.4
1,000
796
Actual (1982)
MSY
MEY
Bionomic equilibrium
Monopoly
750
530
600
Revenues
Casts
6,200
7,133
6,900
5,963
6,300
4,685
3,770
2,855
5,963
1,903
Profits
Consumer
surplus
Total
benefit
'Million standard hours.
The level of effort that yields the maximum economic yield with a variable price is found to be
15.6 x lo6 standard hours, compared with the 1982 figure of 25.6 x lo6 hours and the bionomic
equilibrium (BE) at 37 x lo6 hours. The MEY level of catch is 750,000 t compared to the 1982
figure of 1x lo6 t , the MSY of 796,000 t and the BE of 530,000 t. Profits at MEY are more than
2.5 times the 1982 level of profits and 20% higher than at MSY. The Thai society stands t o lose
4,045 million baht per annum in profits alone by letting its fishery gravitate unmanaged towards
a bionomic equilibrium.
The results of the variable price model differ from those of the fixed model (Table 9.1) in that
the MEY catch and effort levels are higher by 1 0 and 22%, respectively. This is so because the
variable price model permits the price to rise as the catch is reduced below the current level t o the
25% lower MEY level. The higher price shifts the sustainable revenue function upwards justifying
additional effort of 2.8 x lo6 hours. Correspondingly the profits at MEY are more than twice as
high under the variable than under the fixed price model because of the higher catch and higher
price compared to only a modest increase in fishing costs.
Another difference between the fixed and the variable model is what constitutes maximum
rents or MEY. Under the former, MEY is identical to maximum profits. Under the latter, MEY
includes both profits which benefit the producer if not taxed away and consumer surplus which
benefits the consumer. (Consumer surplus is the difference between what the consumer is willing to
pay and what he actually pays). Thus, MEY is best understood as maximum social benefit and
occurs at a level of effort higher than the level at which maximum profit is obtained. The maximum
profit under the variable model is the monopoly solution.
In Table 9.3 the maximum social benefit of 12,877 million baht is at P = MC or MEY, not at
MR = MC which is the monopolist's decision rule. True, monopoly generates more profits but part
of these profits are not resource rents due t o genuine resource scarcity but monopoly rents due t o
artificial scarcity created by the monopolist by withholding supplies (with catch of only 600,000 t )
and, therefore, by reducing consumer surplus. However, the difference in social benefits between
MEY, MSY and the monopoly solution are so small by comparison t o their bioeconomic equilibrium
level that operation of the fishery at any of these three points would be a great improvement over
the bionomic eventuality.
Using the same procedure we estimate the MEY levels of catch, effort and profits for the commercial mesh size of 2.5 cm, and compare the results t o the corresponding 1982 MSY and openaccess figures in Table 9.4 and Fig. 9.4. The MEY level of effort is 40% lower, the catch 10% lower
and profits 300% higher than the corresponding 1982 figures. As in earlier models, effort is lowest
and profits highest at MEY; the reverse is true at the bionomic equilibrium. The catch at MEY is
only slightly lower but effort is substantially lower and profits higher than at MSY.
By comparison to our earlier models, the variable price model with commercial mesh size
indicates (for 1982) the least economic overfishing (deviation from MEY) in terms of catch and the
most in terms of profits. According t o this model, which is more realistic than the previous three, in
1982 the Gulf of Thailand fishery incurred a "loss" of 3,136 million baht by not operating at the
MEY level of effort. This loss can be avoided by foregoing 100,000 t of catch, thereby raising the
price of the remaining 900,000 t from 6.20 baht/kg t o 8.08 baht/kg, increasing total receipts by
1,331million baht, and at the same time saving 7.4 x 10" hours of excess effort costing the industry and the country 1,805 million baht. However, given the open-access status of the Gulf of
Thailand, the individual fisherman has no incentive t o reduce effort. What is more likely is that
effort will continue t o expand until all remaining profits are completely dissipated and the fishery
comes t o a rest at a bionomic equilibrium with 2.5 times the optimal level of effort, unless new
external shocks (such as changes in technology and/or input costs and shifts in demand) disturb the
process by creating new, short-term disequilibrium rents (or losses).
The total rents at MEY, which include both profits and consumer surplus, amount to 14,173
million baht, 23% higher than the actual level or 78% higher than the eventual bionomic equilibrium.
(MSYmanagement and monopoly give almost the same level of total benefit of about 13,700 million baht). The social loss from not operating at MEY was 1,386 million baht in 1982 and is expected
t o rise to 4,236 million baht per annum (under the 1982 bioeconomic parameters), if the fishery is
allowed t o reach an open-access bionomic equilibrium.
Table 9.4. Comparison of annual catch, revenues, costs and profits in million baht at different levels of effort based
on a variable price model, 2.5-cm mesh size and 1963-1982 data, Gulf of Thailand.
Effort
(St hr x l o 6 ) *
Catch
(t x l o 3 )
Revenues
Costs
Profits
Consumer
surplus
19.2
15.7
11.8
25.8
8.2
1,000
958
900
600
740
6,200
7,741
7,531
6,295
6,904
4,685
3,831
2,879
6,295
2,001
1,515
3,910
4,651
0
4,903
9,976
9,789
9,522
7,960
8,735
Actual (1982)
MSY
MEY
Bionomic equilibrium
Monopoly
'Million standard hours.
AC
MC
14
-
P
4-
1 . 1
I
I
I
I
0
l
l
1
600
catch ( t
1
740
1
I
!
!
900 960
lo3
Fig. 9.4. Variable price model applied to the Gulf of Thailand
fishery (mesh size = 2.5 cm).
Total
benefit
11,491
13,699
14,173
7,960
13,638
CHAPTER 10
EEZS AND JOINT VENTURES
Almost unique among developing countries, Thailand maintains a sizeable distant-water fishing
fleet operating throughout the South China Sea and the Indian Ocean. It is believed that about one
half of the catch by the Thai trawl fishery originates from outside the Thai territorial waters (Marr
et al. 1976; Anon. 1978). The implementation of 200-mile Exclusive Economic Zones (EEZs) by
Thailand's neighbors has virtually eliminated the high-sea areas of the South China Sea and the Bay
of Bengal, as well as other relevant parts of the Indian Ocean (see Marr 1976; Valencia 1978a). This,
it was feared in Thailand and hoped in neighboring countries, would effectively put an end to the
'poaching' of fish resources by the distant-water fleet and enable coastal states to exploit and
manage the resources within their extended fisheries jurisdictions.
It is recognized, however, that whereasThailand's neighbors claim the right over these resources,
only Thailand has the technical capability to exploit them fully. Naturally then, joint fishing ventures are regarded as the deus ex machina that would meet both sides' needs and interests. As a
corollary, well-defined rights and joint ventures are expected to prevent overfishing by obviating the
retreat of Thailand's distant-water fleet into the Gulf while regulating its activities outside the Gulf.
The purpose of the present chapter is: (i) to examine the most likely effects on Thailand of the
implementation of EEZs by neighboring countries and (ii) to evaluate the option of joint fishing
ventures as an instrument for controlling overfishing, combating encroachment and mitigating
overcapitalization.
Exclusive Economic Zones
The proclamation of 200-mile EEZs by Thailand's neighbors extends the national jurisdiction
of coastal states over the entire South China Sea and most of the Bay of Bengal leaving little trawlable high-sea areas for distant-water fishing (Fig. 10.1). According to the Chairman of the Thai Fisheries Association, Thailand stands to "lose 300,000 square miles of fishing grounds" (Bangkok Post
1 9 7 9 ~ )Theoretically,
.
the country's distant-water fleet would have to retreat into the Gulf of
Thailand with the consequent "loss of an estimated 660,000 tons of marine fish and crustaceans
annually, lowering the Thai annual marine harvest by some 40%" (Bangkok Post 1979d) and
depriving the country of foreign exchange earnings of 2,000 to 3,000 million baht. Neither of
these losses is a modest one for a country still suffering from protein-malnutrition and mounting
balance-of-trade-and-paymentsdeficits. Currently, marine products contribute over 5% to the total
value of exports while over 50% of the domestic animal protein consumption consists of fishery
products. To quote the local press:
With a rising demand for food from an ever expanding population, the constraint placed [by EEZs] on
marine fisheries, which have been this country's vital source of protein, would have proved to be catastrophic.
(Bangkok Post, 1979d).
Even more catastrophic, one fears, would be the effect of EEZs on small-scale fishermen and
fish resources within the Thai territorial waters: retreat of the distant-water fleet and consequent
doubling of the number of vessels operating in the Gulf of Thailand is certain to obliterate both fish
and fishermen. In Chapters 8 and 9, we have seen that the Gulf is already overfished by a fleet
double its 'optimal' size and in Chapters 5 and 6, that operators of small otter trawlers and other
small-scale fishermen whose fishing range is limited to the Gulf of Thailand barely eke out a subsistence. The consequences of the deployment of an additional fleet of several thousand highly
'efficient' distant-water vessels in the limited confines of the Gulf are difficult to imagine. Since
the extent of depletion would be determined by the amount and duration of profits for vessels
remaining, fishing operations will continue as long as operating costs are covered. Given further the
high fishing efficiency attained by the distant-water fleet (to compensate for high travelling costs),
the danger of destroying the Thai fish resources is not an unrealistic one. Even more certain is the
exacerbation of social problems and conflicts in connection with coastal small-scale fishermen.
The repercussions for Thailand of the loss of 780,000 km2 of fishing grounds and of the
consequent retreat of the distant-water fleet into Thai waters are unquestionable. The question is
rather whether the proclamation of 200-mile EEZs has triggered the above chain of events. That is,
can neighboring countries enforce their claims over such an extensive sea area to the effective exclusion of the Thai fleet? Answering this question would also enable us to evaluate the option of joint
ventures often suggested as the solution to the problems posed by EEZs.
The main countries off which Thai foreign catches are made are Bangladesh, Burma, India,
Indonesia, Kampuchea, Malaysia, Philippines, Singapore and Vietnam (see Marr et al. 1976). Virtually all these countries have now proclaimed EEZs: Vietnam in 1977, Kampuchea and Bangladesh in
1978, the Philippines in 1979, Indonesia and Malaysia in 1980. However, with the exception of
Vietnam which has demonstrated some capability in enforcing its EEZ (Valencia 1978a), none of
these countries appears to have the enforcement capability required by such a vast area as the
200-mile EEZ. Past inability to enforce exclusive rights over such limited areas as a 12-mile territorial zone (as evidenced by the pervasiveness and profitability of encroachment) bespeaks of future
enforcement difficulties over the far more extensive EEZs. Many authors, if not the countries
themselves, have recognized the problem. Marr et al. (1976) speaks of "time lag between the proclamation . . . and the abilities to enforce"; Valencia (1978a) refers to "the general lack of enforcement capability in the region"; and Hongskul(1979) states that "the problems of enforcement . . .
are critical within the region."
While any nation proclaiming an EEZ faces enforcement difficulties, the developing countries
of Southeast Asia have more than their share, not only because of their low level of economic
development but because of geographical and historical factors as well. The presence of archipelagos
containing large water areas and small land masses, the ongoing territorial disputes and a long
history of promulgation of laws and regulations without effective enforcement combine to hinder
'marine regionalism' (a concept defined below) as well as to weaken the enforceability of any single
nation's claims over vast sea areas remote from its land base.
The ability of an individual state to exert sovereignty over the claimed marine areas and to
enforce regulations vis-his foreign activities depends, to a large extent, on the strength of its navy
or marine police, the number and dispersion of naval bases and the size of its (naval) air force relative to the length of its coastline and the offshore area accruing to it under a 200-mile jurisdictional
regime (Valencia 1978a). Table 10.1 attempts to give a comparative picture of the capacity of
Southeast Asian states to enforce such jurisdictional regimes. The figures, though somewhat outdated, leave little doubt that most nations in the region are ill-prepared for the task. With the
possible exceptions of Vietnam, China, Singapore and Taiwan, all other states:
would have thousands of square miles of ocean area of hundreds of miles of marine perimeter to cover per
patrol vessel or aircraft. Regulations and restrictions would, thus, not be readily enforceable with present naval
capabilities on an individual state basis over much of the South China Sea (Valencia 1978b).
Even more severe are likely to be the enforcement difficulties of Thailand's neighbors in the Bay of
Bengal (Burma, Bangladesh and India) which are relatively poorer than most Southeast Asian
countries and have economic zones at least as large (Fig. 10.1).
The obvious alternative to individual state capability in enforcing extended marine jurisdictions is 'marine regionalism' in the sense of cooperative management and enforcement by the
regional states or by a regional body representing these states. However appealing marine regionalism
Table 10.1. Capacity of Southeast Asian states t o enforce extended fisheries jurisdiction (200-mile E E Z ) . ~
Political
entity
Area of
entity
(kmz x l o 3 )
Length of
coastline
(km)
offshoreb area
to 200 nm limit
(nmz x l o 3 )
Navy
(total fleet)
Major
naval bases
No. of
naval aircraft
12,990.00
70,805
2,991.5
3.566
37
585
No. of
airforce
aircraft
200 nm
arealtotal
fleet ratio
200 n m
mealtotal
aircraft ratio
Coastline I
total fleet
ratio
Brunei
China
Hong Kong
Indonesia
Kampuchea
Laos
Malaysia
Philippines
Singapore
Taiwan
Thailandc
Vietnam
Total
6.603
-
-
-
'AS the figures regarding navies, aircrafts and bases are somewhat outdated (early 1970s). the present capacity of some (if not all) of these states t o enforce jurisdictional regimes
is underestimated. Thus, the given figures should be regarded only as indicative of (relative) orders of magnitudes rather than as exact numbers.
b ~ f f s h o r earea accruing to each country under 200-nautical-mile jurisdictional regimes.
'source' (see below) combines the figures for what were then North and South Vietnam.
,Thailand plans a major naval base at Phangnga on the Andaman Sea (Far Eastern Economic Review, January 14. 1977, p. 15.)
Averages exclude Laos.
he
Source :
Valencia (1978b).
Fig. 10.1. Remaining high seas in South and Southeast Asia following the implementation of '200-mile exclusive economic zones by coastal states.
might be for closed or semi-closed seas with transboundary resources, the constraints posed by
ideological differences, military conflicts and territorial disputes (all unrelated to EEZs) loom
formidable. Consider, for instance, the ideological differences between the Association of Southeast
Asian Nations (ASEAN) and the Indo-Chinese states, the military conflicts in Indo-China and the
territorial disputes between China and Vietnam over Paracel Islands; among China, Vietnam, the
Philippines and Taiwan over Spratly Islands; and between Thailand and Kampuchea over Kut, Wai,
Panjang and Krah Islands. (See Valencia 197813 for these and other disputes as well as for a detailed
account of the constraints to and prospects of marine regionalism in South China Sea.) There is also
the diversity of interests and incompatibility of claims associated with extended jurisdictional
regimes. For instance, China, Vietnam and Malaysia would probably favor exclusive jurisdictions;
Indonesia and the Philippines may insist on the archipelagic principle; Thailand, Taiwan and Singapore might opt for jurisdictional extension with full utilization. According to the principle of 'full
utilization', states which lack the capacity to harvest the entire 'allowable catch' within their EEZs
should give other states access to the surplus, presumably at a certain agreed upon fee or share.
Boundary disputes and overlapping EEZs (such as those listed in Table 10.2) among Southeast
Asian states are certain to frustrate any attempt in the foreseeable future towards concerted enforcement of EEZs and/or joint management of transboundary and migratory resources, although some
bilateral agreements for disputed areas and joint ventures will undoubtedly be concluded.
With enforcement capabilities seriously deficient and marine regionalism unlikely, the possibility of effective implementation of EEZs in Southeast Asia will depend largely on the chances of
persuading distant-water fishing nations to restrict the operation of their fleet within their own
waters. This, in turn, presupposes some control by Thailand over its fleet as well as some leverage by
neighboring countries over Thailand. While the latter may be found in Thailand's increasing need
and desire for peaceful coexistence and economic cooperation with its neighbors, the former is
conspicuously absent. Indeed, if Thailand has been unable to prevent its fleet from encroaching on
the 12-mile territorial waters of bordering countries it cannot reasonably be expected to prevent
Table 10.2. Some specific boundary disputes and overlapping exclusive economic zones in Southeast Asia.
Bmnei
Burma
China
HongKong
Indonesia
Kampuchea
Malaysia
Philippines
Singapore
Taiwan
Thailand
Vietnam
Hong Kong
Indonesia
\
Kampuchea
Malaysia
X
xe
xf
X
Philippines
Singapore
X
X
Thailand
x
Vietnam
x
-
Note
\
X
X
Taiwan
:
x
-
x
-
- --
x
-
--
X \
-
-
Entries above the diagonal indicate specific boundary disputes (see legend below) while those below the diagonal indicate overlapping
EEZs. Neither is meant to be exhaustive.
A
:
triangular area in the South China Sea off the East Coast of Peninsular Malaysia.
Natuna Island.
i ~ i g i t a nand Sipadan Islands (uninhabited).
,Tiny Batu Puteh Island which commands the eastern approach to the Straits of Singapore.
(dispute as a result of unihabiteral proclamation of continental shelf boundary by Kampuchea).
sland of Phu Quoc and certain other small islands (unknown if dispute continues at present).
Sources : a, b. c, d from Whi-
(1980); e. f, g, h from Vaiencia (1978a and b).
encroachment of the far more extensive 200-mile EEZs. Economic opportunities more attractive
than distant-water fishing would certainly work but such opportunities can hardly be found in
Thailand or within 200 miles from its shores. Well aware of this, Thailand has maintained that it will
be the last Southeast Asian nation to declare a 200-mile EEZ. Indeed Thailand did not declare an
EEZ until 23 February 1981, by which date all Thailand's neighbors had done so. Other countries
are welcome to fish in the Gulf of Thailand, if they wish, in exchange for reciprocal rights. Not
surprisingly, there have been no takers among Thailand's neighbors; not only do they lack the
distant-water fleet for such expeditions but, more importantly, the Gulf of Thailand is thought t o
be an 'aquatic desert' by comparison with their own fishing grounds. For instance, the Bay of
Bengal is reported to be about eight times richer in fish resources than the Gulf of Thailand (see
Business Review, February 1979), although the virgin stock density is almost the same in the two
areas (see Tables 8.4 and 8.5).
Joint Fishing Ventures
Under these circumstances, the initial enthusiasm for joint fishing ventures in Thailand and
some of its neighbors was not surprising. Such ventures were seen as an opportunity for cooperation
(instead of confrontation) between neighbors towards mutual benefit and an effective means of
luring the refractory distant-water fleet into some form of joint control by Thailand and the host
country. The mutual benefits from joint ventures are obvious enough. Thailand has excess fishing
fleet in relation to its own fish resources ('overcapitalization') while neighboring countries have
excess resources relative to their capacity to harvest them (surplus 'allowable' catch). Commonly,
both sides are in need of additional sources of protein as well as income and employment to satisfy
the nutritional needs and development aspirations of their rapidly growing populations.
Joint ventures, thus, constitute a 'Pareto improvement', that is, a change from the status quo
that would benefit at least one of the parties without harming the other. But while the benefit t o
both sides is quite clear, reaching an agreement presents all the classic problems of bilateral monopoly and game theory. In bilateral monopoly "the bargaining power wielded and the tactics employed by the trading partners determine the resolution of this conflict, and on formal theoretical
grounds it is possible to say only that almost anything can happen" (Scherer 1970). In games of
strategy each player is seeking a strategy that will result in the attainment of a particular objective
from his own standpoint. The final outcome depends jointly on the strategies chosen by all participants in the game (Chiang 1967). The prolonged negotiations of, and eventual stalemate in, the
Thai-Basgladeshjoint venture is a case in point. Bangladesh is reported to have initially agreed to a
20% share of the value of the catch and to have changed its mind later asking for 30%. Thailand refused on the ground that it would be unprofitable (see Bangkok Post 1 9 7 9 ~ )Currently
.
the venture
is in a new deadlock over Thailand's complaint that Thai vessels incur losses as a result of overestimation of the value of the catch by Bangladesh in claiming its share, and over Bangladesh's complaint
that more than the agreed upon Thai vessels operate in its waters.
Moreover, it would be an arduous task to negotiate a sufficient number of joint ventures t o
employ the entire distant-water fleet. Marr et al. (1976) argue that no more than 100,000 t of fish
can be expected to be obtained from all potential ventures. To this day, there have been discussions
with many countries as far as Bahrain and Saudi Arabia, but few have resulted in a final agreement,
mostly between private companies.
Assuming, however, that such ventures will eventually be agreed upon, how likely is it that
they will succeed in attracting Thailand's distant-water fleet? The answer depends on the relative
attractiveness (profitability) of joint fishing ventures vis-a-vis other opportunities open t o the fleet.
Were EEZs enforcable, retreat into the overfished Gulf of Thailand would have been the only
alternative, and, most likely, an inferior one, considering that joint ventures allow access to underexploited stocks and a share of the rents. As we have seen earlier, however, with the present enforcement capabilities, distant-water fishing will continue to be both possible and profitable for some
time t o come despite the proclamation of 200-mile EEZs. International agreements and larger
appropriations for law enforcement within the extended fisheries jurisdictions may raise the cost of
'illicit' operations and drive out the marginal units, but substantial reduction of distant-water fishing
is unlikely. As long as the rents to be earned are large enough to permit investment in faster boats,
patrol detection equipment and other defensive mechanisms (including the bribing of enforcemen't
officials), laws and proclamations will remain on paper until such day as the governments involved
are able to match the technical sophistication and financial strength of Thailand's distant-water
fleet.
Since joint ventures by definition introduce two additional rent claimants, the Thai government and the host country (in the form of license or catch fees), the share of the benefits allowed
for the fleet itself may compare unfavorably with the profits from 'illicit' distant-water fishing
even after all cost and risks are accounted for. For joint ventures to be successful in enticing Thailand's distant-water fleet, additional investments in attaining economies of scale, such as 'factoryships' for the collection and processing of catch and other incentives would be needed. The Thai
government and its neighbor-partners (assuming a strong interest on both sides) may choose to
promote joint fishing ventures either by raising the costs of 'illicit' distant-water fishing through
closer monitoring and stricter enforcement, or by lowering the 'private' cost of joint-venture fishing
through investments in related infrastructure and reduction of their own shares.
Each of the above courses of action requires substantial outlays which may not be justified by
potential benefits unless non-fishing, non-economic considerations, such as improvement in intemational relations, are brought into the picture. However, only through effective control of entry
either at the source (Thailand) or at the place of operation (host country's EEZ) will successful
joint ventures provide a solution to the problems of overcapitalization, encroachment and suboptimal exploitation of resources. Otherwise, joint ventures will directly or indirectly encourage the
construction of new vessels, thus, exacerbating rather than alleviating these problems. Moreover, it
must be remembered that joint ventures, however successful, cannot be but a transitory solution to
chronic problems. Most likely, the host country would require that Thai interests are phased out as
its own fishing capabilities are built up.
Existing Legislation and Policy Framework
The fisheries policy in Thailand is governed by two basic acts: the Act Governing the Right to
Fish in Thai Waters of 1939 and the Fisheries Act of 1947. There are several other related acts and
regulations concerning navigation (1913), fish markets (1953), fish processing factories (1963),
fish exports (1980) and fishermen's cooperatives (proposed). The various acts and regulations of the
Thai fisheries have been described in detail by Rientrairut (1983). Here, we will focus only on the
1939 and 1947 acts which are of direct relevance to the study. The Act of 1939 defines the Thai
fishery waters as the Thai territorial waters of 12 miles from shore and any other waters in which
Thailand is entitled to exercise fishing rights. According to this act all fishing vessels in Thai territorial waters are required to hold a fishing license. Fishing licenses are to be issued only to Thai
nationals or to partnerships and companies in which 70% of the capital is owned by Thai nationals.
Foreign vessels are not allowed to fish in Thai fishery waters except where there is an agreement
with foreign countries. The authorities are empowered to seize any vessel operating in violation of
the act, to confiscate its catch and to prosecute the individuals or companies involved.
The Fisheries Act of 1947, composed of 73 articles, deals with fishing areas, licenses, fishery
statistics and fisheries control and prosecution of offenders as well as fish culture. This act classifies
fishing areas into: (a) sanctuaries where fishing is prohibited; (b) leasable and reserved areas both of
which are reserved for individual license holders, but the former permit unlicensed fishing by certain
gears for home consumption as well; and (c) public areas for which no requirement for license is
specified but fishing is subject to compliance with conditions imposed by the Minister of Agriculture and Cooperatives. The act empowers the Minister to issue: (a) notices requiring persons
engaged in fishing to be registered and obtain a license; (b) notices requiring the licensing of any
kind of fishing equipment; and (c) fishing regulations such as closed areas, closed fishing seasons,
mesh size limitation, gear restrictions and catch quotas. The act also empowers the Minister, the
Provincial Governor and authorized fisheries officers to enforce the act through the normal process
of entry, search, arrest and seizure.
In addition to these two acts, of direct interest is the Thai Vessels Act of 1939 which requires
all mechanically propelled fishing vessels of any size and non-mechanized boats of 6 GT or over to
be registered with the Harbor Department, to ensure compliance with construction, seaworthiness
and equipment standards.
In 1983, the government introduced a new licensing system which "aims to freeze the number
of trawl fishing vessels at the current level and to reduce it thereafter" (Rientrairut 1983). According to this new system the construction of new trawl vessels is prohibited and no new trawl licenses
will be issued; existing licenses are made non-transferable except by inheritance; and obsolete vessels
cannot be replaced.
In response to the need to raise the income levels of small-scale fishermen and to resolve their
conflict with the large-scale fishery, push netting and trawling are prohibited within 3 km from the
shoreline. Efforts are also being made to develop alternative or supplementary employment opportunities such as fishfarming, tourism and cottage industry.
Chapter 11
POLICY IMPLICATIONS
While it is beyond the scope of this study to formulate a detailed and comprehensive package
of policy recommendations for fisheries management in Thailand, it is a natural extension t o extract
the policy implications of the preceding analysis and make some general recommendations. In the
light of our findings, the feasibility of stated government objectives and the effectiveness of current
policies in achieving these objectives are evaluated. Modifications of fishery policy targets in the
context of the country's broader development objectives as well as alternative policies are proposed.
Policy Issues
From the preceding analysis of the Thai fisheries three fundamental policy issues emerge:
(a) how to reduce overfishing and induce a recovery of Thailand's demersal resources without
reducing fishery production and employment; (b) how best to utilize Thailand's sizeable distantwater fleet and technological advantage and, at the same time, reduce the encroachment of neighboring countries EEZs and improve Thailand's international image; (c) how to improve the standard
of living of small-scale fishermen and minimize their conflicts with large-scale fishermen without
subsidizing and/or institutionalizing inefficient or economically unviable fishing units. Taken
together these issues amount to a quest for a national fisheries policy which would maximize the
overall'benefits from the fishery to the society with due concern for their distribution and short-run
adjustment problems.
This is admittedly a difficult task for any country, but especially for a developing country such
as Thailand which has little tradition and experience in sustainable resource management and rather
limited enforcement capability, although the Department of Fisheries is ahead of other resourcerelated departments in both management and enforcement capabilities. With the notable exceptions
of aquaculture (in all its forms) and joint fishing ventures, it is difficult to think of management interventions that will not involve curtailment of fisheries production and employment and increased
conflicts at least in the short run. Yet, if the fishing industry is not t o have the same fate as the Thai
forest industry which has exploited itself to extinction turning Thailand from a net exporter to a
net importer of forest products, sustainable yield management is imperative. As our models of
Chapters 8 and 9 have shown, whether the maximization of physical or economic yield is selected as
the objective of management makes little difference by comparison t o a situation of no management or open access.
As evidenced by the Fourth and Fifth National Development Plans (NESDB 1977,1981) and
other official statements the government does perceive these issues and attempts are being made to
tackle them. The question is whether the existing legal and policy frameworks are appropriate and
sufficient to deal with these issues especially in the light of budgetary and administrative constraints,
the high enforcement costs and the targeted growth rate of 5.4% per year in fish production. To
investigate this question, it is first necessary to review the existing legislation and policy framework.
In addition to the fisheries legislation and related management policies which aim at regulating
fishing effort, the policy framework of the Thai fisheries includes input, output and trade policies
which aim t o raise fishermen's incomes, thereby subsidizing fishing effort. Such policies include
financial support at subsidized interest rates, tax exemptions for fishing machinery and equipment,
provision of storage and processing facilities,price support, export promotion and import discouragement (Rientrairut 1983).These policies are usually introduced as second best solutions or stop-gap
measures at a time of a sudden shock or crisis but usually outlive their original purpose. For instance,
in response to demands for subsidized fuel prices following the 1980 oil price shock the government
froze the marketing fees and the license and registration fees. These policies persisted long after the
tight oil market conditions ended.
Evaluation of Current Policies
The Fisheries Act of 1947 empowers the responsible Minister with both the authority to
introduce a licensing system and fishing regulations such as closed areas and seasons, mesh size
limitations, gear restrictionk and catch quotas, and with the authority to enforce t h h e measures. In
practice, however, the Minister has not used his powers under the act to introduce an effective
licensing system and other fisheries regulations because of both administration constraints and
political considerations. As in many other countries, the budget, manpower and the authority
of the Department of Fisheries (DOF) are clearly inadequate for operationalizing and enforcing a
licensing system and/or other fisheries regulations. Moreover, political considerations militate
against a substantial reduction of effort and even restrictions on its expansion.
Even the recently introduced licensing scheme which freezes the number of trawlers and
prohibits the& transfer and the construction of new vessels may be proved inadequate. Firstly, as
the fishing vessels are to be registered with the Harbor Department while the gear is licensed by
DOF, a loophole exists which enables registered fishing vessels to operate without a license for gear.
Secondly, with the current budget and manpower it is not easy for the DOF t o enforce the licensing
system over an extensive and technologically advanced fleet which can operate from foreign ports.
Thirdly, even if the system could be generalized and enforced it can only block new entrants
and may reduce fishing e f f 0 r t . b ~normal attrition but it will take a very long time to cut effort t o
about half its current level as required for maximum benefits. Lastly, even if effort could be reduced
t o its optimum level, without an effective mechanism of creaming off resource rents, the newly
established rents (as a result of the reduction in effort) would create such a potent incentive t o
increase effort that rents will be again dissipated either through excess effort or higher enforcement
costs.
Similarly, other regulations such as the prohibition of push netting and trawling within 3 km
from the shore and the recommendation for a 4 cm mesh size are generally ignored as evidenced by
the presence of large numbers of push nets and trawlers in the prohibited zone and the use of 2.5
cm mesh size. A two-month seasonal closure of the central western Gulf has been recently spatially
reduced and might soon be removed under pressure from the industry.
The Department of Fisheries considers the Fisheries Act of 1947 inadequate for marine
fisheries management and has drafted a new Fisheries Act which has been approved by the Ministry
of Agriculture and Cooperatives and submitted for consideration to the Parliament in 1984.To the
knowledge of the authors the new Fisheries Act has not been enacted yet.
Input policies, such as subsidized credit and tax exemptions for fishing machinery and equip
ment, while intended t o relieve short-term hardships, are certain to deepen capital intensity at the
expense of labor employment, to encourage new entry to the destruction of fish resources ana t o
widen the dualism between small- and large-scale fishermen. Moreover, new entry will nullify any
temporary gains to the fishermen necessitating new subsidies in the future which, having created a
precedent, will be difficult to resist or remove.
Output policies such as price supports, while intended to raise fishermen's incomes and to
ensure increased fish supplies for human consumption at low prices, are self-defeating in the long
run. To the extent that they are effective in raising fishing incomes, new entrants are attracted
into the fishery, and, as a result, the resource base deteriorates, incomes fall and new supports are
required.
.
Intervention in international trade such as promotion of exports and tariffs on fish imports
may temporarily succeed in raising fishing incomes, in improving the balance of payments and in
protecting the local industry, but no lasting benefit can be expected under the present open-access
status and depleted state of the resource. At present, increased fishery exports can be had only
through destructive or 'piratical' fishing.
Effort is also being made to conserve fishery resources by encouraging distant-water fishing,
especially through joint fishing ventures and other fishery agreements with neighboring countries
(e.g., with Bangladesh, Malaysia, India and Indonesia). Although some additional fish.supplies have
been forthcoming as a result of these ventures, there is no evidence that overfishing in Thai waters
and encroachment on foreign resources have been diminished. To the extent that joint ventures are
successful, they tend t o encourage the construction of new, larger vessels rather than the utilization
of existing ones, although, in the absence of restrictions on entry, even the latter will create room
for new construction.
In terms of supplementary sources of income and employment, especially for small-scale
fishermen, brackishwater fisheries and coastal aquaculture as well as other fishery-related economic
activities are currently promoted but their extent is still negligible by comparison with the number
of coastal fishermen. A large part of the Department of Fisheries' budget goes towards the development of inland fisheries which have been practically at a standstill for the last decade. Out
of the Department of Fisheries' 1979 budget of 213 million baht, 25% was allocated to freshwater
fisheries, 23% to administration, 21.3% to marine fisheries including survey of fishing grounds, 15%
t o fishery resource conservation, 12.75% t o the brackishwater fishery and 3%to improve fishery
employment (see Business Review, February 1979).
Towards a National Fisheries Policy
Problems such as those facing the Thai fishing industry require a comprehensivefisheries policy
in line with each country's broader development objectives. One possibility worth considering is
to empower the Department of Fisheries in a country with the formulation and implementation .
of a national fisheriespolicy which would include upgrading its authority and budget and strengthening its enforcement capability. Here we simply outline the main components such a policy could
include in the case of Thailand.
The first step in such a policy would be an immediate and effective freeze in the number of
vessels in general and of trawlers in particular through prohibition of the construction of new vessels
and the compulsory registration of the existing vessels with the Department of Fisheries. The next
step would be the issuance of fishing licenses to existing vessels based on their current level of
catching power, unless it is determined that the current mesh size is smaller than the optimum, in
which case a larger mesh size should be specified. Licenses would need to be made non-transferable
without exemptions and be retracted upon the retirement of either the owner or the vessel, whichever comes first, until the fleet is reduced to its optimum size. The license fees which are now
negligible (e.g., 5 baht/m footrope for trawlers, 2 baht/ m footrope for gill nets and purse seines and
150 baht per gear for push nets) would need to be raised to the estimated market value of the
license. As effort is being reduced (or fish prices rise), the license fees should be revised upward
to cream off the newly created -rents and reduce the incentive for expansion of effort. Annual
adjustments of the allowable effort and license fees may be necessary to take account of natural
fluctuations in the resources and changes in fishing costs.
The government could speed up the attrition process by offering to buy back and cancel the
licenses of fishermen who choose to leave the fishery, using the proceeds from the license fees. This
last option could be made more attractive by offering t o retrain and/or relocate those who leave the
fishery as well as by developing alternative employment opportunities. Moreover, it is possible to
use the licensing mechanism to discourage certain gears such as trawlers and encourage others such
as purse seines if they are judged to have a differential impact on the state of the resources.
However, for a licensing system to work effective enforcement is necessary. At present, properly
equipped patrol vessels are lacking and the penalties imposed on violators are too small to be taken
seriously. For instance, the fine for fishing with an unlicensed gear is set at three times the annual
license fee. Since the probability of being detected and arrested with an unlicensed gear is far less
than 3396, it is not surprising that many fishing vessels use unlicensed gear. For effective enforcement both the fines and the probability of detection and arrest should he raised considerably so
that the certainty-equivalent-fine (nominal fine multiplied by the probability of detection) exceeds
the license fee and other related costs. Moreover, the enforcement effort should be uniform across
provinces; otherwise, fishingvessels may shift their home base to the provinces of least enforcement.
Care also should be taken to separate the enforcement and development functions; each function
should be assigned to different officers to avoid conflict of interest.
Finally, every effort would need to be made to minimize enforcement costs through technical
means and self-policing. This is particularly applicable to the government's efforts to improve the
socioeconomic position of small-scale fishermen and reduce their conflicts with large-scale fishermen. One of the most difficult to enforce regulations has been the prohibition of trawling and
push netting within the 3-km-from-the-shorestrip reserved for small-scale fishermen. These fishing
gears not only compete with coastal fishermen for limited resource but they are also believed to
destroy the inshore nursery grounds and habitat, to catch large quantities of juvenile fish and to
cause damage to stationary and other types of gear employed by small-scale fishermen. Small-scale
fishermen, unable to compete with these gears often resort to equally destructive fishing methods
such as dynamite, poison and fine nets.
An effective solution to these problems with minimum enforcement cost may be found
through the concepts of territorial use rights in fisheries (TURFs) and artificial reefs which would
act also as fish aggregation devices (FADs). TURFs can be created by dividing the coastal fishing
grounds into fishing zones each t o be allocated to the adjacent fishing community. Each community, once allocated exclusive and secure fishing rights to a fishing zone would use its internal
enforcement mechanism (peer group pressure, community leadership, etc.) to prevent other communities from encroachingon its resources and to regulate the effort of its own members so that the
resource is properly utilized. The community would have every incentive and the means to prohibit
trawling, push netting, dynamite fishing and other destructive fishing methods as well as fishing
during spawning seasons or in nursery grounds by its own members (for more details on the concept
of TURFs see Christy 1982;'Panayotou 1983; Smith and Panayotou 1984).
However, trawlers and push nets from offshore areas may continue t o encroach on the community's TURF; in fact, the more the resource recovers as result of self-management and selfpolicing by the community the greater the incentive for encroachment. Small-scale fishermen are
unlikely to have the technical capability of preventing such encroachment, which if not contained
would reduce the community's incentive for self-policing. This is where the technical solution of
artificial reefs as trawling obstacles may be proved of immense value as they will discourage trawling
without the need for daily enforcement of the regulation. What is required is the construction of
random physical barriers made of concrete or car bodies within 3 km or more from the shoreline.
While the construction of such reefs would be costly, the expected benefits are sufficiently large t o
warrant a serious study (Munro and Polovina 1984). The expected benefits include: (a) reduction of
the conflicts between small- and large-scale fishermen; (b) more effective management of inshore
resources without the need for recurrent enforcement costs; (c) the artificial reefs acting as fish
aggregation devices and barriers of access to nursery grounds would provide habitat for juvenile
fish which will thereby survive to market size or reproductive age; and (d) higher incomes for smallscale fishermen who would benefit in the short run from the employment generated by the construction of artificial reefs and in the longer run from the reduction of competition f r ~ m
trawlers
and the increased fish abundance as a result of FADs.
Objections to some of these approaches will arise. Reviewers of the draft of this manuscript
have commented that the "buy-back program" is not advisable based on the Canadian experience
and the large budget required, that the TURFs approach is difficult to implement and control and
that artificial reefs are not true FADS and need further study before large-scale implementation.
While we share thew concerns and appreciate the difficulties, we nevertheless believe that there is
scope for improvement in Thai fisheries management based on these concepts appropriately modified to fit the Thai circumstances (see also ADB 1985).
Once the construction of new vessels is halted and existing ones are brought under control,
joint ventures could compensate for the loss of employment and catch resulting f r ~ m
the curtail-
ment of destructive inshore fishing and of 'illicit' distant-water operations. Moreover, Thailand
could invoke historical fishing rights, nutritional needs and its relatively disadvantaged geographical
location t o obtain legal access to the underfished resources of the region. At the same time, it must
be recognized that any such access, like joint ventures, cannot be but a temporary arrangement
until neighboring countries develop their own fishing capabilities. While far from being a cure-all
remedy for the country's fishery related problems, these options, if wisely used, could prove of immense value during the transitional stage from a refractory open-access fishery to one of regulated
access designed to maximize the overall welfare of the Thai society.
As joint ventures and fishing rights in distant waters are phased out, Thailand will have to rely
increasingly on its own fish resources; hence the need for a speedy recovery of the fish resources
within Thailand's 200-mile EEZ. It is unlikely, however, that the Thai fish resources, even after
recovering to their maximum potential, can accommodate a fishing fleet of the current size; nor
could they yield a sustainable catch of the current magnitude, hence the need for a gradual reduction of the fleet and development of alternative sources of both employment and protein such as
fishfarming and livestock development. A national fisheries policy would provide for a detailed plan
for aquaculture and inland fisheries development as well as for a process of smooth transition from
capture to culture fisheries and other occupations.
Other important fishery policy issues not covered by this study concern improvements in
product handling, quality control and environmental protection of the coastal zone from water
pollution resulting from inland deforestation, destruction of mangrove forests, and industrial and
mining waste. Improvements in these areas may contribute to the productivity of the resource and
fishing incomes as much as the management measures discussed in detail herein, but any such gains
would be short-lived without effective resource management.
The ultimate success of a national fisheries policy lies in the right and timely mix of fisheries
management and nonfisheries development. Under the prevailing conditions of rising landlessness
and swelling unemployment in the rest of the economy, only broad-based rural development will
put an end to the continual drift into 'common-property' resources and major urban centers. In its
absence, fisheries regulation cannot be effective and, if effective, will simply push the problems into
some other sector: unemployed fishermen have little choice but to encroach on reserved forests,
mineral concessions (as is already happening in Phangnga) and public lands or simply move into the
urban centers creating a host of social and environmental problems.
CHAPTER 12
SUMMARY AND CONCLUSIONS
Two decades ago the Thai marine fishery was an economically insignificant sector employing
mainly stationary gear and boats without engines. Today Thailand boasts one of the largest fishing
industries in the world, emplo*g
over 20,000 motorized vessels and landing about 2 x 10⁶ t
of fish annually from fishing grounds as remote from Thailand as the coasts of India and China. A
number of factors contributed to this radical transformation. The introduction of trawl technology,
the rising demand for fish, and a laissez-faire government policy combined to attract powerful
investors in what for decades used to be a poor-man's occupation. Small-scale fishermen, with few
exceptions, lacked the funds and the access to institutional, low-interest-rate credit to acquire the
new technology. Thus, a dualistic structure emerged with small-scale fisheries employing over 70%
of the total number of fishermen while landing less than 30% of the total catch.
Our analysis of the economic conditions of the trawl fishery revealed the persistence of excess
profits (resource rents) for most vessel classes despite massive entry and steep rises in fuel prices
that led temporarily t o losses. While changes in economic and biological parameters have altered
the relative profitability among vessel classes, the opportunity of distant-water fishing served t o
relieve the pressure on inshore resources and along with technical improvements t o maintain the
profitability of the trawl fishery as a whole. In contrast, small-scale fishermen, lacking both mobility and resilience and being under incessant pressure from coastal trawling, struggle to hold on to
fishing as a familiar source of income and a way of life but manage to eke out subsistence only
through a variety of supplementary non-fishing occupations.
The fishing resources within the Gulf of Thailand are overexploited in that the catch exceeds
the maximum sustainable yield and fishing effort is twice the economic optimum level. Moreover, as
of the early 1970s, over half of the total landings have been made from distant-water fishing grounds
including the coasts of neighboring countries. The advent of 200-mile exclusive economic zones, it
was feared in Thailand and hoped inneighboring countries, would effectively put an end to distantwater fishing allowing coastal states to exploit and manage their resources while rendering the Thai
fishery grossly overcapitalized. In anticipation of the threat posed by a retreating fleet t o Thai
resources and coastal fishermen, and in recognition of the lack of fishing capabilities on the part of
neighboring states, joint fishing ventures have been contemplated as a panacea to the problems
of encroachment, overcapitalization and resource mismanagement.
However, when considering the enforcement difficulties in the region as evidenced by past
experience with encroachment of far more limited areas than EEZs as well as by the present'naval
and air force capabilities relative to the claimed areas of jurisdiction, one is forced to conclude that
'illicit' distant-water fishing is likely to continue into the foreseeable future. True, the costs of
distant-water fishing may increase somewhat as a result of the implementation of EEZs. Nevertheless, joint ventures may still turn out to be an inferior alternative to 'illicit' distant-water fishing
because of the additional rent claimants (the Thai government and the host country), unless appropriate investments are made to attain economies of scale. In the absence of restrictions on entry,
however, successful joint ventures are likely to induce construction of new vessels exacerbating
rather than alleviating the problems of overcapitalization, encroachment and resource mismanagement.
Naturally, Thailand is not anxious t o see its distant-water fishing curtailed. Continuation of the
status quo along with a few joint ventures are seen as an acceptable second best solution: fish
supplies and foreign exchange earnings continue to be forthcoming and a cutthroat competition for
the Gulf's resources is averted; more importantly, crisis and confrontation with the powerful trawl
fleet is avoided for the time being. However, the present problems arising from the unchecked
activities of Thai trawlers also persist and assume increasing severity over time.
Domestically, the continuing encroachment on coastal fishing grounds by trawlers runs against
government efforts to upgrade the socioeconomic conditions of small-scale fishermen in line with
the national planning objectives of "promoting social justice by reducing socioeconomic disparities
and improving mass welfare" (NESDB 1977). Internationally, the continuing encroachment of
neighboring countries' EEZs by Thai trawlers runs against the country's efforts for regional integration with its allies (Association of Southeast Asian Nations) and for peaceful coexistence with its
ideological adversaries in Indo-China. From the fisheries management point of view, unchecked
trawling (especially t h e use of fine nets in spawning areas) carries with it the danger of physical
depletion of the more vulnerable species beyond recovery. More importantly, continuation of the
construction of new vessels leads t o an even greater problem in the future when joint ventures
will be phased out and encroachment suppressed, following a gradual improvement of fishing and
enforcement capabilities by coastal states.
While the Government is no doubt aware of these creeping problems and possible solutions
have been under study for some time, fishery policies t o this day have been largely stopgap measures
in response to pressure from the industry to deal with rising fishing costs. In its desire t o avoid
confrontation with the trawl fleet and to ensure increasing fish supplies for domestic consumption
and exports, the government has, at different times, contemplated and occasionally introduced
input subsidies, outpubprice guarantee, and exemption from taxes, as well as export promotion and
infrastructure development. However necessary and useful these policies might be as short-run relief
measures, their consequences over the long run could be negative if access to the fishery is not
effectively regulated.
An effective strategy for the solution of Thailand's fisheries-related problems calls for the
immediate halt of the construction of new trawlers, the licensing and control of the activities of
existing vessels, assistance to small- and large-scale fishermen through artificial reefs and community fishing rights, conclusion of more joint fishing ventures and development of alternative sources
of animal protein, income and employment. It is hoped that the recent awakening to the futility of
piecemeal policies and to the importance of combined resources management and broad-based rural
development will be backed by sufficient political will to be articulated into such a strategy.
References
ADB. 1985. Thailand fisheries sector study. Asian Development Bank, Manila.
Anderson, L.G. 1977. The economics of fisheries management. The Johns Hopkins University Press, Baltimore and
London.
Anon. 1978. Fisheries development and management in Southeast Asia: spotlight on Thailand. ICLARhrl Newsl.
l(2): 10-12.
Bahtia et al. 1983. The status of marine fishery resources along the west coast of Thailand. Phuket Marine Fisheries
Station Rept. (mimeo)
Bangkok Post. 1979a. Uncontrolled fishing drops, stocks increase. 1 7 May 1979.
Bangkok Post. 1979b. Fishing nets mark length of port channel. 5 June 1979.
Bangkok Post. 1979c. Fisheries industry: problems, problems and problems. 1 0 June 1979: 7.
Bangkok Post. 1979d. Moving along with the tide. 30 June 1979: 46.
Boonyubol, M. 1979. Demersal fish resources in the Gulf of Thailand. Thai Fish. Gaz. 32(1): 73-81. (in Thai)
Boonyubol, M. and V. Hongskul. 1976. Present status of demersal resources in the Gulf of Thailand, 1961-1975.
Demersal Fisheries Report No. 111976. Marine Fisheries Division, Department of Fisheries, Bangkok. (in Thai)
Boonyubo!, M. and S. Prarnokchutima. 1982. Trawl fishery in the Gulf of Thailand. Demersal Fish Section Report
No. 911982, Department of Fisheries, Ministry of Agriculture and Cooperatives, Bangkok. (Also Trawl fisheries in the Gulf of Thailand. ICLARM Translations 4 , 1 2 p. Thirapan Bhukaswan, translator, 1984. Intema
tional Center for Living Aquatic Resources Management, Manila, Philippines.)
Business Review. 1979. A hard life for Thai fish and fishermen but joint ventures help. Bus. Rev. 7(1): 6-13.
Christy, F.T. Jr. 1982. Territorial use rights in marine fisheries: definitions and conditions. FA0 Fish. Tech. Pap.
227.10 p. (Also in French and Spanish)
Chiang, A.C. 1967. Fundamental methods of mathematical economics. McGraw Hill Inc., New York.
W e , R.C. and N. Anand. 1974. Report on some aspects of fisheries development in Thailand. Tropical Products
Institute. London.
Copes, P. 1970. The backward-bending supply curve of the fishing industry. Scot. J. Polit. Econ. 1 7 (February):
69-77.
DOF. 1967. The first census of marine fishings in Thailand. Department of Fisheries, Ministry of Agriculture and
Cooperatives, Bangkok.
DOF. 1969. Trawl fishery in Thailand. 1969. Department of Fisheries, Ministry of Agriculture and Cooperatives,
Bangkok.
DOF. 1974. The results of cost and earnings survey of major marine fisheries. Department of Fisheries, Ministry of
Agriculture and Cooperatives, Bangkok.
DOF. 1978. Report on a socioeconomic survey of a fishing village on Songkhla Lake, Ban Ta-Sao, Tambol Sa-TingMor, Amphur Muang, Songhkhla Province. No. 911978. Fisheries Economics and Planning Sub-Division,
Department of Fisheries, Ministry of Agriculture and Cooperatives, Bangkok.
DOF. 1979a. Costs and earnings survey of trawl fishery 1977. No. 1011979. Fisheries Economics and Planning
Sub-Division, Department of Fisheries, Ministry of Agriculture and Cooperatives, Bangkok.
DOF. 1979b. Fisheries record of Thailand 1977. No. 611979. Fisheries Economics and Planning Sub-Division,
Department of Fisheries, Ministry of Agriculture and Cooperatives, Bangkok.
Gordon, H.S. 1953. The economic theory of a common pmperty resource. J. Polit. Econ. 62 (April): 124-142.
Hongskul, V. 1978. Perspectives on fisheries resource management in the ASEAN region. Staff Paper No. 5. Marine
Fisheries Laboratory, Marine Fisheries Division, Department of Fisheries, Ministry of Agriculture and Cooperatives, Bangkok.
Hongskul, V. 1979. Marine fisheries resources and management problems in the ASEAN region. Thai Fish. Gaz.
32(3): 285-290.
Huntings Technical Services Ltd. 1974. Regional Planning Study, South Thailand Vol. 7, Fisheries.
Huvananda, D. 1973. The economics of fisheries. Thammasat University, Bangkok. M.S. thesis.
Jetanavanich, S. 1981. Supply and demand relationships in Thai fisheries. Department of Agricultural Economics,
Kasetsart University, Bangkok. M.S. thesis.
Kumpa, L. 1981. Production atid profitability analysis of small-scale fisheries: the case of Chumporn, 1978. Department of Agricultural Economics, Kasetsart University, Bangkok.
Marr, J.C. 1976. Fishery and resource management in Southeast Asia. RFFIPISFA Pap. 7, Resources for the Future,
Washington, DC.
Marr, J.C. 1978. Fishery management problems in Southeast Asia, p. 211-216. In D.M. Johnston (ed.) Reigonalization of the law of the sea. Ballinger Publishing Co., Cambridge, Massachusetts.
Marr, LC., G. Campleman and W.R. Murdoch. 1976. An analysis of the present, and recommehdations for future
fishery development and management policies, programmes and institutional arrangements for the Kingdom of
Thailand. SCS/76/WP/45. South China Sea Fisheries Development and Coordinating Programme, Manila.
Menasveta, D., S. Shindo and S. Chullasorn, 1973. Pelagic fishery resources oEthe South China Sea and prospects
for their development. SCS/DEV/73/6. South China Sea Fisheries Development and Coordinating Programme,
FAO, Rome.
Munro, J.L. and J. Polovina. 1984. Artificial reef project, Thailand. Report of a consulting mission, 24 November to
1 4 December 1984. International Center for Living Aquatic Resources Management, Manila, Philippines.
(Typewritten MS).
NESDB. 1977. Fourth National Economic and Social Development Plan 1977-81. National Economic and Social
Development Board, Government of Thailand, Bangkok.
NESDB. 1981. Fifth National Economic and Social Development Plan 1982-86. National Economic and Social
Development Board, Government of Thailand, Bangkok.
OAE. 1983. The economics of Thai marine fisheries. Office of Agricultural Economics, Ministry of Agriculture and
Cooperatives, Bangkok.
Panayotou, T. 1980. Economic conditions and prospects of small-scale fishermen in Thailadd. Mar. Policy 4(2):
142-146.
Panayotou, T. 1982. Management concepts for small-scale fisheries: economic and social aspects. FA0 Fish. Tech.
Pap. 228.53 p. (Also in French and Spanish)
Panayotou, T. 1983. Temtorial use rights in fisheries. In F A 0 expert consultation on the regulation of fishing
effort (fishing mortality) FA0 Fish. Rep. 289. Suppl. 2.
Panayotou, T. and D. Panayotou. 1986. Occupational and geographical mobility in and out of Thai fisheries. Bangkok. F A 0 Fisheries Technical Paper 271.
/'
Panayotou, T., K. Adulavidhaya, S. Artanchinda and S. Isvilanonda. 1982. Socioeconomic conditions of coastal
fishermen in Thailand: a cross-section profile, p. 301-334. In G.B. Hainsworth (ed.) Village level modernization in Southeast Asia: the political economy of rice and water. University of British Columbia Press, Vancouver.
Panayotou, T., T. Jitsanguan and K. Adulavidhaya. 1985. Cost structure and profitability of the Thai coastal fishery,
p. 163-183. In T. Panayotou (ed.) Small-scale fisheries in Asia: Socioeconomic analysis and policy. Intemational Development Research Centre, Ottawa, Canada.
Pauly, D. 1979. Theory and management of tropical multispecies stocks: a review with emphasis on Southeast Asian
demersal fisheries. ICLARM Studies and Reviews 2, 35 p. International Center for Living Aquatic Resourcgs
Management, Manila, Philippines.
Phasuk, B. 1978. General description of the pelagic fisheries in the Gulf of Thailand. Pelagic Fisheries Report No.
111978. Marine Fisheries Division, Department of Fisheries.
Reintrairut, S. 1979. Fisheries: an economic background of Thailand. Paper presented at the ASEAN Meeting on
Fishery Resource Management, 28 February-3 March 1979, Bangkok.
Reintrairut, S. 1983. Fisheries development planning system in Thailand. Department of Fisheries, Ministry of Agriculture and Cooperatives, Bangkok.
Scherer, F.M. 1970. Industrial market structure and economic performance. Rand McNally and Co., Chicago.
Scott, A.D. 1955. The fishery: the objectives of sole ownership. J. Polit. Econ. 6 3 (April): 116-124.
SCS. 1973a. The demersal fish stocks and fisheries of the South China Sea. SCS/DEV/73/3. South China Sea Fisheries Development and Coordinating Programme, FAO, ,Rome.
SCS. 1973b. Pelagic fishery resources of the South China Sea and prospects for their development. SCS/DEV/73/6.
South China Sea Fisheries Development and Coordinating Programme, FAO, Rome.
SCS. 1976. Report of the workshop on the fishery resources of Malacca Straits. Part 11. SCS/GEN/76/6. South China
Sea Fisheries Development and Coordinating Programme, Manila.
SCS. 1978a. Report of the workshop on the demersal resources of the Sunda Shelf. Parts I and 11. SCS/GEN/77/12,
13. South China Sea Fisheries Development and Coordinating Programme, Manila.
SCS. 1978b. Pelagic resource evaluation. Report of the workshop on the biology and resources of mackerels and
,round scads in the South China Sea. Part I. SCS/GEN/17. South China Fisheries Development and Coordinating
Programme, Manila.
Shindo, S. 1973. General review of the trawl fishery and the demersal fish stocks of the South China Sea. FA0 Fish.
Tech. Pap. No. 120.
Smith, I.R. and T. Panayotou. 1984. Territorial use rights and economic efficiency: the case of the Philippine fishing
concessions. F A 0 Fish. Tech. Pap. 245.17 p. (French and Spanish versions also published).
Tiews, K. 1965. Bottom fish resource investigation in the Gulf of Thailand and an outlook on further possibilities t o
develop the marine fisheries in Southeast Asia. Arch. Fischereiwiss. 16(1): 67-108.
Tiews, K. 1973. Fishery development and management in Thailand. Arch. Fischereiwiss. 24(1/3): 271-300.
l'okrisna, R., T. Panayotou and K. Adulavidhaya. 1985. Production teehnology and economic efficiency of the Thai
coastal fishery, p. 101-112. In T. Panayotou (ed.) Small-scale fisheries in Asia: socioeconomic analysis and
policy, International Development Research Centre, Ottawa, Canada.
Valencia, M.J. 1978a. The South China Sea: prospects for marine regionalism. Mar. Policy 2: 87-105.
Valencia, M.J. 197813. Southeast Asia: national marine interests and marine regionalism. Ocean Dev. Int. Law J.
5(4): 421-477.
Wattanavengpanit. 1979. Trend of Thai shrimp export. Chulalongkorn University, Bangkok. M.S. thesis.
Whiting, K.L. 1980. Oceans of discontent wash over Asia. Bangkok Post. 22 April 1980.
Appendix Table A.1. Annual catch (t), value (thousand baht) and price (bahtlkg) of major species o-f marine fish,
Thailand, 1971-1982.
Items
Quantity
Total fish
Pelagic fish
Demersal fish
Total shrimps and lobster
Total crab
Total squid and cuttlefish
Total molluscs
Total others
Grand total
Total fish
Pelagic fish
Demersal fish
Total shrimps and lobster
Total crab
Total squid and cuttlefish
Total molluscs
Total others
Grand total
Total fish
Pelagic fish
Demersal fish
Total shrimps and lobster
Total crab
Total squid and cuttlefish
Total molluscs
Total others
Grand total
Total fish
Pelagic fish
Demersal fish
Total shrimps and lobster
Total crab
Total squid and cuttlefish
Total molluscs
Total others
Grand total
1,246,197
Value
Pricea
Quantity
Value
Pricea
Appendix Table A.1. (Continued)
Items
Quantity
Value
Total fish
Pelagic fish
Demersal fish
Total shrimps and lobster
Total crab
Total squid and cuttlefish
Total molluscs
Total others
Grand total
Total fish
Pelagic fish
Demersal fish
Total shrimps and lobster
Total crab
Total squid and cuttlefish
Total molluscs
Total others
Grand total
-
: Nil or negligible.
Source : DOF, Fisheries Record of Thailand, various issues.
Pricea,
Quantity
Value
Pricea
4
Q\
Table A.2. Average price, catch per vessel and composition of catch of the Thai trawl fishery, 1969, 1974, 1977 and 1982.
Vessel class
Ave.
price
(bahtlkg)
Total
catch
(t)
EF
Composition (%)a
TI?
C
M
Ave.
price
(bahtlkg)
Total
catch
(t)
EF
Composition (%)
TF
C
M
Otter trawler
<14m
14-18 m
18-25 m
> 25m
Pair trawler
< 14m
14-18 m
> 18m
Weighted average
Percentage change
Otter trawler
<l4m
14-18 m
18-25 m
> 25m
Pair trawler
<14m
14-18 m
> 18m
Weighted average
Percentage change
1.74
2.89
2.29
5.41
2.72
4.45
2.64
2.85
(+33%)
77.5
230.8
510.0
1,174.3
308.6
322.8
699.6
223.3
(+I%)
n.a. Figures not available.
'Figures for 1969 not available. The indicated percentages are based on catches during June-December 1970 reported in Department of Fisheries, The Statistical Tables on Marine Fisheries 1970.
b ~ h figures
e
for edible fish in 1982 include crustaceans and molluscs.
Notation: EF = edible fish; TF = trash fish; C = crustaceans; and M = molluscs.
Sources: 1969 catch figures based o n the results of the '1969 Cost and Earnings Survey' reported in Marr et al. (1976); these figures are too low by comparison with those reported in DOF (1969): 118.6, 127.1, 516.9, 363.6 and 1,054.8 in the above order;still other figures, in between, are found in
DOF (1971). These discrepancies cannot be reconciled, a rather 'typical' feature of the Thai Fisheries Statistics. In this and other tables related t o
cost and earnings we follow the Cost and Earnings Surveys.
1974 and 1977 figures on catch and its composition from DOF (1979); 1982 figures from OAE (1983).
Average price: (gross) revenues/catch (see Table A.4 for revenues and figures above for catch).
Table A.3. Average cost (baht) and catch per unit of effort (kg), Thai trawl fishery, 1969, 1974, 1977 and 1982.
Vessel class
Otter trawler
< 14m
14-18 m
18-25 m
>
25m
Pair trawler
< 14 m
14-18 m
> 18m
Otter trawler
< 14m
14-18 m
18-25 m
>
25m
Pair trawler
< 14m
14-18 m
> 18m
n.a.
( )
Kg of
fish
Average costa per
Fishing
hour
Standard
hourb
Catch per
fishing
hour
Kg of
fish
12.30
n.a.
n.a.
259.50
n.a.
146.70
n.a.
n.a.
147.20
n.a.
61.75
n.a.
n.a.
142.17
n.a.
5.85
(+550%)
2.35
2.33
(+156%)
630.60
(+64%)
589.05
(+28%)
799.82
(-28%)
143.32
(-7 4%)
281.75
(+28%)
183.93
(-15%)
121.90
(+270%)
84.40
(-14%)
169.38
(-29%)
Average costa per
Fishing
Standard
hour
hourb
Catch per
fishing
hour
2.67
n.a.
1.17
n.a.
1.17
n.a.
n.a.
n.a.
0.90
n.a.
n.a.
0.91
n.a.
384.95
(+243%)
459.74
1,109.85
(+328%)
545.83
(+272%)
219.51
217.35
(+48%)
n.a.
n.a.
973.35
(+65.24)
n.a.
n.a.
n.a.
n.a.
213.87
(-24%)
n.a.
n.a.
32.92
(-47%)
97.61
238.00
(+67%)
1.86
(-5%)
2.55
(+12%)
1.77
(-20%)
2.50
(+24%)
1.85
(-63%)
3.63
(+54%)
2.37
(+2%)
n.a.
n.a.
5.33
(+46.83)
n.a.
n.a.
n.a.
n.a.
183.15
(+117%)
n.a.
n.a.
Data not available.
Figures in brackets give the percentage change from the previous reported year as given above. For example the drop in the cost per kg of fish by 27%
between 1969 and 1974 is indicated as (-27%) below the 1974 figure.
aAverage cost includes all costs except the opportunity cost of capital.
b ~ t a n d a r dhour is obtained as the catch per commercial vessel divided by catch per. unit of research vessel Pramong I1 in the Gulf of Thailand.
Note that this is not completely legitimate since many vessels, especially the larger ones fish outside Thai waters.
Source : Total cost from Table A.4 below; catch per vessel from Table A.2 above; fishing hours from DOF (1969) and catch per hour by the research vessel
Pramong I1 from Table 8.2.
Table A.4. Annual revenues, costs and profits (in thousand baht) per unit of the Thai trawl fishery, 1969, 1974, 1977 and 1982.
Vessel classa
Otter trawler
<14m
14-18 m
18-25 m
> 25m
Pair trawler
< 14m
14-18 m
> 18m
Revenuesb CostsC profitsd
Revenuesb CostsC
profitsd
Revenuesb
CostsC profitsd
Revenuesb
CostsC
profitsd
153.7
173.9
462.3
n.a.
137.8
149.1
444.4
n.a.
15.9
24.8
17.9
n.a.
148.9
372.5
1,030.4
2,566.2
144.0
427.5
945.5
2,141.2
4.9
-55.0
84.9
425.0
135.4
667.3
1,168.1
6,357.0
144.5
589.1
902.9
4,352.3
-9.1
78.2
265.2
2,004.7
n.a.
1,862.6
4,356.4
n.a.
n.a.
1,336.2
3,247.6
n.a.
n.a.
526.4
1,108.8
n.a.
407.7
n.a.
1,002.7
296.1
n.a.
755.4
111.6
n.a.
247.3
233.3
766.1
1,220.4
356.0
823.7
1,212.4
-122.7
-57.6
8.0
840.5
1,436.9
1,853.0
570.6
1,173.4
1,660.1
269.9
263.5
174.9
n.a.
3,025.0
n.a.
n.a.
2,539.7
n.a.
n.a.
435.3
n.a.
type of gear (otter trawler and pair trawler) and size (length) of vessel in meters (m).
b ~ h annual
e
revenues for 1974 and 1977 were obtained by multiplying the monthly date on earnings, given in the sources below, by the number of fishing
months for each vessel class (9.3, 11.8, 11.0, 11.7, 11.0,ll.O and 11.0, respectively) obtained from the 1977 survey (see below).
'costs including operating costs (crew remuneration, fuel, oil, ice, containers and other running expenses), maintenance of hull and engine, repair and
renewal of gear, fees and charges; and depreciation cost; but, they exclude the opportunity cost of capital. The annual costs were obtained as follows: for 1977
the monthly cost figures given in the sources (below) were multiplied by the number of fishing months (see 'a' above) after subtracting the 'opportunity cost of
capital' for 1974 the monthly depreciation and 'other running expenses' were first made comparable t o those of 1977 by using fishing months rather than
calendar months before multiplication of the reported total monthly costs with the number of fishing months to obtain the annual costs; for 1969, annual
figures were available.
d ~ r o f i t (=
s revenues - costs) are, thus, gross of the opportunity cost of capital.
n.a. =; Not available.
Sources: DOF (1974); Reintrairut (1979) and Costs and Earnings Surveys, 1969 (unpublished data). The 1974 survey has been published under the title The
Results of Cost and Earnings Survey of Major Marine Fisheries 1974. The 1969 figures are from Marr et al. (1976), while the 1977 figures are from
Rientrairut (1979) and DOF (1979a). The 1982 figures are from OAE (1983).
Table A.5. Average current value of fishing assets and capital cost estimates (in thousand baht) per fishing unit of the Thai trawl fishery, 1969, 1974, 1977 and
1982.
Vessel class
1969
Current value Capital cost
1974
Current value Capital cost
1977
Current value Capital cost
1982
(Current value + Capital cost)/2
Otter trawler
<14m
14-18 m
18-25 m
> 25m
Pair trawlera
<14m
14-18 m
> 18m
65.3
187.0
419.3
700.0
-
-
95.3
264.8
569.5
274.0
-
950.0
132.1
922.6
1,313.4
378.4
-
2,190.5
n.a.
829.7
n.a.
a ~ opair
r trawlers a fishing unit is made u p of two vessels while for otter trawlers a fishing unit is made up of one vessel.
Sources: Current value for 1974 and 1977 and capital cost for 1969 and 1974 we from the Costs and Earnings Surveys (unpublished data), DOF (1974) and
Reintrairut (1979) (the former two series directly; the latter two through Marr et al. (1976). Current value 1969 and capital cost 1977 calculated
on the basis of the 1974 relationship between current value and capital cost, an assumption tenable on the grounds that increases in the capital cost
of (new) vessels would be reflected in the current valuations of existing vessels and vice versa. Note that in the 'Cost and Earning Surveys' the current
value of fishing assets was obtained by dirtctly questioning the fishermen as to how much they could sell their boat, engine and other equipment.
Capital cost, on the other hand, represents the purchasing (or construction) cost of the Tied assets; by the way, this cost has been recovered from
the 1969 and 1974 surveys by Marr et al. (1976). It must represent the original cost rather than the current market cost of the fishing asset. The
current value and capital cost of fishing assets for 1982 was not presented directly in the OAE (1983). The average value of fishing assets can be
calculated indirectly from the opportupity cost of capital shown in this report.
Table A.6. Annual fishing operation of demersal fishing gear, 1982 survey.
-
-
-
-
-
Otter trawlers
14-18 m
18-25 m
Pair trawlers
14-18 m
Research vessel
Pramong I1
Sample size
Total catchlunit (t)
% Edible fish
% Trash fish
Total effortlunit
No. of tripslyear
No. of monthslyear
No. of daysltrip
No. of hourslyeara
No. of standard
hours/ earb
Average catchieffort (kg)
Catchltrip
Catch/hour
Total costlunit (@ x
lo6 )
Average cost (baht)
Per kg of fish
Per trip
Per hour
a ~ i s h i n ghourslday of the sample fishing gear obtained from the DOF "The Marine
Fisheries Statistics based o n the sample survey 1982" (unpublished preliminary results):
No. of hourslyear = (hours/day) x (daysltrip) x (triplyear).
b ~ i g u r e can
s be obtained by dividing total catch by Pramong I1 CPUE.
Source : Calculated from OAE (1983).
Table A.7. Number of vessels, catch and fishing effort of otter trawlers by size of vessels,
all fishing grounds 1982.
No. of vessels
Catch (t)
No. of hours/
vessel/ y ear
No. of days/
vessel/ year
No. of trips/
vessel/ year
Hourslday
Days/trip
Catch/vessel (t)
Catchlhour (kg)
5,219
221,375
2,406
344,614
1,529
260,535
204
90,864
1,130
2,461
1,593
2,550
97
159
108.8
176.3
60
11.6
1.6
42.4
37.5
34.4
15.5
4.6
143.2
58.2
12.4
14.6
8.8
170.4
106.9
9.7
14.5
18.2
445.4
174.7
Source : DOF "The Marine Fisheries Statistics based on the sample survey 1982" (unpublished preliminary results).
Table A.8. Number of vessels, catch and fishing effort of pair trawlers by size of vessels,
all fishing grounds, 1983.
No. of vessels
Catch (t)
No. of hours/
vessel/ year
No. of days/
vessel/ year
No. of tripsf
vessel/ year
Hours/day
Days/ trip
Catch/vessel ( t )
Catch/hour (kg)
Source : DOF "The Marine Fisheries Statistics based on the sample survey 1982" (unpublished preliminary results).
Table A.9. Catch, effort, revenue, cost and profits of selected trawlers. based on the 1982
survey by the Office of Agricultural Economics.
Otter trawler
14-18 m
18-25 m
Pair trawler
14-18 m
Weighted
average
No. of vessels
Catch per vessel (t)
Trash fish as a % of
catch
Effort per vessel (hr)
Effort per vessel
(standard hr)
Cost per unit of
effort (@/sthr)
CPUE (kg/hr)
CPUE (kg/hr)
Catching power index
Price (bahtlkg)
Cost (bahtlkg)
Profit (bahtlkg)
Revenues per vessel
(B x lo3
Costs per vessel
(v
lo3
Profits per vessel
(BX l o 3 )
Capital per vessel
(BX lo3
Return (% 0)
Net profit er vessel
(Bx 1 0 )
P
Source : Number of vessels from Table 5.4. The rest calculated from data given in OAE
(1983).
Table A.lO. Catch. effort, revenues, costs, and proflts (in thousand baht) of the Thai trawl fbhery for selected years (alternative
estimates for 1982).
Year
No. of
vessels
Total
catch
(t x 103)
Total
effort
(hr)
Total
revenues
Total
costs
Profits
Capital 1
Capital 2
Net
profits 1
Net
profits 2C
%he 1982 figures include otter trawlers 14-18 m and 18-25 m and pair trawlem 14-18 m. while the 1969. 1974 and 1977 figures
include also otter trawlers < 14 m and > 25 m and pair trawlers < 1 4 m and > 18 m. Not only are the 1982 figures not strictly
comparable to the three earlier years but they should *be
regarded with caution since they are derived from different sources.
1 = profits minus opportunity cost of capital assumed to be 20% capital 1 (= current value of fishing assets).
b ~ eprofits
t
=Net profits 2 = profits minus opportunity cost of capital assumed to be 20% of capital 2 (= original purehae value of fishing
arset3.
Source : The 1982 figures were calculated from Table A.9. The 1969,1974 and 1977 figures are reproduced here from Table 5.1
for comparison with the 1982 figures.


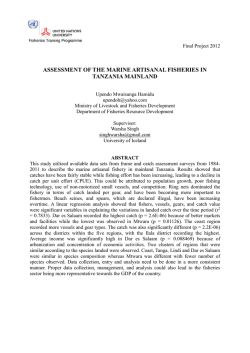


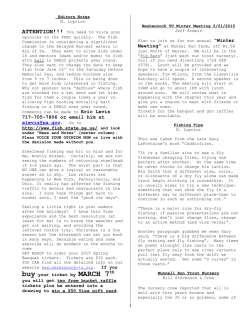

© Copyright 2026