
The Work-Life Conflict and Well-Being of Turkish
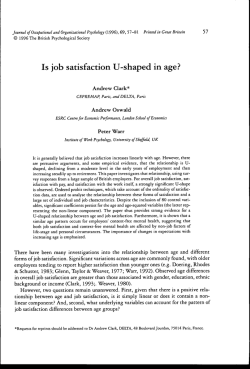
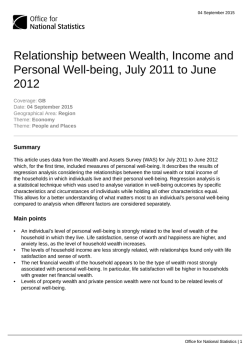
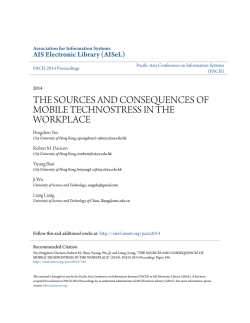
Ekonomi-tek Volume / Cilt: 3 No: 1 January / Ocak 2014, 57-76
The Work-Life Conflict and Well-Being of
Turkish Employees
Cem Başlevent*
Abstract
Using data drawn from the 2004 European Social Survey, we examine the
determinants of the life satisfaction of employees in Turkey. The data reveal
that the majority of Turkish wage and salary earners are either under- or overemployed. About half of Turkish workers have to work longer than they desire, so, unsurprisingly, the share of workers who say they are pleased with
their work schedules is only 22%. Gender turns out to be closely linked with
the hours-mismatch status, as the level of over-employment is eight percentage points higher among female workers than male. Ordered probit-model
estimates reveal that over-employment (measured as the difference in the
actual and preferred weekly number of hours) has a negative impact on wellbeing. We failed to turn up a statistically significant finding for underemployment, which we attribute to the small sample size. We also find no
statistically meaningful difference in the impact on male versus female employees of the work-hours mismatch. This suggests that the gender differences
that would have been expected in this context are already incorporated into
the respondents' subjectively determined desired hours of work. In addition,
we find that family-to-work conflict is less common, but has a larger impact
on well-being than work-to-family conflict.
JEL codes: C25, I31, J21, J22
Keywords: Life satisfaction, work-life conflict, Turkey, European Social
Survey
*
Istanbul Bilgi University, Santral, Eyüp, 34060 Istanbul, Turkey [email protected],
Tel: +90 212 311 5204
58
Ekonomi-tek Volume / Cilt: 3 No:1 January / Ocak 2014
1. Introduction
A widespread concept in the well-being literature is “work-life conflict,”
which refers to the distress caused by the difficulty in allocating adequate time
to the labor market on the one hand and leisure or household activities on the
other. A large body of empirical literature provides evidence that deviations of
actual hours of work from desired hours are common among the employed in
many countries, and that these “work-hours mismatches” are responsible for
reductions in the overall life satisfaction of employees (Bell and Freeman,
2001; Böheim and Taylor, 2004; Clark, 2005; Dickens and Lundberg, 1993;
Euwals and Van Soest, 1999; Grözinger et al., 2008; Heineck and Möller,
2012; Holly and Mohnen, 2012; Jacobs and Gerson, 2004; Reynolds, 2004;
Reynolds and Aletraris, 2006; Stewart and Swaffield, 1997; Stier and LewinEpstein, 2003).
The empirical evidence on whether positive or negative deviations from
desired hours lead to greater losses in life satisfaction are mixed. Wooden et
al. (2009) state that over-employment is a more serious problem than underemployment, but Wunder and Heineck (2013) argue that under-employment
causes a stronger reaction in well-being, particularly among males. The explanation Wunder and Heineck offer for this is that under-employed individuals are deprived of the utility gains arising from monetary and non-monetary
job aspects, such as the potential for developing skills and the social interaction with colleagues or customers.
Regarding the gender differences in the impact of the work-life conflict on
life satisfaction, Başlevent and Kirmanoğlu (2014) report that the lifesatisfaction effect of the hours mismatch is the same for male and female
workers, i.e., the reduction in life satisfaction for each hour of deviation from
desired hours is statistically the same. Since female employees are expected to
place more importance on being able to combine work and family responsibilities than males—which is logical because many time-consuming household activities are performed by women—one would initially think that reductions in life satisfaction due to hours mismatches should be greater for
females. Başlevent and Kirmanoğlu explain this by showing that the absolute
difference between the actual and desired hours of work variables is as an
accurate measure of the extent of the work-life conflict, such that any gender
differences that exist are captured by this variable.
Using a cross-section of 25 European countries, Boye (2009) focuses on
the gender differences in the association between paid and unpaid working
hours and well-being. The results indicate that women’s well-being increases
Cem Başlevent
59
with a higher number of paid working hours and decreases with a rise in
housework hours. Gender differences in time spent on paid work and housework account for a third of the European gender difference in well-being and
are thus one reason that women are found to have lower well-being than men
(Frankenhaeuser et al., 1989; Karasek et al., 1987; McDonough and Walters,
2001; Mirowsky and Ross, 1995). These findings are also in line with those
obtained elsewhere where housework hours are associated with higher levels
of stress among women (Coltrane, 2000; Glass and Fujimoto, 1994; Roxburgh, 2004).
One strand of the well-being literature has focused on whether work-tofamily or family-to-work conflicts have more influence on life satisfaction. As
explained in Gareis et al. (2009), work-life (or work-family) conflict is a bidirectional term that covers both work-to-family and family-to-work conflict.
For example, long work hours may predict work-to-family conflict, whereas
heavy elder-care demands may point to family-to-work conflict. Gutek et al.
(1991), Frone et al. (1992), and Voydanoff (2005) are among the studies that
have shown that each direction of influence can have various antecedents and
consequences.
As is clear from the above literature review, the work-life conflict and its
implications have been widely studied; however, similar studies on Turkish
workers have not been carried out due to the lack of data on actual and preferred hours of work. To the best of our knowledge, the ESS-2004 (to be presented in the next section) is the only survey in which this information is
available for Turkish workers, and it has not been applied to the issue of life
satisfaction. According to an OECD report, Turkey is by far the country with
the highest proportion of employees working very long hours, with almost
half of them regularly putting in over 50 hours a week (OECD, 2010). Thus, it
is likely that a large proportion of Turkish workers are unhappy about their
work hours and that major life-satisfaction effects of over-employment are
present.
The purpose of the current study, therefore, is to present the descriptive
patterns of the prevalence of over- and under-employment in Turkey and to
produce empirical evidence of the impact of these hours mismatches on the
life satisfaction of Turkish employees. As in Başlevent and Kirmanoğlu
(2014), we observe whether the life-satisfaction effects of over- and underemployment are the same and whether the magnitude of their effect differs for
male and female workers. In addition, we make use of the relevant survey
items in the European Social Survey to test whether work-to-family or familyto-work conflicts have more of an impact on well-being. Our hope is to be
able to complement the empirical findings in the existing literature by using
60
Ekonomi-tek Volume / Cilt: 3 No:1 January / Ocak 2014
data for a predominantly Muslim country where the female labor-participation
rate is quite low, the labor market is relatively inflexible, and traditional views
about the division of labor within the household are still highly common.
2. The Data and Research Methodology
The data used in the empirical study will be drawn from the second round
1
of the European Social Survey (ESS). Turkey is one of the 26 countries that
took part in the 2004 survey. The ESS is a cross-country survey conducted
biannually since 2002 to monitor attitudes and behaviors across countries and
over time. In the main questionnaire, there are several questions whose aim is
to measure the life satisfaction of the respondents; there are also questions
designed to elicit the respondents’ labor-market involvement. The second
round of the survey also includes a rotating module titled “Work, Family, and
Well-being.”2 The aim of the module is to examine theoretical claims about
the factors affecting work, family experience, and well-being in Europe. It
inquires about the ideal hours that people would like to work. The exact
wording of the survey question is as follows:
“How many hours a week, if any, would you choose to work, bearing in mind
that your earnings would go up or down according to how many hours you
work?”
In measuring the extent to which ideal hours deviate from the actual time
spent in the labor market, we bring this bit of information together with the
response provided to another survey question, worded as follows:
“Regardless of your basic or contracted hours, how many hours do/did you
normally work a week (in your main job), including any paid or unpaid overtime?”
In the empirical work, we will first carry out a descriptive analysis in
which we will note the mean values of actual and desired weekly hours of
work and weekly hours spent on housework. Due to the small number of female respondents in other employment states (i.e. self-employment and unpaid family work), our sample will be restricted to respondents who are currently engaged in paid work as an employee. Students and those with permanent disabilities will likewise be excluded from the sample. We will also include the shares of those doing housework among married and non-married
women as well as those with and without children. We will then estimate a
1
2
The data set is available at http://ess.nsd.uib.no/ess/round2/.
The same module was repeated in the fifth round of the survey in 2010, but Turkey was not
among the participating countries.
Cem Başlevent
61
single equation model that examines whether and how individual characteristics explain the overall life satisfaction of an individual. The responses to the
question on overall life satisfaction, which will serve as our measure of wellbeing and the dependent variable of our model, are given on an 11-point scale,
from 0 to 10, with larger values indicating greater satisfaction. The wording of
the related survey item is as follows:
“All things considered, how satisfied are you with your life as a whole
nowadays?”
Since the given scores have a clear ordering, the ordered probit model is an
appropriate estimation technique to be utilized in this context. Altough probability interpretations are complex, the interpretation of the coefficients on the
explanatory variables is the same as in standard regression models: positive
coefficients imply a positive association between life satisfaction and the variable in question.
A straightforward way of observing the impact of the hours mismatch,
which is a key variable of interest, on life satisfaction is to use a dummy variable that indicates the “matched” respondents whose actual and desired hours
are the same. This variable can be interacted with the female dummy to see if
any gender differences exist. Another way of measuring the impact of the
hours mismatch on life satisfaction is to use an explanatory variable that
equals the absolute difference between actual and desired hours of work.
However, in order to determine the possible differences between the effects of
under- and over-employment, we constructed two separate deviation variables
that indicate negative and positive deviations from desired hours. For example, in the case of an over-employed person whose actual weekly hours of
work are three hours more than his/her desired hours, the “positive deviation”
variable takes on the value of 3 while the “negative deviation” variable takes
on the value of zero. In the case of “matched” individuals, both the “positive
deviation” and “negative deviation” variables take on the value of zero. These
two deviation variables are also interacted with the “female” dummy to see if
the life-satisfaction effects of hours mismatches differ by gender.
The two survey items that relate to the respondents’ self-evaluation of the
amount of their work-to-family or family-to-work conflicts are worded as
follows:
62
Ekonomi-tek Volume / Cilt: 3 No:1 January / Ocak 2014
“How often do you..
..find that your job prevents you from giving the time you want to your
partner or family?
..find it difficult to concentrate on work because of your family
responsibilities?
Using these items, we generated two indicators for those whose response
to these questions was “never” or “hardly ever.” The first one is meant to
account for the presence of work-to-family conflict, while the second is expected to reveal the extent to which family-to-work conflict is present. Since
these variables are likely to be correlated with the difference between actual
and desired hours, we will estimate our model with and without them and see
if other patterns emerge.
In building our empirical model, we will rely on the conclusions of existing studies of the relationship between life satisfaction and a wide range of
variables. As far as the role of basic demographics is concerned, we control
for a U-shaped level of life satisfaction throughout the life cycle. Previously
conducted studies report that women have higher life-satisfaction levels than
men, as do married people compared to others. Education has also been
shown to be an important socio-demographic determinant that is positively
associated with life satisfaction. However, this pattern may have more to do
with the higher levels of income that usually accompany more schooling.
Being in good health and subjective well-being have also been found to be
positively and significantly related.3
Thus, the individual characteristics controlled for in the model will include
the gender and the age of the respondent along with “age squared” to allow
for the possibility of a non-linear relationship. Education will be measured
using a continuous variable that equals the years of full-time education completed. Economic well-being will be controlled for using a household-income
variable measured on a 10-point scale (from 1 to 10), such that larger values
correspond to higher incomes. The subjective general health of the respondents will be measured on a scale from 1 to 5, such that larger values indicate
better health. The ESS data identify individuals who live with a partner
3
Empirical studies that report significant associations between these variables and life satisfaction include Albert and Davia (2005), Alesina et al. (2004), Becchetti et al. (2006),
Blanchflower and Oswald (2004, 2008), Clark (1997), Clark and Oswald (1994), Cuñado
and Pérez de Gracia (2012), Easterlin (1974, 2001), Frey and Stutzer (2002), Hayo (2004),
Hooker and Siegler (1993), McBride (2001), Okun et al. (1984), Peck and Merighi (2007),
and Yang (2008).
Cem Başlevent
63
(which includes husbands/wives), which is probably a more relevant indicator
than marital status in the European context, but since cohabiting is rare in
Turkey, we will use the married vs. non-married distinction.
The survey item we use to control for financial well-being is the respondents’ feelings about the income of their household. A categorical variable is
derived from the question worded and responded to as follows:
“Which (is the) closest to how you feel about your household’s income
nowadays?”
Living comfortably on present income = 1
Coping on present income = 2
Finding it difficult on present income = 3
Finding it very difficult on present income = 4
Our ordered probit model, in which the level of life satisfaction is the dependent variable, is estimated on the pooled sample of male and female workers to ensure that the sample size is not too small to obtain reliable results and
also that gender differences can be tested formally. Along with the gender
variable, the model includes several interaction terms in order to be able to
observe whether there are statistically significant gender differences in how
life satisfaction relates to the key factors considered in our analysis.
3. Empirical findings
We begin the presentation of the empirical findings by summarizing the
basic patterns of the work-hours mismatch in our sample of employees drawn
from the ESS. Unfortunately, we need to work with a relatively small sample
of 294 workers, 213 of whom are males. About half of the women in the
working sample are married as opposed to 73% of the men. The larger share
of married workers among males is consistent with the general pattern of
many Turkish women dropping out of the labor force after marriage.
The figures given in Table 1 reveal that the share of matched workers in
the full sample is only 22%, while about half the workers are over-employed.
Marital status does not appear to have a big impact on the hours-mismatch
status, but the share of matched workers in the subsample of single respondents is somewhat larger, at 25%. Gender, on the other hand, has a notable
impact on the hours-mismatch status, as the share of over-employment is eight
percentage points higher among female workers than men. Also, the share of
under-employed women is 11 percentage points lower than the corresponding
figure for men. Similar figures are obtained when gender differences are
measured among single and married workers separately.
64
Ekonomi-tek Volume / Cilt: 3 No:1 January / Ocak 2014
Table 1. Hours-mismatch status by gender and marital status
(Sample shares in %)
Single
Married
All
Male
Female
All
Male
Female
All
Male
Female
All
Under-employed
29.3
19.5
25.3
31.0
20.0
28.7
30.5
19.8
27.6
Matched
25.9
24.4
25.3
19.4
22.5
20.0
21.1
23.5
21.8
Over-employed
44.8
56.1
49.5
49.7
57.5
51.3
48.4
56.8
50.7
Calculating the difference between actual and desired weekly hours by
hours-mismatch status (see Table 2), we find that desired hours per week exceed actual hours by almost 18 hours among the under-employed, with the
difference among the over-employed being just as large. On the whole,
weekly actual hours exceed desired hours by 4.1.
Table 2. Average actual and desired hours by hours-mismatch status
Actual hours
per week (A)
Desired hours
per week (B)
Difference between
A and B
Under-employed
34.2
52.0
-17.8
Matched
45.6
45.6
0
Over-employed
56.6
38.8
17.7
All
48.0
43.9
4.1
The more detailed information on actual and desired hours by gender and
marital status presented in Table 3 reveals that there is almost no difference in
the actual weekly working hours of single male and female workers. However, married men work five hours more than their female counterparts. Due
to the fewer hours that married women would like to work (= 37), the gap
between actual and desired hours is wide in their case. However, the gap is
even larger among single females, whose desired weekly hours are only 42, as
opposed to 47 among single men.
It might be argued that the average of the absolute value of the difference
between actual and desired hours is a more informative measure of the hours
mismatch, as it ensures that positive and negative deviations do not cancel
each other out. It turns out that the absolute difference is quite uniform across
genders and marital statuses, with averages of around nine hours. What this
result implies is that if the life-satisfaction effect of under-employment is
close to that of over-employment, we may not see substantial differences in
the satisfaction levels between males and females and between the single and
the married. In fact, the average figures reported in the last column of Table 3
reveal that the life satisfaction of males exceeds that of females by 0.2, while
65
Cem Başlevent
the same difference exists between married and single respondents. Nevertheless, it remains to be seen in the regression context whether the hours mismatches or demographic factors have more to do with life satisfaction.
Table 3. Difference between actual and desired hours by gender
and marital status
Male
Single
Married
All
Female
Single
Married
All
Frequency
Actual
hours per
week (A)
Desired
hours per
week (B)
Difference
between
A and B
Absolute
difference
between
A and B
Life
satisfaction
58
155
213
49.8
48.1
48.6
46.6
45.2
45.6
3.1
3.0
3.0
8.8
8.9
8.9
6.2
6.4
6.3
41
40
81
49.8
43.2
46.5
42.3
37.0
39.7
7.5
6.2
6.9
9.3
9.1
9.2
6.0
6.2
6.1
Another way of examining the distribution of actual and desired weekly
hours in the sample is to make use of histograms that display the amount of
dispersion in these variables.
In Figures 1 and 2, where actual and desired weekly hours presented are by
gender, we observe that the distribution of both variables is similar in the male
and female subsamples. One noteworthy finding here is that about one-third
of both male and female workers would like to have a standard 40-hour
workweek, whereas only about one-fifth of workers are at the 40-hour mark.
In Figures 3 and 4, where actual and desired weekly hours are presented by
gender and marital status, we find that both variables are similarly dispersed
in the male and female subsamples. While part-time work is more common
among married women than singles, the standard workweek is more often the
case among married men. Single men are more likely to have excessive
working hours. In terms of desired hours, married male respondents are more
likely to desire the standard 40-hour workweek, while singles are more likely
to prefer to work longer hours. This is probably because they want to accumulate savings before getting married. Nearly 40% of single women desire
the standard 40-hour workweek, whereas part-time work is a more desirable
option for married women, as would be expected.
66
Ekonomi-tek Volume / Cilt: 3 No:1 January / Ocak 2014
Figure 1. Actual weekly hours by gender
Female
.1
0
.05
Fraction
.15
.2
Male
0
10 20 30 40 50 60 70 80 90 100
0
10 20 30 40 50 60 70 80 90 100
Actual weekly hours
Graphs by Gender
Figure 2. Desired weekly hours by gender
Female
.2
.1
0
Fraction
.3
Male
0
10 20 30 40 50 60 70 80 90 100
0
10 20 30 40 50 60 70 80 90 100
Desired weekly hours
Graphs by Gender
67
Cem Başlevent
Figure 3. Actual weekly hours by gender and marital status
Single, Female
Married, Male
Married, Female
0
.3
0
.1
.2
Fraction
.1
.2
.3
Single, Male
0
10 20 30 40 50 60 70 80 90 100
0
10 20 30 40 50 60 70 80 90 100
Actual weekly hours
Graphs by Lives with husband/wife/partner at household grid and Gender
Figure 4. Desired weekly hours by gender and marital status
Single, Female
Married, Male
Married, Female
0
.4
.2
0
Fraction
.2
.4
Single, Male
0
10 20 30 40 50 60 70 80 90 100
0
10 20 30 40 50 60 70 80 90 100
Desired weekly hours
Graphs by Lives with husband/wife/partner at household grid and Gender
68
Ekonomi-tek Volume / Cilt: 3 No:1 January / Ocak 2014
The figures given in Tables 4a and 4b reveal that marital status does not
much influence the prevalence of either work-to-family or family-to-work
conflict: about half of both married and single employees never (or hardly
ever) experience work-to-family conflict, while the corresponding figure for
family-to-work conflict is around 60%.
Gender, on the other hand, greatly affects the distribution of the conflict
variables when the sample is broken down by marital status, especially in the
case of work-to-family conflict. The share of those never experiencing workto-family conflict is 20 percentage points higher among single female workers
than among single men. Among married workers, however, the figure for
females is 20 percentage points lower.
Table 4a. Frequency of work-to-family conflict (sample shares in %)
Single
Married
All
Male
Female
All
Male
Female
All
Male
Female
All
Never
30.2
50.0
39.0
39.5
20.0
35.4
37.4
33.8
36.4
Hardly ever
11.6
8.8
10.4
16.5
17.5
16.7
15.4
13.5
14.9
Sometimes
41.9
23.5
33.8
29.0
32.5
29.7
31.8
28.4
30.9
Often
14.0
8.8
11.7
9.9
20.0
12.0
10.8
14.9
11.9
Always
2.3
8.8
5.2
5.3
10.0
6.3
4.6
9.5
6.0
With respect to family-to-work conflict, the largest differentiation emerges
between married males and females: the share of those never experiencing
this type of conflict is 18 percentage points lower among female employees.
While there are no male workers reporting family-to-work conflict “often,”
the share among both single and married women is more than 10%.
Table 4b. Frequency of family-to-work conflict (sample shares in %)
Single
Married
All
Male
Female
All
Male
Female
All
Male
Female
All
Never
47.1
48.2
47.5
48.3
30.0
44.5
48.1
37.3
45.2
Hardly ever
23.5
25.9
24.6
23.2
25.0
23.6
23.2
25.4
23.8
Sometimes
29.4
11.1
21.3
27.8
32.5
28.8
28.1
23.9
27.0
Often
0.0
14.8
6.6
0.0
12.5
2.6
0.0
13.4
3.6
Always
0.0
0.0
0.0
0.7
0.00
0.5
0.5
0.0
0.4
Cem Başlevent
69
Econometric results
The ordered probit results derived for five different versions of the empirical model are presented in Table 5. In the first specification, labeled with (1)
in the table, the potential impact of work-life conflict is accounted for using
only the two dummy variables that indicate respondents who claim to be
never experiencing work-to-family and family-to-work conflict. In the second
specification, the impact of work-life conflict is measured by a dummy variable that indicates respondents whose actual and desired hours are the same.
This dummy is also interacted with the female dummy to learn whether gender differences exist. In the third specification, both sets of variables in (1)
and (2) are included. In the fourth specification, the impact of work-life conflict is accounted for using two continuous variables that equal the positive/negative deviations of actual hours from desired hours. Once again, both
variables are interacted with the female dummy to yield gender differences.
Specification (5) includes both the deviation variables and the conflict dummies in (1) and (3).
It turns out that the age, gender, years of education, and marital status of
the respondent do not have statistically significant effects on life satisfaction.
The self-reported health of the respondent, on the other hand, has a significant
positive effect in all versions of the model. The coefficients on the householdincome dummies all have the expected negative sign, and they get larger as
self-evaluations of the current economic situation of the household become
more negative. Of the two dummy variables that indicate respondents who
never experience work-to-family and family-to-work conflict, only the latter
is found to have a noticeable effect on life satisfaction. Apparently, family
responsibilities interfering with one’s work are a more important source of
distress for labor-market participants than the other way around. Given that
the fulfillment of family responsibilities involves interactions with people one
has stronger emotional ties with, it is to be expected that excessive amounts of
this type of conflict have greater repercussions for life satisfaction.
The dummy variable that indicates respondents whose actual and desired
hours are the same has the expected positive sign, but is not statistically significant, regardless of whether the conflict variables are included in the model
or not. Of the two continuous variables that measure the positive/negative
deviations of actual hours from desired hours, the one representing positive
deviations has a statistically significant negative sign, while the negativedeviations variable is statistically insignificant. Also insignificant are the interaction terms that measure the difference between male and female respondents with respect to the effect of the hours mismatch.
70
Ekonomi-tek Volume / Cilt: 3 No:1 January / Ocak 2014
Table 5. Ordered probit results
Age
Age sq.
Female
Years of education
Married
Health (1 to 5)
Household income
=2 (coping)
Household income
=3 (difficult)
Household income
=4 (very difficult)
Work-to-family (no conflict)
Family-to-work (no conflict)
(1)
(2)
(3)
(4)
(5)
-0.012
0.759
0.028
0.586
0.097
0.485
0.011
0.492
0.047
0.777
0.242
0.012
-0.407
0.056
-0.587
0.015
-0.650
0.037
-0.054
0.689
0.345
0.013
-0.009
0.817
0.023
0.644
0.030
0.849
0.008
0.622
0.105
0.521
0.250
0.009
-0.312
0.144
-0.469
0.051
-0.558
0.074
-0.017
0.672
0.033
0.522
0.046
0.771
0.009
0.585
0.068
0.682
0.244
0.011
-0.360
0.095
-0.538
0.027
-0.592
0.059
-0.056
0.679
0.328
0.018
0.138
0.447
0.212
0.507
-0.002
0.962
0.014
0.779
0.113
0.546
0.002
0.906
0.091
0.581
0.246
0.011
-0.373
0.080
-0.493
0.042
-0.698
0.028
-0.009
0.820
0.023
0.649
0.097
0.605
0.003
0.858
0.060
0.717
0.241
0.013
-0.422
0.050
-0.567
0.021
-0.725
0.023
-0.099
0.468
0.313
0.025
-0.012
0.040
-0.004
0.718
0.001
0.876
0.010
0.661
0.020
-0.011
0.053
-0.002
0.879
0.002
0.813
0.012
0.612
0.024
Matched
0.157
0.385
0.247
0.439
Female × Matched
Positive deviations
Female ×
Positive deviations
Negative deviations
Female ×
Negative deviations
Pseudo-R2
0.019
0.016
0.020
Note: The number of observations is 294. The dependent variable is “overall life satisfaction,”
with values ranging from zero to 10. The figures in each cell are the coefficients (top) and the
p-values of the two-sided tests of significance (bottom). The reference category for household
income dummies is “Living comfortably on present income (=1).” The threshold estimates have
been omitted from the output. The design weights available in the data set have been used to
obtain nationally representative figures.
Cem Başlevent
71
This finding is consistent with that of Başlevent and Kirmanoğlu (2014),
who find that the life-satisfaction effect of the hours mismatch is the same for
male and female workers. The interpretation of this result is that even though
female employees are expected to place more importance on being able to
combine work and family responsibilities than males, the absolute difference
between the actual and desired hours of work variables serves as an accurate
measure of the extent of the work-life conflict, with the result that any gender
differences that are present are captured by the deviation variable.4
4. Concluding Remarks
Our examination of micro data from the 2004 European Social Survey has
revealed that most Turkish wage and salary workers are under- or overemployed. The share of matched workers in the full sample was only 22%,
whereas about half the workers had to work longer than they desired. Gender
was found to be closely linked with the hours-mismatch status, as the share of
over-employment was eight percentage points higher among female workers
than male. Marital status, however, did not appear to change the hoursmismatch status—which was somewhat surprising, especially in the case of
women. Two factors seem to be contributing to this result: one is that married
women have shorter work hours than single women, and the other is that being an “employed and married” woman implies some degree of selectivity for
that state.
In view of the possibility of selection bias due to working with a sample of
employees only, it might be argued that the econometric models presented
here need to involve a selectivity correction to obtain reliable estimates. After
all, it is unlikely that employees constitute a random sample with respect to
the life-satisfaction effects of hours mismatches. Employees are not only
likely to have stronger preferences towards market work, but they are also
may be less distressed by the mismatch than the average person in the population. Furthermore, individuals whose desired and actual hours differed in the
past by very large amounts will probably have dropped out of employment.
However, given the practical difficulties of properly accounting for selectivity
bias and the fact that our estimates are meant to hold for actual labor-market
participants, we chose not to deal with the selection process into employment.
The key finding of the econometric work was that larger levels of mismatch in the over-employment direction are associated with greater reductions
4
The patterns observed in the empirical models remain unchanged when estimations are
repeated after the exclusion of health and income variables. Similar patterns are also
observed when the OLS method is used in place of Ordered Probit.
72
Ekonomi-tek Volume / Cilt: 3 No:1 January / Ocak 2014
in life satisfaction. These effects were not substantial, but still statistically
significant. The lack of a majorlife-satisfaction effect in the case of underemployment was an unexpected result in light of an earlier finding obtained
for a large sample of European countries. Assuming that the main reason
given by people for their unhappiness about being under-employed is their
inability to make enough money, we postulate that the household-income
variables included in the model mediate the relationship between underemployment and life satisfaction. In order to entertain this possibility, we reestimated the model after excluding the three income dummies. However, the
coefficient on negative deviations remained insignificant despite this exclusion. In view of this finding, we conclude that either under-employment does
not have a significant life-satisfaction effect in the case of Turkish employees
or the small sample size precludes us from observing it.
Our empirical work has provided concrete evidence of the presence of the
life-satisfaction effects of excessive working hours. However, data limitations
have prevented us from analyzing other possible consequences, such as losses
in labor-market productivity, long-term psychological and physiological
harm, and even the adverse implications for the quality of child-rearing. Such
potential outcomes can be the subject of further research in various fields. In
interpreting the results, one should also keep in mind the possibility of the
endogeneity of the outcome variable, i.e., that the subjective evaluations utilized as independent variables may have been influenced by the level of overall life satisfaction. It also remains to be seen whether working with larger
data sets leads to sharper empirical results that demonstrate the gender differences in this context as well as the differences between married and single
employees. Specially designed surveys should be instrumental in dealing with
these points as well as examining the life-satisfaction effects of job characteristics other than the work-hours conflict, such as informality, flexibility of
weekly hours, and discriminatory or hostile behavior against certain groups.
Cem Başlevent
73
References
Alesina, Alberto, Rafael Di Tella, and Robert MacCulloch, (2004), “Inequality and happiness: Are Europeans and Americans different?”, Journal of Public Economics, 88 (9-10), pp. 2009–2042.
Albert, Cecilia and Maria A. Davia, (2005), “Education, wages, and job satisfaction,” Paper presented at the Epunet-2005 Conference, Colchester,
UK.
Başlevent, Cem and Hasan Kirmanoğlu, (2014), “The impact of deviations
from desired hours of work on the life satisfaction of employees,” Social Indicators Research, 118 (1), pp. 33-43.
Becchetti, Leonardo, Stefano Castriota, and David A. Londoño Bedoya,
(2006) ,“Climate, happiness, and the Kyoto Protocol: Someone does
not like it hot,” CEIS Working Paper, No: 247.
Bell, Linda A. and Richard B. Freeman, (2001), “The incentive for working
hard: explaining hours-worked differences in the US and Germany,”
Labour Economics, 8 (2), pp. 181-202.
Blanchflower, David G. and Andrew J. Oswald, (2004), “Money, sex, and
happiness: an empirical study,” Scandinavian Journal of Economics,
106 (3), pp. 393-415.
Blanchflower, David G. and Andrew J. Oswald, (2008), “Is well-being Ushaped over the life cycle?”, Social Science & Medicine, 66 (8), pp.
1733-1749.
Boye, Katarina, (2009), “Relatively Different? How do Gender Differences in
Well-Being Depend on Paid and Unpaid Work in Europe?,” Social
Indicators Research, 93 (3), pp. 509-525.
Böheim, Rene and Mark P. Taylor, (2004), “Actual and preferred working
hours,” British Journal of Industrial Relations, 42(1), pp. 149-166.
Clark, Andrew E,(1997), “Job satisfaction and gender: why are women so
happy at work?”, Labor Economics, 4 (4), pp. 341-372.
Clark, Andrew E, (2005), “What makes a good job? Evidence from OECD
countries,” in: S. Bazen, C. Lucifora, W. Salverda (eds.), Job Quality
and Employer Behavior. Basingstoke: Palgrave Macmillan, pp. 11-30.
Clark, Andrew E. and Andrew J. Oswald, (1994), “Unhappiness and unemployment,” The Economic Journal, 104 (424), pp. 648-659.
74
Ekonomi-tek Volume / Cilt: 3 No:1 January / Ocak 2014
Coltrane, Scott, (2000), “Research on household labor: modeling and measuring the social embeddedness of routine family work,” Journal of
Marriage and the Family, 62 (4), pp. 1208-1233.
Cuñado, Juncal and Fernando Pérez de Gracia, (2012), “Does education affect
happiness? Evidence for Spain,” Social Indicators Research, 108 (1),
pp 185-196.
Dickens, William T. and Shelly J. Lundberg, (1993), “Hours restrictions and
labor supply,” International Economic Review, 34 (1), pp. 169-192.
Easterlin, Richard A, (1974), “Does economic growth improve the human lot?
Some Empirical Evidence,” in: P.A. David and M.W. Reder (eds.),
Nations and Households in Economic Growth: Essays in Honor of
Moses Abramovitz. New York: Academic Press, pp. 89-125.
Easterlin, Richard A, (2001), “Life-cycle welfare: trends and differences,”
Journal of Happiness Studies, 2 (1), pp. 1-12.
European Socail Survey, (2004), http://ess.nsd.uib.no/ess/round2/
Euwals, Rob and Arthur van Soest, (1999), “Desired and actual labour supply
of unmarried men and women in the Netherlands,” Labour Economics, 6 (1), pp. 95-118.
Frankenhaeuser, Marianne, Ulf Lundberg, Mats Fredrikson, Bo Melin, Martti
Tuomisto, Anna-Lisa Myrsten, et al., (1989), “Stress on and off the
job as related to sex and occupational-status in white-collar workers,”
Journal of Organizational Behavior, 10 (4), pp. 321-346.
Frey, Bruno S. and Alois Stutzer, (2002), Happiness and Economics. Princeton University Press, Princeton.
Frone, Michael R., Marcia Russell, and M. Lynne Cooper, (1992), “Antecedents and outcomes of work-family conflict: testing a model of the
work-family interface,” Journal of Applied Psychology, 77, pp. 65-78.
Gareis, Karen C., Rosalind C. Barnett, Karen A. Ertel, Lisa F. Berkman,
(2009), “Work-Family Enrichment and Conflict: Addi-tive Effects,
Buffering, or Balance?”, Journal of Marriage and Family, 71 (3), pp.
696-707.
Glass, Jennifer, and Tetsushi Fujimoto, (1994), “Housework, paid work, and
depression among husbands and wives,” Journal of Health and Social
Behavior, 35 (2), pp. 179-191.
Cem Başlevent
75
Grözinger, Gerd, Wenzel Matiaske, and Verena Tobsch, (2008), “Arbeitszeitwünsche, Arbeitslosigkeit, und Arbeitszeitpolitik,” SOEP Papers, No. 103, DIW Berlin.
Gutek, Barbara A., Sabrina Searle, and Lilian Klepa, (1991), “Rational versus
gender-role explanations for work-family conflict,” Journal of Applied Psychology, 76 (4), pp. 560-568.
Hayo, Bernd, (2004), “Happiness in Eastern Europe,” Marburg Working Papers on Economics 200412, Philipps-Universität Marburg.
Heineck, Guido and Joachim Möller, (2012), “Geschlechtsspezifisches Arbeitsmarktverhalten, Verdienste und Wohlbefinden im Familienkontext”, in: H. Bertram and M. Bujard (eds), Zeit, Geld, Infrastruktur –
zur Zukunft der Familienpolitik, Soziale Welt – Sonderband 19, Nomos, Baden-Baden.
Holly, Sarah and Alwine Mohnen, (2012), “Impact of working hours on
work–life balance,” SOEP Papers, No. 471, DIW Berlin.
Hooker, Karen and Ilene C. Siegler, (1993), “Life goals, satisfaction, and selfrated health: Preliminary Findings,” Experimental Aging Research, 19
(1), pp. 97-110.
Jacobs, Jerry A. and Kathleen Gerson, (2004), The time divide: Work, family,
and gender inequality. Cambridge: Harvard University Press.
Karasek, Robert, Bertil Gardell, and Jan Lindell, (1987), “Work and nonwork
correlates of illness and behavior in male and female Swedish whitecollar workers,” Journal of Occupational Behavior, 8 (3), pp. 187-207.
McBride, Michael, (2001), “Relative-income effects on subjective well-being
in the cross-section,” Journal of Economic Behavior & Organization,
45 (3), pp. 251-278.
McDonough, Peggy and Vivienne Walters, (2001), “Gender and health: reassessing patterns and explanations,” Social Science and Medicine, 52
(4), pp. 547-559.
Mirowsky, John and Catherine E. Ross, (1995), “Sex differences in distress—
real or artifact,” American Sociological Review, 60 (3), pp. 449-468.
OECD, (2010), “Labour Force Statistics: Summary tables,” OECD Employment and Labour Market Statistics (database). http://dx.doi.org/
10.1787/data-00286-en; and Swiss Federal Statistics Office.
Okun, Morris A., William A. Stock, Marilyn J. Haring, and Robert A. Witter,
(1984), “Health and subjective well-being: a meta-analysis,” International Journal of Aging and Human Development, 19 (2), pp. 111-132.
76
Ekonomi-tek Volume / Cilt: 3 No:1 January / Ocak 2014
Peck, Michael D. and Joseph R. Merighi, (2007), “The relation of social comparison to subjective well-being and health status in older adults,”
Journal of Human Behavior in the Social Environment, 16 (3), pp.
121-142.
Reynolds, Jeremy, (2004), “When too much is not enough: actual and preferred work hours in the United States and abroad,” Sociological Forum, 19 (1), pp. 89-120.
Reynolds, Jeremy and Lydia Aletraris, (2006), “Pursuing Preferences: The
Creation and Resolution of Work-Hour Mismatches,” American Sociological Review, 71 (4), pp. 618-638.
Roxburgh, Susan, (2004), “‘There just aren’t enough hours in the day’: the
mental-health consequences of time pressure,” Journal of Health and
Social Behavior, 45 (2), pp. 115-131.
Stewart, Mark B. and Joanna K. Swaffield, (1997), “Constraints on the desired hours of work of British men,” Economic Journal, 107 (441),
pp. 520-535.
Stier, Haya and Noah Lewin-Epstein, (2003), “Time to Work: A Comparative
Analysis of Preferences for Working Hours,” Work and Occupations,
30 (3), pp. 302-326.
Voydanoff, Patricia, (2005), “Work Demands and Work-to-Family and Family-to-Work Conflict: Direct and Indirect Relationships,” Journal of
Family Issues, 26 (6), pp. 707-726.
Wooden, Mark, Diana Warren, and Robert Drago, (2009), “Working-time
mismatch and subjective well-being,” British Journal of Industrial
Relations, 47 (1), pp. 147-179.
Wunder, Christoph and Guido Heineck, (2013), “Working-time preferences,
hours mismatch, and well-being of couples: are there spillovers?”,
Labour Economics, 24 (October), pp. 244-252.
Yang, Yang, (2008), “Social inequalities in happiness in the United States,
1972 to 2004: an age-period-cohort analysis,” American Sociological
Review, 73 (2), pp. 204-226.


© Copyright 2026