
View/Open - AgEcon Search
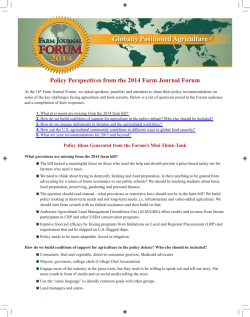
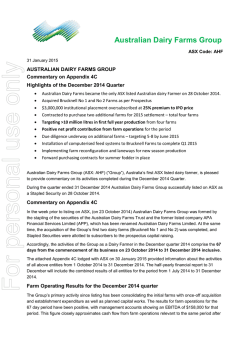
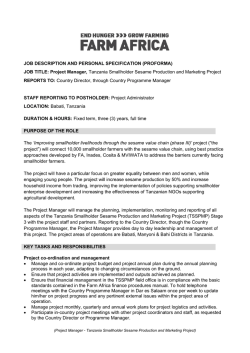
Interlinked diversification strategies: Evidence from farm
business households1
Aditya R. Khanal and Ashok K. Mishra
Department of Agricultural Economics and Agribusiness
Louisiana State University
Baton Rouge, LA 70802
Emails:
[email protected] (Khanal)
[email protected] (Mishra)
Selected Paper prepared for presentation at the Southern Agricultural Economics Association’s
2015 Annual Meeting, Atlanta, Georgia, January 31-February 3, 2015
1
Copyright 2015 by Khanal and Mishra. All rights reserved. Readers may make verbatim copies
of this document for non‐commercial purposes by any means, provided that this copyright notice
appears on all such copies.
|Page
0
Interlinked diversification strategies: Evidence from farm business
households
Aditya R. Khanal and Ashok K. Mishra
Abstract
We analyze the factors influencing farmer’s diversification decisions while taking into account
the simultaneous decision making. Using a national data on farm-level in the US and a
multivariate analysis, our study suggests that agricultural, structural, environmental, and
income diversification strategies are interlinked.
I.
Introduction
Agricultural sector in the United States has experienced a significant structural changes.
Large farms have increased while small farms are declining over time. By the nature of
agricultural production, farm business households face greater production risk. Additionally,
small to medium sized agricultural business households in the US face greater challenges for
continuation and survival through conventional commodity production methods. These farm
business households contribute significantly in the national and local economies—a U.S.
Department of Agriculture (USDA) report suggests that farm households engaged in such noncommodity entrepreneurial activities contributed almost 40 percent of the total value of U.S.
agricultural production (Vogel, 2012). The decline in the ability to generate sufficient income
from commodity production has caused many farmers to embrace diversification of their
agricultural bases and to undertake structural adjustments on the farm. With an advent of new
farm bill and the revised structure of conservation and government programs, US agriculture is
on the move and farmers have to adjust their farming behavior.
Additionally, farms have limited land, capital, managerial ability, and limited skilled
labor. These farms are subject to greater challenges in agricultural business. Small and
medium sized farms are often unable to adopt improved technology, new managerial practices,
intensive cultivation, and thereby a viable option is to use more profitable enterprise
|Page
1
combinations on the farm. In that, enterprise diversification is an important tool for risk
management in farm households (Mishra et al., 2004).
Adoption of alternative farm business activities and diversification strategies has been
the subject in some of the previous studies (Abdulai and Crolerees, 2001; Bagi and Reeder,
2012; Joo et al., 2013; Vogel, 2012; Mishra et al. 2004). These studies mainly report an
overview and importance, and identify factors influencing adoption or participation decisions
in various activities both on and off the farm. A drawback in these previous studies is that they
consider each diversification strategy as independent choices by farm households and fail to
account for diversification decisions simultaneously. Taking into account the potential
complementarity between different diversification activities can improve our understanding—
perhaps interaction between strategies is likely in the farmer’s decision-making process. To
the current challenging agricultural context, diversification could be an attractive farm
adjustment strategy (Barbieri and Mahoney, 2009).
Therefore, the objective of this study is to analyze the factors influencing farmer’s
diversification decisions while taking into account the simultaneous decision making. We
mainly classify diversification activities into 4 major categories—namely, agricultural
diversifications, structural diversifications, environmental diversifications, and income
diversifications. This paper contributes to the literature by providing a quantitative analysis of
farm household decisions taking into account the potential jointness of the strategies
(activities). Using a nation-wide survey in the US and a multivariate probit analysis, our study
suggests that farm diversification strategies are interlinked—particularly, agricultural with
structural diversification strategies and environmental with income diversification strategies.
Remaining section of the paper is organized as follows. Section II presents literature review,
|Page
2
section III describes about methodology, section IV explains about data, section V presents
results and section VI provides concluding remarks.
II.
Literature Review
Diversification in the farm business has been discussed in two broad perspectives in the
literature. First, diversification is linked with multifunctionality of agriculture and rural
development, particularly in European studies connecting with sustainability and conservation
activities. Recall that European Union’s agricultural policy has agri-environmental support
schemes that encourage on- and off- farm activities to increase farm household’s income and to
allow farmers to tackle with tough market environment (Van Der Plog and Roep, 2003; Meraner
et al., 2015). Multifunctionality of agriculture has also been viewed as generating externalities
that enhance social welfare. In this context, diversification generates social value, a part of rural
development strategy, while providing supplementary income for farm households (Wilson,
2007; Van Huylenbreock et al., 2007).
Second, diversification is viewed as risk management tool for farm households (Mishra
et. al. 2004; Aguglia et al. 2009). Engaging in many alternative business activities, on- and offfarm enterprises, diversification reduces variability in income for farm business households.
Diversified farming system helps farmers to maximize their utility through risk management,
complementarity/ supplementary relationships between enterprises in production process, tackle
with input and output constraints (Mishra et al., 2004), as well as provides non-pecuniary
benefits from ecosystem services (Bowman and Zilberman, 2013).
Farm diversification system is supported by the Common Agricultural Policy (CAP)
reform in the Europe. Bartolini et al. (2014) studied factors influencing on-farm diversification in
the context of new policy reforms. Using data from Italy and count data models, Bartolini et al.
|Page
3
(2014) found a significant effect of agricultural and farm payment polices on on-farm
diversification decision and intensity of diversification. In another study, also in Europe,
Meraner et al. (2015) analyzed the determinants of farm diversification strategies in the
Netherlands. Considering six different diversification activities and a multinomial logit model,
their study suggested that socio-demographic, economic, and geophysical farm characteristics
influence the diversification decision. Similarly, Dries et al. (2012) studied Italian farm systems
to analyze decision making process in farm diversification. Using a multivariate probit model,
Dries et al. (2012) found that the farm diversification decisions about agricultural, structural,
environmental, and income diversification strategies were interlinked.
While researchers in European countries have studied farm diversification for some time,
the literature is limited in the US context. Farm diversification among American farms is an
interesting area of research because farms, particularly small to medium, are increasingly
involved in alternative on- and off- farm activities. Adoption of farm diversification activities
such as on-farm processing, direct sales, agritourism, participation in conservation programs are
getting greater attention from researchers, extension agents, and policy models. For example,
Soh (2014) in Voice of America reports that farms are diversifying their farms to attract tourist;
agricultural tourism generated over $700 million in 2012—a 24 percent increase over five years.
Soh (2014) writes, “…many American families head to the farm, whether they go to pick the
fruits, take a hay ride, or wander through a corn maze, they are part of a fast growing sector of
the U.S. economy—agricultural tourism or agritourism, in short.”
There are a few studies examining the adoption of alternative activities among American
farms. For example, Joo et al. (2013) analyzed the impact of agritourism on financial
performance of American farms and found its significant impact on farm household income, and
|Page
4
return on farm assets among small farm business households. Recently, Khanal and Mishra
(2014) considered agritourism and off-farm work as a survival strategy for small farm business
households. Using national level survey data of American farms, they found a significant effect
of the agritourism and off-farm work participation on farm household income. Mishra et al.
(2004) suggested enterprise diversification as a self-insuring strategy used by American farmers
to protect against risk. The major limitation in these studies is that they chose one diversification
strategy and then separately analyze while ignoring possibility of interlinkage between decisions.
This study analyzes agricultural, structural, environmental, and income diversification strategies
among US farm business households. This study overcomes the limitation of previous studies by
simultaneously analyzing the diversification strategies while accounting for interlinkages
between these diversification strategies.
Factors affecting farm diversification decisions
Previous studies have suggested a number of factors influencing farm household’s decision
to diversify activities. Broadly, the variables related to farm location, farm and farmer
characteristics are reported to have a significant effect on agricultural, structural, environmental,
and income diversification strategies. Dries et al. (2012) classified community and location
related factors (such as region, county or district, population density in the area, social capital
etc.) as ‘external factors’ while farm size, farm labor, age, farm type etc. as ‘internal’ factors
influencing diversification decisions. Bartolini et al. (2014) used similar factors to analyze
determinants of the on-farm diversification. Meraner et al. (2015) considered on-farm sale, onfarm processing, agritourism, and nature conservation as farm diversification strategies and
included age, family size, farm size, farm type, and geographical characteristics as the factors
influencing such strategies. Mishra and Khanal (2013) found that the financial condition of the
|Page
5
farm significantly influenced farm household’s participation in agri-environmental and
conservation programs. Finally, Mishra et al. (2004) found that off-farm work hours, farm
location, financial condition (debt-to-asset ratio), government payments, farm size, family size,
and farm operator characteristics significantly influenced enterprise diversification on the US
farms.
III.
Methodology
We estimate the likelihood of observing a certain activity associated with a set of factors
such as farm and farmer characteristics, location and other related characteristics.
One of the most important assumptions in these types of models is about the assumption of
alternative strategies. For example, Mishra et al. (2004) used enterprise diversification index
(ranges from 0 to 1) as a dependent variable and computed factors affecting such enterprise
diversification on the farm using weighted least squares methods, with an assumption of
logistically distributed error term. Meraner et al. (2015) used multinomial logit model to assess
the determinants of diversification. However, standard logit and multinomial logit are suitable
when the alternatives are proportionally substitutes to each other because their models require
independence of irrelevant alternatives (IIA) assumption, which is often too restrictive and
erroneous (Train 2009). If the IIA assumption is violated, logit models may fail to provide
appropriate inferences.
Various diversification strategies are associated with decisions regarding the allocation of
resources to different activities. In that, decisions are correlated, for example: a) spending time in
one diversification activity may lower the time left for another strategy; b) earnings from offfarm employment can be used to invest or finance on-farm diversification activities; and c)
participation in agri-environmental programs may complement farmers to do organic farming
|Page
6
etc. (Dries et al., 2012). Therefore, we used an appropriate multivariate probit model to study the
joint-decision making between different diversification strategies. The diversification strategies
in this study include: 1) agricultural diversification, 2) structural diversification, 3)
environmental diversification, and 4) income diversification. Using multivariate probit model
allows us to account for simultaneous decision making while accounting for potential
substitutability and complementarity between various diversification strategies. Equation 1
represent latent utility framework to represent the strategic decision.
𝑌𝑖∗ = 𝑋𝑖 𝛽 + 𝜀𝑖
(1)
where 𝑌𝑖∗ denotes latent variables of net payoffs (or net gains) in jth different diversification
strategy for farm business household i. 𝑋𝑖 represents a set of explanatory variables that are
exogenously determined. These include the variables such as farm and farmer characteristics and
location of the farms; 𝜀𝑖 represent the error term. We considered four types of diversification
strategies namely, agricultural, structural, environmental, and income diversifications.
Description about these strategies are presented in Table 1. Representing equation for each
alternative diversification strategies for j=1,…,4 can be shown as:
𝑌𝑖1∗ = 𝑋𝑖 𝛽1 + 𝜀𝑖1 for j=1 (agricultural diversification)
(2)
𝑌𝑖2∗ = 𝑋𝑖 𝛽2 + 𝜀𝑖2 for j=2 (structural diversification)
(3)
𝑌𝑖3∗ = 𝑋𝑖 𝛽3 + 𝜀𝑖3 for j=3 (environmental diversification)
(4)
𝑌𝑖4∗ = 𝑋𝑖 𝛽4 + 𝜀𝑖4 for j=4 (income diversification)
(5)
Let 𝑍𝑖 represents a vector of observed binary outcome for farm business household i, 𝑍𝑖1 , … . 𝑍𝑖4
defined by latent variables presented in equations such that 𝑍𝑖𝑗 = 1 if 𝑌𝑖𝑗∗ > 0, 0 otherwise;
j=1,…,4. Multivariate probit assumes that the error terms (𝜀𝑖1 , 𝜀𝑖2 , 𝜀𝑖3 , 𝜀𝑖4 ) may be correlated.
Therefore, instead of independently estimating each equation, all four equations are considered
|Page
7
as multivariate limited dependent variable model and estimated using simulated maximum
likelihood approach. Multivariate probit model assumes that error terms follow a multivariate
normal distribution with mean zero (𝐸[𝜀1 ] = 𝐸[𝜀2 ] = 𝐸[𝜀3 ] = 𝐸[𝜀4 ] = 0) and variancecovariance matrix 𝜌.
1
𝑐𝑜𝑣[𝜀] = 𝜌 = [ ⋮
𝜌41
⋯
⋱
⋯
𝜌14
⋮ ]
1
(6)
The variance-covariance matrix has diagonal elements all 1 (while off-diagonal elements are
correlations between respective diversification strategies to be estimated.
IV.
Data and descriptive statistics
We used a national level survey of farm households, 2012 Agricultural Resource
Management Survey (ARMS) collected by Economic Research Services (ERS) of the United
States Department of Agriculture (USDA). We classified diversification strategy into four
broader diversification strategies, namely, agricultural, structural, environmental, and income
diversifications. As shown in figure 1, 94% of the farms are at least engaged in one of the
diversification activities analyzed in this study. Our sample consists of 13, 852 farm business
households. Figure 2 and table 1 suggest some interesting description about the adoption of
diversification strategies. Figure 2 shows the adoption and non-adoption of different
diversification strategies among all farm business households while table 1 shows the share of
each activity on diversification. Figure 2 suggests that farms are adopting one or more
diversification strategies, income diversification strategy is adopted by the most of the farms—
around 92%, which is around 91.6% share on total number of diversified farms (table 1).
Agricultural diversification, which includes activities such as organic farming, is adopted by
2% of the farms (figure 2); about 2% of all diversified farms (table 1). Around 18% of the farms
|Page
8
are structural diversified (such as agritourism, on-farm processing and direct-to-consumer sales);
have around 18.6% of all diversified farms. Finally, 20% of all farms have undertaken
environmental diversification activities (such as participation in conservation programs and/or
environmental incentive programs) (figure 2). Environmental diversification is adopted by
around 22% of all diversified farms (table 1). These four types of diversification strategies are
also classified in previous studies (Dries et al., 2012; Meraner et al., 2015).
Figure 3 presents diversification strategies by farm size. Small to medium sized farms are
(those generating less than $500,000 in gross cash farm income) comprising of 57% of the total
farms in our sample. Large farms (those generating greater or equal to $500,000 in gross cash
farm income), on the other hand, consists 43% of the total farms in our sample. Proportional
share of small to medium sized farms is relatively higher than larger farms for income
diversification strategies while being relatively lower for structural and environmental
diversifications. This indicates that higher proportion of small to medium sized farms undertake
income diversification strategies compared to other diversification strategies.
Table 3 shows summary statistics of the independent variables used in the study. We include
four main types of independent variables in the analysis: a) variables representing location and
county characteristics, b) operator, spouse, and household characteristics, c) farm characteristics,
and d) farm types. Mean, standard deviations, and definition of variables are presented in table 3.
Table 3 suggest that 21% of the farms in our sample are located in farming dependent counties
while 30% of the farms are located in metro counties. Summary statistics show that average age
of farm operators is 57 years, and the average schooling of the operator and the spouse is 13
years and 14 years, respectively. Households consists of 3 members on average and 4% of the
households have female operators. Main farm types are cash grain farms (around 39%), livestock
|Page
9
farms (around 35%), high value crop farms (around 12%), cotton farms (around 2%), and other
field crop farms (around 11%).
V.
Results and discussion
Results from multivariate probit analysis are presented in table 3. Multivariate probit is
estimated using simulated maximum likelihood method with 150 draws (replications)1. The
results presented in table 3 show the impact of explanatory variables on the likelihood of
choosing a diversification strategy, while allowing for possible correlation among strategies. A
significant likelihood ratio test result (with p value 0.000) indicates that we reject the null
hypothesis of no correlation between diversification strategies indicating that a multivariate
probit model is the appropriate compared to separate probit equations. Additionally, table 3
presents correlation between strategies as indicated by different 𝜌𝑖𝑗 , indicating if strategies are
substitutes (negative correlations) or complements (positive correlations).
Factors affecting diversification decisions
Farm location
In our analysis the role of farm location is linked to several socio-geographical economic
sectors of the county where the farm is located. We used county categories defined by the
Economic Research Services (ERS) of USDA, which includes: farming dependent, non-farming
dependent, mining dependent, manufacturing dependent, government dependent and service
dependent. Additionally, counties are classified as metro counties based on whether it is located
in metropolitan region or not. Results suggest that location is a significant factor determining the
diversification strategies. For example, farms located in farming dependent counties are less
1
Cappellari and Jenkins (2003) showed that higher the number of draws (R) in simulated maximum likelihood, more
accurate would be coefficients and correlation matrix in multivariate probit model. For sample sizes of the order of
several thousands, setting R at least equal to an integer approximately equal to the square root of the sample size can
be considered as a general thumb rule (Cappellari and Jenkins, 2003).
| P a g e 10
likely to adopt structural diversification compared to other non-farm dependent counties.
Dependence classification is based on economic contribution of the sector (or economic
dependence) in the county2. Since more specialized large farms usually have higher total income
than small to medium diversified farms, farms in farming dependent counties may be dominated
by specialized farms and structurally less diversified. Similarly, results suggest that farms located
in the mining depend counties are less likely to adopt income diversifications. Farms located in
Metro counties are less likely to adopt environmental diversification activities, (i.e., they less
likely participate to conservation or environmental incentive programs).
Farmer and household characteristics
Our results suggest that the likelihood of choosing structural and environmental
diversification activities increases with the age of the operator, up to certain level, suggesting
that relatively older operators are more likely to adopt structural and environmental
diversification activities. However, relatively younger operators are more likely to choose
income diversification activities. This is plausible because younger farmers are more likely to be
more educated and more likely to find off-farm jobs easily than older operators. On the other
hand, older operators are relatively more experienced in farming, some are retired form off-farm
jobs and also enjoy farming for recreational purposes and thus are more likely to be engaged on
the farm (McNally, 2001; Ollenburg and Buckley, 2007).
Education of the operator (years of schooling) is positive and significant across all
diversification strategies, suggesting that educated operators are more likely diversify their
farms. This finding is consistent with Mishra et al. (2004). However, education attainment of
2
Farming dependent counties are non-metropolitan counties classified as follows: counties where farm earnings
account for an annual average of at least 15 percent or more of total county earnings or farm occupations accounting
for 15 percent or more of all occupations of employed county residents during 1998-2000 (For detail, see:
http://www.ers.usda.gov/data-products/county-typology-codes/documentation.aspx).
| P a g e 11
spouse is positive and significantly associated with only structural diversification. Larger family
size, indicator of family labors available, increases the likelihood of participation in agricultural
and structural diversification strategies. This result supports the findings from some previous
studies who found that households with larger families are more likely to be engaged in
agritourism and care-farming activities (Benjmin and Kimhi, 2006; Nilsson 2002). Operators
with farming as main occupation are more likely to participate in environmental diversification
strategy while less likely to participate in income diversification strategy. This is plausible
because operators with farming as occupation are expected to devote more time in farming and
less or no hours for off-farm work. Another interesting result is the coefficient of gender
(operator being female)—Female operators are more likely to participate in structural and
environmental diversification strategies.
Farm characteristics
Farms with higher acreage are less likely to participate in agricultural and income
diversification strategies while more likely to participate in structural and environmental
diversifications. Similarly, Likelihood of participating in agricultural diversification and
structural diversification decreases with farming efficiency (measured as the ratio of value of
production to variable costs). This finding supports the findings from the limited literature about
agritourism in the US. Bagi and Reeder (2012) found that farmers with higher land acreage are
more likely to make costly long-term investments related to agritourism enterprises and other
farm related investments on the farm. Particularly, authors note that land not suitable for crop
production, is more likely to be used in agritourism enterprises (Bagi and Reeder, 2012).
Additionally, findings about negative relationship between efficiency and diversification
suggests that more efficient farms are expected to have higher value of output per total variable
| P a g e 12
costs, which is usually a feature of specialized farms. Farms receiving government payments are
more likely to undertake agricultural and structural diversifications than farms not receiving
government payments.
Our result also suggests that financial condition of the farm also plays an important role
in choosing environmental and income diversification strategies. As indicated by debt-to-asset
ratio, farms with higher solvency problems (higher debt-to-asset ratio) are less likely to
participate in environmental diversification activities. This result supports the findings from
Khanal and Mishra (2013) who found that farm’s debt-to-asset ratio is negatively associated with
the decision to participate in agri-environmental programs in the US. Coefficient of operator onfarm hours suggests that farm operators devoting more hours on the farm are more likely to
participate in agricultural and structural diversification strategies while less likely to participate
in environmental diversification strategy. Spouse’s on farm hours, on the other hand, suggests
that the likelihood of structural and environmental diversification increases as spouse devotes
more on the farm.
Our result suggests that high value crop farms, livestock farms, and other field crop farms
are more likely to adopt agricultural diversification strategy. This finding is plausible because
there has been an increasing demand for organic fruits, vegetables, milk, and meat. In that, one
would expect that high value fruit and vegetable farms, and livestock and dairy farms are more
likely to produce organic products as compared to cash grain farms. This also supports the
findings from Uematsu and Mishra (2012) who found that high value crop farms are more likely
to participate in organic certifications. Additionally, our finding in environmental diversification
strategy (last column, table 3) shows that high value crops and other field crop farms are more
likely to participate in environmental diversification strategy while cotton farms are less likely to
| P a g e 13
participate in environmental diversification strategy. This finding is plausible because, compared
to cash grain farms which tend to be large and very large farms that specialize in cash grains
(Ali, 2002) and intensified cotton farms (Foreman 2012), high value crops and field crops are
less intensive and are more likely to enroll some part of the land in conservation and participate
in environmental programs.
Correlation between strategies
We found a significant correlation between diversification strategies. Our results suggest
a positive correlation between agricultural and structural diversification strategy, a positive
correlation between agricultural and environmental diversification strategies, a positive
correlation between structural and income diversification strategies, and a positive correlation
between environmental and income diversification strategies.
Significantly positive correlation between agricultural and structural diversification decisions
indicates that these strategies complement to each other. This is plausible because many
synergies are possible between agricultural and structural diversifications. For example, the
decision regarding agricultural diversification, organic production for instance, is likely linked
with decision regarding market connection to organic produce, which is supported by activities
such as direct-to-consumer sales, on-farm processing, and agritourism—activities that support
short supply chains at local level. These results are consistent with previous studies (Mansury
and Hara 2007; Dries et al. 2012). Additionally, result suggests that significantly positive
correlation exists between environmental and income diversification strategies suggesting a
complementarity effect among these strategies. This finding is contradictory to Dries et al.
(2012) who found a negative correlation between these strategies in Italian farms. Dries et al.
(2012) have explained a negative correlation because of the constrained and scarcer labor—when
| P a g e 14
more labor hours is supplied to off-farm works, less time is available to undertake conservation
related on-farm activities. In our study, however, the positive correlation can be explained in a
counter way. Recall that environmental diversification is defined as the participation in
government conservation programs or environment incentives programs. Since such government
programs in the US are dominated by conservation reserve payments (CRP) that requires
enrollment of the certain acres of agricultural land for conservation (for example, remain
uncultivated, fallow, or zero-tilled) to get CRP payments. One would think that when labor is
constrained, farms would maximize their household income by enrolling in such conservation
programs to get government program payments and enjoy more off-farm income by allocating
more hours for off-farm works. In that, a positive correlation fairly explains the choice decision
between strategies.
VI.
Conclusions
This paper analyzes the decision about farm diversification strategies among American
farms. We considered simultaneous decision making between strategies that allows for possible
interlinkages between farmers’ diversification strategies. Our results suggests for a presence of
interlinkage between diversification strategies. We found a significant complementarity and
synergy between agricultural diversification and structural diversification and income
diversification and environmental diversification.
In general, we view farm diversification as farmers’ response towards various demographic
and socio-economic conditions that tend to reduce the capacity in specialization or high
production. In that view, diversification is a risk management tool for farm households and a
mechanism to stabilize the household income. We find that the factors such as location, farm and
| P a g e 15
farmer characteristics, farm types, and financial condition of the farms are major determinants in
strategic decisions about farm diversification.
| P a g e 16
References
Abdulai, A., and Crole Rees, A., 2001. Determinants of income diversification amongst rural in
Southern Mali. Food policy, 26,4 (2001): 437-452.
Aguglia, L, Henke R., Poppe K., Roest A., and Salvioni C, 2009. Diversification and
multifunctionality in Italy and the Netherlands: a comparative analysis. WYE CITY
GROUP (8).
Ali, M. B., 2002. Characteristics and production costs of US wheat farms. Bulletin no. 974-5.
US Department of Agriculture.
Bagi, F. S., and Reeder, R. J., 2012. Factors Affecting Farmer Participation in Agritourism.
Agricultural and Resource Economics Review, 41(2), 189.
Bagi, Faqir S., and Reeder R. J. Factors Affecting Farmer Participation in
Agritourism. Agricultural and Resource Economics Review 41,2: 189.
Barbieri, C. and Mohaney, E., 2009. Why is diversification an attractive farm adjustment
strategy? Insights from Texas farmers and ranchers. Journal of Rural Studies, 25: 58-66.
Bartolini, F., Andreoli M., and Brunori G., 2014. Explaining determinants of the on-farm
diversification: empirical evidence from Tuscany region. Bio-based and Applied
Economics 3, 2: 137-157.
Benjamin, C., and Kimhi A., 2006. Farm work, off-farm work, and hired farm labour: estimating
a discrete-choice model of French farm couples' labour decisions. European review of
agricultural economics 33, no. 2: 149-171.
Bowman, M. S., and Zilberman D., 2013. Economic factors affecting diversified farming
systems. Ecology and Society 18, no. 1: 33.
Cappellari, L., and Jenkins S. P., 2003. Multivariate probit regression using simulated maximum
likelihood. The Stata Journal 3, no. 3: 278-294.
Dries, L., Pascucci S., and Gardebroek C., 2012. Diversification in Italian farm systems: Are
farmers using interlinked strategies? New medit: Mediterranean journal of economics,
agriculture and environment 11, 4: 7-15.
Joo H., Khanal A.R., and Mishra A., 2013. Farmer‘s participation in agritourism: does it affect
the bottom line? Agricultural and Resource Economics Review 42, 3: 471–490.
Khanal, A. R., and Mishra A. K., 2014. Agritourism and off‐farm work: survival strategies for
small farms. Agricultural Economics 45. S1: 65-76.
Foreman, L., 2013. Characteristics of US cotton farms vary widely. Amber Waves, (1)
Mansury, Y., and Hara T., 2007. Impacts of organic food agritourism on a small rural economy:
A social accounting matrix approach." The Journal of Regional Analysis and Policy 37,
no. 3: 213-222.
McNally, S., 2001. Farm diversification in England and Wales – what can we learn from the
farm business survey? Journal of Rural Studies 17 (2) pp. 247–257
Meraner, M., Heijman W., Kuhlman T., and Finger R., 2015. Determinants of farm
diversification in the Netherlands. Land Use Policy 42: 767-780.
Mishra, Ashok K., and Khanal A. R., 2013. "Is participation in agri-environmental programs
affected by liquidity and solvency?." Land Use Policy 35: 163-170.
| P a g e 17
Mishra, A. K., El-Osta H. S., and Sandretto C. L., 2004. Factors affecting farm enterprise
diversification. Agricultural Finance Review 64, 2: 151-166.
Nilsson, P. A., 2002. Staying on farms: An ideological background. Annals of tourism
research 29, no. 1: 7-24.
Ollenburg, C., and Buckley R., 2007. Stated Economic and Social Motivations of Farm Tourism
Operators.” Journal of Travel Research 45(4): 444–452.
Soh J., 2014. Farmers diversify businesses to attract tourists. Voice of America, October 24,
2014. Accessed: January 2015. Web: http://www.voanews.com/content/farmersdiversify-businesses-to-attract-tourists/2495878.html
Train, K. E., 2009. Discrete choice methods with simulation. Cambridge university press.
USDA, ERS. Economic Research Services, United States Department of Agriculture.
http://www.ers.usda.gov/publications.aspx
Van Der Ploeg, J.D., and Roep, D., 2003. Multifunctionality and rural development the actual
situation in Europe. In: Van Huylenbroeck, G., Durand, G. (Eds.), Multifunctional
Agriculture. A New Paradigm for European Agriculture and Rural Development.
Ashgate, Aldershot, Hampshire, England, pp. 37–54.
Van Huylenbroeck, G., Vandermeulen V., Mettepenningen E., and Verspecht A.,2007.
Multifunctionality of agriculture: a review of definitions, evidence and
instruments. Living Reviews in Landscape Research 1, 3:1-43.
Vogel, S., 2012. Multi-enterprising farm households: the importance of their alternative business
ventures in the rural economy." Economic Information Bulletin Number 101. Economic
Research Service, United States Department of Agriculture.
Wilson, G. A., 2007. Multifunctional agriculture: a transition theory perspective. CABI.
| P a g e 18
Table 1: Diversification in American farms, 2012
Diversification Strategies
1. Agricultural Diversification
Organic farming
2. Structural diversification
Agritourism
Direct-to-consumer sales
On-farm processing
3. Environmental diversification
Participation in conservation programs (CRP,CREP and/or WRP)
Participation in environmental incentives programs and contracts (EQIP, CSP,
and/or CStP)
4. Income diversification
Source: Author’s own computation based on ARMS data, 2012
Note: Share does not add to 1 because farms are adopting multiple strategies.
Share of
farms
0.020
0.020
0.186
0.022
0.037
0.131
0.218
0.147
0.071
0.916
| P a g e 19
Table 2: Variable definition and summary statistics of the variables used in the study
Variable definition
Mean
Standard
Deviation
Location and county characteristics
Farming dependent (=1 if the farm located county is classified as farming
dependent county, 0 else)
Mining dependent (=1 if the farm located county is classified as mining
dependent county, 0 else)
Manufacturing (=1 if the farm located county is classified as
manufacturing dependent county, 0 else)
Govt. dependent (=1 if the farm located county is classified as
government dependent county, 0 else)
Service dependent (=1 if the farm located county is classified as services
dependent county, 0 else)
Metro (=1 if farm located county is classified as metro county, 0 else)
Operator, spouse, and household characteristics
Age (Age of the operator)
Age squared (Age of the farm operator, squared)
Education (years of schooling of the farm operator)
Spouse’s education (years of schooling of the spouse)
Household size (Size of the farm household, in number)
Female (=1 if operator is female, 0 if not)
Farming occupation (=1 if farming is the main occupation of the
operator, 0 if not)
Farm characteristics
Log of acres (log of the total acres of the farm)
Farming Efficiency (farming efficiency= total value of production / total
variable costs in the farm)
Gov. pay (=1 if the farm household received government payments in
2012, else 0)
Debt to asset (Debt to asset ratio)
Farm hr. Operator (Total annual hours of operator worked on the farm)
Farm hr. Spouse (Total annual hours of spouse worked on the farm)
Farm types
High value crops (=1 if farm is high value crop producing farm, 0 else)
Livestock (=1 if farm is classified as livestock farm, 0 else)
Cotton (=1 if farm is classified as cotton farm, 0 else)
Cash Grain crop (=1 if farm is cash grains producing farm, 0 else)
Other field crop (=1 if farm is classified field crops producing farm, 0
else)
0.209
0.407
0.014
0.118
0.155
0.362
0.041
0.197
0.096
0.294
0.302
0.459
57.541
3449.121
13.418
14.190
2.675
0.038
0.948
11.755
1363.542
1.770
2.310
1.310
0.191
0.221
6.167
6.309
1.693
270.494
0.629
0.483
0.115
2464.763
458.092
0.451
1102.646
846.514
0.123
0.359
0.019
0.390
0.109
0.328
0.479
0.137
0.487
0.312
Source: Author’s own computation based on ARMS data, 2012
| P a g e 20
Table 3: Factors influencing diversification: multivariate probit model using simulated maximum likelihood approach
Variables
Constant
Agricultural diversification
Coeff
t-scorea
-3.46
-5.81*
Marginal
effectb
Structural diversification
Coeff
t-scorea
-2.57
-9.31*
Marginal
effectb
Environmental
diversification
Coeff
t-scorea
-8.95
-0.08
Income diversification
Marginal
effectb
Coeff
t-scorea
2.29
6.93*
Marginal
effectb
Location and county characteristics (Base: Non-farm dependent county)
Farming dependent
-4.38
-0.24
-0.001
-0.14 -3.47*
Mining dependent
-4.37
-0.00
-0.023
0.12
1.15
Manufacturing
-0.02
-0.24
-0.001
0.03
0.72
Govt. dependent
-0.15
-0.87
-0.024
0.02
0.26
Service dependent
0.08
0.77
-0.000
0.06
1.32
Metro
0.03
0.33
-0.000
-0.01
-0.30
0.001
0.023
0.004
0.004
0.005
0.003
0.09
-0.14
-0.04
-0.05
-0.02
-0.20
2.11*
-1.09
-0.86
-0.62
-0.32
-4.59*
0.004
0.009
0.001
0.000
-0.005
-0.001
-0.07
-0.32
-0.08
0.13
0.10
-0.04
-1.38
-2.68*
-1.46
1.44
0.16
-0.80
-0.008
-0.024
-0.008
0.036
0.004
-0.003
Operator, spouse, and household characteristics
Age
-0.00
-0.06
-0.000
Age squared
-0.00
-0.07
-0.000
Education
0.04
2.13*
0.000
Spouse’s education
0.01
0.70
0.000
Household size
0.08
3.88*
0.002
Female
0.01
0.09
-0.021
Farming occupation
0.22
1.29
0.013
0.02
-0.00
0.04
0.02
0.04
0.17
0.09
2.27*
-2.31*
4.76*
2.58*
3.30*
2.52*
1.35
0.002
-0.000
0.001
0.001
0.001
-0.005
0.225
0.03
-0.00
0.07
-0.00
0.00
0.21
0.14
3.38*
-3.19*
7.50*
-0.15
0.29
2.07*
1.76*
0.001
-0.000
-0.001
0.002
0.001
0.011
0.022
-0.02
0.00
0.06
-0.41
-0.01
0.01
-0.61
-2.10*
4.01*
6.70*
-5.72*
-0.72
0.10
-5.43*
-0.004
0.000
0.010
-0.007
-0.001
0.016
-0.301
Farm characteristics
Log of acres
Farming Efficiency
Gov. pay
Debt to asset
Farm hr. Operator
Farm hr. Spouse
0.05
-0.01
0.13
-0.01
0.00
0.00
4.75*
-3.30*
3.63*
-0.14
2.97*
2.55*
0.003
-0.000
-0.006
0.002
0.000
0.000
0.16
0.00
5.81
-1.51
-0.00
0.00
11.56*
0.35
0.05
-1.94*
-7.30*
3.97*
0.006
0.000
0.305
0.001
0.000
0.000
-0.07
0.00
-0.05
-0.10
---------
-6.14*
0.78
-1.24
-3.38*
---------
-0.008
0.000
-0.255
-0.010
-------------
-0.05
-0.02
0.13
0.03
0.00
0.00
-2.22*
-2.35*
1.65*
0.72
2.25*
0.30
0.000
-0.000
-0.001
0.000
0.000
0.000
| P a g e 21
Variables
Agricultural diversification
Coeff
t-scorea
Farm types (Base: Cash grain farms)
High value crops
0.96
8.98*
Livestock
0.40
4.68*
Cotton
-4.00
0.00
Other field crop
0.63
6.37*
Structural diversification
Environmental
diversification
Income diversification
Marginal
effectb
Coeff
t-scorea
Marginal
effectb
Coeff
t-scorea
Marginal
effectb
Coeff
t-scorea
Marginal
effectb
0.000
0.000
-0.016
-0.011
-0.10
-0.38
-0.72
-0.30
-1.90*
-11.59*
-6.60*
-6.56*
0.011
-0.006
-0.003
-0.004
0.16
-0.02
-0.32
0.09
1.76*
-0.70
-3.51*
1.83*
0.010
0.003
0.009
0.001
-0.33
-0.06
-0.27
-0.01
-5.07*
-1.50
-2.80*
-0.16
-0.031
-0.007
-0.015
0.011
0.024
0.045
0.091
1.24
1.96*
3.63*
Correlation between farm diversification strategies
Agri. & structural
Agri. & environ.
Agri. & income
0.161
0.089
-0.01
4.32*
1.84*
-0.13
Stru. & env.
Stru. & income
Env. & income
Likelihood ratio test of rho21= rho31= rho41= rho32= rho42 = rho43= 0: chi2 (6)= 39.151,
p>chi2= 0.0000*
Log likelihood=-16755.06;
Wald chi2 (90)= 1464.43; p >chi2= 0.0000*;
N=13,852
SML number of draws (R)= 150
a
t-scores are asymptotic t-values,
*indicates statistical significance at 10% or higher (includes 5%, or 1%)
b
marginal effects are predicted average marginal effects; decision to remain undiversified is used as a base strategy; though coefficients account
for the assumption of correlated decisions, marginal effects are computed based on independent alternatives for computational easiness
| P a g e 22
Figure 1: Farm Diversification
Source: Author’s own computation based on ARMS data, 2012
23
Figure 2: Types of farm diversification among American farms
Source: Author’s own computation based on ARMS data, 2012
24
Figure 3: Share of small and large farms in diversification
Source: Author’s own computation based on ARMS data, 2012
25


© Copyright 2026