
Download PDF (all abstracts)
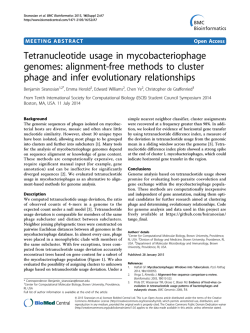
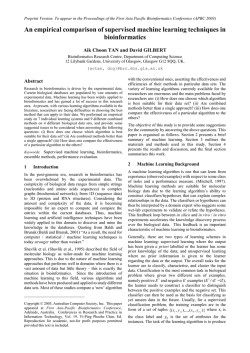
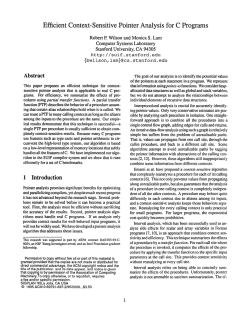
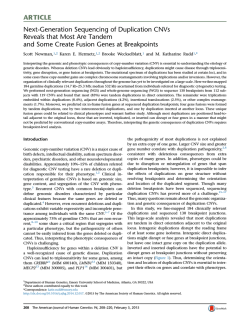
BMC Bioinformatics 2015, Volume 16 Suppl 2
http://www.biomedcentral.com/bmcbioinformatics/supplements/16/S2
MEETING ABSTRACTS
Open Access
Highlights from the Tenth International Society
for Computational Biology (ISCB) Student Council
Symposium 2014
Boston, MA, USA. 11 July 2014
Published: 28 January 2015
These abstracts are available online at http://www.biomedcentral.com/bmcbioinformatics/supplements/16/S2
INTRODUCTION
A1
Highlights from the tenth ISCB Student Council Symposium 2014
Farzana Rahman1, Katie Wilkins2, Annika Jacobsen3, Alexander Junge4,
Esmeralda Vicedo5, Dan DeBlasio6, Anupama Jigisha7, Tomás Di Domenico8*
1
Genomics and Computational Biology Research Group, University of South
Wales, UK; 2Computational Biology Department, Cornell University, USA;
3
Centre for Integrative Bioinformatics (IBIVU), VU University Amsterdam,
Netherlands; 4Center for non-coding RNA in Technology and Health,
University of Copenhagen, Denmark; 5Department of Bioinformatics and
Computational Biology, Fakultät für Informatik, Germany; 6Department of
Computer Science, University of Arizona, USA; 7University of Geneva,
Switzerland; 8Wellcome Trust/Cancer Research UK Gurdon Institute,
University of Cambridge, UK
E-mail: [email protected]
BMC Bioinformatics 2015, 16(Suppl 2):A1
About the Student Council and the symposium: The Student Council
(SC), part of the International Society for Computational Biology (ISCB),
aims at nurturing and assisting the next generation of computational
biologists. Our membership and leadership are composed of volunteer
students and post-docs in computational biology and related fields. The
main goal of our organisation is to offer networking and soft skill
development opportunities to our members.
The Student Council Symposium (SCS) takes place every year, directly
preceding the ISMB/ECCB conferences. SCS 2014 marked the tenth
consecutive edition of the event, after the success of previous years’
editions [1-7].
Meeting format: The Student Council Symposium is a one-day event.
Following the success of previous years, SCS 2014 kicked off with a scientific
speed dating session. During this session our delegates have to find a
partner to introduce themselves to, and they discuss their scientific
backgrounds and interests. After five minutes they must switch partners, and
this goes on until the allotted time runs out. The traditional scientific
component of the meeting consisted of two keynote presentations by senior
researchers, twelve oral presentations by delegates, and a poster session.
To celebrate the 10th edition of the Student Council Symposium, Dr. Manuel
Corpas, Dr. Jeroen DeRidder, Dr. Nils Gehlenborg and Dr. Geoff Macintyre,
former members of the Student Council, delivered a welcome address and
an overview of the Student Council’s history.
Dr. David Bartel (HHMI/MIT/Whitehead Institute, US) and Dr. Ashlee Earl (The
Broad Institute of MIT & Harvard, US) generously agreed to deliver the
keynote addresses at SCS 2014. In addition, Abhishek Pratap, Senior
Research Scientist in Bioinformatics at our institutional partner Sage
Bionetworks, gave a short presentation about Enabling Collaborative and
Reproducible Research through the Synapse software.
SCS 2014 received 76 submissions from students, which were peer-reviewed
by 23 independent reviewers. More than 50 abstracts were accepted for
poster presentations, and 12 abstracts were invited to deliver an oral
presentation. Extended abstracts of oral presentations are included in this
report. All abstracts are available online in the SCS 2014 booklet http://
scs2014.iscbsc.org/booklet-2014.
Welcome address: 10 years of Student Council: The commemorative
welcome address opened the day, and Drs. Corpas, DeRidder, Gehlenborg
and Macintyre provided our delegates with their points of view on the
evolution of the Student Council during its first 10 years. Having now
become young group leaders and senior postdocs, they offered an
interesting perspective on the impact the Student Council has had on the
development of their carreers.
Keynotes: Dr. David Bartel’s keynote followed the welcome address. In his
talk, Dr. Bartel gave an overview of the current understanding of microRNAs,
the progress in predicting their targets, and how measurements of their
regulatory effects have revealed an unexpected developmental switch in the
nature of mRNA translational control.
Dr. Ashlee Earl gave us an overview of her work on tackling longstanding
and emerging challenges in infectious disease by taking advantage of new
sequencing technologies. In particular, she described her group’s work on
tackling the emergence of multi-drug resistant strains of pathogens through
the development of approaches and tools to examine the drug resistant
Mycobacterium tuberculosis.
Student presentations: The first oral presentation was delivered by
Yassine Soulimi, who introduced the COSMOS software for cloud enabled
next generation sequencing analysis [8]. COSMOS is a scalable workflow
management framerwork, which aims at reducing the cost of whole
genome data analysis in order to place it within a reimbursable cost point
and in clinical time.
When performing multiple sequence alignments, most users tend to rely on
the default parameters of the algorithm. A different parameter setting may
however have great impact on the quality of the output alignment.
Parameter advising is the task of selecting good parameters for a given set
of input sequences to be aligned. Dan DeBlasio presented his work on
constructing improved advisors for multiple sequence alignment [9].
Lin-Yang Cheng described his efforts to enhance quantitative protein-level
conclusions in experiments with data-independent spectral acquisition by
the statistical elimination of spectral features with large between-run
variation. His results show that his approach achieves an accuracy that
exceeds the standard approach of using three spectral features with the
highest intensity between runs [10].
Microsatellites are short, tandem-repeated DNA sequences which make up
approximately 3% of the human genome. The expansion of these
© 2015 various authors, licensee BioMed Central Ltd. All articles published in this supplement are distributed under the terms of the
Creative Commons Attribution License (http://creativecommons.org/licenses/by/4.0), which permits unrestricted use, distribution, and
reproduction in any medium, provided the original work is properly cited.
BMC Bioinformatics 2015, Volume 16 Suppl 2
http://www.biomedcentral.com/bmcbioinformatics/supplements/16/S2
Page 2 of 10
microsatellite repeats has been linked to many neurological and
developmental disorders. Harriet Dashnow presented her work on
developing a microsatellite genotyping algorithm that addresses several
issues regarding the length determination of microsatellites from nextgeneration sequencing data, and provides a highly accurate and more
detailed analysis of microsatellite loci [11].
Yi Zhong reported the development of novel computational tools to gain
biological insight from Ribo-seq and RNA-seq data in a fast and accurate
way. By using transcriptome-scale ribosome footprinting data from
leukemia cell lines, he identified drug-sensitive genes showing both
decrease of translational efficiency and accumulation of ribosome
occupancy at 5’UTRs. These genes constitute potential therapeutic targets
for cancer [12].
The usage of tetranucleotides for genomes analysis is a promising
approach for the evaluation of host-parasite coevolution and gene
exchange within the mycobacteriophage population. Benjamin Siranosian
talked about computationally inexpensive methods, based on the usage
of tetranucleotides, that are also independent of gene annotation, and
their usefulness for phage clustering and the analysis of evolutionary
relationships [13].
Haeewook Lee presented his work on the detection of structural variants
involving insertion sequence elements in mutation accumulation lines of
Escherichia coli. By extending an A-Bruijn graph based structural variant
detection framework he was able to tackle the challenge of obtaining direct
estimates on insertion, deletion and recombination event rates.
Using a Random Forest machine learning approach, Russel Sutherland
reported results on the discrimination between cancer differentiation
subtypes. By applying the algorithm to exome sequencing data from
tumour and normal tissue samples from 1798 patients, they were able to
discriminate between 5 cancer types with high accuracy.
Alex Salazar presented Emu, an algorithm that resolves alternate
representations of larger sequence variants (LSVs) by comparing variants
across genomes. Emu improves the analysis of LSVs in bacterial genomes by
reducing cross-sample noise resulting from per-sample variant calls [14].
Vikas Pejaver presented MutPred2, a method for the prediction of
pathogenicity of missense variants and their molecular effects. The software
can be used to guide downstream experiments for elucidating the
molecular basis of disease, and to assist in the development of therapeutic
strategies.
Sarah Keasey presented her work on systematically identifying and
analysing thousands of direct binary protein interactions within Y. pestis.
The resulting benchmark dataset can be highly useful for the analysis of
protein interaction networks functioning within an important human
pathogen [15].
On behalf of Amin Ardeshirdavani, Prof. Yves Moreau presented NGSLogistics, a platform to analyse NGS data in a distributed way, while
guaranteeing privacy and security [16]. The framework aims to reduce the
effort and time needed to evaluate the significance of mutations based on
full genome and full exome sequencing.
Award winners: Thanks to the generous contribution of the Swiss
Institute of Bioinformatics, two travel fellowships were awarded to Sarah
Keasey and Vikas Pejaver to attend SCS 2014.
Based on the votes of the SCS delegates, a judging committee awarded
three speakers with one best oral and two best poster presentations awards.
The best oral presentation award went to Harriet Dashnow for her work
entitled “Genotyping Microsatellites in Next-Generation Sequencing Data”.
The first place in the best poster presentation awards went to Alex Salazar
for his work, “Investigating large sequence variants in drug resistant
Mycobacterium tuberculosis”. The second place in the poster presentation
awards went to Sarah Keasey for her work, “The Road To Linking Genomics
And Proteomics Of Pathogenic Bacteria: From Binary Protein Complexes To
Interaction Pathways”.
In addition to the aforementioned awards, Russell Sutherland and Dilmi
Perera received F1000 awards for their poster presentations at SCS 2014.
Conclusions: This year’s number of submissions and participants saw a
slight decline in comparison with the previous edition. Visa issues and the
general lack of funding seem to be the main reasons according to our
surveys. All these issues notwithstanding, the quality of the keynote
presentations, the 12 oral presentations and the poster session once again
made the Student Council Symposium a great success.
Preparations are already ongoing for the 11th edition of SCS to be held in
Dublin, Ireland, preceding ISMB/ECCB 2015. For further information
regarding the Student Council, its events, internships and community,
please visit http://www.iscbsc.org.
Acknowledgements: Because of space constraints we are unable to
mention in this publication all the volunteers whose contributions make
the Student Council Symposium a reality every year. Our recognition and
appreciation goes out to all of them, since without their support the
organisation of such an event would simply not be possible
We would like to thank ISCB Executive Director Diane Kovats, ISCB
Conferences Director Steven Leard, ISMB Conference Administrator Pat
Rodenburg, ISMB programmer Jeremy Henning, and ISCB Administrative
Support Suzi Smith for their logistical support and invaluable advice.
Furthermore, we thank the ISCB Board of Directors for their continued
support of the ISCB Student Council in general and the Student Council
Symposium in particular
We are greatly indebted to ISMB 2014 conference chairs Prof. Bonnie
Berger and Dr. Janet Kelso for giving us the opportunity to organise the
Student Council Symposium 2014 in Boston
The Student Council would also like to thank our keynote speakers
Dr. David Bartel and Dr. Ashlee Earl who generously donated their
valuable time by delivering keynote addresses
The Symposium would not be possible without the financial support of
our generous sponsors. We would like to thank BioMed Central, Oxford
University Press, Sage Bionetworks, IMGT, the Swiss Institute of
Bioinformatics, and F1000 for their contributions
We are very grateful to all the volunteer reviewers for their work on
ensuring the quality of the scientific program, and to the program and
travel fellowship committees for coordinating the reviewing effort
Finally, we thank all Student Council members that have spent countless
hours organising all aspects of SCS 2014 to ensure its success
References
1. Di Domenico T, Prudence C, Vicedo E, Guney E, Jigisha A, Shanmugam A:
Highlights from the ISCB Student Council Symposium 2013. BMC
Bioinformatics 2014, 15(Suppl 3):A1.
2. Goncearenco A, Grynberg P, Botvinnik OB, Macintyre G, Abeel T: Highlights
from the Eighth International Society for Computational Biology (ISCB)
Student Council Symposium 2012. BMC Bioinformatics 2012, 13(Suppl 18):A1.
3. Grynberg P, Abeel T, Lopes P, Macintyre G, Rubino LP: Highlights from the
Student Council Symposium 2011 at the International Conference on
Intelligent Systems for Molecular Biology and European Conference on
Computational Biology. BMC Bioinformatics 2011, 12(11).
4. Klijn C, Michaut M, Abeel T: Highlights from the 6th International Society
for Computational Biology Student Council Symposium at the 18th
Annual International Conference on Intelligent Systems for Molecular
Biology. BMC Bioinformatics 2010, 11(Suppl 10):4.
5. Abeel T, de Ridder J, Peixoto L: Highlights from the 5(th) International
Society for Computational Biology Student Council Symposium at the
17(th) Annual International Conference on Intelligent Systems for
Molecular Biology and the 8(th) European Conference on Computational
Biology. BMC Bioinformatics 2009, 10(13).
6. Peixoto L, Gehlenborg N, Janga SC: Highlights from the Fourth
International Society for Computational Biology Student Council
Symposium at the Sixteenth Annual International Conference on
Intelligent Systems for Molecular Biology. BMC Bioinformatics 2008, 9(10).
7. Gehlenborg N, Corpas M, Janga SC: Highlights from the Third
International Society for Computational Biology Student Council
Symposium at the Fifteenth Annual International Conference on
Intelligent Systems for Molecular Biology. BMC Bioinformatics 2007, 8(8).
8. Souilmi Yassine, Jung Jae-Yoon, Lancaster Alex, Gafni Erik, Amzazi Saaid,
Ghazal Hassan, Wall Dennis, Tonellato Peter: COSMOS: Cloud Enabled NGS
Analysis. BMC Bioinformatics 16(Suppl 2):A2.
9. DeBlasio Dan, Kececioglu John: Parameter Advising for Multiple Sequence
Alignment. BMC Bioinformatics 16(Suppl 2):A3.
10. Cheng Lin-Yang, Liu Yansheng, Chang Ching-Yun, Röst Hannes,
Ruedi Aebersold, Olga Vitek: Statistical elimination of spectral features
with large between-run variation enhances quantitative protein-level
conclusions in experiments with data-independent spectral acquisition.
BMC Bioinformatics 16(Suppl 2):A4.
11. Dashnow Harriet, Tan Susan, Das Debjani, Simon Easteal, Oshlack Alicia:
Genotyping microsatellites in next-generation sequencing data. BMC
Bioinformatics 16(Suppl 2):A5.
BMC Bioinformatics 2015, Volume 16 Suppl 2
http://www.biomedcentral.com/bmcbioinformatics/supplements/16/S2
12. Zhong Y, Drewe P, Wolfe AL, Singh K, Wendel H, Rätsch G: Protein
translational control and its contribution to oncogenesis revealed by
computational methods. BMC Bioinformatics 16(Suppl 2):A6.
13. Ye Chen, Siranosian Benjamin, Herold Emma, Kwon Minjae,
Perera Sudheesha, Williams Edward, Taylor Sarah, deGraffenried Christopher:
Tetranucleotide usage in mycobacteriophage genomes: alignment-free
methods to cluster phage and infer evolutionary relationships. BMC
Bioinformatics 16(Suppl 2):A7.
14. Salazar Alex, Earl Ashlee, Desjardins Christopher, Abeel Thomas:
Normalizing alternate representations of large sequence variants across
multiple bacterial genomes. BMC Bioinformatics 16(Suppl 2):A8.
15. Keasey LSarah, Natesan Mohan, Pugh Christine, Kamata Teddy,
Wuchty Stefan, Ulrich GRobert: The road to linking genomics and
proteomics of pathogenic bacteria: From binary protein complexes to
interaction pathways. BMC Bioinformatics 16(Suppl 2):A9.
16. Ardeshirdavani Amin, Souche Erika, Dehaspe Luc, Van Houdt Jeroen,
Vermeesch Robert Joris, Moreau Yves: NGS-Logistics: Data infrastructure
for efficient analysis of NGS sequence variants across multiple centers.
BMC Bioinformatics 16(Suppl 2):A10.
MEETING ABSTRACTS
A2
COSMOS: cloud enabled NGS analysis
Yassine Souilmi1,2, Jae-Yoon Jung2, Alex Lancaster2, Erik Gafni3, Saaid Amzazi1,
Hassan Ghazal4, Dennis Wall2,5, Peter Tonellato2*
1
Department of Biology, Faculty of Sciences of Rabat, Morocco; 2Center for
Biomedical Informatics, Harvard Medical School, Boston, MA 02115, USA;
3
INVITAE, San Francisco, CA 94107, USA; 4Department of Biology, Mohamed
First University, Oujda/Nador, Morocco; 5Department of Pediatrics, Division of
Systems Medicine, Stanford University, Stanford, CA 94305, USA
BMC Bioinformatics 2015, 16(Suppl 2):A2
Background: The dramatic fall of next generation sequencing (NGS) cost in
recent years positions the price in range of typical medical testing, and thus
whole genome analysis (WGA) may be a viable clinical diagnostic tool.
Modern sequencing platforms routinely generate petabyte data. The current
challenge lies in calling and analyzing this large-scale data, which has
become the new time and cost rate-limiting step.
Methods: To address the computational limitations and optimize the
cost, we have developed COSMOS (http://cosmos.hms.harvard.edu) , a
scalable, parallelizable workflow management system running on clouds
(e.g., Amazon Web Services or Google Clouds). Using COSMOS [1], we
have constructed a NGS analysis pipeline implementing the Genome
Analysis Toolkit - GATK v3.1 - best practice protocol [2,3], a widely
accepted industry standard developed by the Broad Institute. COSMOS
performs a thorough sequence analysis, including quality control,
alignment, variant calling and an unprecedented level of annotation
using a custom extension of ANNOVAR. COSMOS takes advantage of
parallelization and the resources of a high-performance compute cluster,
either local or in the cloud, to process datasets of up to the petabyte
scale, which is becoming standard in NGS.
Conclusion: This approach enables the timely and cost-effective
implementation of NGS analysis, allowing for it to be used in a clinical
setting and translational medicine. With COSMOS we reduced the whole
genome data analysis cost under the $100 barrier, placing it within a
reimbursable cost point and in clinical time, providing a significant change
to the landscape of genomic analysis and cement the utility of cloud
environment as a resource for Petabyte-scale genomic research.
References
1. Gafni E, Luquette LJ, Lancaster AK, Hawkins JB, Jung J-Y, Souilmi Y, Wall DP,
Tonellato PJ: COSMOS: Python library for massively parallel workflows.
Bioinformatics 2014, btu385.
2. DePristo MA, Banks E, Poplin R, Garimella KV, Maguire JR, Hartl C,
Philippakis AA, del Angel G, Rivas MA, Hanna M, McKenna A, Fennell TJ,
Kernytsky AM, Sivachenko AY, Cibulskis K, Gabriel SB, Altshuler D, Daly MJ: A
framework for variation discovery and genotyping using nextgeneration DNA sequencing data. Nat Genet 2011, 43:491-498.
3. Van der Auwera GA, Carneiro MO, Hartl C, Poplin R, del Angel G, LevyMoonshine A, Jordan T, Shakir K, Roazen D, Thibault J, Banks E,
Garimella KV, Altshuler D, Gabriel S, DePristo MA: From FastQ Data to
Page 3 of 10
High-Confidence Variant Calls: The Genome Analysis Toolkit Best
Practices Pipeline. 2013.
A3
Parameter advising for multiple sequence alignment
Dan DeBlasio*, John Kececioglu
Department of Computer Science, University of Arizona, Tucson, AZ, 85721,
USA
E-mail: [email protected]
BMC Bioinformatics 2015, 16(Suppl 2):A3
Background: While the multiple sequence alignment output by an aligner
strongly depends on the parameter values used for its alignment scoring
function (i.e. choice of gap penalties and substitution scores), most users
rely on the single default parameter setting. A different parameter setting,
however, might yield a much higher-quality alignment for a specific set of
input sequences. The problem of picking a good choice of parameter
values for a given set of input sequences is called parameter advising.
A parameter advisor has two ingredients: (i) a set of parameter choices to
select from, and (ii) an estimator that estimates the accuracy of a
computed alignment; the parameter advisor then picks the parameter
choice from the set whose resulting alignment has highest estimated
accuracy.
Our estimator Facet (Feature-based Accuracy Estimator) is a linear
combination of real-valued feature functions of an alignment. We assume
the feature functions are given as well as the universe of parameter choices
from which the advisor’s set is drawn. For this scenario we define the
problem of learning an optimal advisor by finding the best possible
parameter set for a collection of training data of reference alignments.
Learning optimal advisor sets is NP-complete [1]. For the advisor sets
problem, we develop a greedy ℓk-approximation algorithm that finds near
optimal sets of size at most k given an optimal solution of size ℓ<k. For the
advisor estimator problem, we have an efficient method for finding the
coefficients for the estimator that performs well in practice [2,3].
Results: Parameter advising: We apply parameter advising to boost the
true accuracy of the Opal aligner [4,5], where the advisor is using
parameter sets found by the ℓk-approximation algorithm. Figure 1 shows
the accuracy of the advisor for a parameter set of size k = 10, where the
benchmarks are assigned to bins based on their accuracy using a default
parameter choice; the figure also shows the accuracies when using a single
default parameter choice, and an oracle. The number of benchmarks per
bin is indicated above the columns. An oracle is an advisor that knows the
true accuracy of an alignment; its accuracy is shown by the dotted line,
which gives the performance of a perfect advisor. Notice that in many
cases the performance of the estimator is close to the oracle. This is most
clear on the bin which has lowest average accuracy, where advising
increases the average accuracy by almost 20% compared to using a single
default parameter.
Figure 2 shows the average advising accuracy for parameter sets of
various cardinalities using as the estimator Facet [3], TCS [6], MOS [7], and
PredSP [8], where in the average, benchmark bins contribute equally. The
vertical axis is advising accuracy on the testing data, averaged over all
Figure 1(abstract A3) Advising accuracy of Facet within benchmark
bins
BMC Bioinformatics 2015, Volume 16 Suppl 2
http://www.biomedcentral.com/bmcbioinformatics/supplements/16/S2
Figure 2(abstract A3) Average advising accuracy of estimators on
sets of varying cardinality
benchmarks and all folds using 12-fold cross-validation. The horizontal
axis is the cardinality k of the greedy advisor set. Greedy advisor set
found by the approximation algorithm are augmented from the exact set
of cardinality ℓ = 1 (namely, the best single parameter choice). Notice
that Facet (the topmost curve in the plot) continues to increase in
advising accuracy up to cardinality k = 6. Notice also that while all of the
advisors reach a plateau, for Facet this occurs at a greater cardinality and
accuracy than for other estimators.
Accuracy estimation: Our tool Facet (Feature-based Accuracy Estimator)
[9] is an easy-to-use, open-source utility for estimating the accuracy of a
protein multiple sequence alignment. Facet evaluates the estimated
accuracy of a computed alignment as a linear combination of real-valued
feature functions. We considered 12 features of which we found an
optimal subset of 5 that provide the best performance for alignment
advising. Many of the most useful features utilize information about
protein secondary structure. We find coefficients by fitting the difference in
estimator values to the difference in true accuracy for pairs of examples
where the correct alignment is known. This “difference fitting” approach is
computationally efficient and yields an estimator that works well for
advising.
Facet is open-source software that allows users to estimate accuracy as
either (1) a stand alone tool, or (2) a software library that can be integrated
into a pre-existing Java application. The implementation provides
optimized default coefficients and features. These coefficients may also be
specified manually and new features can also be added. Figure 3 shows a
simple example of using Facet within a Java application to choose
between two alignments of the same set of sequences. The secondary
structure predictions are computed on the unaligned sequences and can
be reused between the two alignments.
The Facet website provides parameter sets that can be used with the
Opal aligner (namely substitution matrices and affine gap penalties), as
well as scripts for structure prediction.
Conclusion: While the new problem of learning optimal parameter sets for
an advisor is NP-complete, in practice our greedy approximation algorithm
efficiently learns parameter sets that are remarkably close to optimal.
Moreover, these parameter sets significantly boost the accuracy of an
aligner compared to a single default parameter choice, when advising using
the best accuracy estimators from the literature.
Figure 3(abstract A3) Example of invoking Facet in Java
Page 4 of 10
References
1. DeBlasio DF, Kececioglu JD: Learning Parameter Sets for Alignment
Advising. Proceedings of the 5th ACM Conference on Bioinformatics,
Computational Biology and Health Informatics (ACM-BCB) 2014.
2. DeBlasio DF, Wheeler TJ, Kececioglu JD: Estimating the accuracy of
multiple alignments and its use in parameter advising. Proceedings of the
16th Conference on Research in Computational Molecular Biology (RECOMB)
2012, 45-59.
3. Kececioglu JD, DeBlasio DF: Accuracy Estimation and Parameter Advising
for Protein Multiple Sequence Alignment. Journal of Computational
Biology 2013, 20(4):259-279.
4. Wheeler TJ, Kececioglu JD: Multiple alignment by aligning alignments.
Bioinformatics 2007, 23(13):559-68.
5. Wheeler TJ, Kececioglu JD: Opal: multiple sequence alignment software,
Version 2.1.0. 2012 [http://opal.cs.arizona.edu].
6. Chang JM, Tommaso PD, Notredame C: TCS: A new multiple sequence
alignment reliability measure to estimate alignment accuracy and
improve phylogenetic tree reconstruction. Molecular Biology and Evolution
2014.
7. Lassmann T, Sonnhammer ELL: Automatic assessment of alignment
quality. Nucleic Acids Research 2005, 33(22):7120-7128.
8. Ahola V, Aittokallio T, Vihinen M, Uusipaikka E: Model-based prediction of
sequence alignment quality. Bioinformatics 2008, 24(19):2165-2171.
9. DeBlasio DF, Kececioglu JD: Facet: software for accuracy estimation of
protein multiple sequence alignments, Version 1.1. 2014 [http://facet.cs.
arizona.edu].
A4
Statistical elimination of spectral features with large between-run
variation enhances quantitative protein-level conclusions in
experiments with data-independent spectral acquisition
Lin-Yang Cheng1*, Yansheng Liu2, Ching-Yun Chang1, Hannes Röst2,
Ruedi Aebersold2,3, Olga Vitek4
1
Department of Statistics, Purdue University, West Lafayette IN, USA;
2
Department of Biology, Institute of Molecular Systems Biology, ETH Zurich,
8093 Zurich, Switzerland; 3Faculty of Science, University of Zurich, 8057
Zurich, Switzerland; 4Department of Computer Science, Purdue University,
West Lafayette IN, USA
E-mail: [email protected]
BMC Bioinformatics 2015, 16(Suppl 2):A4
Background: Many proteomic investigations summarize the quantitative
information across multiple spectral features into protein-level conclusions.
Data-independent spectral acquisition (DIA) now generates a lot of interest,
as it allows us to quantify many spectral features in a single run. However,
the disadvantage of DIA experiments as compared, e.g., to Selected
Reaction Monitoring (SRM) is that the features are subject to interferences
and noise. We argue that between-run variation provides an additional
insight for distinguishing good-quality and noisy DIA features. To
appropriately use the quantitative between-run variation, it is important to
account for the properties experimental design, and distinguish random
artifacts from the biological changes. We have previously proposed a
method (Chang et al., ASMS 2013) that accounts for the experimental design
to eliminate features with low information content.
Results: In this project we furthermore emphasized that conducting
regularization helps us avoid exploring every subset of features exhaustively,
and allows us to conduct hypothesis tests later on so that we would be able
to control the false discovery rate of the feature selection process.
Weevaluated our proposed approach by using three datasets that have
BMC Bioinformatics 2015, Volume 16 Suppl 2
http://www.biomedcentral.com/bmcbioinformatics/supplements/16/S2
some notion of ground truth: an extensive simulation study, a controlled
mixture where proteins were spiked into a complex background in known
concentrations, and a study of 232 plasma samples, where 18 proteins were
quantified in both SWAH and SRM mode in presence of heavy labeled
reference peptides. We worked on [1] protein-level estimates of fold
changes between conditions, [2] sensitivity and specificity of detecting
changes in protein abundance, and [3] accuracy of relative quantification of
protein abundance in individual biological samples. A family of linear mixed
models similar to that in MSstats http://www.msstats.org were fit to all the
datasets. Then we conducted the regularization and hypothesis test to
control the selection false discovery rate.
Conclusion: The results demonstrated that our proposed feature selection
approach enhanced sensitivity and specificity of the conclusions, was
robust to the amount of noisy fragments, and increased the correlation of
subject quantification between SRM and DIA workflows. Importantly, the
performance exceeded that of the frequently used ‘top 3’ approach, which
consists of using three spectral features with the highest average intensity
between runs. Furthermore, we showed that our proposed approach
outperforms using correlation to select the information features.
References
1. Clough T, Thaminy S, Ragg S, Aebersold R, Vitek O: Statistical protein
quantification and significance analysis in label-free LC-MS experiments
with complex designs”. BMC Bioinformatics 2012, 13:S16.
2. Chang CY, Picotti P, Hüttenhain R, Heinzelmann-Schwarz V, Jovanovic M,
Aebersold R, Vitek O: Protein significance analysis in selected reaction
monitoring (SRM) measurements. Molecular and Cellular Proteomics 2012,
11, Article M111.014662.
3. Choi M, Chang CY, Clough T, Broudy D, Killeen T, MacLean B, Vitek O:
MSstats: an R package for statistical analysis of quantitative mass
spectrometry-based proteomic experiments. Bioinformatics 2014.
4. Lockhart R, Taylor J, Tibshirani R, Tibshirani R: A significance test for the
lasso. The Annals of Statistics 2014, 42.
A5
Genotyping microsatellites in next-generation sequencing data
Harriet Dashnow1,2,3*, Susan Tan4, Debjani Das4, Simon Easteal4,
Alicia Oshlack2,3
1
Life Science Computation Centre, Victorian Life Sciences Computation
Initiative, Carlton, VIC, Australia; 2The University of Melbourne, Parkville, VIC,
Australia; 3Murdoch Childrens Research Institute, Parkville, VIC, Australia;
4
John Curtin School of Medical Research - Australian National University,
Canberra, ACT, Australia
BMC Bioinformatics 2015, 16(Suppl 2):A5
Background: Microsatellites are short (2-6bp) DNA sequences repeated in
tandem, which make up approximately 3% of the human genome [1].
These loci are prone to frequent mutations and high polymorphism with
the estimated mutation rates of 10 −2 - 10 −6 events per locus per
generation, orders of magnitude higher than other parts of the genome
[2]. Dozens of neurological and developmental disorders have been
attributed to microsatellite expansions [3]. Microsatellites have also been
implicated in a range of functions such as DNA replication and repair,
chromatin organisation and regulation of gene expression [4].
Traditionally, microsatellite variation has been measured using capillary
gel electrophoresis [5]. In addition to being time-consuming, and
expensive, this method fails to reveal the full complexity at these loci
because it does not directly sequence the fragment but only measure the
number of bases in the repeat.
Next-generation sequencing has the potential to address these problems.
However, determining microsatellite lengths using next-generation
sequencing data is difficult. In particular, polymerase slippage during PCR
amplification introduces stutter noise. A small number of software tools
have been written to genotype simple microsatellites in next-generation
sequencing data [6-8], however they fail to address the issues of SNPs
and compound repeats, and in some cases provide only approximate
genotypes.
We have begun to develop a microsatellite genotyping algorithm that
addresses these issues, providing high accuracy as well as more detailed
analysis of microsatellite loci. We have validated it using high depth
amplicon sequencing data of microsatellites near the AVPR1A gene.
Page 5 of 10
Table 1(abstract A5) Concordance of microsatellite
variance calls three validation methods: electrophoresis,
manual inspection and Mendelian inheritance
Validation method
Concordant #
Concordant %
Electrophoresis
9/9
100%
Manual inspection
17/18
~95%
Mendelian inheritance
18/18
100%
Results: We found high concordance between our algorithm and repeat
lengths obtained by electrophoresis, manual inspection and Mendelian
inheritance (Table 1). By subsampling the reads, we found that our model
is accurate to within one repeat unit down to coverages that we would
expect in standard exome sequencing (Figure 1). Additionally, we detected
polymorphic single nucleotide changes within some microsatellites.
Conclusions: The algorithm was approximately 95% correct at calling the
exact same genotype on high depth sequencing data. When it did call a
genotype incorrectly, the genotype was only one repeat unit different. The
algorithm can perform at approximately 90% accuracy to within one repeat
unit with as few as 20 informative reads and reaches almost 100% accuracy
to within one repeat unit with 100 or more informative reads.
Future work will include expanding the algorithm to genotype compound
microsatellites and further validation and comparison with other algorithms
will be performed on whole genome data sets.
References
1. Lander ES, Linton LM, Birren B, Nusbaum C, Zody MC, Baldwin J, Devon K,
Dewar K, Doyle M, FitzHugh W: Initial sequencing and analysis of the
human genome. Nature 2001, 409(6822):860-921.
2. Gemayel R, Vinces MD, Legendre M, Verstrepen KJ: Variable tandem
repeats accelerate evolution of coding and regulatory sequences. Annual
review of genetics 2010, 44:445-477.
3. Gatchel JR, Zoghbi HY: Diseases of unstable repeat expansion:
mechanisms and common principles. Nature Reviews Genetics 2005,
6(10):743-755.
4. Li YC, Korol AB, Fahima T, Beiles A, Nevo E: Microsatellites: genomic
distribution, putative functions and mutational mechanisms: a review.
Molecular ecology 2002, 11(12):2453-2465.
5. Guichoux E, Lagache L, Wagner S, Chaumeil P, LÉGer P, Lepais O,
Lepoittevin C, Malausa T, Revardel E, Salin F, et al: Current trends in
microsatellite genotyping. Molecular Ecology Resources 2011, 11(4):591-611.
6. Gymrek M, Golan D, Rosset S, Erlich Y: lobSTR: A short tandem repeat
profiler for personal genomes. Genome Research 2012.
7. Highnam G, Franck C, Martin A, Stephens C, Puthige A, Mittelman D:
Accurate human microsatellite genotypes from high-throughput
resequencing data using informed error profiles. Nucleic acids research
2012, gks981.
8. Cao MD, Tasker E, Willadsen K, Imelfort M, Vishwanathan S, Sureshkumar S,
Balasubramanian S, Bodén M: Inferring short tandem repeat variation
from paired-end short reads. Nucleic acids research 2014, 42(3):e16-e16.
A6
Protein translational control and its contribution to oncogenesis
revealed by computational methods
Yi Zhong*, Phillip Drewe, Andrew L Wolfe, Kamini Singh, Hans-Guido Wendel,
Gunnar Rätsch
Memorial Sloan Kettering Cancer Center, 1275 York avenue, New York,
NY 10065, USA
BMC Bioinformatics 2015, 16(Suppl 2):A6
Background: Protein translation is a fundamental biochemical process
and the regulation of this process in response to a variety of changes has
been demonstrated to play a key role in cellular functional activity.
Recently, the translational control of oncogenes is implicated in many
cancers [1].
Results: We recently reported a translation initiation factor eIF4A RNA
helicase-dependent mechanism of translational control that contributes to
oncogenesis and underlies the anticancer effects of drug silvestrol [2].
Inhibition of eIF4A with silvestrol has powerful therapeutic effects in vitro
BMC Bioinformatics 2015, Volume 16 Suppl 2
http://www.biomedcentral.com/bmcbioinformatics/supplements/16/S2
Page 6 of 10
Figure 1(abstract A5) Genotyping accuracy at the (AC)n promoter locus as a function of the number of reads spanning the microsatellite. 20 to
3000 reads were sampled with replacement from those spanning the microsatellite. This was done 1000 times for each depth. A shows the portion of
genotypes that were exactly correct, B shows the proportion of genotypes that were correct to within one repeat unit
and in vivo. In this study, we developed novel computational tools,
specifically be tailored to study high throughput ribosome footprint data
(Ribo-seq) [3], to identify the genes featuring either one of the two
changes between two experiment conditions: 1) translational efficiency
(TE), and 2) ribosome occupancy distribution profile (ROD) on mRNA.
In the parametric test of TE, we take RNA abundance and ribosome
occupancy density into account in order to expeditiously identify
differential translation efficiency. Whereas the non-parametric test of ROD
[4] aims to identify differential occupancy profiles, such as ribosome
stalling at specific sites even if overall translation efficiency remain
unchanged. Using transcriptome-scale ribosome footprinting data of
leukemia cell line, we defined drug-sensitive genes showing both
decrease of translational efficiency (Figure 1A) and accumulation of
ribosome occupancy at 5’UTR (Figure 1B). Among the most eIF4Adependent transcripts are a number of oncogenes, super-enhancer
associated transcription factors and epigenetic regulators.
Conclusions: Computational and statistical methodologies facilitate the
discovery of the hallmark of eIF4A-dependent transcripts, namely 5’UTR
sequence harbors the 12-mer guanine quartet (CGG)4 motif associated with
RNA G-quadruplex (GQ) structures (Figure 1C). Our novel computational
tools provide a fast, accurate solution to gain biological insights from Riboseq and RNA-seq data.
References
1. Hay N, Sonenberg N: Upstream and downstream of mTOR. Genes Dev
2004, 18(16):1926-45.
2. Wolfe AL, Singh K, Zhong Y, Drewe P, Rajasekhar VK, Sanghvi VR,
Mavrakis KJ, Jiang M, Roderick JE, Van der Meulen J, Schatz JH, Rodrigo CM,
Zhao C, Rondou P, de Stanchina E, Teruya-Feldstein J, Kelliher MA,
Speleman F, Porco JA Jr, Pelletier J, Rätsch G, Wendel HG: RNA
G-quadruplexes cause eIF4A-dependent oncogene translation in cancer.
Nature 2014, 513(7516):65-70.
3. Ingolia NT, Brar GA, Rouskin S, McGeachy AM, Weissman JS: The ribosome
profiling strategy for monitoring translation in vivo by deep sequencing
of ribosome-protected mRNA fragments. Nat Protoc 2012, 7(8):1534-50.
4. Drewe P, Stegle O, Hartmann L, Kahles A, Bohnert R, Wachter A,
Borgwardt K, Rätsch G: Accurate detection of differential RNA
processing. Nucleic Acids Res 2013, 41(10):5189-98.
A7
Tetranucleotide usage in mycobacteriophage genomes: alignment-free
methods to cluster phage and infer evolutionary relationships
Benjamin Siranosian1,2*, Emma Herold2, Edward Williams2, Chen Ye2,
Christopher de Graffenried3
1
Center for Computational Molecular Biology, Brown University, Providence,
RI, USA; 2Division of Biology and Medicine, Brown University, Providence, RI,
USA; 3Department of Molecular Microbiology and Immunology, Brown
University, Providence, RI, USA
E-mail: [email protected]
BMC Bioinformatics 2015, 16(Suppl 2):A7
Background: The genomic sequences of phages isolated on mycobacterial
hosts are diverse, mosaic and often share little nucleotide similarity. However,
about 30 unique types have been isolated, allowing most phage to be
grouped into clusters and further into subclusters [1]. Many tools for the
analysis of mycobacteriophage genomes depend on sequence alignment or
knowledge of gene content. These methods are computationally expensive,
can require significant manual input (for example, gene annotation) and can
be ineffective for significantly diverged sequences [2]. We evaluated
tetranucleotide usage in mycobacteriophages as an alternative to alignmentbased methods for genome analysis.
Description: We computed tetranucleotide usage deviation, the ratio of
observed counts of 4-mers in a genome to the expected count under a null
model [3]. Tetranucleotide usage deviation is comparable for members of the
same phage subcluster and distinct between subclusters. Neighbor joining
phylogenetic trees were constructed on pairwise Euclidean distances between
all genomes in the mycobacteriophage database. In almost every case, phage
were placed in a monophyletic clade with members of the same subcluster.
With few exceptions, trees computed from tetranucleotide usage deviation
accurately reconstruct trees based on gene content for a subset of the
mycobacteriophage population (Figure 1). We also evaluated the possibility of
assigning clusters to unknown phage based on tetranucleotide usage
deviation. Under a simple nearest neighbor classifier, cluster assignments were
recovered at a frequency greater than 98%. In addition, we looked for
evidence of horizontal gene transfer by using tetranucleotide difference index,
a measure of the deviation in tetranucleotide usage from the genomic mean
in a sliding window across the genome [3]. Tetranucleotide difference index
plots showed a strong spike at the end of cluster L mycobacteriophages,
which could indicate horizontal gene transfer in the region.
Conclusions: Genome analysis based on tetranucleotide usage shows
promise for evaluating host-parasite coevolution and gene exchange within
the mycobacteriophage population. These methods are computationally
inexpensive and independent of gene annotation, making them optimal
candidates for further research aimed at clustering phage and determining
evolutionary relationships. Code for genome analysis and data used in this
project are freely available at https://github.com/bsiranosian/tango_final.
References
1. Hatfull GF: Mycobacteriophages: Windows into Tuberculosis. PLoS Pathog
2014, 10:e1003953.
2. Vinga S, Almeida J: Alignment-free sequence comparison-a review.
Bioinformatics 2003, 19:513-523.
BMC Bioinformatics 2015, Volume 16 Suppl 2
http://www.biomedcentral.com/bmcbioinformatics/supplements/16/S2
Page 7 of 10
Figure 1(abstract A6) Computational methods revealed drug effects on protein translation. A Histogram of the ratio of TE in control and drugtreated samples. Red: genes with significant TE down and up regulation were identified based on the read count of Ribo-seq data. Blue and green: TE up
and down genes defined by |Z score| > 2 as often used in other analyses. B Averaged distribution profile of ribosome occupancy of 62 drug-sensitive
genes. Ribosome footprint coverages and transcript lengths were normalized. C Twelve-nucleotide motif that is highly enriched in 5’ UTR of TE down and
ROD positive genes. We suggested that the GQ structure is responsible for ribosome stalling in the 5’ UTR [2]
Figure 1(abstract A7) A) Neighbor joining tree constructed from tetranucleotide usage deviation distances and B) tree from [4] constructed from
predicted protein products in a subset of sequenced mycobacteriophages. Our method accurately places phage in a monophyletic clade with members
of the same subcluster and often reconstructs relationships between subclusters. In some cases, a subcluster is not placed with other members of the cluster
because of significant and conserved differences in tetranucleotide usage, such as overrepresentation of the 4-mer ‘GATC’ in cluster B3 genomes
BMC Bioinformatics 2015, Volume 16 Suppl 2
http://www.biomedcentral.com/bmcbioinformatics/supplements/16/S2
3.
4.
Pride DT, Wassenaar TM, Ghose C, Blaser MJ: Evidence of host-virus
co-evolution in tetranucleotide usage patterns of bacteriophages and
eukaryotic viruses. BMC Genomics 2006, 7:8.
Hatfull GF, Jacobs-Sera D, Lawrence JG, Pope WH, Russell DA, Ko C-C,
Weber RJ, Patel MC, Germane KL, Edgar RH, Hoyte NN, Bowman CA,
Tantoco AT, Paladin EC, Myers MS, Smith AL, Grace MS, Pham TT,
O’Brien MB, Vogelsberger AM, Hryckowian AJ, Wynalek JL, Donis-Keller H,
Bogel MW, Peebles CL, Cresawn SG, Hendrix RW: Comparative Genomic
Analysis of 60 Mycobacteriophage Genomes: Genome Clustering, Gene
Acquisition, and Gene Size. Journal of Molecular Biology 2010, 397:119-143.
A8
Normalizing alternate representations of large sequence variants
across multiple bacterial genomes
Alex Salazar1,2, Ashlee Earl1, Christopher Desjardins1, Thomas Abeel1,3*
1
Broad Institute of MIT and Harvard, Cambridge, Massachusetts, USA;
2
University of California, Santa Cruz, California, USA; 3Delft Bioinformatics Lab,
Delft University of Technology, Delft, Netherlands
BMC Bioinformatics 2015, 16(Suppl 2):A8
Background and description: Variant-focused comparative genomics
enables researchers to study the evolution of distinct genetic characteristics
in bacterial populations, while avoiding the difficulties of whole-genome
assembly and alignment. A major challenge in using this method is that
many variant detecting tools are largely limited to predicting single
nucleotide variants (SNVs) and small indels. This is a challenge because
bacterial organisms do not only possess SNVs but also harbor much larger
sequence variants (LSVs), such as large indels and substitutions (>25 nt),
when compared to a reference genome. LSVs have been shown to play a
role in shaping important biological aspects such as virulence and drug
resistance as well as reporting on population structure [1-3]. Recent variant
callers, such as Pilon http://www.broadinstitute.org/software/pilon/, can
identify LSVs with single nucleotide accuracy in microbial genomes.
However, one remaining challenge is that identical LSVs can be represented
non-identically by a single variant detecting tool; this generally results from
similarity in the flanking sequence of the variant and variability of the read
quality and alignment information in that region across the different strains.
As a result, alternate representations of large variants make it difficult to
perform downstream analyses - such as association studies - that depend on
consistent representations of variants.
We present Emu, an algorithm that resolves alternate representations of
LSVs by comparing variant calls across genomes.
Results: To evaluate Emu’s ability to resolve alternate representations of
LSVs, we introduced 179 simulated LSVs into the H37Rv genome–a carefully
curated and finished reference genome for Mycobacterium tuberculosis
(Mtb). We then used Pilon to identify variants in a set of 146 clinical samples
of Mtb that were collected in China using the modified H37Rv genome as a
reference [4]. We identified a total of 10,001 unique variant representations.
The average number of non-identical representations of each simulated LSV
was 56 (in the range of 1 to 145). We then applied Emu to identify the nonidentical representations across the genomes of the 146 clinical samples and
canonicalize them to a single form. Emu reduced the total number of nonidentical representations to 676 LSVs bringing the average number of nonidentical representations at each LSV to 4, with 15 LSVs reduced to a single
representation and no LSV having more than 25 representations.
We then investigated how Emu’s ability to resolve alternate representations
might impact association analyses, e.g., associating LSVs with population
structure. We ran Pilon again on the set of 161 clinical samples from China,
but used the unmodified H37Rv genome. Pilon identified a total of 20,512
distinct LSVs when compared to the unmodified H37Rv genome. By
applying Emu, the number of distinct LSVs decreased by almost 50% to
10,936 LSVs. Emu also increased the power of association tests on the LSVs.
While we initially identified a total number of 69 LSVs that were significantly
associated (p < 0.01) with membership to a specific clade, after processing
with Emu that number increased to 94.
Conclusion: Emu enables comprehensive analysis of LSVs in bacterial
genomes by reducing the cross-sample noise that results from per-sample
variant calls. By normalizing our variant calls with Emu, we increased our
power to utilize LSVs association tests. Pilon and Emu are open source
Page 8 of 10
tools that can also be applied to identify and normalize variants in other
organisms.
References
1. Alland D, Lacher DW, Hazbón MH, Motiwala AS, Qi W, Fleischmann RD,
Whittam TS: Role of large sequence polymorphisms (LSPs) in generating
genomic diversity among clinical isolates of Mycobacterium tuberculosis
and the utility of LSPs in phylogenetic analysis. J Clin Microbiol 2007, 45:39-46.
2. Maurelli AT, Fernández RE, Bloch CA, Rode CK, Fasano A: “Black holes” and
bacterial pathogenicity: a large genomic deletion that enhances the
virulence of Shigella spp. and enteroinvasive Escherichia coli. Proc Natl
Acad Sci USA 1998, 95:3943-3948.
3. Mutreja A, Kim DW, Thomson NR, Connor TR, Lee JH, Kariuki S, Croucher NJ,
Choi SY, Harris SR, Lebens M, Niyogi SK, Kim EJ, Ramamurthy T, Chun J,
Wood JLN, Clemens JD, Czerkinsky C, Nair GB, Holmgren J, Parkhill J,
Dougan G: Evidence for several waves of global transmission in the
seventh cholera pandemic. Nature 2011, 477:462-5.
4. Zhang H, Li D, Zhao L, Fleming J, Lin N, Wang T, Liu Z, Li C, Galwey N,
Deng J, Zhou Y, Zhu Y, Gao Y, Wang T, Wang S, Huang Y, Wang M,
Zhong Q, Zhou L, Chen T, Zhou J, Yang R, Zhu G, Hang H, Zhang J, Li F,
Wan K, Wang J, Zhang X-E, Bi L: Genome sequencing of 161
Mycobacterium tuberculosis isolates from China identifies genes and
intergenic regions associated with drug resistance. Nat Genet 2013,
September: 1-8.
A9
The road to linking genomics and proteomics of pathogenic bacteria:
from binary protein complexes to interaction pathways
Sarah L Keasey1*, Mohan Natesan1, Christine Pugh1, Teddy Kamata1,
Stefan Wuchty2, Robert G Ulrich1
1
Molecular and Translational Sciences Division, U.S. Army Medical Research
Institute of Infectious Diseases, Frederick, MD 21702, USA; 2National Center
for Biotechnology Information, National Institutes of Health, Bethesda, MD
20892, USA
BMC Bioinformatics 2015, 16(Suppl 2):A9
Background: The availability of fully sequenced genomes of many bacterial
organisms has enabled mapping networks of binary protein interactions
that form the basic building blocks of molecular pathways and dynamic
assemblies defining all cellular activities. Few proteome-scale studies have
been reported for pathogenic bacteria though, suggesting that a systemswide network analysis of binary interaction partners could reveal groups of
proteins that coordinate to achieve specific biological tasks important to
pathogenesis and provide a functional map useful to the discovery of new
antibiotics, vaccines, and diagnostic tools.
Results: We performed a comprehensive proteomics analysis of the
pathogenic bacterium Yersinia pestis and analytically identified more than
74,000 binary interactions. Using a library of biotinylated recombinant
proteins to probe a planar microarray comprised of immobilized proteins
that represented approximately 85% (3,552 proteins) of the Y. pestis
proteome, we measured protein-protein interactions by fluorescence
intensity of the laser-scanned microarrays. We obtained kinetic interaction
data for >1,600 binary complexes by microarray-based, surface plasmon
resonance imaging, and identified several high-affinity (K D ~ nM)
interactions. We applied a machine learning algorithm that used previously
reported experimental protein-protein interactions from Escherichia coli as a
training set in order to extract E. coli-like interactions from the Y. pestis
dataset. The node degree distribution of the resulting network, comprised of
2344 interactions between 314 proteins, approximates a power-law
distribution typical of scale-free networks. Functional annotation clustering
of proteins within the network revealed statistically enriched complexes and
pathways involved in diverse biological processes. Among the more notable
protein assemblies identified were components of the RNA polymerase
enzyme and ribosomes. Small modules of proteins related to various
metabolic pathways, as well as previously reported interactions involved in
homologous recombination and fatty acid biosynthesis, were also present in
the network. Two highly interconnected network sub-regions contained a
large percentage of proteins with functions linked to transcription and
translation.
Conclusions: We have systematically identified and analyzed thousands
of direct binary protein interactions within Y. pestis. This new benchmark
BMC Bioinformatics 2015, Volume 16 Suppl 2
http://www.biomedcentral.com/bmcbioinformatics/supplements/16/S2
Page 9 of 10
data set will serve as a critical tool for the analysis of protein interaction
networks functioning within an important human pathogen.
terms of computing and data storage and transfer, with off-site data transfer
currently being a key bottleneck. Moreover, the analysis of NGS data also
raises the major challenge of how to reconcile federated analysis of personal
genomic data and confidentiality of data to protect privacy. In many
situations, the analysis of data from a single study alone will be much less
powerful than if it can be correlated with other studies. In particular, when
investigating a mutation of interest, it is extremely useful to obtain data
about other patients or controls sharing similar mutations. However,
personal genome data (whole genome, exome, transcriptome data, etc.) is
sensitive personal data. Confidentiality of this data must be guaranteed at all
times and only duly authorized researchers should access such personal
data.
Methods: To address all challenges described above, we developed a data
structure NGS-Logistics, which fulfills all requirements of a successful
application that can process data inclusively and comprehensively from
multiple sources while guaranteeing privacy and security. NGS-Logistics is a
web-based application providing a data structure to analyze NGS data in a
distributed way. The data can be located in any data center, anywhere in
the world. NGS-Logistics provides an environment in which researchers do
not need to worry about the physical location of the data (Figure 1). With
respect to users rights, queries will be sent to each remote server. The host
will process the request and return the results back to the main server
where all the privacy limitations are controlled for the data. Once the results
are ready, the end user can see the desired information. Depending on the
type of query, results will be divided into two parts, the first part is related
to the samples to which the user has authorized access, and for which the
users can see all details. The second part contains results for the whole
population, for which the user has only access to some aggregate statistics
without details. An example of such a query would be to review the
mutations present at a single genomic position in each individual patient
from a set of patients to which the user has authorized access (1st part) and
to contrast these results with background frequency of mutation in the
reference populations (2nd part) (Figure 2).
Results: The pilot version of NGS-Logistics has been installed and is
currently being beta-tested by users at the Center for Human Genetics of
the University of Leuven. Currently we have two installations of the
system, the first one at the Leuven University Hospitals and the second
one at the Flemish Supercomputing Center (VSC). The development of
A10
NGS-Logistics: data infrastructure for efficient analysis of NGS sequence
variants across multiple centers
Amin Ardeshirdavani1,2,4*, Erika Souche3,4, Luc Dehaspe3,4, Jeroen Van Houdt3,4
, Joris Robert Vermeesch3,4, Yves Moreau1,2,4
1
KU Leuven, Department of Electrical Engineering (ESAT), STADIUS Center for
Dynamical Systems, Signal Processing and Data Analytics, Leuven, Belgium;
2
iMinds Medical IT Department. Kasteelpark Arenberg 10, Box 2446, 3001
Leuven, Belgium; 3KU Leuven, Center of Human Genetics Gasthuisberg, O&N I
Herestraat 49 - box 602, 3000 Leuven, Belgium; 4KU Leuven Department of
Human Genetics Gasthuisberg, O&N I Herestraat 49 - box 602, 3000 Leuven,
Belgium
BMC Bioinformatics 2015, 16(Suppl 2):A10
Background: Next-Generation Sequencing (NGS) is a key tool in genomics,
in particular in research and diagnostics of human Mendelian, oligogenic,
and complex disorders [1]. Multiple projects now aim at mapping the
human genetic variation on a large scale, such as the 1,000 Genomes
Project, the UK 100k Genome Project. Meanwhile with the dramatic
decrease of the price and turnaround time, large amounts of human
sequencing data have been generated over the past decade [2]. As of
January 2014, about 2,555 sequencers were spread over 920 centers across
the world [3]. As a result, about 100,000 human exome have been
sequenced so far [4]. Crucially, the speed at which NGS data is produced
greatly surpasses Moore’s law [5] and challenges our ability to conveniently
store, exchange, and analyze this data. Data pre-processing is needed to
extract reliable information from sequencing data and it can be divided into
two major steps: primary analysis (image analysis and base calling) and
secondary analysis. When looking for variation in the human genome,
secondary analysis consists of aligning/mapping the reads against the
reference genome and scanning the alignment for variation. Both raw data
and mapped reads are large files occupying significant disk storage space.
The collection of files resulting from the analysis of a single whole genome
study can take up to 50Gb of disk space. This raises significant issues in
Figure 1(abstract A10) NGS-Logistics components. Users pass their queries from the NGS-Logistics web interface to the clients. Request are stored and
scheduled in the main database. Each center has one database, being the only way of communication between centers and the main system. Centers
and their databases are connected through a secured connection, to which only valid and trusted IPs are allowed to connect. The query manager is
responsible for tracking and running the request, as well as collecting and returning the results to the main system
BMC Bioinformatics 2015, Volume 16 Suppl 2
http://www.biomedcentral.com/bmcbioinformatics/supplements/16/S2
Page 10 of 10
Figure 2(abstract A10) Single Point Query result page (Statistic section) for chr9:2115841. The query of chr9:2115841 shows that only one sample
is polymorphic at this position. All samples that can be genotyped at this position from the active data set, control data set and whole are homozygous
reference. The MAF of this variant in each data set is thus very low
NGS-Logistics has significantly reduced the effort and time needed to
evaluate the significance of mutations from full genome sequencing and
exome sequencing, in a safe and confidential environment. This platform
provides more opportunities for operators who are interested in
expanding their queries and further analysis.
References
1. Voelkerding KV, Dames SA, Durtschi JD: Next-generation sequencing: from
basic research to diagnostics. Clin Chem 2009, 55(4):641-658.
2. Institute NHGR: DNA Sequencing Costs 2013.
3. Next Generation Genomics: World Map of High-throughput Sequencers.
[http://omicsmaps.com/].
4.
5.
Human genome: Genomes by the thousand. Nature 2010,
467(7319):1026-1027.
DNA Sequencing Costs: Data from the NHGRI Genome Sequencing
Program (GSP). [http://www.genome.gov/sequencingcosts/].
Cite abstracts in this supplement using the relevant abstract number,
e.g.: Ardeshirdavani et al.: NGS-Logistics: data infrastructure for efficient
analysis of NGS sequence variants across multiple centers. BMC
Bioinformatics 2015, 16(Suppl 2):A10
© Copyright 2026