
effects of elevated seawater co2 concentration on the meiofauna
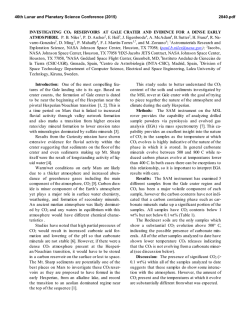
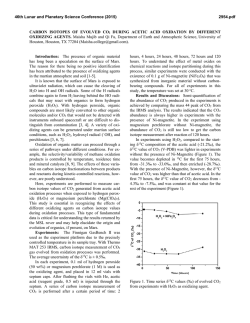
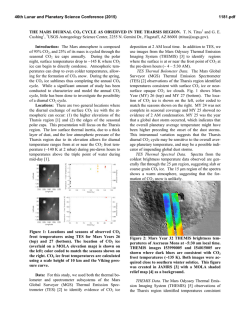
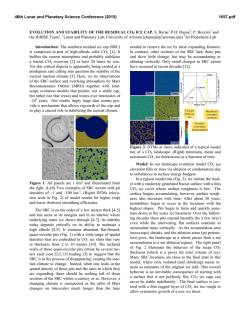
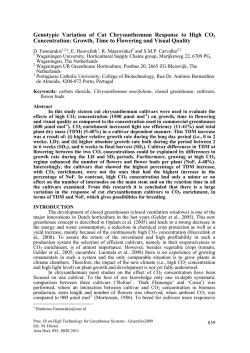
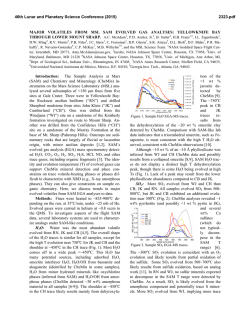
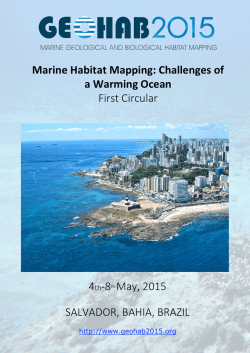
Special Issue, pp. 17-22 (2007)
17
EFFECTS OF ELEVATED SEAWATER CO2
CONCENTRATION ON THE MEIOFAUNA
Haruko Kurihara*, Atsushi Ishimatsu* and Yoshihisa Shirayama**
Key words: CO2, decreased pH, nematoda, harpacticoid copepoda.
ABSTRACT
An increase in atmospheric CO2 concentration leads to a rise in
CO 2 concentrations and a decrease in pH of the ocean surface water
due to continuous gas exchange between air and seawater, which may
have serious impacts on neritic marine organisms. In this study, we
assessed the impacts of elevated CO 2 concentrations on meiobenthic
organisms by exposing them to seawater equilibrated with air (control:
CO 2 concentration 380 ppm) or CO 2-enriched air (2,000 ppm higher
than control, CO 2 concentration predicted by the year 2300) for 56
days in microcosms. We observed no significant differences in the
abundance of total meiofauna, nematodes, harpacticoid copepods
(including adults and copepodites) and nauplii by the end of the
experiment. These results suggest that the projected atmospheric CO 2
concentration in the year 2300 does not have acute effects on the
meiofauna. However, further studies are needed to evaluate longerterm effects of elevated CO 2 on meiobenthic organisms.
INTRODUCTION
The atmospheric concentration of carbon dioxide
(CO 2) has increased from the pre-industrial level of 280
parts per million (ppm) to 380 ppm as a result of
anthropogenic CO2 emission associated with industrialization [11]. The resulting global warming has already
impacted terrestrial and marine ecosystems [18, 24],
and a further rise in temperature is predicted to intensify
sea surface stratification and drastically alter marine
ecosystem [1, 19]. In addition to the indirect effects of
CO 2 due to global warming, recent studies have revealed direct effects of CO 2 on terrestrial ecosystems,
and have predicted serious impacts on interactions between plants and insects [4, 7].
Due to continuous gas exchange between air and
seawater [22], an increase in atmospheric CO 2 concentrations will raise CO 2 concentrations at the ocean
Author for Correspondence: Haruko Kurihara.
E-mail: [email protected].
*Institute for East China Sea Research, Nagasaki University, 1551-7
Tairamachi, Nagasaki, 851-2213, Japan.
**Seto Marine Biological Laboratory, Kyoto University, 459 Shirahama,
Nishimuro, Wakayama, 649-2211, Japan.
surface, and decrease seawater pH through the dissociation of carbonic acid formed by the increased CO2 [5].
The atmospheric CO 2 concentration is predicted to increase to above 2,100 ppm, and thereby reducing the pH
of the ocean surface water by about 0.77 units by the
year 2300 [5]. These chemical changes in seawater
likely have significant impacts on neritic marine
organisms.
Most published studies on the effects of CO 2 on
marine organisms have focused on calcification responses to elevated seawater CO 2 concentration (for
review, see Supporting Online Material of Feely et al.
[8]). Riebesell et al. [17] also demonstrated that the
growth rate of marine diatoms Thalassiosira punctigera
and Rhizosolena cf. alata increased with CO 2
concentration. These previous studies mostly employed
short-term exposure protocols and only very few evaluated long-term effects of increased CO 2 on marine
organisms. Recently Michaelidis et al. [15] reported
that the growth and metabolic rates of the marine mussels Mytilus galloprovincialis decreased when exposed
to CO 2 -acidified seawater (pH 7.3) for 3 months.
Shirayama and Thornton [21] demonstrated that growth
of sea urchins Hemicentrotus pulcherrimus and
Echinometra mathaei was suppressed by 6-month exposure to seawater equilibrated with CO 2 -enriched air
(580 ppm). It is therefore conceivable that long-term
exposure of marine organisms to elevated CO2 concentration seawater for several generation could potentially
result in decreases of population size.
In the present study, we incubated meiobenthic
communities under elevated CO2 conditions (2,000 ppm
above ambient) for 56 days to investigate changes in
abundance and biomass of nematodes and harpacticoid
copepods. Meiofauna is suitable for studying long-term
effects because of its short generation time, rapid growth,
and high abundance in a small area. In addition, despite
their small size, meiobenthic faunas are important in the
energy flow of marine benthic ecosystems [9]. Here, we
focused on nematodes and harpacticoid copepods because they usually account for more than 90% of the
total meiofauna in mud environments [10], and owing to
their confinement in the oxidized layers of sediment
(usually in the top 1 cm, [6]), they may be more suscep-
Special Issue (2007)
MATERIAL AND METHODS
Sediments were sampled with a Smith McIntyre
grab from the seafloor (approximately 10 m in depth) of
the Tanabe Bay, in the Kii Peninsula, Japan (33°
42.2’N, 135° 22.9’E) on 30 January 2001. The top 5 cm
layer was used for the experiment.
The experiment was conducted for two months
(from 1 February to 29 March, 2001) in an indoor
microcosm system. The sediments were homogenized
by stirring and were placed in six microcosms (capacity
30L) to a depth of 7 cm and covered with seawater.
Microcosms were placed in a flow-through container
into which coastal seawater was pumped continuously.
Air was supplied at a rate of 500 ml min-1 to the water
in three microcosms, (CO 2 concentration 360 ppm, control groups) whereas the water in the other three microcosms were aerated with CO 2 -enriched air (CO 2 concentration 2,000 ppm higher than the air, CO2 groups).
The flow rates of air (500 ml min-1) and CO2 (1 ml min1
) were controlled using flow meters (Kofloc). The pH
and temperature of water in each microcosm was measured daily using a pH meter (Horiba, D-25). No food
was supplied. The entire volume of seawater in each
microcosm was renewed once a week throughout the
experiment. The photoperiod was set to 14L:10D.
To monitor changes in the meibenthic community,
sediment was sampled on days 0 (untreated cores), 7,
14, 21, 28, and 56. At each sampling, one sediment core
(1-cm deep) was taken from each microcosm using a
plastic syringe, the tip of which was cut off to make a
cylinder (2.0 cm internal diameter). Sediment samples
were preserved in 5% borax-buffered formalin seawater.
Rose Bengal was added to stain the meiofaunae. The
samples were sieved through stainless steel sieves with
mesh size of 500, 250, 125, 63, and 32 µm, and the
number of meiofauna was counted under a dissecting
microscope. The biomass of the meiofauna was calculated by using the standard ash-free dry weight per
individual as reported by Shirayama [20]. Treatment
effects were evaluated statistically using Student t-test
and two-way ANOVA. Values are given as means ±
S.D..
each microcosm varied between 13.0°C to 17.8°C
(Figure 1). The difference in water temperature was
less than 0.1°C between any two microcosms throughout the experiment. The average seawater pH values of
the control and CO2 groups were 8.20 ± 0.05 and 7.40 ±
0.07, respectively (Figure 1).
2. Effects on the abundance and biomass of meiofauma
The abundance of total meiofauna was significantly lower in the CO2 groups than in the control of the
same day only on day 7 (t-test, p < 0.05, Figure 2). The
total biomass fluctuated in both control and CO2 groups
during the experiment (2-way ANOVA, p < 0.05,
Figure 2), but there was no difference between the two
groups at any given day of observation throughout the
experiment (t-test, Figure 2).
The composition of meiobenthic community in
this study consisted of nematodes (67.8 ± 7.5%),
harpacticoid copepods (24.4 ± 4.4%), nauplii larvae
(4.3 ± 2.7%), ostracods (1.6 ± 1.6%), turbellarians (1.9
± 1.4%) and polychaeta (0.1 ± 0.3%). The foraminiferans were excluded from our analysis because of their
fragile nature.
The abundance and the biomass of the two dominant taxa, nematodes and copepods (including adults
and copepodites), were further investigated to examine
possible changes in meiofauna composition. The abundance of nematodes varied significantly with time in
both control and CO2 groups (2-way ANOVA, p < 0.05,
Figure 3), whereas there was no difference between the
20
Temperature (°C)
tible to the direct and indirect effects of seawater CO2 .
We also investigated the effects on nauplius larvae,
because the early developmental stages are thought to
be particularly sensitive to environmental changes [14].
18
16
14
Control
CO2
12
10
8.4
8.2
8.0
pH
18
7.8
7.6
7.4
RESULTS
1. Temperature and pH
During the experiment, seawater temperature of
7.2
0
7
14
21
28
Days
35
42
48
56
Fig. 1. Mean seawater temperature and pH of the control and CO2
microcosms during the experimental period.
H. Kurihara et al.: Effects of Elevated Seawater CO2 Concentration on the Meiofauna
Abundance (103 ind. m-2)
Control
CO2
600
400
200
Abundance (103 ind. m-2)
600
800
Control
CO2
*
400
200
Abundance (103 ind. m-2)
200
800
600
400
200
Copepods
100
0
0
7
14
21
28
56
Days
Fig. 2. Change in abundance and biomass of total meiofauna in control and CO2 groups from day 0 to day 56. Initial abundance
of total meiofauna was 385 × 103 ± (16 × 103) ind. m-2 (control)
and 475 × 103 ± (147 × 103) ind. m-2 (CO2 groups). Initial
biomass of total meiofauna was 437 × 197 mgC m-2 (control)
and 521 ± 400 mgC m-2 (CO2 microcosms). Mean ± SD of three
replicate microcosms. * Significant difference between control
and CO2 groups (p < 0.05, t-test).
300
Abundance (103 ind. m-2)
Biomas (mg C m-2)
Nematodes
0
0
1000
0
19
Nauplii
200
100
0
0
7
21
14
28
56
Days
two except on day 7 (t-test, p < 0.05, Figure 3). There
was a decreasing tendency in nematode biomass in both
groups (2-way ANOVA, p < 0.05, Figure 4), although
no significant difference was detected between the
two groups at any given day of observation (t-test,
Figure 4).
No difference in the abundance of harpacticoid
copepods was either detected throughout the experiment between the two groups (t-test, Figure 3). On day
7, the biomass of harpacticoid copepods in CO2 groups
was significantly higher than control groups, whereas
the reverse was true on day 21 (t-test, p < 0.05, Figure
4).
No difference in the abundance of harpacticoid
nauplii was detected throughout the experiment between the two groups (t-test, Figure 3). The abundance
of other components of meiofauna, such as polychaetes,
ostracods, and turbellarians, were also unaffected by
CO 2 .
Fig. 3. Changes in the abundance of nematodes, harpacticoid copepods and nauplii in sediment in control and CO2 groups from
day 0 to day 56. Initial abundance of nematodes was 274 × 103
± (16 × 103) ind. m-2, copepods was 90 × 103 ± (18 × 103) ind.
m-2, and nauplii was 10 × 103 ± (3 × 10³) ind. m-2 (control). Initial
abundance of nematodes was 302 × 103 ± (86 × 103) ind. m-2,
copepods was 122 × 103 ± (25 × 103) ind. m-2, and nauplii was
31 × 103 ± (22 × 103) ind. m-2 (CO2 groups). Mean ± SD of three
replicate microcosms. * Significant difference between control
and CO2 groups (p < 0.05, t-test).
of CO 2 tolerance. The most abundant sizes of nematodes and harpacticoid copepods were between 250 and
125 µm (Figures 5, 6). For nematodes, there was a
significant difference between treatments in the abundance of 250- to 125 µm size classes on day 7 (t-test, p
< 0.05, Figure 5c), but not in the other size classes
(Figure 5). For harpacticoid copepods, no significant
differences were observed between treatments in any
size class throughout the experiment (Figure 6).
3. Effects on the different sizes of meiofauna
DISCUSSION
We analyzed the size structure of nematodes and
harpacticoid copepods to evaluate the size dependency
Our results suggest that atmospheric CO2 concen-
Special Issue (2007)
20
-2
Control
CO2
(a)
Control
15
CO2
3
150
100
50
0
800
Biomass (mg C m-2)
20
Nematodes
Abundance (10 ind. m )
Biomass (mg C m-2)
200
10
5
0
80
Copepods
(b)
60
600
*
*
400
40
20
200
0
0
7
21
14
28
56
0
300
Days
Fig. 4. Change in the biomass of nematodes and harpacticoid copepods in control and CO2 groups from day 0 to day 56. Initial
abundance of nematodes was 132 ± 17 mgC m-2 and copepods
was 282 ± 203 mgC m-2 (control). Initial abundance of nematode was 310 ± 367 mgC m-2 and copepods was 133 ± 55 mgC
m-2 (CO2 groups). Mean ± SD of three replicate microcosms. *
Significant difference between control and CO2 groups (p <
0.05, t-test).
(c)
200
100
0
0
tration projected by the year 2300 (2,000 ppm higher
than the control) does not induce lethal effects on most
meiofaunae, at least within 56 days. In contrast,
Shirayama and Thornton [21] showed that increased
mortality of sea urchins and a gastropod after 6 months,
when they were exposed to only 200 ppm above ambient
or 580 ppm CO 2 . Similarly, we observed increased
mortality of shrimps Palaemon pacificus exposed to
1,000 ppm CO 2 for 30 weeks and to 2,000 ppm CO 2
concentrations for 15 weeks (submitted). Thus, CO 2
tolerance differs markedly among marine organisms.
The apparent higher tolerance of the benthic meiofauna
may be attributable to several factors. First, the sea
urchins, gastropod and shrimps are epibenthos, exposing themselves to ambient seawater, whereas the organisms examined in the present study largely confine
themselves in sedimentary mud. Because of larger
fluctuations of CO2 concentration in pore water, species
dwelling in sediments may be more tolerant to CO2 than
pelagic organisms [16]. Second, calcified marine organisms such as snails, echinoderms and crustaceans
are thought to be more sensitive to CO 2 than other
organisms due to the high sensitivity of CO2 effects on
calcification mechanisms [8]. Specific difference in the
response to elevated CO 2 may change community
200
7
14
21
28
56
(d)
150
100
50
0
60
(e)
40
20
0
0
7
14
21
28
56
Days
Fig. 5. Changes in the abundance of nematodes of different size classes:
(a) > 500 µm, (b) 500-250 µm, (c) 250-125 µm (d) 125-63 µm, and
(e) 63-32 µm in control and CO2 groups from day 0 to day 56.
Mean ± SD of three replicate microcosms. * Significant difference between control and CO2 groups (p < 0.05, t-test).
H. Kurihara et al.: Effects of Elevated Seawater CO2 Concentration on the Meiofauna
(a)
Control
-2
Abundance (10 ind. m )
10
3
CO2
5
0
50
(b)
40
30
20
10
0
150
(c)
100
50
0
0
50
7
14
21
7
14
21
Days
28
56
(d)
40
30
20
10
0
30
(e)
20
10
0
0
28
56
Fig. 6. Changes in the abundance of harpacticoid copepods of different size classes: (a) > 500 µm, (b) 500-250 µm, (c) 250-125 µm (d)
125-63 µm, and (e) 63-32 µm in control and CO2 groups from
day 0 to day 56. Mean ± SD of three replicate microcosms. *
Significant difference between control and CO2 groups (p <
0.05, t-test).
21
structure, and thereby have ecosystem-level consequences.
Even though meiobenthos are not lethally affected
by elevated CO 2 , it is highly possible that raised CO 2
have sub-lethal effects on reproduction, metabolism
and growth rate. Michaelidis et al., [15] reported that
long-term exposure (3 months) of the marine mussels to
CO 2 -acidified seawater (pH 7.3) resulted in a depression of respiration rate. Similarly, reduced growth rate
and feeding activity under low pH were observed in
clams and oysters [2, 3]. When sea urchin eggs were
reared under elevated CO2 levels, the fertilization rate
of the eggs tended to decrease with increasing CO 2
concentration [13]. In the present study, the abundance
of small-sized nematodes (Figure 5e) and nauplius embryos (Figure 3) never disappeared throughout the
experiment, although their abundance fluctuated in both
control and CO 2 microcosms. This suggest that may
have been successful recruitments under elevated CO2
conditions, and therefore elevated CO 2 had not impacted the reproduction of nematodes and harpacticoid
copepods. However, it is possible that, there could have
been a change in the species composition of nematodes
or harpaticoid copepods, in spite of no observed change
in the abundance or biomass of meiofauna in the elevated microcosms. Indeed, Takeuchi et al. [23] demonstrated in CO2 tolerance between marine nematode
species. Analyses of nematodes and harpacticoids to a
lower taxonomic level are needed to more closely evaluate impacts of raised CO2 on these meiofaunal taxa.
Investigating biological impacts of elevated CO 2
is of importance in the context of understanding environmental impacts of not only ocean acidification due to
increasing atmospheric CO2, but also of potential seepage from sub-seabed geological CO2 storage, for which
no scientific information is currently available [12].
Biological impacts should differ depending on the extent (from geologically localized to spatially dispersed),
duration (slow gradual to sudden intermittent), the magnitude of CO 2 flux leaked, and the phase of CO 2
(supercritical, liquid or gas), let alone the local fauna
and flora of seepage sites. However, endobenthic organisms may well be subjected to much higher CO 2
concentrations than the projected maximum concentrations of atmospheric CO 2 . Appropriate experimental
protocols must be employed to evaluate the risk of
potential seepage from sea-bed geological storage, because the expected hazards are distinctly different from
the impact of CO2 injection into mid-water depths [12].
In conclusion, the results demonstrated that the
increased seawater CO2 concentration used in the present
study does not have acute impacts on the abundance and
biomass of the meiofauna. Yet, it is possible that the
meiofauna is sublethally affected when exposed to raised
Special Issue (2007)
22
CO 2 concentration for longer durations and that the
meiobenthic community structure changes due to differences in CO2 tolerance among species. Further studies are needed to understand the future impacts of
increasing atmospheric CO 2 on the marine ecosystem.
12.
13.
ACKNOWLEDGEMNT
We gratefully acknowledge Mr. K. Okita and Mr.
Y. Yamamoto for their help in sampling the sediments.
We are thankful to Mr. M. Oota, Mr. K. Tsugoshi and
Mr. T. Yamamoto for helping set up the microcosms.
We thank Dr. G. Itani for advice on statistical analysis.
14.
15.
REFERENCES
1. Arrigo, K.R., Robinson, D.H., Worthen, D.L., Dunbar,
R.B., DiTullio, G.R., VanWoert, M., and Lizotte, M.P.,
“Phytoplankton Community Structure and the Drawdown of Nutrients and CO2 in the Southern Ocean,”
Science, Vol. 283, pp. 365-367 (1999).
2. Bamber, R.N., “The Effects of Acidic Seawater on
Young Carpet-Shell Clams Venerupis Decussata (L.)
(Mollusca: Veneracea),” Journal of Experimental
Marine Biology and Ecology, Vol. 108, pp. 241-260
(1987).
3. Bamber, R.N., “The Effects of Acidic Seawater on Three
Species of Lamellibranch Mollusk,” Journal of Experimental Marine Biology and Ecology, Vol. 143, pp. 181191 (1990).
4. Bezemer, T.M. and Jones, T.H. “Plant-Insect Herbivore
Interactions in Elevated Atmospheric CO2: Quantitative
Analyses and Guild Effects,” Oikos, Vol. 82, pp.
212-222 (1998).
5. Caldeira, K. and Wickett, M.E., “Anthropogenic Carbon
and Ocean pH,” Nature, Vol. 425, pp. 365 (2003).
6. Coull, B.C. and Bell, S.S., “Perspectives of Marine
Meiofauna Ecology,” In Livingstone, R. J. (Eds), Ecological Processes in Coastal and Marine Systems, Plenum Publishing Corporation, New York, pp. 189-216
(1979).
7. Coviella, C.E. and Trumble, J.T., “Effects of Elevated
Atmospheric Carbon Dioxide on Insect-Plant
Interactions,” Conservation Biology, Vol. 13, No. 4, pp.
700-712 (1999).
8. Feely, R.A., Sabine, C.L., Lee, K., Berelson, W. Kleypas,
J., Fabry, V.J., and Millero, F.J., “Impact of Anthropogenic CO2 on the CaCO3 System in the Oceans,” Science,
Vol. 294, pp. 362-366 (2004).
9. Gerlach, S.A., “On the Importance of Marine Meiofauna
for Benthos Communities,” Oecologia, Vol. 6, pp. 179190 (1971).
10. Giere, O., “The Impact of Oil Pollution on Intertidal
Meiofauna. Field Studies after the La Coruna-Spill, May
1976,” Les Cahiers de Biologie Marine, Vol. 20, pp.
231-251 (1979).
11. Houghton, J.T., Ding, Y., Griggs, D.J., Noguer van der
Liden, M.P.J., Dai, X., Maskell, K., and Johnson, C.A.,
16.
17.
18.
19.
20.
21.
22.
23.
24.
Climate Change 2001: The science of climate change,
Cambridge Cambridge University (2001).
IPCC, Carbon Dioxide Capture and Storage, Cambridge Cambridge University (2005).
Kurihara, H. and Shirayama, Y., “Effects of Increased
Atmospheric CO2 on Sea Urchin Early Development,”
Marine Ecology Progress Series, Vol. 274, pp. 161-169
(2004).
Kurihara, H., Shimode, S., and Shirayama, Y., “Effects
of Raised CO2 Concentration on the Egg Production
Rate and Early Development of Two Marine Copepods
(Acartia Steueri and Acartia Erythraea),” Marine Pollution Bulletin, Vol. 49, pp. 721-727 (2004).
Micahelidis, B., Ouzounis, C., Paleras, A., and Pörtner,
H.O., “Effects of Long-Term Moderate Hypercapnia on
Acid-Base Balance and Growth Rate in Marine Mussels
Mytilus Galloprovincialis,” Marine Ecology Progress
Series, Vol. 293, pp. 109-118 (2005).
Pörtner, H.O., Langenbuch, M., and Reipschläger, A.,
“Biological Impact of Elevated Ocean CO 2
Concentrations: Lesson from Animal Physiology and
Earth History,” Journal of Oceanography, Vol. 60, pp.
705-718 (2004).
Riebesell, U., Wolf-Gladrow, D.A., and Smetacek, V.,
“Carbon Dioxide Limitation of Marine Phytoplankton
Growth Rates,” Nature, Vol. 361, pp. 249-251 (1993).
Root, T.L., Price, J.T., Hall, K.R., Schneider, S.H.,
Rosenzweig, C., and Pounds, J.A., “Fingerprints of
Global Warming on Wild Animals and Plants,” Nature,
Vol. 421, pp. 57-60 (2003).
Sarmiento, J.L., Hughes, T.M.C., Stouffer, R.J., and
Manabe, S., “Simulated Response of the Ocean Carbon
Cycle to Anthropogenic Climate Warming,” Nature,
Vol. 393, pp. 245-248 (1998).
Shirayama, Y., “Size Structure of Deep-Sea Meio- and
Macrobenthos in the Western Pacific,” Internationale
Revue der Gesamten Hydrobiologie, Vol. 68, No. 6, pp.
799-810 (1983).
Shirayama, Y. and Thornton, H., “Effect of Increased
Atmospheric CO2 on Shallow Water Marine Benthos,”
Journal of Geophysical Research, Vol. 110, C09S08
(2005).
Takahashi, T., Feely, R.A., Weiss, R.F., Wanninkhof, R.
H., Chipman, D.W., Sutherland, S.C., and Takahashi, T.
T., “Global Air-Sea Flux of CO2: An Estimated Based on
Measurements of Sea-Air pCO2 Difference,” Proceedings of the National Academy of Sciences USA, Vol. 94,
pp. 8292-8299 (1997).
Takeuchi, K., Fujioka, Y., Kawasaki, Y., and Shirayama,
Y., “Impacts of High Concentration of CO2 on Marine
Organisms: a Modification of CO 2 Ocean Sequestration,” Energy Conversion & Management, Vol. 38,
pp. S337-S341 (1997).
Walther, G.-R., Post, E., Convey, E., Menzel, A.,
Parmesan, C., Beebee, T.J.C., Fromentin, J.-M., HoeghGuldberg, O., and Bairlein, F., “Ecological Responses to
Recent Climate Change,” Nature, Vol. 416, pp. 389-395
(2002).


© Copyright 2026