
Microbial quality, instrumental texture, and color
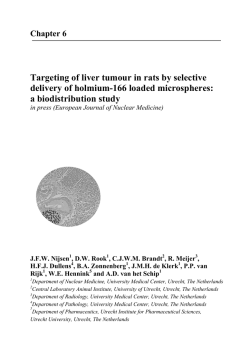
Veterinary World, EISSN: 2231-0916
Available at www.veterinaryworld.org/Vol.8/January-2015/19.pdf
RESEARCH ARTICLE
Open Access
Microbial quality, instrumental texture, and color profile evaluation of
edible by-products obtained from Barbari goats
Pramila Umaraw1, V. Pathak1, V. Rajkumar2, Arun K. Verma2, V. P. Singh1 and Akhilesh K. Verma1
1. Department of Livestock Products Technology, College of Veterinary Sciences and Animal Husbandry, Uttar Pradesh
Pandit Deen Dayal Upadhyaya Pashu Chikitsa Vigyan Vishwavidyalaya Evam Go Anusandhan Sansthan, Mathura,
Uttar Pradesh, India; 2. Goat Products Technology Laboratory, Central Institute for Research on Goats, Makhdoom,
Mathura, Uttar Pradesh, India.
Corresponding author: Pramila Umaraw, e-mail: [email protected], VP: [email protected],
VR: [email protected], ArKV: [email protected], VPS: [email protected],
AKV: [email protected]
Received: 09-08-2014, Revised: 06-12-2014, Accepted: 11-12-2014, Published online: 29-01-2015
doi: 10.14202/vetworld.2015.97-102. How to cite this article: Umaraw P, Pathak V, Rajkumar V, Verma AK, Singh VP,
Verma AK. (2015) Microbial quality, instrumental texture and colour profile evaluation of edible byproducts obtained from
Barbari goats, Veterinary World, 8(1): 97-102.
Abstract
Aim: The study was conducted to estimate the contribution of edible byproducts of Barbari kids to their live and
carcass weight as well as to assess textural and color characteristics and microbiological status of these byproducts.
Materials and Methods: Percent live weight, Percent carcass weight, Texture, color, and microbiological analysis was
done for edible byproducts viz. liver, heart, kidney, spleen, brain and testicle and longissimus dorsi muscle was taken as a
reference.
Results: The edible byproducts of Barbari kids constitute about 3% of the live weight of an animal of which liver contributed
maximum (1.47%) followed by testicles (0.69%) and heart (0.41%). While the same constituted 3.57, 1.70, and 0.99%,
respectively on carcass weight. There was significant (p<0.05) difference among all organs regarding textural properties.
Liver required the maximum shear force and work of shear (121.48N and 32.19 kg-sec) followed by spleen and heart. All
organs revealed characteristics color values (L*, a*, b*, chroma, and hue) which were significantly different (p<0.05) from
muscle values. The total viable count, coliform count showed slight differences for all organs studied. The staphylococcus
counts were low with little differences among organs.
Conclusion: Edible byproducts have a significant contribution to carcass weight which could enhance total edible portion
of the carcass. Efficient utilization of these by-products returns good source of revenue to the meat industries. Textural and
color analysis give information for their incorporation in comminuted meat products, and microbial study tells about the
storage study. However, study was in the preliminary and basic step forward toward better utilization of 3% of live animal
which could increase the saleable cost of animal by 6.94%.
Keywords: edible byproducts, hunter color lab, microbial quality, textural characteristics
Introduction
Goats play a very vital role in the livelihood
security of the small, marginal, and landless farmers
especially in arid, semi-arid, and mountainous regions.
Their popularity is mainly due to their short generation
intervals, higher rate of prolificacy, adaptability, and
relatively inexpensive rearing. They thrive well and
reproduce in tropical, cold, humid as well as dry regions.
India ranks first in goat population having 154 million
goats [1]. The consumption of chevon has increased
in past few years largely due to its unique flavor, lean
characteristics and universal socio-religious acceptability [2]. But against the beef and pork, goat meat
has regional preferences such as in African countries,
Mediterranean countries, Latin America, Middle East
and the Asian Southwest region. The majority of goat
population is concentrated in the developing countries
where due to religious or traditional customs goat meat
Copyright: The authors. This article is an open access article licensed
under the terms of the Creative Commons Attributin License (http://
creative commons.org/licenses/by/2.0) which permits unrestricted
use, distribution and reproduction in any medium, provided the
work is properly cited.
Veterinary World, EISSN: 2231-0916
or chevon consumption is quite high. Meat production is growing fast, especially in the countries of East
and Southeast Asia [3]. Mahanjana and Cronje [4] in
a cross culture-education-ethnic study highlighted that
goat meat and African cultural activities have a close
association. There is an increased demand of chevon
in Greece, Italy, France, Spain, and Portugal around
Christmas, Easter or any other festive season. The food
consumption pattern of world is expected to increase in
the livestock products sector driven by the growth rate
of 4% in meat consumption by the developing countries [5]. While there would be very slight increase or
a stagnant phase of growth in the developed countries
regarding meat consumptions. At present, livestock
sector has become the biggest competitor for utilization
of agricultural land for human consumption utilizing
about 30% of global arable land [6]. Environmental
implications, as well as nutritional imbalance in diets,
are pointing toward the sustainable livestock production with efficient utilization of each animal slaughtered for human consumption. Efficient utilization of
the edible by-products can be one such way.
97
Available at www.veterinaryworld.org/Vol.8/January-2015/19.pdf
Edible byproducts constitute about 20-30% of
live weight of the animal in case of cattle buffalo,
sheep, and goats. It has been estimated that 11.4% of
the gross income from beef and 7.5% of the income
from pork can be generated from the utilization of
by-products [7]. The hygienic handling and collection of these edible by-products plays a pivotal role in
their efficient utilization. The microbiological status
of these by-products during processing can be thus
employed as an analytical tool for assessing hygienic
collection and handling.
Meat processing industry is evidencing a boom
because of the increasing interest of consumers in
convenience foods. Convenience foods occupy about
one-third of British food markets. US are the largest
consumer of chilled ready-made meals followed by
UK [8]. The change in lifestyle, increased participation of women in outdoor works, increased self-dependent individuals, increased workload and lack of
time coupled with increased income, buying capacity, and status concerns has shifted the home cookery
to institutional, restaurant, supermarket ready to eat
products. Processing has also opened new avenues for
value-added lost cost products development. In this
regard utilization of edible by-products as, filler has a
promising future. But for their adequate utilization the
effect on textural and color characteristic is essential
as texture and color are the two most important quality cues ascertaining consumer perception of meat and
meat products [9].
The optimum utilization of edible byproducts
has become essential for sustaining meat industry,
reducing the environmental pollution and for alleviating nutritional scarcity. Comprehensive knowledge of
these byproducts is required in respect of their functional properties for optimum utilization and maximizing returns to the meat industry sector. Scientific
literature on the nutritional value of offals is relatively
scarce and very few data are available on “variety
meat and by-products” [10]. The various aspects
of product development with edible byproducts or
organ meat have been studied by some of the workers
like [11-14]. But the textural, color and microbiological status and characteristics of the organs used has
been unexplored.
Thus, the present study was designed with the
objectives of determining the percentage yield of
different edible by-products in goats; evaluating the
microbiological quality of edible byproducts and for
analyzing the textural and color characteristics of
these by-products.
Materials and Methods
Ethical approval
The study was conducted after the approval of
Institutional Animal Ethics Committee.
The work was conducted in Department of
Livestock Products Technology, College of Veterinary
Sciences and Animal Husbandry, DUVASU, Mathura,
Veterinary World, EISSN: 2231-0916
Uttar Pradesh, India and at Goat Products Technology
(GPT) Laboratory, Central Institute for Research on
Goats (CIRG), Makhdoom, Mathura, Uttar Pradesh,
India. Twenty Barbari kids were reared in Barbari
experiment unit at CIRG after weaning under routine conditions like grazing plus concentrate supplementation. Regularly animal was taken out for 8 h
browsing daily in the grazing land of CIRG and concentrate mixture containing crude protein 14%, total
digestible nitrogen 60% was also provided at the rate
of 2% of body weight along with free access to clean
drinking water twice daily, in morning before taking the animals out for grazing/feed offer and in the
afternoon, on their return from grazing area. Ten male
weaner Barbari kids each of 5-7 months of age having
similar body conditions were used for the study. The
selected animals were slaughtered as per the standard procedure at the experimental slaughterhouse of
GPT laboratory of CIRG, after 16-18 h fasting with
ad-libitum supply of water. Dressed carcasses were
weighed within 1 h (hot carcass weight) and slaughter
by-products were hygienically collected and weighed
within 30 min longissimus muscle from loin cut (high
value) was also collected and stored for further study
as a reference in experimental studies. All the collected samples were immediately shifted to low-density polyethylene film pouches of 250 gauge thickness of natural color and stored at −18°C for further
study.
Carcass characteristics
Percent live weight
The weight of the organs and reference muscle
was recorded to find out their contribution to the carcass on live weight basis.
Weight of organ
×100
Weight of live animal at the time of slaughtter
Percent carcass weight
The weight of the organs and reference muscle
was recorded to find out their contribution to the carcass on carcass weight basis.
Weight of organ
×100
Weight of dressed carcass
Texture profile analysis (TPA)
Textural properties of organ pieces were evaluated using the texturometer (stable micro system
TA.XT-2i/25) at GPT Laboratory of Central Institute
for Research on Goats (CIRG) Makhdoom, Mathura.
TPA was carried out as per the method described by
Bourne [15] to get the shear force and work of shear.
Shear force (N/cm2) and work of shearing (Ns) of
samples were estimated with Warner-Bratzler reversible blade attached to the same texture analyzer. Six
1 cm3 cylindrical bores were made at different positions on the organs, and these bores were used for
analysis. The crosshead speed was 2 mm/s. Maximum
98
Available at www.veterinaryworld.org/Vol.8/January-2015/19.pdf
force required to cut the sample (shear force) and the
work needed to move the blade through the samples
(work of shearing) were recorded.
Instrument color measurement
The color parameters of the edible by-products
used in the study were monitored by Hunter ‘L*’, ‘a*’
and ‘b*’ values using color tech PCM+ (Color Tec
Associates Inc. Clinton NJ, USA) and Chroma and
hue values were derived from them.
Assay for microbiological quality
Total viable count (TVC), total coliform counts
(CC), Staphylococcus spp. counts (SCC) in the samples
were enumerated following the methods as described
by American Public Health Association [16].
Statistical analysis
The data obtained in the study on various parameters were statistically analyzed on “SPSS-19.0”
Software Package as per standard methods [17]. For
each parameter duplicate samples were drawn and were
analyzed thrice (n=6). Data obtained were subjected
to one-way analysis of variance, the homogeneity test
and Duncan’s Multiple Range Test for comparing the
means to find the effects between samples. The statistical significance was expressed at (p<0.05).
Results and Discussion
The average age of animals studied was 188 days.
While the average live weight of animals recorded
during the research period was 17.5±0.44 kg and average carcass weight was 8.12±0.39 kg which was lower
than the values reported by [18]. The average dressing percentage recorded was 46.38%. This result is in
agreement with the findings of Das and Rajkumar [19]
who reported a dressing percent of 45.11 in Barbari
goats. But a higher dressing percentage was reported
by Prpic et al. [20] which might be attributed to the
fact that kidneys, kidney and pelvic fat were retained
in carcass and was calculated together for the dressing percentage calculations. In a study Rajkumar
et al. [21] have reported that for higher yield of variety meats younger animals under intensive system of
management are better.
The percent live weight and carcass weight of
different edible by-products have been tabulated in
Table-1. The mean percent live weight as well as percent carcass weight was found to be highest in liver
among all edible by-products. Similar findings were
reported by Ockerman and Basu [22] who found the
highest percent live weight for liver among all other
edible by-products. The percent live weight of liver
differed significantly (p<0.05) from those of spleen
and brain while it evinced a non-significant (p>0.05)
difference from that of kidney, heart, and testicles.
The percent live weight of liver obtained during study
in consort with the studies of Sen et al. [23] who
reported the liver percent pre-slaughter weight as
1.32%, and Owen and Norman [24] observed average
liver weight of 1.6% on live weight basis in Botswana
kids. Prpic et al. [20] reported a little higher (1.86%)
value for liver in the Croatian multicolored goat.
The percent live weight and the percent carcass weight of kidney and heart were in agreement
with [25,26]. Percent live weight of spleen was 0.18%
while percent carcass weight was 0.45. It was in
agreement to Prpic et al. [20], Babiker et al. [27] who
reported that percent spleen weight in goats of Sudan
desert was 0.2-0.3%. Percent live weight of brain
was found to be 0.164% in present study which was
slightly lower than the values reported by Okerman
and Basu [22] which could be attributed to the fact
that the animals used in the study were of growing
stage. The respective mean percent live weight and
carcass weight of testicles was 0.69% and 1.70%. The
percent live weight of testicles was higher than that
of reported by Prpic et al. [20] and Mushi et al. [28]
which may be because of breed or age of animals used
for the study.
Textural characteristics
The results of texture analysis have been presented in Table-2. The maximum (121.48±0.43)
shear force and work of shear was evinced by liver
while the minimum (3.48±0.11) values for the same
was observed in brain. The textural properties of
fresh meat are evaluated by number of muscle fibers
and thickness of connective tissue septa which is
Table-1: Least square means (±SE) of percent live weight and percent carcass weight of different edible by‑products of
Barbari kids
Edible by‑products
Percent live weight (%)
Percent carcass weight (%)
Liver
Kidney
Heart
Spleen
Brain
Testicles
1.47a±0.07
3.57a±0.19
0.26ab±0.01
0.62cd±0.03
0.41ab±0.03
0.99bcd±0.07
0.18b±0.01
0.45d±0.03
0.16b±0.02
0.40d±0.04
0.69ab±0.04
1.70b±0.12
Values within rows with different superscripts are significantly different (p<0.05), SE=Standard error
Table-2: Textural characteristics of edible by‑products and longissimus dorsi muscle of Barbari kids (means±SE)
Edible by‑products
Shear force (N)
Work of shear
area (kg‑sec)
Muscle
Liver
Kidney
Heart
Spleen
Brain
Testicles
45.51 ±0.62 121.48 ±0.43 45.63 ±0.59 57.81 ±1.33 108.85 ±0.99 3.49 ±0.11 14.59e±0.13
19.90d±0.19 32.20a±0.19 17.34e±0.28 22.09c±0.34 26.95b±0.21 0.56g±0.02 6.61f±0.07
d
a
d
c
b
f
Values within rows with different superscripts are significantly different (p<0.05), SE=Standard error
Veterinary World, EISSN: 2231-0916
99
Available at www.veterinaryworld.org/Vol.8/January-2015/19.pdf
measured by texture profile analysis. The Shear
force value of muscle was within the range reported
by Arguello et al. [29] i.e., 32.6-56.34 N but was
lower than the values reported by [30]. The mean
shear force and work of shear area values of liver and
spleen were significantly higher (p<0.05) than that
of muscle this could be attributed to their structural
conformation. Liver is an organ composed mainly of
parenchymatous tissue arranged into laminae associated with dense vasculature along with the connective tissue capsule that further divides the organ into
lobes and lobules. Similarly, the spleen is covered
with a capsule of dense irregular connective tissue oriented circumferentially. Various collagenous
cords or trabeculae extend radially from the capsule
into the body of spleen. These could be a possible
reason for the higher shear force and work of share
area values in liver and spleen. The Shear force value
of kidney was non-significant (p>0.05) from that of
muscle which could be due to its muscular structure
quite similar to that of muscle. The Shear force value
of brain was significantly (p<0.05) lower than other
organs meat due to the soft structure and higher fat
content.
The textural studies revealed that organ meats
had varied textural characteristics. Spleen and liver
showed higher shear force and work of shear than
muscles which might be attributed to their higher connective tissue contents. Kidney and heart exhibited
similar textural characteristics to muscles. Thus, these
can be efficiently utilized in comminuted meat products. Brain evinced very low shear force and work
of shear values. Thus, percent incorporation of these
organs in various meat products needs to be further
studied for their optimum level of incorporation without affecting the textural properties of the product.
Color characteristics
Color is one of the most important cue influencing the purchasing behavior of consumers [31]. The
Hunter color values of longissimus muscle and edible
by-products viz. liver, kidney, heart, spleen, brain and
testicles were evaluated in terms of lightness (L*),
redness (a*), yellowness (b*), chroma, and hue. The
statistical values thus obtained have been presented in
the Figure-1. The L*, a* and b* values of longissimus muscle in the present study were somewhat lower
than the values reported by Pena et al. [32]; Kadim
et al. [33]; Hussain et al. [34] which could be due
the difference in the average age of animals studied
in various experiments. The muscle color becomes
darker with the progression of maturity in goats [32].
Brain and testicles showed lightness value in
a higher range than that of muscle, while values of
the rest of the organs lied in a lower range. Except
for heart and spleen, all organs differed significantly
(p<0.05) in their mean lightness values. The mean
lightness and yellowness values were found to be
highest in brain tissue among all organs meat which
might be due to higher fat content resulting into higher
reflectance. Kidney, heart, and spleen had closer mean
lightness value to the muscle while brain and testicles evinced higher L* value this could be attributed
to their higher moisture and fat content which cause
higher reflectance.
The yellowness value of kidney, brain, and testicles was significantly (p<0.05) higher than that of
muscles which could be attributed to their higher
moisture contents. The redness value of liver differed
non-significantly (p>0.05) from muscle while rest all
organs showed significant (p<0.05) differences from
it. The heart evinced a higher mean redness value than
other organs meat due to its higher myoglobin and
oxidative enzymes contents and even to the extensive
blood supply whereas the redness value of spleen lied
in the negative axis that indicated that the reflectance
from the surface was the green axis instead of the red
coordinate of chromaticity.
Chroma of all organs except liver differed significantly (p<0.05) from muscle, while hue of muscle,
liver and heart differed non-significantly. The chroma
and hue of longissimus dorsi muscle were in consort
with the findings of [35].
The color attributes varied significantly among
organs. Liver, kidney, and heart exhibited values close
to that of muscles which imply that their incorporation in products would not much alter the color values
of meat products. Spleen can be utilized to provide
dark reddish color to the products as it evinced lower
lightness value and inclination toward blue and green
values.
Microbiological assay
Figure-1: Instrumental color characteristics of edible
by-products and longissimus dorsi muscle of Barbari kids
(means ± standard error)
Veterinary World, EISSN: 2231-0916
The microbiological status of freshly collected
edible by-products was analyzed by estimation of
total plate count (TPC), CC, SCC and the Salmonella
count (log10 CFU/g). The mean and standard error
values thus obtained are presented in the Table-3.
The mean TPC were found to be significantly higher
(p<0.05) in the liver as compared to other edible
100
Available at www.veterinaryworld.org/Vol.8/January-2015/19.pdf
Table-3: Microbial counts (log10 CFU/g) in different edible by‑products and longissimus dorsi muscle of Barbari kids
Parameters/sample
Muscle
Liver
Kidney
Heart
Spleen
Brain
Testicles
TPC (Log CFU/g)
4.44 ±0.03 4.85 ±0.01 4.36 ±0.03 4.33 ±0.03 4.79 ±0.01 3.90 ±0.17 4.15c±0.13
Coliforms (Log CFU/g)
2.22a±0.12 2.32a±0.05 1.99ab±0.12 2.09ab±0.12 2.16ab±0.13 1.85b±0.12 2.14ab±0.09
Staphylococcus (Log CFU/g) 1.86ab±0.14 2.21a±0.13 1.98ab±0.11 2.06ab±0.12 2.11a±0.12 1.69b±0.13 1.85ab±0.14
Salmonella (Log CFU/g)
ND
ND
ND
ND
ND
ND
ND
b
a
bc
bc
a
d
Values within rows with different superscripts are significantly different (p<0.05), ND=Not detected, TPC=total plate count
by-products. The possible reason behind this might be
due to higher glycogen content which could be a good
energy source for the growth of microorganisms. The
initial TPC of edible offals was in order of 104 log
CFU/g. Patterson and Gibbs [36] also reported an initial APC of 104-105 CFU cm−2 for liver, kidney, heart,
tongue, and diaphragm. The count in the present study
were within the safe range as prescribed by CFR is 106
CFU/g [37]. Abdullah [38] reported similar findings
for the TVC count as observed in the present study.
The mean Staphylococcal count was found
within the range of 1.97-2.24 which is acceptable raw
organ meats [38]. The mean SCC of liver and spleen
differed significantly (p<0.05) from that of the brain.
The CC were in log 2 range which was also reported
by [39]. The mean CC (log10 CFU/g) of liver and muscle differed significantly (p<0.05) from that of the
brain. Rest of the organs differed non-significantly.
Salmonella count was not at all detected in the present
study, which possible reason behind this might be the
good manage mental practices, hygienic handling, and
processing of the organs during analysis.
Authors’ Contributions
Conclusion
2.
Edible by-products have a significant contribution to carcass weight which could increase total edible components of the carcass. If properly utilized,
these can be a good source of revenue to the producers. Textural and color characteristics studied can
serve as a guide for their incorporation in comminuted
meat products. Further studies regarding cholesterol
level are required before use of these edible byproducts in product formulations especially for byproducts
like brain. Percent incorporation also requires detailed
studies as to find out the adequate replacement percent of each byproduct which would not have a negative effect on physicochemical, nutritive, textural,
and color characteristics of the end product. Studies
regarding the residual drugs or chemicals should also
be evaluated before commercializing these organs.
The greatest hurdle in the efficient utilization of these
byproducts is lack of infrastructure and modernized
abattoirs designed with facilities for collection and
storage of byproducts. Use of effective packaging for
long and better-keeping quality of edible organs needs
attention. The study was a preliminary and basic step
forward toward better utilization of 3% of live animal that is yet not utilized to its fullest potential causing loss of 6.94% revenue (according to local market
price of offals in Mathura).
Veterinary World, EISSN: 2231-0916
VP, VR, AKV designed the experiment. PU carried out the research work and prepared the manuscript with support of VPS. Manuscript was drafted
and edited by ArKV. The final manuscript was read
and approved by all the authors.
Acknowledgments
The authors are highly thankful to the ViceChancellor, U.P. Pt. Deen Dayal Upadhyay Veterinary
Research and Go Anusandhan Sansthan, Mathura,
U.P. India for providing fund and The Director, Central
Institute for Research on Goats (CIRG), Makhdoom,
Mathura, U.P. India for providing the required facilities to carry out this research work.
Competing Interests
The authors declare that they have no competing
interests
References
1.
3.
4.
5.
6.
7.
8.
9.
10.
11.
12.
FAO. (2012) Food and Agriculture Organization. Available
from: http://www.fao.org. [Last accessed on 25-11-2014].
Madruga, M.S. and Bressan, M.C. (2011) Goat meats:
Description, rational use, certification, processing and technological developments. Small Rumin. Res., 98(1-3): 39-45.
Braun, J.V. (2010) The role of livestock production for a
growing world population. Lohmannn Inf., 45(2): 3-9.
Mahanjana, A.M. and Cronje, P.B. (2000) Factors affecting goat production in a communal farming system in the
Eastern Cape region of South Africa. S. Afr. J. Anim. Sci.,
30(2): 149-154.
Food and agriculture organization (FAO). (2012) FAO
Statistical Year Book Europe & Central Asia Food and
Agriculture. FAO, Rome.
Steinfeld, H., Gerber, P., Wassenaar, T., Castel, V.,
Rosales, M. and Haan, C.de (2006) Livestock’s Long
Shadow, Environmental Issues and Options. Food and
Agriculture Organization of the United Nations, Rome.
Liu, D.C. (2008) Better utilization of by-products from the
meat industry. In: Report of Food and Fertilizer Technology
Center, Taipei, Taiwan.
Rivera, X.C.S., Orias, N.E. and Azapagic, A. (2014)
Life cycle environmental impacts of convenience food:
Comparison of ready and home-made meals. J. Clean.
Prod. 73: 294-309.
Troy, D.J. and Kerry, J.P. (2010) Consumer perception and the
role of science in the meat industry. Meat Sci., 86: 214-226.
U.S. Department of Agriculture, Agricultural Research
Service. (2011) USDA National Nutrient Database for
Standard Reference, Release 24. Nutrient Data Laboratory
Home Page. Available from: http://www.ars.usda.gov/ba/
bhnrc/ndl. Last accessed on 24-11-2014.
Maiti A.K. and Ahlawat S.S. (2011) Effect of natural tenderizers on physico-chemical properties of chicken gizzard
and goat heart. Am. J. Food Technol., 6: 80-86.
Toldrá, F., Aristoy, M.C., Mora, L. and Reig, M. (2012)
101
Available at www.veterinaryworld.org/Vol.8/January-2015/19.pdf
13.
14.
15.
16.
17.
18.
19.
20.
21.
22.
23.
24.
25.
26.
Innovations in value-addition of edible meat by-products.
Meat Sci., 92: 290-296.
Florek, M., Litwinczuk, Z., Skalecki, P., KedzierskaMatysek, M. and Grodzicki, T. (2012) Chemical composition and inherent properties of offals from calves maintained
under two production systems. Meat Sci., 90: 402-409.
Hoffman, L.C., Laubscher, L.L. and Leisegang, K. (2013)
Nutritional value of cooked offals derived from free range
rams reared in South Africa. Meat Sci., 93: 696-702.
Bourne, M.C. (1978) Texture profile analysis. Food
Technol., 32: 62-72.
APHA. (1984) In: Speck, M.L. and editors. Compendium
of Methods for the Microbiological Examination of Foods.
2nd ed. American Public Health Association Washington,
D.C. p5-99.
Snedecor, G.W. and Cochran, W.G. (1994) Analysis of
Variance. In: Statistical Methods. 9th ed. Iowa State
University Press, Ames, Iowa. p7-148.
Pieniak-Lendzion, K., Niedziółka, R. and Borkowska, T.
(2009) Some carcass traits and physicochemical composition of white improved breed goat kids slaughtered at 90 and
180 days of age (short communication). Archiv. Tierzucht.,
52(4): 425-431.
Das, A.K. and Rajkumar, V. (2010) Comparative study on
carcass characteristics and meat quality of three Indian goat
breeds. Indian J. Anim. Sci., 80(10): 1014-1018.
Prpic, Z., Vnucec, I., Mioc, B. and Pavic, V. (2010) Growth
performance and carcass traits of croatian multicoloured
breed kids. Acta Agrar. Kapos., 14(2): 267-272.
Rajkumar, V, Agnihotri, M.K, Das, A.K, Ramachandran, N.
and Singh, D. (2010) Effect of age on carcass characteristics
and meat quality of Sirohi goat kids reared under semi-intensive and intensive management systems. Indian J. Anim.
Sci., 80(8): 775-780.
Ockerman, H.W. and Basu, L. (2004) By-products.
Encyclopaedia of Meat Science. Elsevier, Amsterdam.
p104-112.
Sen, A.R., Santra, A. and Karim, S.A. (2004) Carcass yield,
composition and meat quality attributes of sheep and goat
under semiarid conditions. Meat Sci., 66: 757-763.
Owen, J.E. and Norman, G.A. (1977) Studies on the meat
production characteristics of Botswana goats and sheepPart II: General body composition, carcasses measurements
and joint composition. Meat Sci., 1: 283-306.
Dhanda, J.S., Taylor, D.G. and Murray, P.J. (2003) Growth,
carcass and meat quality parameters of male goats: effects
of genotype and live weight at slaughter. Small Rumin. Res,
50: 57-66.
Casey, N.H., Van Niekerk, W.A. and Webb, E.C. (2003)
27.
28.
29.
30.
31.
32.
33.
34.
35.
36.
37.
38.
39.
Goat meat. In: Caballero, B., Trugo, L. and Finglass, P.
editors. Encyclopedia of Food Science and Nutrition.
Academic Press, London. p2937-2944.
Babiker, S.A., El-Khider, I.A. and Shafie, S.A. (1990)
Chemical composition and quality attributes of goat meat
and lamb. Meat Sci., 28: 273-277.
Mushi, D.E., Thomassen, M.S., Kifaro, G.C. and Eik, L.O.
(2010) Fatty acid composition of minced meat, longissimus
muscle and omental fat from Small East African goats finished on different levels of concentrate supplementation.
Meat Sci., 86: 337-342.
Arguello, A., Castro, N., Capote, J. and Solomon, M. (2005)
Effects of diet and live weight at slaughter on kid meat quality. Meat Sci., 70: 173-179.
Schonfeldt, H.C., Naude, R.T., Bok, W., Van Heerden, S.M.,
Swoden, L. and Boshoff, E. (1993) Cooking and juiciness
related quality characteristics of goat and sheep meat. Meat
Sci., 34: 381-394.
Ekiz, B., Ozcan, M., Yilmaz, A., Tölü, C. and Savaş, T.
(2010) Carcass measurements and meat quality characteristics of dairy suckling kids compared to an indigenous genotype. Meat Sci., 85, 245-249.
Pena, F., Bonvillani, A., Freire, B., Juarez, M., Perea, J. and
Gomez, G. (2009) Effects of genotype and slaughter weight
on the meat quality of Criollo cordobes and Anglonubian
kids produced under extensive feeding conditions. Meat
Sci., 83: 417-422.
Kadim, I.T., Mahgoub, O., Al-Ajmi, D.S., Al-Maqbaly, R.S.,
Al-Saqri, N.M. and Ritchie, A. (2003) An evaluation of the
growth, carcass and meat quality characteristics of Omani
goat breeds. Meat Sci., 66: 203-210.
Hussain, M.H., Murray, P.G. and Taylor, D.G. (2000) Meat
quality of first and second cross capretto goat carcasses.
Asian Aust. J. Anim. Sci., 13: 174-177.
Kannan, G., Kouakou, B. and Gelaye, S. (2001) Colour
changes reflecting myoglobin and lipid oxidation in
chevon cuts during refrigerated display. Small Rumin. Res.,
42: 67-75.
Patterson, J.T. and Gibbs, P.A. (1979) Vacuum-packaging of
bovine edible offals. Meat Sci., 3: 209.
Jay, J. (1962) Further studies on staphylococci in meats: III
occurrence and characteristics of coagulase-positive strains
from a variety of non-frozen market cuts. Appl. Microbiol.,
10(3): 247.
Abdullah, B.M. (2008) Composition, chemical and microbiological properties of Jordanian ovine organ meats. Int. J.
Food Sci. Technol., 43: 746-751.
Shelef, L.A. (1975) Microbial spoilage of fresh refrigerated
beef liver. J. Appl. Bacteriol., 39: 273-280.
********
Veterinary World, EISSN: 2231-0916
102


© Copyright 2026