
The Normal Abnormal Theory of Ben Graham
Ben Graham: The Normal Abnormal Theory of Value Investing Author: Tarjei Lode P a g e 1 | 52 Acknowledgements In honour of Benjamin Graham P a g e 2 | 52 Table of Contents Front Page………………………………………………………………………………………………………………………… 1 Acknowledgements………………………………………………………………………………………………………….. 2 Table of Contents………………………………………………………………………………………………………………. 3 Abstract…………………………………………………………………………………………………………………………….. 4 Background……………………………………………………………………………………………………………………….. 5 Research Question……………………………………………………………………………………………………………. 5-‐10 Dissertation Structure……………………………………………………………………………………………………….. 11 Literature Review……………………………………………………………………………………………………………… 12-‐16 Data…………………………………………………………………………………………………………………………………… 17-‐18 Methodology…………………………………………………………………………………………………………………….. 19-‐22 Results………………………………………………………………………………………………………………………………. 23-‐42 Conclusion………………………………………………………………………………………………………………………... 42-‐43 References.……………………………………………………………………………………………………………………….. 44-‐48 Appendix…………………………………………………………………………………………………………………………… 49-‐52 P a g e 3 | 52 1. Abstract For 80 years ago Benjamin Graham introduced to the investment public his theory of Value Investing, a philosophy which has a long-‐standing track record and is used by some of the most renowned investors the world have ever seen. The success of this philosophy has caused much research in the subject of value versus growth stocks, with supporters providing evidence of an outperformance by value stocks both in terms of risk and return, while opponents (which mostly are disciples of the Efficient Market Hypothesis) argues that every bit of higher return is caused by higher risk. In recent years market indexes with exclusively focus on value or growth stocks have been established as a low cost alternative to value investing. This paper aims to investigate whether this low cost method of investing in value indexes outperforms comparable investing into growth indexes. Further I investigate whether such indexes have the same mechanical screening characteristics as was proposed for investing by Benjamin Graham. My results provide evidence of outperformance by value indexes compared to growth indexes in the long-‐run, while short-‐run results are somewhat mixed depending on which geographical region. In the majority of indexes investigated we find the value indexes to share common characteristics, which in academia is synonymous with a value stock and somewhat, support the Graham approach. On the other hand, I do not find these value indexes to represent any replication of Warren Buffett and therefore argue that the approach is not a direct substitute to a true value investing manager. Based on my investigation I therefore conclude that it is possible to earn abnormal returns based on the value investing philosophy, evidence that also goes against the semi-‐strong form of the efficient market hypothesis. 2. Background Benjamin Graham was one of the most influential academics and practitioners in the field of financial analysis of all times. Graham has shown the superiority of his strategy both through his own investment partnership Graham-‐Newman Corporation and his teaching at Columbia University which has born some of the most talented investment professionals in modern times: Warren Buffett, Walter Schloss, Tom Knapp (Tweedy, Browne Company), Mario Gabelli, Seth Klarman, Joel Greenblatt and Paul Sonkin. The performance of his philosophy represented by these disciples’ is indicative of a continually outperformance compared to the market index (Graphs 2.1-‐2.4). Despite following the same framework each individual has a unique approach to investing, ex. Graham based his investments purely on quantitative-‐mechanical selection criteria, while Buffett is more of a combination between Ben Graham and Philip Fisher as he has both a quantitative and qualitative (management quality etc.) view on his investments and holds only a small portfolio of stocks, while Schloss used to own hundreds of stocks in his portfolio. Graham has summarised most of his ideas in P a g e 4 | 52 the books Security Analysis (1934), which among investment professionals is known as the Bible of investing, and The Intelligent Investor (1949), that Buffett has described as the best book on investing in the world. Graph 2.1 – Berkshire Hathaway Graph 2.2 – Tweedy, Browne Global Value Fund Graph 2.3 – Gabelli Value 25 Fund Graph 2.4 – Walter and Edwin Schloss Associates The idea of Graham simply as it might sound is to buy cheap and unpopular stocks, which are out of favour in the rest of the investment world, for substantially less than they are worth (price of a security is minimum 25% less than the true value of the security according to the ‘Margin of Safety’ approach). Graham did not state a specific formula for how to succeed; rather he laid down a framework to which each individual define the specific rules. He divided investors into two groups: Defensive Investors (investors with little resources and lack of expertise) and enterprise (full-‐time investors). The abstract rules of Graham was re-‐examined in each updated edition of his books, and Table 2.1 summarises Graham`s stock-‐picking advice for the defensive investor as described in each edition of the Intelligent Investor. Oppenheimer and Schlarbaum (1981) find evidence of positive abnormal returns for investors using the stock selection strategy for the defensive investor developed by Ben Graham in the period of study, 1956-‐1975. They interpret their findings as evidence against the semi-‐strong form of market efficiency. P a g e 5 | 52 Table 2.1 – Criteria for selection (and retention) of common stocks by the defensive investor in each of the copyright years of the intelligent investor Criteria Some Dividend Paid Since Size of Firm Capitalisation Price-‐Earnings Ratio 1949 1936 1954 1940 Copyright year 1959 1940 $50 million in $50 million in $50 million in assets or annual assets or annual assets or annual sales, and be in sales and be in sales and be in upper 1/4 or upper 1/4 or upper 1/4 or 1/3 of its 1/3 of its 1/3 of its industry in size industry in size industry in size Book value of Book value of Book value of equity at least equity at least equity at least 50% of total 50% of total 50% of total capitalisation capitalisation capitalisation for industrial for industrial for industrial companies; at companies; at companies; at least 30% of least 30% of least 30% of total total total capitalisation capitalisation capitalisation for utilities for utilities for utilities Price not to Price not to Price not to exceed 20 times exceed 20 times exceed 25 times past five years average average average earnings of past earnings of past earnings (or six years five years until five post World War II years have occurred, 25 times average earnings of 1936-‐1940) 1965 1940 1973 1950 $50 million in assets or annual sales and be in upper 1/4 or 1/3 of its industry in size Book value of equity at least 50% of total capitalisation for industrial companies; at least 30% of total capitalisation for utilities Price not to exceed 25 times average earnings of past seven years and not to exceed 20 times earnings of latest twelve-‐ month period. $50 million in assets or annual sales and be in upper 1/4 or 1/3 of its industry in size Book value of equity at least 50% of total capitalisation for industrial companies; at least 30% of total capitalisation for utilities Price not to exceed 25 times average earnings of past seven years and not to exceed 20 times earnings of latest twelve-‐ month period. Source: Oppenheimer, R.; Schlarbaum, G., Volume XVI, No. 3, September 1981, “Investing With Ben Graham and Ex Ante Test of the Efficient Markets Hypothesis”, Journal of Financial Quantitative Analysis, pp. 341-‐360 P a g e 6 | 52 Before Graham passed away he also defined a more comprehensive mechanical approach to investing, whom he`d been using at his own investment firm, which is summarised in Table 2.2. Graham argued that the first five of these criteria characterised a reward component and the last five a risk component. According to Graham, for a security to be eligible for a portfolio, the stock must at least fulfil one criteria of each component. Oppenheimer (1984) tested the strategy after the publication date of the article ‘Ben Graham`s Last Will and Testament’ (P.Blustein, 1977) in Forbes which first published the framework and concluded that the framework produced significant excess returns even after the framework became openly available information to the public. This exact framework has been used at Rea-‐Graham fund managed by James Rea and failed substantially (most likely as Rea changed his strategy in an attempt to predict the future), while a more recent version was Euclidean Technologies that used Graham-‐like algorithms and was a great success. The success is concluded by Mark Hulbert, which found that the performance of investment newsletters that follows the Graham philosophy outperforms other investment newsletter strategies (Damodaran, 2003). Table 2.2 – Benjamin Graham’s Stock Selection Criteria 1. An earnings-‐to-‐price yield at least twice the AAA-‐rated bond yield 2. A price-‐to-‐earnings ratio less than 40% of the highest price-‐to-‐earnings ratio the stock has had over the past five years 3. A dividend yield of at least two-‐thirds the AAA-‐rated bond yield 4. Stock price below two-‐thirds of tangible book value per share. 5. Stock price below two-‐thirds of the net current asset value. 6. Total debt less than book value. 7. Current ratio greater than two. 8. Total debt less than twice the net current asset value. 9. Earnings growth of prior 10 years at least at a 7% annual compound rate. 10. Stability of earnings growth in that no more than two declines of 5% or more in year-‐end earnings in the prior 10 years are permissible. Source: Oppenheimer, H., Sept-‐Oct 1984, “A Test of Ben Graham’s Stock Selection Criteria”, Financial Analyst Journal, pp. 69. / Blustein. P, August 1, 1977, “Ben Graham’s Last Will and Testament”, Forbes, pp. 43-‐45. But despite the success of several of the investment practitioners of the philosophy of Value Investing, academics in favour of the Efficient Market Hypothesis have argued that the outstanding performance such as of Warren Buffett (Berkshire Hathaway: 19.7% per annum since 1964), Tom Knapp (Tweedy, Browne Company: 10.35% per annum since 1993), Mario Gabelli (GAMCO: 11.19% per annum since 1989) is simply due to luck. Charlie Munger summarised the debate between investors who do not believe in the EMH and academics that do in a speech at Harvard Law School in 1995: P a g e 7 | 52 “Now let's talk about efficient market theory, a wonderful economic doctrine that had a long vogue in spite of the experience of Berkshire Hathaway. In fact o-‐ne of the economists who won -‐-‐ he shared a Nobel Prize -‐-‐ and as he looked at Berkshire Hathaway year after year, which people would throw in his face as saying maybe the market isn't quite as efficient as you think, he said, "Well, it's a two-‐ sigma event." And then he said we were a three-‐sigma event. And then he said we were a four-‐sigma event. And he finally got up to six sigmas -‐-‐ better to add a sigma than change a theory, just because the evidence comes in differently. And, of course, when this share of a Nobel Prize went into money management himself, he sank like a stone.” – Charlie Munger, Harvard University (1995) William Sharpe whom Munger are referring to was together with a whole bunch of other well-‐ known academicians the people who invented the idea that the only way to achieve higher return is to take higher risk, and argues that most mutual fund managers are not able to beat the market index, not even before trading costs is deducted from the performance. Michael Jensen stated in a speech at Columbia University on the 50th anniversary of ‘Security Analysis’ in 1984 that the extraordinary performance of value investors simply was a result of a large coin-‐tossing contest, while Buffett on the other hand argued that the concentration of such investment performance back to the philosophy of Ben Graham and David Dodd couldn`t be explained by chance and rather was a result of the intellectual village of Graham-‐and-‐Doddsville. In collaboration with many well-‐known academicians, John Andrew McQuown (former head of Wells Fargo`s Management Sciences Division) established a portfolio of securities that mimicked an index under the theory that performance of mutual fund managers was seldom superior to the S&P 500 index and that the results lacked consistency and most likely was due to random chance, which later have been known as the first index fund – the Samsonite Luggage Fund – in 1971. This creation was what inspired John Bogle to establish the first index mutual fund – Vanguard S&P 500 index fund – in 1976. Bogle`s main goal was to offer a long-‐term and well-‐diversified fund with minimal costs. This invention together with an increasing focus on portfolio optimisation in the investment world have pushed professionals towards larger portfolios to give as broad diversification as possible to maximise the return and minimise the volatility. According to Buffett the definition of risk proposed by academics is a flawed and misleading picture of the risk term. He has consistently stated that diversification only is necessary when people don`t understand what they are doing and that an investor decreases risk by concentrating on a few companies he understand. Buffett simply cannot understand why a stock which goes from 100$ to 40$ is riskier than a stock which goes from 100$ to 80$, and states the opposite of the EMH proponents simply that the 40$ stock presents a much better investment opportunity. P a g e 8 | 52 “… Once you say investments are all priced efficiently, you presumably have to go on and say businesses are priced efficiently, and you`re just throwing darts all the time. If this group were a bunch of chess players, or a bunch of bridge players, and they were all convinced that it did not pay to think about what to do, you’d have an enormous advantage.” – Warren Buffett From the time of the creation of the first index fund the establishment of index-‐type investing have spread fast across the world, and today it is possible to invest in index funds with basis in a wide variety of origins around the world. Index funds have also diversified into investing based on size, industries and other styles. Table 2.3 – Graham`s maxims on investing Graham`s maxims on investing 1. Be and investor, not a speculator. 2. Know the asking price. 3. Rake the market for bargains. 4. Stay disciplined and buy the formula: E (2g + 8.5) T.Bond rate/Y where E = Earnings per share, g = Expected growth rate in earnings, Y is the yield on AAA rated corporate bonds and 8.5 is the appropriate multiple for a firm with no growth. 5. Regard corporate figures with suspicion. 6. Diversify. 7. When in doubt, stick to quality. 8. Defend your shareholder`s rights. 9. Be patient. Source: Damodaran, A., 2003, “Investment Philosophies: Successful Investment Philosophies and the Greatest Investors Who Made Them Work”, Wiley Finance, Chapter 8 P a g e 9 | 52 3. Research Question The recent innovation of value and growth style indexes provides us with an opportunity to investigate a well-‐established question in academia of whether value stocks outperform growth stocks. I will use the style indexes as constructed and defined by MSCI to investigate this relationship and if it is the case, investigate further to see if it can be explained by increased risk as explained by the proponents of the EMH. By use of style-‐indexes across different regions I will also be able to investigate whether the evidence is consistent across the world and give explanations based on the recent market developments in different regions as for eventually inconsistent results. In addition to divide the style indexes in regions I will also divide the indexes in each region based on size to get a comprehensive examination of the performance of value and growth indexes in each region. To complement the research I will also investigate different types of ratios of each index to see whether the value indexes can be said to indirectly meet the mechanical screening approach of Benjamin Graham. I will also look at the value and growth indexes around the world to examine whether investing in these value-‐indexes can be seen as a replication of the investment approach of Warren Buffett according to the findings of Frazzini, Kabiller and Pedersen (2013). P a g e 10 | 52 4. Dissertation Structure The research aims to investigate whether investing into so-‐called value-‐indexes provides better returns than investing into growth-‐indexes. The background provides an introduction to the theory which lays at the core of the question and which has been a contradiction to the efficient market hypothesis long before the theory of EMH was born. The Superinvestors of Graham and Doddsville produces decade after decade abnormal return compared to their benchmark index at the same time as these investors’ bear lower risk than the index. The literature review summarises much of the past research on the subject. To get a deep understanding of the subject I present you with both evidence that supports and oppose the theory. Much of the general supportive evidence on value versus growth stocks finds an abnormal return and a lower risk when investing in value stocks. Supporters of the EMH on the other hand presents evidence that higher return on a security always have to be as a result of higher risk. I also present performance evidence of different definitions of value stocks as a value stock can be constructed in a lot of different ways depending on the mind of the researcher. This evidence will be supplemented with research evidence on the philosophy of Ben Graham and his most well-‐known disciple Warren Buffett. In the data and methodology sections I present the data that has been used in the analysis and the methods of analysis. The methods of analysis used in the empirical investigation are primarily related to return and risk measures. I provide a wide variety of measures to get as complete an understanding as possible of the results. I will also use an extension to the renowned Fama-‐French-‐ Carhart Model to investigate if the index results can be seen as a low cost Buffett replicating portfolio for the defensive investor. The results section presents the results of the empirical investigation and is divided into six major parts. The section first presents the performance and underlying characteristics of the main indexes in the different regions. The following four parts investigates each region both on an abstract basis and further examines different types of size-‐indexes. I also examine the indexes in the short-‐run and in the long-‐run to see whether the results differ with changes in the time period of the analysis. To get an understanding of whether the indexes share the characteristics aligned by the traditional theory of Graham, I also present different financial ratio-‐measures to analyse the relationships that are not captured by the other tools used. The section is closed with an analysis of whether the value-‐ indexes show signs of being a replication of the strategy of Buffett. In the end I summarise my results in the section conclusion. P a g e 11 | 52 5. Literature Review The theory of Value Investing origins from Benjamin Graham and David Dodd`s traditional book ‘Security Analysis’ (1934). This was later accompanied by another book ‘The Intelligent Investor’ (1949) which presented the framework of the philosophy in a less technical and more understandable way for non-‐finance readers. Both of these two books have been updated several times after their initial publishing, with each updated version containing new thoughts by Graham due to changing market environments. In addition Graham was one of the most influential writers of the time and found evidence of market participants implying a highly overoptimistic growth component into market prices (1957), presented the fine lines of the philosophy of value investing (1952) and was the man behind the origin of an own designation for security analysts (1945) – today known as Chartered Financial Analyst. Graham’s research together with his investment record in Graham-‐Newman Corporation is of strong support in favour of the Value Investing Strategy. One of his investment strategies was called ‘net-‐nets’ which was defined as buying a stock which was priced at 66% or less than the firms current assets net of all liabilities. According to Graham a diversified portfolio of this type of stocks earned an average return of 20% per annum over a 30-‐year period. His suggested mechanical portfolio construction approach has been tested on the US stock market by Oppenheimer (1984) and on the South African stock market by Klerck and Maritz (1997) where both found evidence that supports Graham`s brilliance. Oppenheimer and Schlarbaum (1981) has also tested the strategy presented for the defensive investor and concludes that the evidence is against the efficient market hypothesis. The opponents of a philosophy like Value Investing have argued intensely against it. The early studies came from Treynor and Mazuy (1966) which found no evidence of market timing abilities in mutual funds, Sharpe (1967) which found evidence of underperformance (measured in terms of risk adjusted performance) in mutual funds compared to the market index, and Jensen (1967) which based on the market equation found a negative alpha for most mutual funds in his study. These findings have been used to support the EMH and noting that expenses in mutual funds cannot be fairly justified. The EMH that is known today of weak, semi-‐strong and strong form of market efficiency was first introduced by Fama (1970), which argues that market prices always fully reflect all the available information and therefore that there is no possibility to earn abnormal return as long as you don`t take on higher risk. Later research by Grossman and Stiglitz (1980) have suggested that information is costly and that the gross return for investors gathering information is higher than investors who don`t, while the net return is the same and according to the EMH. Ippolito (1993) re-‐ calculated some of the early studies in favour of EMH and found according to his calculations that the results in reality was against the EMH, in addition to noting that most of the studies from 1970-‐ P a g e 12 | 52 1990 on the topic have showed that mutual funds expenses and fees was justified by performance. Jack Treynor (1962), William Sharpe (1964), John Lintner (1965) and Jan Mossin (1966) developed the CAPM that later was rejected by Fama and French (1992, 1993) which developed the Fama and French model as a good representation to explain most of the variability in stock returns. One of the factors presented in the three factor model is known as the value-‐factor and is measured by the book to market ratio. Traditional higher returns on stocks with a high B/M is according to Fama and French explained by higher risk in these securities. ‘Value’ as a term has been defined in many different ways throughout the years and accordingly examined. Two of the most comprehensive summarisations of all the evidence in favour of an outperformance by securities with value characteristics was presented by the Heilbrunn Center for Graham and Dodd Investing (2006) and the investment advisory firm Tweedy, Browne Company LLC (1992, 2009). Tweedy, Browne mentions the characteristics listed in Table 5.1 as key to their own investing. Basu (1977) examined the US market and Chan, Hamao and Lakonishok (1991) the Japanese market and found evidence of outperformance by securities with a low P/E ratio compared to securities with a high P/E ratio, while the value securities did not seem to contain more risk than the growth securities. Lakonishok, Vishny and Shleifer (1994) studied all stocks on NYSE-‐AMEX from 1968 to 1990 in terms of P/B, P/E and P/CF and found value stocks to outperform growth stocks on a risk-‐adjusted basis. Fama and French (1998) did a comprehensive investigation across different countries and definitions of value (B/M, E/P, CF/P and D/P) and found that value portfolios generated higher returns than the growth portfolios without containing higher risk in terms of standard deviation. The outperformance was largest in the small-‐cap portfolio, but was still significant after accounting for the size effect. A similar international study based on the B/M ratio was performed by Capaul, Rowley and Sharpe (1993), which on average found abnormal risk-‐adjusted returns for value stocks. Studies of value have also been examined in other areas of the research spectrum with Piotroski (2000) using data from financial statements to identify value stocks, Daniel and Titman (1999) studied the relationship between price momentum and the value term, and Chan, Lakonishok and Sougiannis (2001) studied the effect of incorporating intangible assets into book value of equity. The results concluded that combining the value approach with other approaches might provide higher returns than the value approach alone. P a g e 13 | 52 Table 5.1 – Investment Characteristics Tweedy, Browne Investment Characteristics: • Low Price in Relation to Asset Value Reasoning: Stocks priced at less than book value are purchased on the assumption that, in time, their market price will reflect at least their stated book value. Stocks bought at low price / earnings ratios • Low Price in Relation to Earnings afford higher earning yields than stocks bought at higher ratios of price-‐to-‐earnings. • A Significant Pattern of Purchases by One or Officers, directors and large shareholders often buy their own company’s stock when it is More Insiders depressed in relation to the current value. Reversion to the mean is almost a law of nature • A Significant Decline in a Stock’s Price with respect to company performance. These companies are often associated with • Small Market Capitalisation higher rates of growth and may, due to their size, be more easily acquired by other companies. Source: Tweedy, Browne Company LLC., 1992, 2009, “What Has Worked In Investing”, pp. 3-‐4. Due to the well-‐documented evidence of an outperformance by value stock portfolios relative to growth stock portfolios, a lot of research on the underlying reasons for this outperformance have also been done. La Porta, Lakonishok, Shleifer and Vishney (1997) studied earnings announcements for value and growth stock portfolios and argued that some of the abnormal return historically found in value portfolios comes from investors expecting lower earnings for value stocks than realised and opposite for growth stocks. This indicates that past performance is used as a predictor of future performance. Another psychological explanation is that growth stocks usually are in new industries that are seen as popular with a lot of media attention and analyst coverage, and it therefore makes it easier to follow the herd. According to Fama and French (1996) a high B/M ratio is a sign of financial distress and therefore argues that value stocks are subject to higher risk than the growth stocks. Lakonishok, Shleifer and Vishney (1994) studied the return of value and growth portfolios in market downturns and found that the value portfolios on average outperformed the growth portfolios, therefore they rejected the risk argument of value stocks by Fama and French. The tech-‐boom caused the former value-‐growth stock relationship somewhat to reverse and according to Chan, Karceski and Lakonishok (2000) the high pricing of growth stocks was not due to changes in its fundamentals but rather as a result of over-‐optimism about the future prospects of the stocks. In recent years the idea of studying investors that are practising their own definitions of value investing has also emerged. In a presentation at Columbia Business School the prominent value investor Christopher Browne (2000) presented his and his partners view of academic studies: P a g e 14 | 52 “A whole body of academic studies work formed the foundation upon which generations of students at the country`s major business schools were taught about Moderns Portfolio Theory, Efficient Market Theory and Beta. In our humble opinion this was a classic example of garbage in/garbage out” – Christopher Browne, Columbia Business School This view is re-‐confirmed by Warren Buffett (1984, 2005) and other value investors as well. The view of these investors is as different from the EMH view as the differences between men and women, and Cunningham (1996), Estrada (2012), Statman and Scheid (2001), Gray and Kern (2008) provides interesting analysis of the investor’s behaviour. A fundamental finding that is shared across all studies is a fundamental different view of value investing than the view in academia. Damodaran (2003) divides a value investor into three types; 1. Passive Screener: Buy companies that are supported by your screening criteria, 2. Contrarian Investor: Buy undervalued companies that other investors don`t want, 3. Activist Investor: Buy poorly managed companies and uses your power to realise the full-‐value of the business. Despite the fact that most of these studies are focused on Buffett, it is not difficult to see from the behaviour of other value investors that also they share the bottom-‐up philosophy of investing in businesses. Elena Chirkova (2012) define Buffett as a positive black swan and attributes his success mostly to being at the right place to the right time, but does not take into account the speech by Buffett (1984) that Columbia University seems to be the right place and under Graham the right time. According to Lowenstein (2008) the performance of Buffett might be explained by his investment principles as summarised in Table 5.2. Frazzini and Pedersen (2013) and Asness, Frazzini and Pedersen (2013) study the ability to add additional factors to the Fama-‐French-‐Carhart model to explain more of the variability of stock returns. Frazzini and Pedersen finds evidence of abnormal return of a Betting Against Beta factor that is long low-‐beta assets and short high-‐beta assets, and therefore finds a negative relationship between alpha and beta. Asness, Frazzini and Pedersen finds evidence of abnormal return of a Quality Minus Junk factor which is long high quality assets and short low quality assets, where quality in many ways is defined like Graham described. Frazzini, Kabiller and Pedersen (2013) used an extended Fama-‐French-‐Carhart model which also included the BAB factor and the QMJ factor to analyse the historical performance of Buffett. In their study they find that his abnormal returns are due to a focus on cheap and safe quality stocks and the use of leverage. They also investigate whether the return comes from stock selection abilities or from his influence on managers, and conclude that most of the abnormal return is a result of stock selection abilities. With use of the six factor model they are able to explain most of the variation in his return and the alpha becomes insignificant. P a g e 15 | 52 As a result much of the past research on the subject indicates an outperformance of value stock portfolios relative to growth stock portfolios. The majority of past studies find an outperformance in the long-‐run while the results on a short-‐run basis are mixed and inconsistent. As an example the growth stocks outperformed value stocks in the heights of the tech-‐boom (1998-‐1999), while value stocks have outperformed growth stocks on a short-‐run basis both before and after. My research will therefore add to the past research with new data from recent market environments and specifically look into the innovation of style indexes that are claimed to perform as value and growth stocks. Table 5.2 – Buffett`s tenets Buffet`s Tenets Business Tenets: • The business the company is in should be simple and understandable. • The firm should have a consistent operating history, manifested in operating earnings that are stable and predictable. • The firm should be in a business with favourable long-‐term prospects Management Tenets: • The managers of the company should be candid. • The managers of the company should be leaders and not followers. Financial Tenets: • The company should have a high return on equity (earnings based on owner earnings) Owner Earnings = Net Income + Depreciation & Amortisation – Capital Expenditures • The company should have high and stable profit margins and a history of creating value for its stockholders. Markets Tenets: • In determining value, much has been made of Buffett`s use of a riskfree rate to discount cash flows. Since he is known to use conservative estimates of earnings and since the firms he invests in tend to be stable firms, it looks to us like he makes his risk adjustment in the cashflows rather than the discount rate. • In keeping with Buffett`s views of Mr. Market as capricious and moody, even valuable companies can be bought at attractive prices when investors turn away from them. Source: Damodaran, A., 2003, “Investment Philosophies: Successful Investment Philosophies and the Greatest Investors Who Made Them Work”, Wiley Finance, Chapter 8 P a g e 16 | 52 6. Data The data used in the empirical investigation consists of MSCI-‐indexes and is gathered from Bloomberg terminal. Data on the Fama-‐French-‐Carhart factor returns have been collected from Ken French`s website, and the Betting Against Beta factor return and Quality Minus Junk factor return from Lasse Pedersen´s website. I have decided to use data from 2000 to 2013 if applicable, to measure the effect of the long-‐run performance of the indexes. All of the regional indexes have data for the whole period, while the sub-‐indexes in terms of value-‐ and growth size indexes only first became available in 2008 and 2009. I have therefore used the different starting points of these sub-‐ indexes as a proxy for the short-‐run performance. To be able to compare the indexes with different starting dates, I have also divided the data into different market environment periods. Table 6.1 describes the different indexes and the data sample periods that are used in the analysis. Table 6.1 – Index Data Index Name Date Sample (Month/Year) MSCI World Index • • • • • • • • • Explanation Standard Standard Growth Standard Value Small-‐Cap Growth Mid-‐Cap Growth Large-‐Cap Growth Small-‐Cap Value Mid-‐Cap Value Large-‐Cap Value 12/99-‐12/13 12/99-‐12/13 12/99-‐12/13 01/09-‐12/13 01/09-‐12/13 01/09-‐12/13 01/09-‐12/13 01/09-‐12/13 01/09-‐12/13 The MSCI World Index is a free float-‐adjusted market capitalization weighted index that is designed to measure the equity market performance of developed markets. The MSCI World Index consists of the following 23 developed market country indexes: Australia, Austria, Belgium, Canada, Denmark, Finland, France, Germany, Hong Kong, Ireland, Israel, Italy, Japan, Netherlands, New Zealand, Norway, Portugal, Singapore, Spain, Sweden, Switzerland, the United Kingdom, and the United States. MSCI United States Index • • • • • • • • • Standard Standard Growth Standard Value Small-‐Cap Growth Mid-‐Cap Growth Large-‐Cap Growth Small-‐Cap Value Mid-‐Cap Value Large-‐Cap Value 12/99-‐12/13 12/99-‐12/13 12/99-‐12/13 12/99-‐12/13 12/99-‐12/13 12/99-‐12/13 12/99-‐12/13 12/99-‐12/13 12/99-‐12/13 The MSCI USA Index is a free float adjusted market capitalization index that is designed to measure large and mid-‐cap US equity market performance. The MSCI USA Index is member of the MSCI Global Equity Indices and represents the US equity portion of the global benchmark MSCI ACWI Index. P a g e 17 | 52 MSCI Europe Index MSCI Emerging Markets Index • • • • • • • • • • • • • • • • • • Standard Standard Growth Standard Value Small-‐Cap Growth Mid-‐Cap Growth Large-‐Cap Growth Small-‐Cap Value Mid-‐Cap Value Large-‐Cap Value 12/99-‐12/13 12/99-‐12/13 12/99-‐12/13 12/07-‐12/13 12/07-‐12/13 12/07-‐12/13 12/07-‐12/13 12/07-‐12/13 12/07-‐12/13 Standard Standard Growth Standard Value Small-‐Cap Growth Mid-‐Cap Growth Large-‐Cap Growth Small-‐Cap Value Mid-‐Cap Value Large-‐Cap Value 12/99-‐12/13 12/99-‐12/13 12/99-‐12/13 01/08-‐12/13 01/08-‐12/13 01/08-‐12/13 01/08-‐12/13 01/08-‐12/13 01/08-‐12/13 The MSCI Europe Index is a free float-‐adjusted market capitalization weighted index that is designed to measure the equity market performance of the developed markets in Europe. The MSCI Europe Index consists of the following 15 developed market country indexes: Austria, Belgium, Denmark, Finland, France, Germany, Ireland, Italy, the Netherlands, Norway, Portugal, Spain, Sweden, Switzerland, and the United Kingdom. The MSCI Emerging Markets Index is a free float-‐adjusted market capitalization index that is designed to measure equity market performance of emerging markets. The MSCI Emerging Markets Index consists of the following 23 emerging market country indexes: Brazil, Chile, China, Colombia, Czech Republic, Egypt, Greece, Hungary, India, Indonesia, Korea, Malaysia, Mexico, Peru, Philippines, Poland, Qatar, Russia, South Africa, Taiwan, Thailand, Turkey and United Arab Emirates. Source: Bloomberg P a g e 18 | 52 7. Methodology I have used a wide variety of performance and risk measures to get a picture as complete as possible and in this section I present the methods used to analyse the data collected. Before I look into the tools of analysis I find it crucial to discuss the underlying methodology that MSCI uses to create value and growth indexes. The starting point for MSCI is a traditional MSCI index (ex. MSCI World) which already is created based on its own requirements. Thereafter MSCI uses a two dimensional framework for style segmentation to create a value and a growth index. The two style indexes is created in a way which secures that the market capitalization of the index it is based upon is divided as equally as possible between the value and the growth index. The characteristics that MSCI uses to assign a value and a growth characteristic to each security is summarised in Table 7.1. Table 7.1 – MSCI Style Methodology Characteristics Value Investment Style Characteristics: Growth Investment Style Characteristics: • Book value to price ratio (B/P) • Long-‐term forward earnings per share growth rate (LT fwd EPS G) • 12-‐month forward earnings to price ratio (E • Short-‐term forward EPS growth rate (ST fwd fwd / P) EPS G) • Dividend yield (D/P) • Current internal growth rate (g) • Long-‐term historical EPS growth trend (LT his EPS G) • Long-‐term historical sales per share growth trend (LT his SPS G) Source: MSCI, 2007, “Global Investable Markets Value and Growth Index Methodology”, pp. 5. The following two equations show how the Value Z-‐Score and Growth Z-‐Score is calculated, while Figure 7.1 and Table 7.2 show the score space. 1 𝑉𝑎𝑙𝑢𝑒 𝑍 − 𝑆𝑐𝑜𝑟𝑒 = (𝑍!" + 𝑍 !"# + 𝑍! ) ! 3 ! ! ! 1 𝐺𝑟𝑜𝑤𝑡ℎ 𝑍 − 𝑆𝑐𝑜𝑟𝑒 = (2 ∗ 𝑍!" !"# !"# ! + 𝑍!" !"# !"# ! + 𝑍! + 𝑍!" !!" !"# ! + 𝑍!" !!" !"! ! ) 6 P a g e 19 | 52 Figure 7.1 – Value-‐Growth Space Table 7.2 – Value-‐Growth Space Value Z-‐ Growth Z-‐ Style Score Score Characteristics Positive Negative or Value Zero Negative or Positive Growth Zero Positive Positive Both Value and Growth Negative or Negative or Neither Value nor Zero Zero Growth Source: MSCI. “Global Investable Markets Value and Growth Index Methodology” (2007), pp. 6-‐13. To examine the performance of the different indexes under investigation I have calculated the average monthly return and the cumulative return over the period for which data is collected for each index. 𝑟!,! = 𝑟= !!,! !!!!!,! !!!!,! ! !!! 𝑟!,! Where It,I is the level of index i at the end of month t, and rt,I is the return in month t. The cumulative return is simply the sum of all the monthly returns and the average monthly return is the total cumulative return divided on number of monthly returns. The standard deviation has been calculated as a measure of risk for the indexes. ! !!!(𝑟!,! 𝑆𝑇𝐷𝐸𝑉 𝑅 = − 𝑟!"# )² By use of the return and risk measure I have also calculated various risk-‐adjusted return measures to see whether increased risk is a possible explanation for abnormal return. The Sharpe ratio developed by William Sharpe in 1966 is by far the most known reward to volatility ratio used in the analysis. 𝑆= ![!!,! !!! ] !"#[!!!! ] Which is given by the return on an index in month t minus the return of a risk-‐free asset in month t, divided by the standard deviation between the two assets. To exclusively focus on the downside the Sortino ratio by Brian M. Rom (1983) is calculated. 𝑆= ![!!,! !!! ] !!"#$%&[!!,! !!! ] This ratio differs from the Sharpe-‐ratio by only taking into account the deviations below the mean in the denominator and therefore reflects the probability of downside losses. I calculate the P a g e 20 | 52 Information Ratio to find out whether each specific index has outperformed the benchmark consistently over time and Tracking Error to see by how much each style index deviates from the benchmark index. By calculating Value-‐at-‐Risk 95%/99% I am able to analyse how much an investor investing in each index risk to loose on a monthly and annual basis with 95% and 99% confidence, in addition to measuring the Maximum Drawdown on a 1-‐month and 3-‐month basis to analyse the maximal historical losses. In my aim to explain the differences in returns of the various indexes I calculate two traditional measures in addition to an extension exclusively meant to investigate the relationship of the return generated from value indexes and return generated by Buffett himself. The simplest of these measures is the Capital Asset Pricing Model developed by Jack Treynor (1962), William Sharpe (1964), John Lintner (1965) and Jan Mossin (1966): 𝑅!,! − 𝑅!,! = 𝑎! + 𝑏!,! 𝑅!,! − 𝑅!,! + 𝑒!,! Where Rt,M and Rt,f is the return on the market index and the risk-‐free asset in month t. The model assumes that investors are rational and risk-‐averse and therefore that the only factor explaining the return of a security is its variation relative to the market index. Despite its simplicity comes the fact that the assumptions behind it are not entirely true in the real world of investing. Further research have created the Fama-‐French-‐Carhart model first developed by Fama and French (1993) as a three-‐ factor model, and later updated by Carhart (1997) to a four-‐factor model. 𝑅!,! − 𝑅! = 𝑎! + 𝑏! 𝑅!,! − 𝑅!,! + 𝑏! 𝑆𝑀𝐵 + 𝑏! 𝐻𝑀𝐿 + 𝑏! 𝑀𝑂𝑀 + 𝑒!,! Where including only ai and b1 is identical to the CAPM, and the additional variables is Small Minus Big, High Minus Low and Momentum. The SMB, popularly called size, factor is derived by subtracting the return on a portfolio of firms with high market capitalisation from the return of a portfolio of firms with low market capitalisation. The HML, popularly called value, factor is derived by subtracting the return from a portfolio of firms with low Book-‐to-‐Market ratio from the return of a portfolio of firms with high Book-‐to-‐Market ratio. The Momentum factor is the difference between the return of a portfolio of the highest performing stocks minus the return of a portfolio of the worst performing stocks. This model is according to the creators explaining most of the variability in the return of securities. The last regression introduced was developed by Frazzini, Kabiller and Pedersen (2013) and is an extension of the Fama-‐French-‐Carhart four-‐factor model, from four to six factors, which is proclaimed to partly explain the long-‐standing outperformance of the benchmark by Warren Buffett. 𝑅!,! − 𝑅! = 𝑎! + 𝑏! 𝑅!,! − 𝑅!,! + 𝑏! 𝑆𝑀𝐵 + 𝑏! 𝐻𝑀𝐿 + 𝑏! 𝑀𝑂𝑀 + 𝑏! 𝐵𝐴𝐵 + 𝑏! 𝑄𝑀𝐽 + 𝑒!,! P a g e 21 | 52 The extension components consist of the Betting-‐Against-‐Beta and the Quality-‐Minus-‐Junk factor. The BAB factor is constructed by subtracting the returns from a portfolio with high beta securities from a portfolio of low beta securities, while the QMJ factor can be explained as going long high-‐ quality stocks while going short low-‐quality stocks, where quality stocks is defined as a stock with a high and growing profitability, low required rate of return and substantial dividend pay-‐out. I also gather various data for a ratio-‐analysis to see whether the indexes share other underlying characteristics that was favoured by Graham. The majority of these ratios are somehow seen as a measure, by academics or practitioners, to which degree a security are characterised as a value or a growth asset. A list of the ratios and a short explanation can be found in Table 7.3. Table 7.3 – Financial Ratios Ratio Name EV/Sales EV/EBITDA EV/EBIT P/CF P/E P/B Dividend yield Current ratio Market capitalisation Capital expenditures Debt/Asset Explanation 𝐸𝑉 𝑀𝑎𝑟𝑘𝑒𝑡 𝐶𝑎𝑝𝑖𝑡𝑎𝑙𝑖𝑠𝑎𝑡𝑖𝑜𝑛 + 𝐷𝑒𝑏𝑡 + 𝑃𝑟𝑒𝑓𝑒𝑟𝑟𝑒𝑑 𝑆ℎ𝑎𝑟𝑒𝑠 − 𝐶𝑎𝑠ℎ 𝑎𝑛𝑑 𝐸𝑞𝑢𝑖𝑣𝑎𝑙𝑒𝑛𝑡𝑠 = 𝑆𝑎𝑙𝑒𝑠 𝐴𝑛𝑛𝑢𝑎𝑙 𝑆𝑎𝑙𝑒𝑠 𝐸𝑛𝑡𝑒𝑟𝑝𝑟𝑖𝑠𝑒 𝑉𝑎𝑙𝑢𝑒 𝐸𝑛𝑡𝑒𝑟𝑝𝑟𝑖𝑠𝑒 𝑀𝑢𝑙𝑡𝑖𝑝𝑙𝑒 = 𝐸𝐵𝐼𝑇𝐷𝐴 𝐸𝑛𝑡𝑒𝑟𝑝𝑟𝑖𝑠𝑒 𝑉𝑎𝑙𝑢𝑒 𝐸𝑛𝑡𝑒𝑟𝑝𝑟𝑖𝑠𝑒 𝑀𝑢𝑙𝑡𝑖𝑝𝑙𝑒 = 𝐸𝐵𝐼𝑇 𝑆ℎ𝑎𝑟𝑒 𝑃𝑟𝑖𝑐𝑒 𝑃𝑟𝑖𝑐𝑒 𝑡𝑜 𝐶𝑎𝑠ℎ 𝐹𝑙𝑜𝑤 = 𝐶𝑎𝑠ℎ 𝐹𝑙𝑜𝑤 𝑝𝑒𝑟 𝑆ℎ𝑎𝑟𝑒 𝑆ℎ𝑎𝑟𝑒 𝑃𝑟𝑖𝑐𝑒 𝑃𝑟𝑖𝑐𝑒 𝑡𝑜 𝐸𝑎𝑟𝑛𝑖𝑛𝑔𝑠 = 𝐸𝑎𝑟𝑛𝑖𝑛𝑔𝑠 𝑝𝑒𝑟 𝑆ℎ𝑎𝑟𝑒 𝑆ℎ𝑎𝑟𝑒 𝑃𝑟𝑖𝑐𝑒 𝑃𝑟𝑖𝑐𝑒 𝑡𝑜 𝐵𝑜𝑜𝑘 𝑉𝑎𝑙𝑢𝑒 = 𝐸𝑞𝑢𝑖𝑡𝑦 𝐵𝑜𝑜𝑘 𝑉𝑎𝑙𝑢𝑒 𝑝𝑒𝑟 𝑆ℎ𝑎𝑟𝑒 𝐴𝑛𝑛𝑢𝑎𝑙 𝐷𝑖𝑣𝑖𝑑𝑒𝑛𝑑𝑠 𝑝𝑒𝑟 𝑆ℎ𝑎𝑟𝑒 𝐷𝑖𝑣𝑖𝑑𝑒𝑛𝑑 𝑦𝑖𝑒𝑙𝑑 = 𝑆ℎ𝑎𝑟𝑒 𝑃𝑟𝑖𝑐𝑒 𝐶𝑢𝑟𝑟𝑒𝑛𝑡 𝐴𝑠𝑠𝑒𝑡𝑠 𝐶𝑢𝑟𝑟𝑒𝑛𝑡 𝑅𝑎𝑡𝑖𝑜 = 𝐶𝑢𝑟𝑟𝑒𝑛𝑡 𝐿𝑖𝑎𝑏𝑖𝑙𝑖𝑡𝑖𝑒𝑠 𝑀𝑎𝑟𝑘𝑒𝑡 𝑐𝑎𝑝𝑖𝑡𝑎𝑙𝑖𝑠𝑎𝑡𝑖𝑜𝑛 = 𝑆ℎ𝑎𝑟𝑒 𝑃𝑟𝑖𝑐𝑒 ∗ 𝑁𝑢𝑚𝑏𝑒𝑟 𝑜𝑓 𝑆ℎ𝑎𝑟𝑒𝑠 Funds used by a company to acquire or upgrade physical assets such as property, industrial buildings or equipment. 𝑇𝑜𝑡𝑎𝑙 𝐷𝑒𝑏𝑡 𝐷𝑒𝑏𝑡 𝑅𝑎𝑡𝑖𝑜 = 𝑇𝑜𝑡𝑎𝑙 𝐴𝑠𝑠𝑒𝑡𝑠 Source: Investopedia.com At last I have in addition to examining the data as a whole also divided the data into different market environments to see whether the results are consistent over shorter periods. I will however mainly focus on the results over the long-‐run as most prior research have been done over longer-‐periods, and because shorter periods could give results which are temporary due to a specific environment (ex. due to the great recession). I also provide some other risk-‐adjusted return and risk measures to supplement the already mentioned measures, which I believe together provides a complete analysis. P a g e 22 | 52 8. Results In this section I am going to present my own empirical results and will do this by dividing it into sub-‐ sections for each region that have been analysed. In this introductory sub-‐section I present the abstract performance for the standard indexes representing each region. From Graph 8.1 we see that emerging markets have had a substantially higher performance in the period 2000-‐2013 than the US and Europe. Europe present itself as the lowest performer in the recent short-‐run, much, which I think, can be attributed to the debt crisis in Southern-‐Europe. Figure 8.1 – Benchmarks Table 8.1 – Benchmarks Performance Index name MSCI World MSCI US MSCI Europe MSCI Emerging Total Average Standard Sharpe Sortino Excess return return deviation ratio ratio return 50.51% 3.61% 20.04% 0.08 0.10 -‐ 57.14% 3.81% 18.78% 0.09 0.12 -‐ 19.63% 1.40% 20.15% -‐0.03 -‐0.03 -‐ 156.71% 10.45% 33.14% 0.25 0.33 -‐ Tracking error (periodic) -‐ -‐ -‐ -‐ Tracking error (annual) -‐ -‐ -‐ -‐ Information ratio Information (periodic) ratio (annual) -‐ -‐ -‐ -‐ -‐ -‐ -‐ -‐ Despite the higher volatility present in emerging markets it still outperforms other geographical regions on a risk-‐adjusted basis with a Sharpe-‐ and Sortino ratio approximately two times higher than in US and Europe. Not surprisingly the higher volatility of emerging markets also causes the VAR 95%/99% and maximum drawdown on a 1-‐ and 3-‐ month basis to be more severe than the corresponding developed markets. Table 8.2 – Benchmarks Risk Index name MSCI World MSCI US MSCI Europe MSCI Emerging Correlation 1.000 1.000 1.000 1.000 Maximum Maximum Semi-‐ VAR 95% VAR 95% VAR 99% VAR 99% drawdown drawdown deviation (monthly) (annual) (monthly) (annual) (1-‐month) (3-‐month) 15.75% -‐7.74% -‐26.80% -‐10.99% -‐38.06% -‐19.04% -‐22.18% 14.69% -‐7.49% -‐25.93% -‐10.63% -‐36.83% -‐17.25% -‐22.82% 17.47% -‐7.54% -‐26.11% -‐10.70% -‐37.07% -‐13.89% -‐23.27% 25.26% -‐11.17% -‐38.68% -‐15.86% -‐54.93% -‐27.50% -‐27.94% P a g e 23 | 52 Table 8.3 – Benchmarks Financial Ratios Index MSCI World MSCI US MSCI Europe MSCI Emerging EV/Sales EV/EBITDA EV/EBIT P/CF 1.86 10.23 17.09 10.29 2.20 10.69 17.41 11.06 1.65 9.26 15.74 9.18 1.61 7.51 11.92 7.74 P/E 19.68 18.21 22.98 13.18 P/B Div. yield 2.22 2.33 2.71 1.88 1.97 3.16 1.78 2.47 CR MCAP CAPEX 1.20 25065 -‐65.80 1.25 11860 -‐51.63 1.12 6424 -‐6.36 1.28 4513 -‐58.09 D/A 30.13 32.82 30.55 20.49 Table 8.3 shows that emerging markets also seems to be characterised as the most value like market relative to its peers over the period, something that might be due to less established analyst coverage of stocks in these markets, something which is consistent with the reasoning of Jegadeesh, Kim, Krische and Lee (2002). It is however somewhat of a surprise as the emerging markets normally are characterised as the growth engine of the world. Development over shorter periods as shown in Table 8.4 mostly shows the same pattern for all indexes, but a much stronger reaction in emerging markets compared to developed markets. Table 8.4 – Benchmarks Market Environments MSCI World MSCI US MSCI Europe MSCI EM Economic conditions avg. ret. stdev avg. ret. stdev avg. ret. stdev avg. ret. stdev Tech-‐crisis (2000-‐2001) -‐14.40% 0.35% -‐10.71% 2.84% -‐8.77% 5.22% -‐20.96% 10.84% Growth (2002-‐2007) 5.78% 15.70% 5.45% 15.25% 4.77% 17.92% 27.01% 18.05% Great recession (2008) -‐42.08% -‐ -‐38.58% -‐ -‐45.52% -‐ -‐54.48% -‐ Recovery (2009-‐2010) 18.26% 8.71% 18.69% 5.51% 17.60% 9.55% 45.43% 29.07% Uncertainty (2011-‐2013) 9.89% 13.16% 14.42% 12.25% 6.29% 12.24% -‐3.41% 14.56% 8.1 World MSCI World presents us with an overview of all markets around the world as a whole. The World index is used as market index across all markets investigated with the aim to get comparable results. Figure 8.1.1 shows that the value index has outperformed the growth index continuously over the period 2000-‐2013. The results based on a combination of style and size over the short-‐term presented by Figure 8.1.2 finds evidence of growth indexes outperforming value indexes since 2009. These results are consistent with Chan and Lakonishok (2004) and Graham (1940) that found in the short-‐run the market might behave irrational and only in the long run will the market behave rational. Graph 8.1.1 – MSCI World Index Performance Graph 8.1.2 – Style-‐Size Indexes Performance P a g e 24 | 52 The outperformance of the growth index by the value index over the long-‐run (2000-‐2013) cannot be explained by a higher risk as measured by standard deviation, and the risk-‐adjusted performance of the value index are more than twice the performance of the growth index. Further evidence in favour of value is a lower VAR at 95%/99% and lower maximum drawdown over the period. These results are in line with the studies of Chan, Hamao and Lakonishok (1991) on the US stock market and the international evidence of Fama and French (1998). All of this evidence points in direction of risk not to be an explanatory factor of the outperforming value index. Table 8.1.1 – MSCI World Performance Index name MSCI World MSCI World Growth MSCI World Value Total Average Standard Sharpe Sortino Excess return return deviation ratio ratio return 50.51% 3.61% 20.04% 0.08 0.10 -‐ 42.06% 3.00% 21.10% 0.05 0.06 -‐0.60% 58.94% 4.21% 19.92% 0.11 0.14 0.60% Tracking error (periodic) -‐ 1.09% 1.07% Tracking Information error ratio Information (annual) (periodic) ratio (annual) -‐ -‐ -‐ 3.77% -‐0.06 -‐0.14 3.72% 0.06 0.14 Table 8.1.2 – MSCI World Risk Index name MSCI World MSCI World Growth MSCI World Value Maximum Maximum Semi-‐ VAR 95% VAR 95% VAR 99% VAR 99% drawdown drawdown Correlation deviation (monthly) (annual) (monthly) (annual) (1-‐month) (3-‐month) 1.000 15.75% -‐7.74% -‐26.80% -‐10.99% -‐38.06% -‐19.04% -‐22.18% 0.974 4.28% -‐7.98% -‐27.65% -‐11.34% -‐39.27% -‐19.44% -‐23.13% 0.975 15.44% -‐7.93% -‐27.48% -‐11.26% -‐39.02% -‐18.65% -‐21.24% Neither the CAPM nor the Fama-‐French-‐Carhart four factor models finds any significant alphas at a 10% significance level. The results of the regressions shows that the value index variability to the market portfolio is lower than the growth index, and that the value index is comprised of larger than average companies with a high B/M ratio. The findings of the growth index are opposite to the value index. Table 8.1.3 – MSCI World CAPM Index name α (%) β MSCI World 0.000 1.000 *** MSCI World Growth -‐0.071 1.007 *** MSCI World V alue 0.065 0.998 *** *** Significant at 1 % ** Significant at 5% * Significant at 10 % R2 1.000 0.950 0.950 Table 8.1.4 – MSCI World Fama-‐French-‐Carhart Index name α (%) β MSCI World 0.000 1.000 *** MSCI World Growth 0.030 1.022 *** MSCI World Value -‐0.030 0.980 *** *** Significant at 1 % ** Significant at 5% * Significant at 10 % SMB 0.000 *** 0.007 -‐0.012 HML 0.000 -‐0.224 *** 0.217 *** MOM 0.000 *** 0.045 *** -‐0.050 *** R2 1.000 0.979 0.980 In terms of other ratios we find evidence of the value index exhibiting value characteristics compared to the growth index, but not according to the definitions of Graham. The relative P a g e 25 | 52 difference between popular financial ratios in the style indexes can be seen from Table 8.1.3 and Graphs 8.1.3-‐8.1.6. Table 8.1.5 – MSCI World Financial Ratios Index MSCI World MSCI World Growth MSCI World Value EV/Sales EV/EBITDA EV/EBIT P/CF 1.86 10.23 17.09 10.29 1.83 17.50 15.92 12.54 1.74 11.81 17.15 8.96 P/E 19.68 22.22 18.70 P/B Div. yield 2.22 2.33 3.27 1.55 1.70 3.09 CR MCAP CAPEX 1.20 25065 -‐65.80 1.30 13844 -‐51.33 1.22 13571 -‐128.80 D/A 30.13 27.29 29.57 Graph 8.1.3 – MSCI World Ratios Graph 8.1.4 – MSCI World Ratios Graph 8.1.5 – MSCI World Ratios Graph 8.1.6 – MSCI World MCAP From Table 8.1.6 we find evidence of a relative change in the value-‐growth index spread after the financial crisis as the growth index have outperformed the value index in the period 2008-‐2013. Table 8.1.6 – MSCI World Market Environments MSCI World MSCI World Growth MSCI World Value Economic conditions avg. ret. stdev avg. ret. stdev avg. ret. stdev Tech-‐crisis (2000-‐2001) -‐14.40% 0.35% -‐21.11% 5.00% -‐7.66% 6.36% Growth (2002-‐2007) 5.78% 15.70% 8.40% 14.38% 10.01% 17.72% Great recession (2008) -‐42.08% -‐ -‐42.01% -‐ -‐42.26% -‐ Recovery (2009-‐2010) 18.26% 8.71% 21.89% 9.03% 14.65% 8.39% Uncertainty (2011-‐2013) 9.89% 13.16% 10.71% 10.71% 9.05% 13.11% P a g e 26 | 52 This reverse value-‐growth index spread can be seen in Table 8.1.7 and Table 8.1.8 which provides evidence of a change in both the relative return-‐ and risk relationship between the style indexes after the financial crisis. The results are consistent between small-‐cap, mid-‐cap and large-‐cap indexes. Table 8.1.7 – MSCI World Style-‐Size Performance Index name MSCI World MSCI World Growth Small-‐Cap MSCI World Value Small-‐Cap MSCI World Growth Mid-‐Cap MSCI World Value Mid-‐Cap MSCI World Growth Large-‐Cap MSCI World Value Large-‐Cap Total Average Standard Sharpe Sortino Excess return return deviation ratio ratio return 66.19% 13.24% 12.29% 1.07 1.39 -‐ 119.99% 24.00% 20.65% 1.16 1.55 10.76% 106.68% 21.34% 21.11% 1.01 1.42 8.10% 98.73% 19.75% 17.55% 1.12 1.55 6.51% 90.06% 18.01% 18.62% 0.96 1.35 4.77% 81.78% 16.36% 15.01% 1.09 1.53 3.12% 69.37% 13.87% 15.52% 0.89 1.31 0.63% Tracking error (periodic) -‐ 1.57% 1.65% 1.08% 1.13% 0.81% 0.79% Tracking Information error ratio Information (annual) (periodic) ratio (annual) -‐ -‐ -‐ 5.43% 0.37 1.03 5.72% 0.24 0.77 3.72% 0.27 0.86 3.91% 0.15 0.62 2.81% 0.05 0.73 2.74% -‐0.16 0.12 Table 8.1.8 – MSCI World Style-‐Size Risk Index name MSCI World MSCI World Growth Small-‐Cap MSCI World Value Small-‐Cap MSCI World Growth Mid-‐Cap MSCI World Value Mid-‐Cap MSCI World Growth Large-‐Cap MSCI World Value Large-‐Cap Maximum Maximum Semi-‐ VAR 95% VAR 95% VAR 99% VAR 99% drawdown drawdown Correlation deviation (monthly) (annual) (monthly) (annual) (1-‐month) (3-‐month) 1.000 9.47% -‐8.03% -‐27.83% -‐11.50% -‐39.83% -‐10.49% -‐17.06% 0.958 15.43% -‐8.97% -‐31.06% -‐12.83% -‐44.46% -‐11.74% -‐20.79% 0.964 14.97% -‐9.51% -‐32.95% -‐13.62% -‐47.16% -‐12.38% -‐20.82% 0.977 12.73% -‐8.37% -‐29.00% -‐11.98% -‐41.50% -‐11.23% -‐19.42% 0.981 13.30% -‐8.95% -‐31.01% -‐12.81% -‐44.39% -‐12.66% -‐18.25% 0.986 10.61% -‐7.63% -‐26.43% -‐10.92% -‐37.83% -‐9.76% -‐15.72% 0.989 10.56% -‐8.49% -‐29.41% -‐12.15% -‐42.09% -‐12.62% -‐17.52% A somewhat surprising finding in the short-‐run is a reverse relationship also in the variability to the market, which is presented in the beta term of Table 8.1.9 and Table 8.1.10. Another notable finding is a significant positive alpha for both the small-‐cap and mid-‐cap growth index, while a significant negative alpha for the large-‐cap value index. The weightings on the SMB and HML factor are as expected by construction of the indexes, but it should be noted that the MOM factor has a negative weighting for all but the large-‐cap growth index. The CAPM model explains between 92% and 98% of the variability of the returns, while the Fama-‐French-‐Carhart explains between 98% and 99% respectively. Table 8.1.9 – MSCI World Style-‐Size CAPM Index name α (%) β MSCI World 0.000 1.000 *** MSCI World Growth Small-‐Cap 0.486 ** 1.070 *** MSCI World V alue Small-‐Cap 0.216 1.142 *** MSCI World Growth Mid-‐Cap 0.265 * 1.018 *** MSCI World V alue Mid-‐Cap 0.046 1.093 *** MSCI World Growth Large-‐Cap 0.124 0.937 *** MSCI World V alue Large-‐Cap -‐0.181 * 1.045 *** Significant at 1 % ** Significant at 5% * Significant at 10 % R2 1.000 0.919 0.930 0.954 0.963 0.973 0.978 P a g e 27 | 52 Table 8.1.10 – MSCI World Style-‐Size Fama-‐French-‐Carhart Index name α (%) β MSCI World 0.000 1.000 *** MSCI World Growth Small-‐Cap 0.351 *** 0.974 *** MSCI World Value Small-‐Cap 0.164 * 0.947 *** MSCI World Growth Mid-‐Cap 0.177 * 0.978 *** MSCI World Value Mid-‐Cap 0.053 0.974 *** MSCI World Growth Large-‐Cap 0.084 1.007 *** MSCI World Value Large-‐Cap -‐0.125 * 1.002 *** *** Significant at 1 % ** Significant at 5% * Significant at 10 % SMB 0.000 *** 0.646 *** 0.488 *** 0.383 *** 0.134 *** 0.041 -‐0.146 *** HML 0.000 -‐0.120 ** 0.260 *** -‐0.128 *** 0.231 *** -‐0.226 *** 0.206 *** MOM 0.000 *** -‐0.023 -‐0.100 *** -‐0.005 -‐0.085 *** 0.049 *** -‐0.039 *** R2 1.000 0.978 0.987 0.979 0.986 0.990 0.991 The corresponding picture of Table 8.1.6 are also shown in Table 8.1.11 which just confirms our observation of the relative outperformance of growth indexes compared to value indexes in the recent short-‐run. Table 8.1.11 – MSCI World Style-‐Size Market Environments MSCI World Growth MSCI World Growth MSCI World Growth MSCI World Value MSCI World Value MSCI World Value Small-‐Cap Mid-‐Cap Large-‐Cap Small-‐Cap Mid-‐Cap Large-‐Cap Economic conditions avg. ret. stdev avg. ret. stdev avg. ret. stdev avg. ret. stdev avg. ret. stdev avg. ret. stdev Recovery (2009-‐2010) 40.74% 12.25% 33.58% 12.43% 24.77% 13.85% 37.15% 16.83% 30.50% 15.62% 21.25% 16.37% Uncertainty (2011-‐2013) 12.84% 17.29% 10.52% 14.06% 10.75% 13.00% 10.79% 16.61% 9.69% 15.55% 8.96% 12.74% The evidence of our investigation shows that the value-‐growth spread over the long-‐run is positive, however over shorter periods the relationship does somewhat reverse. These results are in accordance with past research of value versus growth stock portfolios. The reversed relationship in recent times looks like what Chan, Karceski and Lakonishok (2000) found at the heights of the tech-‐ boom. It is however a too short period to conclude any lasting reversed relationship and it might simply be a sign of a good time to buy stocks for investors performing the value investing philosophy. 8.2 USA I use the MSCI United States index to represent the United States. This is the only individual country which is investigated because it historically has and still do account for much of the global stock market. Figure 8.2.1 shows that the value index has performed at least as good as, and from 2000-‐ 2007;2011-‐2013 better than the traditional index, and outperformed the growth index over the whole period. These results are also re-‐confirmed by Figure 8.2.2 which presents the performance of the style indexes based on size. Also the recent short-‐run performance of the MSCI US style indexes presents the value index as the preferred choice in contrast with the short-‐term results of the MSCI World index where the value-‐growth spread became negative. P a g e 28 | 52 Graph 8.2.1 – MSCI US Index Performance Graph 8.2.2 – MSCI US Style-‐Size Performance Table 8.2.1 presents level of outperformance and rate of value-‐growth relationship. The positive value-‐growth spread cannot be explained by higher risk in the value index, as the value index in our data both outperforms and has lower risk than the growth index. This is presented by a Sharpe and Sortino ratio, which almost is twice as high for the value index. The value index is also following the market index more closely than the growth index. Table 8.2.2 shows that the VAR at 95%/99% confidence level and the 1-‐ and 3-‐month maximum drawdown was lower over the period for the value index than for the market-‐ and growth index. Table 8.2.1 – MSCI US Performance Index name MSCI World MSCI US Growth MSCI US Value Total Average Standard Sharpe Sortino Excess return return deviation ratio ratio return 50.51% 3.61% 20.04% 0.08 0.10 -‐ 44.27% 3.16% 21.35% 0.05 0.07 -‐0.45% 51.70% 3.69% 18.24% 0.09 0.12 0.08% Tracking error (periodic) -‐ 1.90% 1.81% Tracking Information error ratio Information (annual) (periodic) ratio (annual) -‐ -‐ -‐ 6.58% -‐0.01 -‐0.07 6.25% 0.03 0.01 Table 8.2.2 – MSCI US Risk Index name MSCI World MSCI US Growth MSCI US Value Maximum Maximum Semi-‐ VAR 95% VAR 95% VAR 99% VAR 99% drawdown drawdown Correlation deviation (monthly) (annual) (monthly) (annual) (1-‐month) (3-‐month) 1.000 15.75% -‐7.74% -‐26.80% -‐10.99% -‐38.06% -‐19.04% -‐22.18% 0.923 16.51% -‐8.13% -‐28.16% -‐11.54% -‐39.99% -‐18.27% -‐25.04% 0.924 14.22% -‐7.57% -‐26.23% -‐10.75% -‐37.25% -‐16.23% -‐20.82% From the CAPM regression results in Table 8.2.3 and the Fama-‐French-‐Carhart regression results in Table 8.2.4 we can see that both style indexes varies less than the market, however the value index has less variation than the growth index. The CAPM explains about 85% of the variability in the returns. The value index has a significantly negative weighting of the SMB factor at 5% significant level and an expected positive weight on HML. The alpha for the value index is negative, however not significant. The four-‐factor model explains 90-‐91% of the variability of the returns of the indexes. P a g e 29 | 52 Table 8.2.3 – MSCI US CAPM Index name α (%) β MSCI World 0.000 1.000 *** MSCI US Growth -‐0.023 0.972 *** MSCI US V alue 0.061 0.904 *** *** Significant at 1 % ** Significant at 5% * Significant at 10 % R2 1.000 0.853 0.855 Table 8.2.4 – MSCI US Fama-‐French-‐Carhart Index name α (%) β MSCI World 0.000 1.000 *** MSCI US Growth 0.167 0.968 *** MSCI US Value -‐0.010 0.877 *** *** Significant at 1 % ** Significant at 5% * Significant at 10 % SMB 0.000 *** -‐0.046 -‐0.073 ** HML 0.000 -‐0.336 *** 0.237 *** MOM 0.000 *** -‐0.006 -‐0.087 *** R2 1.000 0.901 0.913 The evidence from financial ratios provided in Table 8.2.5 are mixed. The most popular value ratios in terms of P/B, P/E, P/CF and dividend yield are favouring the value index as exhibiting value characteristics compared to the growth index, while the ratios EV/Sales and EV/EBIT gives the opposite results. The relative difference between in ratios can also be seen from Graph 8.2.3-‐8.2.6. Table 8.2.5 – MSCI US Financial Ratios Index MSCI World MSCI US MSCI US Growth MSCI US Value EV/Sales EV/EBITDA EV/EBIT P/CF 1.86 10.23 17.09 10.29 2.20 10.69 17.41 11.06 2.25 12.18 16.81 14.40 2.31 9.88 18.81 9.56 Graph 8.2.3 – MSCI US Ratios Graph 8.2.5 – MSCI US Ratios P/E 19.68 18.21 22.14 15.91 P/B Div. yield 2.22 2.33 2.71 1.88 4.30 1.09 2.02 2.64 CR MCAP CAPEX 1.20 25065 -‐65.80 1.25 11860 -‐51.63 1.40 6403 -‐53.74 1.14 6331 -‐82.40 D/A 30.13 32.82 28.61 33.69 Graph 8.2.4 – MSCI US Ratios Graph 8.2.6 – MSCI US MCAP P a g e 30 | 52 Table 8.2.6 shows that the value-‐growth spread was positive from 2000-‐2008 and it turned negative from 2009-‐2013. This is the same change as we saw for the MSCI World index, and therefore supports our notion of a possible bubble based on evidence from the tech-‐bubble. Table 8.2.6 – MSCI US Market Environments MSCI World MSCI US Growth MSCI US Value Economic conditions avg. ret. stdev avg. ret. stdev avg. ret. stdev Tech-‐crisis (2000-‐2001) -‐14.40% 0.35% -‐20.77% 6.61% -‐6.15% 7.13% Growth (2002-‐2007) 5.78% 15.70% 4.71% 14.28% 6.18% 17.05% Great recession (2008) -‐42.08% -‐ -‐39.73% -‐ -‐37.58% -‐ Recovery (2009-‐2010) 18.26% 8.71% 24.89% 9.83% 12.82% 1.49% Uncertainty (2011-‐2013) 9.89% 13.16% 15.84% 12.25% 12.95% 12.26% Since I were able to gather data for the style-‐size indexes for the whole data period 2000-‐2013, the results of the style-‐size indexes are consistent with the general findings of long-‐run value and growth style index. This can be seen from Table 8.2.7 that shows the value indexes outperformed all of the growth indexes. Table 8.2.8 supplements with findings of lower risk in value indexes. Table 8.2.7 – MSCI US Style-‐Size Performance Index name MSCI World MSCI US Growth Small-‐Cap MSCI US Value Small-‐Cap MSCI US Growth Mid-‐Cap MSCI US Value Mid-‐Cap MSCI US Growth Large-‐Cap MSCI US Value Large-‐Cap Total Average Standard Sharpe Sortino Excess return return deviation ratio ratio return 50.51% 3.61% 20.04% 0.08 0.10 -‐ 141.39% 10.10% 25.45% 0.31 0.43 6.49% 147.95% 10.57% 18.90% 0.44 0.58 6.96% 95.01% 6.79% 26.56% 0.17 0.23 3.18% 148.24% 10.59% 19.42% 0.43 0.55 6.98% 27.99% 2.00% 22.15% 0.00 0.00 -‐1.61% 56.86% 4.06% 16.88% 0.12 0.15 0.45% Tracking error (periodic) -‐ 3.89% 2.75% 4.01% 2.38% 2.35% 1.92% Tracking Information error ratio Information (annual) (periodic) ratio (annual) -‐ -‐ -‐ 13.48% 0.15 0.74 9.52% 0.23 0.61 13.90% 0.07 0.35 8.24% 0.26 0.66 8.14% -‐0.05 -‐0.22 6.66% 0.05 0.04 Table 8.2.8 – MSCI US Style-‐Size Risk Index name MSCI World MSCI US Growth Small-‐Cap MSCI US Value Small-‐Cap MSCI US Growth Mid-‐Cap MSCI US Value Mid-‐Cap MSCI US Growth Large-‐Cap MSCI US Value Large-‐Cap Maximum Maximum Semi-‐ VAR 95% VAR 95% VAR 99% VAR 99% drawdown drawdown Correlation deviation (monthly) (annual) (monthly) (annual) (1-‐month) (3-‐month) 1.00 14.69% -‐7.49% -‐25.93% -‐10.63% -‐36.83% -‐17.25% -‐22.82% 0.84 18.64% -‐11.36% -‐39.36% -‐16.13% -‐55.89% -‐22.17% -‐28.11% 0.86 14.81% -‐8.83% -‐30.58% -‐12.54% -‐43.43% -‐21.25% -‐26.23% 0.82 20.40% -‐11.22% -‐38.88% -‐15.94% -‐55.21% -‐22.84% -‐28.90% 0.88 15.55% -‐8.21% -‐28.44% -‐11.66% -‐40.38% -‐22.20% -‐24.85% 0.89 17.06% -‐8.68% -‐30.05% -‐12.32% -‐42.68% -‐17.54% -‐23.39% 0.91 13.48% -‐7.19% -‐24.91% -‐10.21% -‐35.37% -‐15.60% -‐20.51% The CAPM regression in Table 8.2.9 finds evidence of lower variability with the market index of the value indexes than for the growth indexes, and a positive alpha on a 10% significant level for the small-‐ and mid-‐cap value index. The variability of the returns explained by the model is ranging from 70% for the small-‐cap indexes to 83% for the large-‐cap indexes. The Fama-‐French-‐Carhart model in Table 8.2.10 finds a general tendency of value indexes being comprised of past losers of small size and a high B/M ratio. It does seem like the indexes exploit the best value-‐growth spread as both empirical research by Fama-‐French (1998), my results and portfolio managers in form of Tweedy, P a g e 31 | 52 Browne (2009) finds evidence of a higher value-‐growth spread for small caps than large cap companies. Table 8.2.9 – MSCI US Style-‐Size CAPM Index name α (%) β MSCI World 0.000 1.000 *** MSCI US Growth Small-‐Cap 0.577 ** 1.232 *** MSCI US V alue Small-‐Cap 0.642 *** 0.977 *** MSCI US Growth Mid-‐Cap 0.267 1.186 *** MSCI US V alue Mid-‐Cap 0.612 *** 0.932 *** MSCI US Growth Large-‐Cap -‐0.119 1.006 *** MSCI US V alue Large-‐Cap 0.102 0.846 *** *** Significant at 1 % ** Significant at 5% * Significant at 10 % R2 1.000 0.706 0.736 0.669 0.775 0.802 0.833 Table 8.2.10 – MSCI US Style-‐Size Fama-‐French-‐Carhart Index name α (%) β MSCI World 0.000 1.000 *** MSCI US Growth Small-‐Cap 0.329 ** 1.090 *** MSCI US Value Small-‐Cap 0.133 0.876 *** MSCI US Growth Mid-‐Cap 0.214 1.108 *** MSCI US Value Mid-‐Cap 0.279 ** 0.888 *** MSCI US Growth Large-‐Cap 0.129 0.972 *** MSCI US Value Large-‐Cap 0.017 0.853 *** *** Significant at 1 % ** Significant at 5% * Significant at 10 % SMB 0.000 *** 0.856 *** 0.506 *** 0.654 *** 0.183 *** 0.020 -‐0.127 *** HML 0.000 -‐0.213 *** 0.623 *** -‐0.462 *** 0.533 *** -‐0.494 *** 0.290 *** MOM 0.000 *** -‐0.017 -‐0.082 *** 0.065 ** -‐0.060 ** -‐0.037 -‐0.039 ** R2 1.000 0.932 0.910 0.900 0.896 0.904 0.917 Table 8.2.11 confirms the findings from the last sub-‐section, namely a reversed value-‐growth spread in the recent short-‐run, also are present in the US data. Table 8.2.11 – MSCI US Style-‐Size Market Environments MSCI US Growth MSCI US Growth MSCI US Growth MSCI US Value MSCI US Value Mid-‐ MSCI US Value Small-‐Cap Mid-‐Cap Large-‐Cap Small-‐Cap Cap Large-‐Cap Economic conditions avg. ret. stdev avg. ret. stdev avg. ret. stdev avg. ret. stdev avg. ret. stdev avg. ret. stdev Tech-‐crisis (2000-‐2001) -‐7.38% 0.96% -‐23.48% 2.89% -‐26.09% 3.21% 14.21% 3.92% 12.92% 6.67% -‐1.06% 6.02% Growth (2002-‐2007) 10.98% 23.06% 11.62% 18.60% 3.94% 16.42% 10.74% 17.59% 10.98% 16.15% 6.08% 14.81% Great recession (2008) -‐40.32% -‐ -‐47.36% -‐ -‐37.28% -‐ -‐33.93% -‐ -‐38.36% -‐ -‐38.04% -‐ Recovery (2009-‐2010) 35.82% 5.55% 35.31% 6.75% 23.11% 9.97% 24.51% 2.20% 26.69% 7.40% 11.32% 1.32% Uncertainty (2011-‐2013) 19.64% 18.78% 16.33% 17.18% 15.87% 11.85% 13.33% 15.08% 13.83% 13.65% 12.62% 11.84% Our findings for the US stock market represented by MSCI United States is an outperformance by value indexes compared to growth indexes over the long-‐run. Over the short-‐run the results are mixed and in recent times (after the burst of the financial crisis) growth indexes have performed better than value indexes. 8.3 Europe Europe is examined based on MSCI Europe. The value-‐growth performance can be seen from Figure 8.3.1 which shows that the value-‐index has outperformed the growth-‐index historically, but that the relationship in recent times somewhat has diminished. Figure 8.3.2 presents the size-‐style indexes performance over the short-‐run, evidence that show signs of a negative value-‐growth spread. P a g e 32 | 52 Graph 8.3.1 – MSCI Europe Index Performance Graph 8.3.2 – Style-‐Size Indexes Performance I find evidence that the positive value-‐growth spread is partly explained by higher risk for the value index, but that the value index delivers an abnormal performance even when the return is adjusted for risk. Table 8.3.1 confirms these findings in terms of a positive value-‐growth spread Sharpe and Sortino ratio, while Table 8.3.2 finds a higher VAR 95%/99% and maximum drawdown 1-‐ and 3-‐ month for the value index than for the growth index. Table 8.3.1 – MSCI Europe Performance Index name MSCI World MSCI Europe Growth MSCI Europe Value Total Average Standard Sharpe Sortino Excess return return deviation ratio ratio return 50.51% 3.61% 20.04% 0.08 0.10 -‐ 10.31% 0.74% 20.07% -‐0.06 -‐0.08 -‐2.87% 22.13% 1.58% 21.36% -‐0.02 -‐0.02 -‐2.03% Tracking error (periodic) -‐ 2.60% 2.59% Tracking Information error ratio Information (annual) (periodic) ratio (annual) -‐ -‐ -‐ 9.02% -‐0.09 -‐0.34 8.98% -‐0.06 -‐0.22 Table 8.3.2 – MSCI Europe Risk Index name MSCI World MSCI Europe Growth MSCI Europe Value Maximum Maximum Semi-‐ VAR 95% VAR 95% VAR 99% VAR 99% drawdown drawdown Correlation deviation (monthly) (annual) (monthly) (annual) (1-‐month) (3-‐month) 1.000 15.75% -‐7.74% -‐26.80% -‐10.99% -‐38.06% -‐19.04% -‐22.18% 0.834 16.16% -‐7.03% -‐24.36% -‐9.99% -‐34.59% -‐11.41% -‐21.49% 0.865 17.24% -‐8.53% -‐29.53% -‐12.11% -‐41.94% -‐17.09% -‐25.06% From the CAPM and Fama-‐French-‐Carhart model in Table 8.3.3 and Table 8.3.4 I find a higher variability to the market for the value index than for the growth index. The CAPM model only explains 70-‐74% of the variability of the returns. The FFC model finds evidence of the value index being comprised of past losers of small size and high B/M ratio, while the corresponding growth index of past losers of small size and low B/M ratio. The model explains 72-‐77% of the variability of the returns. Table 8.3.3 – MSCI Europe CAPM Index name α (%) β MSCI World 0.000 1.000 *** MSCI Europe Growth -‐0.236 0.759 *** MSCI Europe V alue -‐0.164 0.951 *** *** Significant at 1 % ** Significant at 5% * Significant at 10 % R2 1.000 0.698 0.749 P a g e 33 | 52 Table 8.3.4 – MSCI Europe Fama-‐French-‐Carhart Index name α (%) β MSCI World 0.000 1.000 *** MSCI Europe Growth -‐0.187 0.742 *** MSCI Europe Value -‐0.252 0.881 *** *** Significant at 1 % ** Significant at 5% * Significant at 10 % SMB 0.000 *** 0.071 0.091 HML 0.000 -‐0.153 *** 0.147 ** MOM 0.000 *** -‐0.005 -‐0.122 *** R2 1.000 0.721 0.774 Table 8.3.5 provides us with mixed financial ratio results, where EV/Sales, P/CF and P/B supports the value index of being characterised as the index with value features in relative terms, while the P/E and EV/EBIT ratio contradicts it. These same results can also be seen from Graph 8.3.3-‐8.3.6. Table 8.3.5 – MSCI Europe Financial Ratios Index MSCI World MSCI EU MSCI Europe Growth MSCI Europe Value EV/Sales EV/EBITDA EV/EBIT P/CF 1.86 10.23 17.09 10.29 1.65 9.26 15.74 9.18 1.82 10.15 16.14 10.96 1.62 8.42 16.50 8.13 Graph 8.3.3 – MSCI Europe Ratios Graph 8.3.5 – MSCI Europe Ratios P/E 19.68 22.98 20.50 43.68 P/B Div. yield 2.22 2.33 1.97 3.16 2.92 2.31 1.50 4.04 CR MCAP CAPEX 1.20 25065 -‐65.80 1.12 6424 -‐6.36 1.12 3590 -‐3.95 1.11 3446 -‐9.30 D/A 30.13 30.55 28.08 31.00 Graph 8.3.4 – MSCI Europe Ratios Graph 8.3.6 – MSCI Europe MCAP From Table 8.3.6 I find a relationship which is consistent with my findings of the earlier investigated indexes, namely that the value-‐growth spread is positive in the period 2000-‐2007 and turns negative from or around the financial crisis until the end of the data sample. P a g e 34 | 52 Table 8.3.6 – MSCI Europe Market Environments Table 8.3.7 and Table 8.3.8 that are based on size-‐style index data over the period 2008-‐2013 provide evidence of a negative value-‐growth spread for all the size-‐based style indexes. My findings of a higher risk-‐adjusted performance for growth indexes than for value indexes in the period comes as no surprise, as all of my earlier findings propose a changed relationship between the style indexes after the financial crisis. This is however not the same as stating that growth indexes will outperform value indexes over the long-‐run, since it might be signs of a bubble based on the over-‐optimism in recent years. Table 8.3.7 – MSCI Europe Style-‐Size Performance Index name MSCI World MSCI Europe Growth Small-‐Cap MSCI Europe Value Small-‐Cap MSCI Europe Growth Mid-‐Cap MSCI Europe Value Mid-‐Cap MSCI Europe Growth Large-‐Cap MSCI Europe Value Large-‐Cap Tracking Tracking Information Total Average Standard Sharpe Sortino Excess error error ratio Information return return deviation ratio ratio return (periodic) (annual) (periodic) ratio (annual) 24.11% 4.02% 23.47% 0.15 0.19 -‐ -‐ -‐ -‐ -‐ 65.24% 10.87% 37.37% 0.28 0.35 6.85% 3.14% 10.87% 0.10 0.24 62.61% 10.44% 39.80% 0.25 0.33 6.42% 3.78% 13.10% 0.07 0.22 29.98% 5.00% 30.44% 0.15 0.19 0.98% 2.31% 8.00% 0.00 0.13 13.51% 2.25% 32.18% 0.06 0.08 -‐1.77% 3.24% 11.21% -‐0.07 0.05 16.65% 2.78% 23.99% 0.10 0.12 -‐1.24% 1.75% 6.08% -‐0.05 0.09 -‐7.77% -‐1.29% 27.25% -‐0.06 -‐0.08 -‐5.31% 2.96% 10.24% -‐0.14 -‐0.05 Table 8.3.8 – MSCI Europe Style-‐Size Risk Index name MSCI World MSCI Europe Growth Small-‐Cap MSCI Europe Value Small-‐Cap MSCI Europe Growth Mid-‐Cap MSCI Europe Value Mid-‐Cap MSCI Europe Growth Large-‐Cap MSCI Europe Value Large-‐Cap Maximum Maximum Semi-‐ VAR 95% VAR 95% VAR 99% VAR 99% drawdown drawdown Correlation deviation (monthly) (annual) (monthly) (annual) (1-‐month) (3-‐month) 1.000 19.41% -‐8.23% -‐28.52% -‐11.76% -‐40.72% -‐19.04% -‐22.82% 0.938 29.79% -‐12.85% -‐44.53% -‐18.36% -‐63.59% -‐28.44% -‐32.32% 0.936 30.55% -‐14.11% -‐48.87% -‐20.15% -‐69.80% -‐27.76% -‐29.61% 0.965 24.70% -‐11.96% -‐41.45% -‐17.09% -‐59.19% -‐27.65% -‐28.57% 0.945 24.93% -‐13.28% -‐46.00% -‐18.96% -‐65.69% -‐24.03% -‐28.11% 0.960 19.64% -‐10.27% -‐35.56% -‐14.66% -‐50.78% -‐18.32% -‐21.42% 0.957 21.21% -‐13.04% -‐45.19% -‐18.63% -‐64.53% -‐22.51% -‐24.01% The findings of Table 8.3.9 through 8.3.10 are of the same character as the other regressions earlier in this sub-‐section. P a g e 35 | 52 Table 8.3.9 – MSCI Europe Style-‐Size CAPM Index name α (%) β MSCI World 0.000 1.000 *** MSCI Europe Growth Small-‐Cap 0.250 1.291 *** MSCI Europe V alue Small-‐Cap 0.191 1.413 *** MSCI Europe Growth Mid-‐Cap -‐0.057 1.236 *** MSCI Europe V alue Mid-‐Cap -‐0.295 1.344 *** MSCI Europe Growth Large-‐Cap -‐0.094 1.055 *** MSCI Europe V alue Large-‐Cap -‐0.481 * 1.336 *** *** Significant at 1 % ** Significant at 5% * Significant at 10 % R2 1.000 0.880 0.876 0.931 0.894 0.922 0.916 Table 8.3.10 – MSCI Europe Style-‐Size Fama-‐French-‐Carhart Index name α (%) β MSCI World 0.000 1.000 *** MSCI Europe Growth Small-‐Cap 0.159 1.330 *** MSCI Europe Value Small-‐Cap 0.067 1.312 *** MSCI Europe Growth Mid-‐Cap -‐0.093 1.285 *** MSCI Europe Value Mid-‐Cap -‐0.318 1.292 *** MSCI Europe Growth Large-‐Cap -‐0.043 1.141 *** MSCI Europe Value Large-‐Cap -‐0.402 1.320 *** *** Significant at 1 % ** Significant at 5% * Significant at 10 % SMB 0.000 *** 0.155 0.118 0.044 -‐0.080 -‐0.114 -‐0.268 ** HML 0.000 -‐0.496 *** -‐0.190 -‐0.370 *** -‐0.096 -‐0.246 *** 0.074 MOM 0.000 *** -‐0.068 -‐0.190 *** -‐0.028 -‐0.188 *** 0.057 -‐0.095 * R2 1.000 0.903 0.905 0.946 0.909 0.940 0.925 Table 8.3.11 – MSCI Europe Style-‐Size Market Environments MSCI Europe MSCI Europe MSCI Europe MSCI Europe Value MSCI Europe Value MSCI Europe Value Growth Small-‐Cap Growth Mid-‐Cap Growth Large-‐Cap Small-‐Cap Mid-‐Cap Large-‐Cap Economic conditions avg. ret. stdev avg. ret. stdev avg. ret. stdev avg. ret. stdev avg. ret. stdev avg. ret. stdev Great recession (2008) -‐55.81% -‐ -‐52.29% -‐ -‐43.29% -‐ -‐55.48% -‐ -‐52.35% -‐ -‐51.19% -‐ Recovery (2009-‐2010) 40.65% 17.07% 26.78% 13.62% 17.46% 10.85% 39.01% 24.27% 21.56% 19.57% 12.00% 19.03% Uncertainty (2011-‐2013) 13.25% 22.79% 9.57% 17.26% 8.34% 13.81% 13.36% 27.84% 7.58% 23.35% 6.47% 15.35% Based on this we conclude that the evidence from Europe re-‐confirms our earlier findings of an outperformance by value indexes over the long-‐run and varying relationships of the value-‐growth spread over the short-‐run. 8.4 Emerging Markets The emerging markets are represented by the MSCI EM Emerging index. The EM seem to be the exception as the value-‐growth spread was near zero and negative in the first years of the data period and from 2003 has remained positive. This development can be seen from Graph 8.4.1 and 8.4.2. Graph 8.4.1 – MSCI EM Index Performance Graph 8.4.2 – MSCI EM Style-‐Size Performance P a g e 36 | 52 From Table 8.4.1 and Table 8.4.2 we can see that the value index has outperformed the growth index even after the performance is adjusted for risk, as represented by the Sharpe, Sortino and Information Ratio. The standard deviation is somewhat higher for the value index, but other statistics like VAR 95%/99% and 1-‐ and 3-‐month maximum drawdown is lower. Table 8.4.1 – MSCI Emerging Markets Performance Index name MSCI World MSCI Emerging Growth MSCI Emerging Value Total Average Standard Sharpe Sortino Excess return return deviation ratio ratio return 50.51% 3.61% 20.04% 0.08 0.10 -‐ 141.79% 10.13% 32.95% 0.24 0.34 6.52% 160.63% 11.47% 33.17% 0.28 0.40 7.87% Tracking error (periodic) -‐ 3.76% 3.67% Tracking Information error ratio Information (annual) (periodic) ratio (annual) -‐ -‐ -‐ 13.04% 0.11 0.34 12.73% 0.14 0.38 Table 8.4.2 – MSCI Emerging Markets Risk Index name MSCI World MSCI Emerging Growth MSCI Emerging Value Maximum Maximum Semi-‐ VAR 95% VAR 95% VAR 99% VAR 99% drawdown drawdown Correlation deviation (monthly) (annual) (monthly) (annual) (1-‐month) (3-‐month) 1.000 15.75% -‐7.74% -‐26.80% -‐10.99% -‐38.06% -‐19.04% -‐22.18% 0.860 24.05% -‐11.46% -‐39.69% -‐16.27% -‐56.37% -‐27.75% -‐29.47% 0.849 23.61% -‐11.07% -‐38.36% -‐15.72% -‐54.47% -‐27.26% -‐26.46% The CAPM in Table 8.4.3 gives the value index a positive alpha on a 10% significant level and a lower variability to the market than the growth index. In Table 8.4.4 the FFC show that the value index is comprised of past losers of small size and high B/M and corresponding low B/M for the growth index. Table 8.4.3 – MSCI Emerging Markets CAPM Index name α (%) β MSCI World 0.000 1.000 *** MSCI Emerging Growth 0.390 1.271 *** MSCI Emerging V alue 0.501 * 1.213 *** *** Significant at 1 % ** Significant at 5% * Significant at 10 % R2 1.000 0.739 0.722 Table 8.4.4 – MSCI Emerging Markets Fama-‐French-‐Carhart Index name α (%) β MSCI World 0.000 1.000 *** MSCI Emerging Growth 0.370 1.210 *** MSCI Emerging Value 0.403 1.144 *** *** Significant at 1 % ** Significant at 5% * Significant at 10 % SMB 0.000 *** 0.301 *** 0.237 *** HML 0.000 -‐0.203 ** 0.026 MOM 0.000 *** -‐0.021 -‐0.069 R2 1.000 0.781 0.737 The financial ratios summarised in Table 8.4.5 confirms the value index as the index most aligned with the value investing characteristics relative to the growth index. These findings are also shown in Graph 8.4.3-‐8.4.6. P a g e 37 | 52 Table 8.4.5 – MSCI Emerging Markets Financial Ratios Index EV/Sales EV/EBITDA EV/EBIT P/CF MSCI World 1.86 10.23 17.09 10.29 MSCI Emerging 1.61 7.51 11.92 7.74 MSCI EM Growth Index 2.21 9.66 16.64 9.58 MSCI EM Value Index 1.63 7.30 12.50 6.48 Graph 8.4.3 – MSCI Emerging Markets Ratios P/E 19.68 13.18 13.94 12.05 P/B Div. yield 2.22 2.33 1.78 2.47 2.46 1.69 1.34 2.99 CR MCAP CAPEX 1.20 25065 -‐65.80 1.28 4513 -‐58.09 1.31 2576 -‐9.05 1.24 2626 -‐16.09 D/A 30.13 20.49 21.81 20.88 Graph 8.4.4 – MSCI Emerging Markets Ratios Graph 8.4.5 – MSCI Emerging Markets Ratios Graph 8.4.6 – MSCI Emerging Markets MCAP Table 8.4.6 show that the emerging markets is consistent with the developed markets in the period 2000-‐2007, thereafter the value-‐growth spread remains positive in emerging markets compared to the negative value-‐growth spread in the US and Europe. Table 8.4.6 – MSCI EM Market Environments MSCI World MSCI EM Growth MSCI EM Value Economic conditions avg. ret. stdev avg. ret. stdev avg. ret. stdev Tech-‐crisis (2000-‐2001) -‐14.40% 0.35% -‐20.00% 11.70% -‐17.05% 15.60% Growth (2002-‐2007) 5.78% 15.70% 25.32% 17.49% 28.71% 18.92% Great recession (2008) -‐42.08% -‐ -‐57.19% -‐ -‐51.71% -‐ Recovery (2009-‐2010) 18.26% 8.71% 45.85% 28.64% 45.02% 29.52% Uncertainty (2011-‐2013) 9.89% 13.16% -‐1.55% 15.87% -‐5.30% 13.30% Our data on the size-‐style indexes starting in 2008 show a positive value-‐growth spread for the small-‐ and mid-‐cap indexes and a negative spread for the large-‐cap indexes. This decreasing spread P a g e 38 | 52 due to size is consistent with Fama and French (1998). The risk is lowest for value indexes as shown in Table 8.4.7 and Table 8.4.8. Table 8.4.7 – MSCI Emerging Markets Style-‐Size Performance Index name MSCI World MSCI Emerging Growth Small-‐Cap MSCI Emerging Value Small-‐Cap MSCI Emerging Growth Mid-‐Cap MSCI Emerging Value Mid-‐Cap MSCI Emerging Growth Large-‐Cap MSCI Emerging Value Large-‐Cap Tracking Tracking Information Total Average Standard Sharpe Sortino Excess error error ratio Information return return deviation ratio ratio return (periodic) (annual) (periodic) ratio (annual) 24.11% 11.47% 33.17% 0.28 0.40 -‐ -‐ -‐ -‐ -‐ 66.80% 11.13% 51.51% 0.21 0.34 7.11% 4.56% 15.79% 0.00 0.20 75.32% 12.55% 50.55% 0.24 0.40 8.53% 4.47% 15.48% 0.04 0.24 36.60% 6.10% 44.27% 0.13 0.20 2.08% 4.29% 14.86% -‐0.06 0.07 58.04% 9.67% 43.41% 0.21 0.34 5.65% 4.24% 14.70% 0.03 0.19 37.77% 6.30% 37.44% 0.16 0.24 2.28% 3.56% 12.34% -‐0.02 0.10 23.24% 3.87% 36.33% 0.10 0.15 -‐0.15% 3.49% 12.10% -‐0.07 -‐0.01 Table 8.4.8 – MSCI Emerging Markets Style-‐Size Risk Maximum Maximum Semi-‐ VAR 95% VAR 95% VAR 99% VAR 99% drawdown drawdown Index name Correlation deviation (monthly) (annual) (monthly) (annual) (1-‐month) (3-‐month) MSCI World 1.000 19.41% -‐12.67% -‐43.88% -‐18.09% -‐62.68% -‐19.04% -‐22.18% MSCI Emerging Growth Small-‐Cap 0.869 32.05% -‐14.11% -‐48.88% -‐20.15% -‐69.81% -‐31.60% -‐30.19% MSCI Emerging Value Small-‐Cap 0.870 30.92% -‐13.95% -‐48.33% -‐19.93% -‐69.03% -‐29.10% -‐26.89% MSCI Emerging Growth Mid-‐Cap 0.875 28.40% -‐13.69% -‐47.41% -‐19.55% -‐67.72% -‐30.58% -‐32.56% MSCI Emerging Value Mid-‐Cap 0.879 27.13% -‐13.67% -‐47.36% -‐19.53% -‐67.64% -‐26.25% -‐26.67% MSCI Emerging Growth Large-‐Cap 0.898 25.09% -‐12.65% -‐43.81% -‐18.06% -‐62.57% -‐27.31% -‐29.11% MSCI Emerging Value Large-‐Cap 0.901 23.01% -‐12.58% -‐43.57% -‐17.96% -‐62.23% -‐27.42% -‐27.23% Table 8.4.9 and 8.4.10 present the regression results from CAPM and Fama-‐French-‐Carhart. These findings are in line with the findings earlier in the sub-‐section. Table 8.4.9 – MSCI EM Style-‐Size CAPM Index name α (%) β MSCI World 0.000 1.000 *** MSCI Emerging Growth Small-‐Cap -‐0.103 1.323 *** MSCI Emerging V alue Small-‐Cap 0.091 1.310 *** MSCI Emerging Growth Mid-‐Cap -‐0.356 1.293 *** MSCI Emerging V alue Mid-‐Cap 0.049 1.296 *** MSCI Emerging Growth Large-‐Cap -‐0.152 1.225 *** MSCI Emerging V alue Large-‐Cap -‐0.308 1.223 *** *** Significant at 1 % ** Significant at 5% * Significant at 10 % R2 1.000 0.756 0.758 0.767 0.773 0.807 0.813 Table 8.4.10 – MSCI EM Style-‐Size Fama-‐French-‐Carhart Index name α (%) β MSCI World 0.000 1.000 *** MSCI Emerging Growth Small-‐Cap -‐0.291 1.284 *** MSCI Emerging Value Small-‐Cap -‐0.071 1.251 *** MSCI Emerging Growth Mid-‐Cap -‐0.564 1.238 *** MSCI Emerging Value Mid-‐Cap -‐0.176 1.230 *** MSCI Emerging Growth Large-‐Cap -‐0.266 1.262 *** MSCI Emerging Value Large-‐Cap -‐0.432 1.212 *** *** Significant at 1 % ** Significant at 5% * Significant at 10 % SMB 0.000 *** 0.221 0.175 0.316 0.358 * 0.126 0.141 HML 0.000 -‐0.731 *** -‐0.630 *** -‐0.613 *** -‐0.613 *** -‐0.554 *** -‐0.511 *** MOM 0.000 *** -‐0.326 *** -‐0.339 *** -‐0.281 *** -‐0.291 *** -‐0.118 -‐0.196 *** R2 1.000 0.820 0.817 0.819 0.829 0.838 0.847 P a g e 39 | 52 The performance over different market environments in Table 8.4.11 show that the value indexes after the financial crisis outperforms the growth indexes for small-‐ and mid-‐cap size, while the growth index outperforms the value index in the large-‐cap case. Table 8.4.11 – MSCI EM Style-‐Size Market Environments MSCI EM Growth MSCI EM Growth MSCI EM Growth MSCI EM Value MSCI EM Value Mid-‐ MSCI EM Value Small-‐Cap Mid-‐Cap Large-‐Cap Small-‐Cap Cap Large-‐Cap Economic conditions avg. ret. stdev avg. ret. stdev avg. ret. stdev avg. ret. stdev avg. ret. stdev avg. ret. stdev Great recession (2008) -‐55.56% -‐ -‐56.20% -‐ -‐48.53% -‐ -‐49.17% -‐ -‐43.57% -‐ -‐46.18% -‐ Recovery (2009-‐2010) 65.30% 43.65% 51.13% 37.01% 45.03% 27.28% 68.40% 40.72% 58.05% 32.57% 42.77% 28.85% Uncertainty (2011-‐2013) -‐2.75% 20.11% -‐3.15% 16.56% -‐1.25% 15.75% -‐4.11% 19.47% -‐4.83% 18.59% -‐5.37% 12.49% P a g e 40 | 52 8.5 The Buffett-‐approach of investing The framework for testing the return performance on indexes compared to what Frazzini, Kabiller and Pedersen (2013) finds to explain the return effect of Warren Buffet is based solely on the six factor framework earlier described. The evidence of the explanatory factors of the variability in returns that is presented in Table 8.5.1 does not support our expectations. The results on the value indexes are somewhat opposed to what one would expect of an index claimed to follow a value approach like Buffett. In developed markets the weightings on both the BAB and QMJ factor are highly negative for value indexes, while positive or slightly negative for growth indexes. For emerging markets the BAB factor for the value index is positive and therefore supports the intuitive idea of Graham`s philosophy, while the negative QMJ factor indicates an index comprised of the opposite type of stocks one would expect. These findings indicates that the growth indexes are comprised of stocks with a low beta, have high profitability and growth, and low required rate of return; while value indexes are comprised with a portfolio of high beta, low profitability and growth, and high required rate of return stocks. Therefore we find no evidence of value stock indexes providing a low cost opportunity to invest like Warren Buffett. Table 8.5.1 – Buffett Approach to Investing Index name MSCI World MSCI World Growth MSCI World V alue MSCI US MSCI US Growth MSCI US V alue MSCI Europe MSCI Europe Growth MSCI Europe V alue MSCI Emerging MSCI Emerging Growth MSCI Emerging V alue *** Significant at 1 % ** Significant at 5% * Significant at 10 % α (%) 0.000 -‐0.051 0.049 0.000 -‐0.015 0.014 -‐0.075 -‐0.149 -‐0.011 0.736 ** 0.666 ** 0.799 ** β 1.000 *** 1.069 *** 0.935 *** 0.960 *** 1.066 *** 0.856 *** 0.729 *** 0.714 *** 0.751 *** 1.144 *** 1.184 *** 1.109 *** SMB 0.000 ** 0.043 * -‐0.047 ** -‐0.025 0.037 -‐0.090 ** 0.047 0.075 0.019 0.190 * 0.226 ** 0.146 HML 0.000 -‐0.231 *** 0.224 *** -‐0.037 -‐0.338 *** 0.249 *** 0.043 -‐0.117 ** 0.206 *** -‐0.122 -‐0.233 *** -‐0.004 MOM 0.000 *** 0.032 *** -‐0.037 *** -‐0.051 * -‐0.032 -‐0.079 *** -‐0.035 0.003 -‐0.079 ** -‐0.019 0.001 -‐0.042 BAB 0.000 3.319 -‐3.001 -‐5.811 -‐2.882 -‐8.222 -‐31.476 *** -‐23.438 *** -‐39.505 *** 20.900 * 21.980 * 20.498 QMJ 0.000 12.645 *** -‐12.397 *** 10.294 28.099 *** -‐6.776 -‐18.706 -‐5.170 -‐31.339 ** -‐22.299 -‐20.781 -‐22.913 R2 1.000 0.980 0.981 0.946 0.908 0.918 0.798 0.738 0.803 0.793 0.805 0.761 8.6 Summary The regional results show quite heterogeneous results with an outperformance in both sub-‐periods and in total for Emerging Markets, while Europe and US had a positive value-‐spread until the financial bubble burst and a negative value-‐spread afterwards. One reason for this inconsistency might be that Emerging Markets small-‐ and mid-‐cap firms are relatively smaller than the corresponding small-‐ and mid-‐cap firms in developed markets, in addition to all firms somehow being characterised as growth stocks in Emerging Markets due to its growth profile compared to other markets. Our regressions show that the Fama-‐French-‐Carhart fits good for the US data, while only the factors HML and MOM fits for Emerging Markets and no consistent results on any of the FFC factors in Europe. The MOM factor for growth stocks is negative for size-‐style indexes in all regions expect for large-‐cap in Europe, I would expect these to be positive as growth stocks P a g e 41 | 52 somehow is current winners. In both US and Europe the HML factor matters most in FFC, while SMB matters most in Emerging Markets. In US the value-‐growth indexes seems to consist of mostly large-‐ cap stocks, while Europe and EM consists of mostly small-‐cap stocks, something that might indicate less developed markets. The HML factor increases with size in EM and the only negative value-‐ spread period 2011-‐2013 is most likely to due the slowdown in the recent years in less developed markets. The Beta coefficient also varies a lot between regions, where the beta decreases with size in US and increases with size in World. Europe provides a somewhat counterintuitive result with the beta of value-‐indexes exceeding the beta of growth-‐indexes. Our Buffett analysis finds no consistent results, but to get results as near to Frazzini, Kabiller and Pedersen it might be a sign of Buffett investing into US growth stocks. 9. Conclusion Through a comprehensive and geographical widespread analysis I have investigated the relationship between value and growth indexes around the world. Past research on the subject are mostly consistent in the direction of an outperformance of value stocks both in terms of return and risk. This evidence are a strong contradiction to the supporters of the Efficient Market Hypothesis which argues that higher return always is followed by higher risk. My research is supporting the former evidence and shows that in the long-‐run value indexes outperforms growth indexes. The results for the short-‐run are somewhat mixed and a possible explanation is the recent market turmoil and recent born optimism which might have favoured growth stocks in the rise of a new market cycle. Despite an outperformance it should be noted that I am highly sceptical to whether these indexes can be characterised as any type of value investing index. The majority of the indexes share some characteristics that in academia are described as value, but this term should not be interchanged with value investing as defined by Graham. My results of the Buffett-‐factor model supports this argument as the value indexes do not share the characteristics of Buffett. Opponents might argue that this is because Buffett somewhat has invested in what academics claim to be growth companies. This might be true, but an argument like this just reinforces my notion that academia and the Superinvestors-‐of-‐Graham-‐and-‐Doddsville Village might define the term ‘value’ in different ways. While practitioners of the philosophy characterise it as a bottom-‐up strategy where it depending on the individual investor might be of usual practice to hold only a few stocks and for others a very large portfolio, it is in academia defined as stocks sharing one or a few variables, and what academics might forget is at the core of Graham: an investment in a stock is an investment in a business. My conclusion therefore supports most of the prior research on the subject, namely that value stocks outperform growth stocks and the market index as a whole. As P a g e 42 | 52 many of the value indexes outperforms its peers with lower risk, these findings goes against the semi-‐strong form of market efficiency and supports the view of Graham, which believed that despite a somewhat efficient market there would always exist investment opportunities in securities which traded for less than their underlying value. To summarise I therefore conclude that value investing might be the normal abnormal philosophy after all. P a g e 43 | 52 10. References Ancell, K., 2012. The Origin of the First Index Fund. The University of Chicago Booth School of Business, 28 March, pp. 1-‐16. Asness, C., Frazzini, A. & Pedersen, L., 2014. Quality Minus Junk. Financial Analysts Journal, 44(1). Basu, S., 1977. Investment Performance of Common Stocks in Relation to Their Price-‐Earnings Ratios: A Test of the Efficient Market Hypothesis. Journal of Finance, 32(3), pp. 663-‐682. Blustein, P., 1977. Ben Graham`s Last Will and Testament. Forbes, 1 August, pp. 43-‐45. Bogle, J., 2011. Wall Street Journal. [Online] Available at: http://online.wsj.com/news/articles/SB10001424053111904583204576544681577401622 [Accessed 21 July 2014]. Browne, C., 2000. Value Investing and Behavioral Finance. New York, Columbia Business School. Buffett, W., 1984. The Superinvestors of Graham-‐and-‐Doddsville. Hermes (Columbia Business School Magazine). Capaul, C., Rowley, I. & Sharpe, W., 1993. International value and growth stock returns. Financial Analysts Journal, Volume 49, pp. 27-‐36. Carhart, M., 1997. On Persistence in Mutual Fund Performance. Journal of Finance, 52(1), pp. 57-‐82. Chan, L., Hamao, Y. & Lakonishok, J., 1991. Fundamentals and Stock Returns in Japan. Journal of Finance, 46(5), pp. 1739-‐1764. Chan, L., Karceski, J. & Lakonishok, J., 2000. New Paradigm or Same Old Hype in Equity Investing?. Financial Analysts Journal, 56(4), pp. 23-‐36. Chan, L. & Lakonishok, J., 2004. Value and Growth Investing: Review and Update. Financial Analysts Journal, 60(1), pp. 71-‐86. Chan, L., Lakonishok, J. & Sougiannis, T., 2001. The Stock Market Valuation of Research and Development Expenditures. Journal of Finance , 56(6), pp. 2431-‐2456. Chirkova, E., 2012. Why is it that I am not Warren Buffett. American Journal of Economics, 2(6), pp. 115-‐121. Cohen, R., 2007. Columbia Business School. [Online] Available at: http://www8.gsb.columbia.edu/sites/valueinvesting/files/files/Consortium%20Finding%20Outperfor ming%20Managers.pdf [Accessed 21 July 2014]. Cronqvist, H., Siegel, S. & Yu, F., 2013. Value versus Growth Investing: Why do different investors have different styles. Working Paper, pp. 1-‐28. P a g e 44 | 52 Cunningham, L., 1996. Introdution to the Essays of Warren Buffett: Lessons for Corporate America. The George Washington University Law School Public Law and Legal Theory Working Paper, Issue 294, pp. 1-‐18. Damodaran, A., 2003. Investment Philosophies: Successful Investment Philosophies and the Greatest Investors Who Made Them Work. 1st ed. New York: Wiley Finance. Daniel, K. & Titman, S., 1999. Market Efficiency in an Irrational World. Financial Analysts Journal, 55(6), pp. 28-‐40. Dubinsky, A., 2006. Value Investing Retrospective, New York: Heilbrunn Center for Graham & Dodd Investing Research Project. Estrada, J., 2013. Are stocks riskier than bonds? Not if you assess risk like Warren Buffett. Journal of Asset Management, Volume 14, pp. 73-‐78. Fama, E., 1970. Efficient Capital Markets: A Review of Theory and Empirical Work. The Journal of Finance,, 25(2), pp. 383-‐417. Fama, E., 1998. Market efficiency, long-‐term returns, and behavioral finance. Journal of Financial Economics, Issue 49, pp. 283-‐306. Fama, E. & French, K., 1992. The Cross-‐Section of Expected Stock Returns. The Journal of Finance, XLVII(2), pp. 427-‐465. Fama, E. & French, K., 1993. Common risk factors in the returns on stocks and bonds. Journal of Financial Economics, Volume 33, pp. 3-‐56. Fama, E. & French, K., 1996. Multifactor Explanations of Asset Pricing Anomalies. Journal of Finance , 51(1), pp. 55-‐84. Fama, E. & French, K., 1998. Value versus Growth: The International Evidence. The Journal of Finance, LIII(6), pp. 1975-‐1999. Fama, E. & French, K., 1998. Value versus Growth: The International Evidence. Journal of Finance , 53(6), pp. 1975-‐1999. Frazzini, A., 2014. Andrea Frazzini. [Online] Available at: http://www.econ.yale.edu/~af227/data_library.htm [Accessed 21 July 2014]. Frazzini, A., Kabiller, D. & Pedersen, L., 2013. Buffett`s Alpha. pp. 1-‐45. Frazzini, A. & Pedersen, L., 2013. Betting Against Beta. Journal of Portfolio Management, Issue 39, pp. 49-‐68. French, K., 2014. Ken French. [Online] Available at: http://mba.tuck.dartmouth.edu/pages/faculty/ken.french/data_library.html [Accessed 21 July 2014]. Fund Management Research Centre (FMRC), 2002. A review of the research on the past performance of managed funds, s.l.: Australian Securities & Investments Comission. Graham, B., 1945. Should Security Analysts Have a Professional Rating?. The Analysts Journal , pp. 37-‐41. P a g e 45 | 52 Graham, B., 1949. The Intelligent Investor. 1st ed. New York: Harper & Brothers. Graham, B., 1952. Toward a Science of Security Analysis. The Analysts Journal, pp. 97-‐99. Graham, B., 1957. Two Illustrative Approaches to Formula Valuations of Common Stocks. The Analysts Journal, pp. 11-‐15. Graham, B. & Dodd, D., 1940. Security Analysis. 2nd ed. New York: McGraw-‐Hill. Gray, W. & Kern, A., 2008. Fundamental Value Investors: Characteristics and Performance. Griffin, T., 2014. 25iq. [Online] Available at: http://25iq.com/2014/03/16/ben-‐grahams-‐value-‐investing-‐%E2%89%A0-‐famafrenchs-‐ factor-‐investing/ [Accessed 21 July 2014]. Grossman, S. & Stiglitz, J., 1980. On the Impossibility of Informationally Efficient Markets. American Economic Review, 70(3), p. 393–408. Hagstrom, R., 2005. The Warren Buffett Way. 2nd ed. s.l.:John Wiley & Sons. Hulbert, M., 1998. Investment Approaches: Picking a Value-‐Oriented Adviser. The American Association of Individual Investors Journal, pp. 23-‐25. Investopedia, 2014. Investopedia. [Online] Available at: http://www.investopedia.com/ [Accessed 21 July 2014]. Ippolito, R., Jan-‐Feb 1993. On Studies of Mutual Fund Performance, 1962-‐1991. Financial Analysts Journal, pp. 42-‐50. Jegadeesh, N., Kim, J., Krische, S. & Charles, M., 2002 (Published 2004). Analyzing the Analysts: When Do Recommendations Add Value?. Journal of Finance, Volume 59, pp. 1083-‐1124. Jensen, M., 1967. The Performance Of Mutual Funds. Journal of Finance, 23(2), pp. 389-‐416. Johnson, R., 2011. Learning from the Master. CFA Magazine, Sept-‐Oct, p. 47. Kazemi, H., Shneeweis, T. & Pancholi, D., 2003. Performance Persistence for Mutual Funds: Academic Evidence, s.l.: Center for International Securities and Derivatives Markets. Klerck, W. & Maritz, A., 1997. A test of Graham`s stock selection criteria on industrial shares traded on the JSE. Investment Analysts Journal, Issue 45, pp. 25-‐33. Koenig, D., 2014. Value? Growth? Or Both?, s.l.: Russell Investments. La Porta, R., Lakonishok, J., Shleifer, A. & Vishny, R., 1997. Good News for Value Stocks: Further Evidence on Market Efficiency. The Journal of Finance, LII(2), pp. 859-‐874. Lakonishok, J., Shleifer, A. & Vishney, R., 1992. The Structure and Performance of the Money Management Industry, Washington: Brookings Papers on Economic Activity: Microeconomics. Lakonishok, J., Shleifer, A. & Vishny, R., 1994. Contrarian Investment, Extrapolation and Risk. Journal of Fianance, 49(5), pp. 1541-‐1578. Lintner, J., 1965. The Valuation of Risk Assets and the Selection of Risky Investments in Stock Portfolios and. The Review of Economics and Statistics, 47(1), pp. 13-‐37. P a g e 46 | 52 Lowe, J., 1994. Benjamin Graham on Value Investing: Lessons from the Dean of Wall Street. 1st ed. s.l.:Dearborn Trade. Lowenstein, R., 2008. Buffett: The Biography. s.l.:Gerald Duckworth & Co. Mahalakshmi, N. & Haque, M., 2008. Columbia Business School. [Online] Available at: http://www8.gsb.columbia.edu/sites/valueinvesting/files/files/count_on_the_margin.pdf [Accessed 21 July 2014]. Martin, G. & Puthenpurackal, J., 2008. Imitation is the Sincerest Form of Flattery: Warren Buffett and Berkshire Hathaway. Working Paper at American University and University of Nevada. Morgan Stanley Capital International (MSCI), 2007. MSCI Global Investable Markets Value and Growth Indexes Methodology, s.l.: MSCI Research. Mossin, J., 1966. Equilibrium in a Capital Asset Market. Econometrica, 34(4), pp. 768-‐783. Oppenheimer, H., 1984. A Test of Ben Graham`s Stock Selection Criteria. Financial Analyst Journal, pp. 68-‐73. Oppenheimer, H. & Schlarbaum, G., 1981. Investing with Ben Graham: An Ex Ante Test of the Efficient Market Hypothesis. Journal of Financial and Quantitative Analysis, XVI(3), pp. 341-‐360. Pedersen, L., 2014. Lasse Heje Pedersen. [Online] Available at: http://www.lhpedersen.com/data [Accessed 21 July 2014]. Piotroski, J., 2000. Value Investing: The Use of Historial Financial Statement Information to Separate Winners from Losers. Journal of Accounting Research, Volume 38, pp. 1-‐41. Scott, M., 1996. Value Investing: A Look at the Benjamin Graham Approach. The American Association of Individual Investors Journal, May, pp. 12-‐15. Seckler, M. & Alberg, J., 2008. Eclidean Technologies. [Online] Available at: http://www.euclidean.com/euclideans-‐investment-‐beliefs-‐and-‐approach [Accessed 21 July 2014]. Seckler, M. & Alberg, J., 2009. Eclidean Technologies. [Online] Available at: http://www.euclidean.com/superinvestors-‐of-‐graham-‐and-‐doddsville [Accessed 21 July 2014]. Seckler, M. & Alberg, J., 2009. Euclidean Technologies. [Online] Available at: http://www.euclidean.com/three-‐conditions [Accessed 21 July 2014]. Shahan, E., 1984. Are Short-‐Term Performance and Value Investing Mutually Exclusive? The Hare and the Tortoise Revisited. Hermes (Columbia Businesss School Magazine). Sharpe, W., 1964. Capital Asset Prices: A Theory of Market Equilibrium under Conditions of Risk. The Journal of Finance, 19(3), pp. 425-‐442. Sharpe, W., 1966. Mutual Fund Performance. The Journal of Business, 39(1), pp. 119-‐138. P a g e 47 | 52 Sloan, R., Chee, S. & Uysal, A., 2013. A Framework for Value Investing. Australian Journal of Management, 38(3), pp. 599-‐633. Statman, M. & Scheid, J., 2002. Buffett in foresight and hindsight. Journal of Asset Management, 58(4), pp. 11-‐18. Tilson, W. & Buffett, W., 1991. Three Lectures by Warren Buffett to Notre Dame Faculty. [Online] Available at: http://www.tilsonfunds.com/BuffettNotreDame.pdf [Accessed 21 July 2013]. Tilson, W. & Munger, C., 1995. THE PSYCHOLOGY OF HUMAN MISJUDGMENT, Speech at Harvard Law School. [Online] Available at: http://cnfolio.com/public/charlie_munger_transcript.html [Accessed 21 July 2014]. Treynor, J., 1962. Toward a Theory of Market Value of Risky Assets. Unplublished manuscript. Treynor, J. & Mazuy, K., 1966. Can Mutual Funds Outguess the Market?. Harvard Business Review , 44(4), pp. 131-‐136. Tweedy, Browne Company LLC., 1992, 2009. What Has Worked In Investing, s.l.: s.n. Value Investment Institute, 2010. Value Investment Institute. [Online] Available at: http://www.valueinstitute.org/viewarticle.asp?idIssue=1&idStory=10 [Accessed 21 July 2014]. Yee, K., 2008. Deep-‐Value Investing, Fundamental Risks and the Margin of Safety. Journal of Investing, 17(3), pp. 35-‐46. Zweig, J., 2004. Lessons and Ideas from Benjamin Graham. s.l., AIMR. P a g e 48 | 52 11. Appendix 11.1 Indexes All index data is gathered from a Bloomberg Terminal. Table 11.1.1 show a list of all the indexes corresponding ticker, while Table 11.1.2 gives an abstract explanation and summarises the data sample period. Table 11.1.1 – Index List Ticker Index Name MXWO MSCI World Index MXUS MSCI United States Index MXEU MSCI Europe Index MXEF MSCI Emerging Markets Index MXWO000G MSCI World Growth Index MXWO000V MSCI World Value Index MXWOSC0G MSCI World Small Cap Growth Index MXWOMC0G MSCI World Mid Cap Growth Index MXWOLC0G MSCI World Large Cap Growth Index MXWOSC0V MSCI World Small Cap Value Index MXWOMC0V MSCI World Mid Cap Value Index MXWOLC0V MSCI World Large Cap Value Index MXUS000G MSCI United States Growth Index MXUS000V MSCI United States Value Index MZUSSG MSCI US Small Cap Growth Index MZUSMG MSCI US Mid Cap Growth Index MZUSLG MSCI US Large Cap Growth Index MZUSSV MSCI US Small Cap Value Index MZUSMV MSCI US Mid Cap Value Index MZUSLV MSCI US Large Cap Value Index MXEU000G MSCI Europe Growth Index MXEU000V MSCI Europe Value Index MGSUEUR MSCI Europe Small Growth USD Index MMGUEUR MSCI Europe Mid Growth USD Index MLGUEUR MSCI Europe Large Growth USD Index MSVUEUR MSCI Europe Small Value USD Index MMVUEUR MSCI Europe Mid Value USD Index MLVUEUR MSCI Europe Large Value USD Index MXEF000G MSCI EM Growth Index MXEF000V MSCI EM Value Index MGSUEMR MSCI EM Emerging Markets Small Growth USD Index MMGUEMR MSCI EM Emerging Markets Mid Growth USD Index MLGUEMR MSCI EM Emerging Markets Large Growth USD Index MSVUEMR MSCI EM Emerging Markets Small Value USD Index MMVUEMR MSCI EM Emerging Markets Mid Value USD Index MLVUEMR MSCI EM Emerging Markets Large Value USD Index P a g e 49 | 52 Table 11.1.2 – Data Sample Period and Explanation Index Name Data Period (Month/Year) MSCI World Index 12/99-‐12/13 • Standard 12/99-‐12/13 • Standard Growth 12/99-‐12/13 • Standard Value 01/09-‐12/13 • Small-‐Cap Growth 01/09-‐12/13 • Mid-‐Cap Growth 01/09-‐12/13 • Large-‐Cap Growth 01/09-‐12/13 • Small-‐Cap Value 01/09-‐12/13 • Mid-‐Cap Value 01/09-‐12/13 • Large-‐Cap Value Description The MSCI World Index is a free float-‐adjusted market capitalization weighted index that is designed to measure the equity market performance of developed markets. The MSCI World Index consists of the following 23 developed market country indexes: Australia, Austria, Belgium, Canada, Denmark, Finland, France, Germany, Hong Kong, Ireland, Israel, Italy, Japan, Netherlands, New Zealand, Norway, Portugal, Singapore, Spain, Sweden, Switzerland, the United Kingdom, and the United States. MSCI United States Index MSCI Europe Index • • • • • • • • • • • • • • • • • • Standard Standard Growth Standard Value Small-‐Cap Growth Mid-‐Cap Growth Large-‐Cap Growth Small-‐Cap Value Mid-‐Cap Value Large-‐Cap Value 12/99-‐12/13 12/99-‐12/13 12/99-‐12/13 12/99-‐12/13 12/99-‐12/13 12/99-‐12/13 12/99-‐12/13 12/99-‐12/13 12/99-‐12/13 Standard Standard Growth Standard Value Small-‐Cap Growth Mid-‐Cap Growth Large-‐Cap Growth Small-‐Cap Value Mid-‐Cap Value Large-‐Cap Value 12/99-‐12/13 12/99-‐12/13 12/99-‐12/13 12/07-‐12/13 12/07-‐12/13 12/07-‐12/13 12/07-‐12/13 12/07-‐12/13 12/07-‐12/13 The MSCI USA Index is a free float adjusted market capitalization index that is designed to measure large and mid-‐cap US equity market performance. The MSCI USA Index is member of the MSCI Global Equity Indices and represents the US equity portion of the global benchmark MSCI ACWI Index. The MSCI Europe Index is a free float-‐adjusted market capitalization weighted index that is designed to measure the equity market performance of the developed markets in Europe. The MSCI Europe Index consists of the following 15 developed market country indexes: Austria, Belgium, Denmark, Finland, France, Germany, Ireland, Italy, the Netherlands, Norway, Portugal, Spain, Sweden, Switzerland, and the United Kingdom. P a g e 50 | 52 MSCI EM Emerging Markets Index • • • • • • • • • Standard Standard Growth Standard Value Small-‐Cap Growth Mid-‐Cap Growth Large-‐Cap Growth Small-‐Cap Value Mid-‐Cap Value Large-‐Cap Value 12/99-‐12/13 12/99-‐12/13 12/99-‐12/13 01/08-‐12/13 01/08-‐12/13 01/08-‐12/13 01/08-‐12/13 01/08-‐12/13 01/08-‐12/13 The MSCI Emerging Markets Index is a free float-‐adjusted market capitalization index that is designed to measure equity market performance of emerging markets. The MSCI Emerging Markets Index consists of the following 23 emerging market country indexes: Brazil, Chile, China, Colombia, Czech Republic, Egypt, Greece, Hungary, India, Indonesia, Korea, Malaysia, Mexico, Peru, Philippines, Poland, Qatar, Russia, South Africa, Taiwan, Thailand, Turkey and United Arab Emirates. Small-‐Cap Index The MSCI Small Cap Indexes cover all investable small cap securities with a market capitalization below that of the companies in the MSCI Standard Indexes, targeting approximately 14% of each market’s free-‐float adjusted market capitalization. Mid-‐Cap Index The MSCI Mid Cap Indexes cover all investable mid cap securities across the Developed, Emerging and Frontier Markets and target approximately 15% of each market's free-‐float adjusted market capitalization. Large-‐Cap Index The MSCI Standard Indexes cover all investable large and mid-‐cap securities across the Developed, Emerging and Frontier Markets and target approximately 85% of each market's free-‐float adjusted market capitalization. P a g e 51 | 52 Value and Growth Indexes The MSCI Global Value and Growth Indexes cover the full range of MSCI Developed, Emerging and All Country Indexes across large, mid and small cap size segmentations. They are also cover large and mid-‐cap size segments for the MSCI Frontier Markets Indexes. The indexes are constructed using an approach that provides a precise definition of style using eight historical and forward-‐looking fundamental data points for every security. Each security is placed into either the Value or Growth Indexes, or may be partially allocated to both (with no double counting). The objective of this index design is to divide constituents of an underlying MSCI Equity Index into respective value and growth indexes, each targeting 50% of the free float adjusted market capitalization of the underlying market index. P a g e 52 | 52
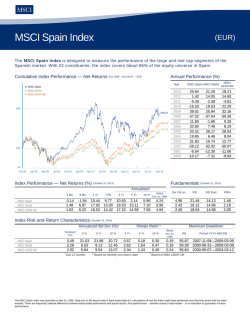

© Copyright 2026