Download Appendix (PDF)
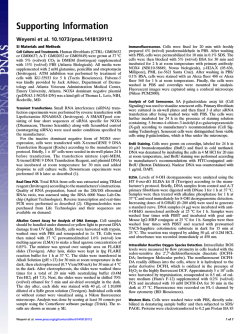
Guenova et al. 2015 Supporting Information (SI Appendix) Guenova et al. (2015) www.pnas.org/cgi/doi/10.1073/pnas.14116922112 IL-4 abrogates TH17 cell-mediated inflammation by selective silencing of IL-23 in antigen-presenting cells Emmanuella Guenova, Yuliya Skabytska, Wolfram Hoetzenecker, Günther Weindl, Karin Sauer, Manuela Tham, Kyu-Won Kim, Ji-Hyeon Park, Ji Hae Seo, Desislava Ignatova, Antonio Cozzio, Mitchell P. Levesque, Thomas Volz, Martin Köberle, Susanne Kaesler, Peter Thomas, Reinhard Mailhammer, Kamran Ghoreschi, Knut Schäkel, Boyko Amarov, Martin Eichner, Martin Schaller, Rachael A. Clark, Martin Röcken, Tilo Biedermann Supplementary Materials and Methods Supplementary References Supplementary Figures Fig. S1. High concentration of IL-13 abrogate IL-23 secretion by DC. Fig. S2. IL-4, but not IL-5 abrogate IL-23 secretion by DC. Fig. S3. IL-4 abrogates the TH17 cell-maintaining capacity of human DC. Fig. S4. IL-23 rescues the TH17 cell-maintaining capacity of human IL-4-DC. Fig. S5. IL-4-induced immune suppression does not depend on reduction of IL-12 or IFN-. Fig. S6. IL-4 induced suppression of cutaneous inflammation in vivo in a model of DTHR is not IL-6 dependent. Fig. S7. Lineage reconstitution in bone marrow (BM) chimeric mice. Fig. S8. Engraftment efficiency in control bone marrow chimeric mice. Fig. S9. IL-4 abrogates in vitro the TH17 cell-inducing capacity of mouse DC. Fig. S10. IL-4 mediated suppression of IL-23 is paralleled by IL-17 reduction in DTHR in wild type but not ATF3ko mice. Fig. S11. IL-23 and IL-17 are selectively elevated in psoriatic skin lesions. Fig. S12. IL-23 and IL-17 are selectively elevated in psoriatic skin lesions. Colorblind-friendly, false colors. Fig. S13. Absence of IL-23 and Th17 cells in healthy skin. Fig. S14. Absence of IL-23 and Th17 cells in healthy skin. Colorblind-friendly, false colors. Fig. S15. IL-4 therapy of psoriasis abrogates intralesional IL-23 and IL-17. Colorblind-friendly, false colors. 1 Guenova et al. (2015) www.pnas.org/cgi/doi/10.1073/pnas.14116922112 The detection limits of these ELISAs were as follows: 3.9 pg/ml (IL-12p70); 31.2 pg/ml (IL-12p40); 15 pg/ml (IL23). T cell cytokines from supernatants were analyzed using the IL-17 ELISA Ready-SET-Go Kit from eBioscience, Inc (detection limit 4 pg/ml), the IL-22 ELISA Kit from BenderMed Systems Diagnostics (detection limit: 15.6 pg/ml), an IL-4 ELISA Set from RnD Systems Inc. (detection limit: 31.2 pg/ml), and an IFN-γ BD OptEIA ELISA Set from BD Biosciences (detection limit: 31.2 pg/ml), according to the manufacturer’s instructions. Supplementary Materials and Methods Reagents and cells. Peripheral blood mononuclear cells (PBMCs) were obtained from leukapheresis products of healthy volunteers and provided by the University of Tübingen blood bank. After Ficoll/Paque density gradient separation (Biochrom, Berlin, Germany), DCs, as well as + CD4 , IL-17 secreting, and untouched naïve + CD4 CD45RO T cells, were isolated using BDCA-1 (CD1c) and BDCA-3 (CD141) dendritic cell isolation kits, as well as human CD4+ T cell isolation kit, IL-17 secretion assay – cell enrichment and detection kit, and a human naïve T cell isolation kit (Miltenyi Biotec, Bergisch Gladbach, Germany), according to manufacturer’s instructions. The 6-sulfo LacNAcexpressing dendritic cells (slanDC) were isolated as previously described (1). Dendritic cells were cultured in X-VIVO 15 culture medium (BioWhittaker, Walkersville, Maryland, USA) supplemented with 1% autologous human plasma. IL-4 and LPS were obtained from RnD Systems, Inc. (Minneapolis, MN, USA) and Alexis Biochemicals (San Diego, CA, USA), respectively, and were both used at a concentration of 100ng/ml, unless otherwise specified. IL-13, IL-1and IL-6 were purchased from Peprotech, London, UK. For T cell priming, LPS-stimulated dendritic cells were harvested, thoroughly washed, and co-cultured with autologous naïve T cells in the presence of 500 pg/ml of staphylococcal enterotoxin B (Sigma Aldrich, SL Louis, MO, USA) in X-VIVO 15 supplemented with 5% autologous human heat-inactivated plasma. Supplementation with 10 U/ml of hIL-2 (Chiron GmbH, Munich, Germany) was carried out on days 5, 7, 9, and 11. Following 12 days of culture, T cells were stimulated with 2 µg/ml of immobilized anti-CD3 mAb and 1 µg/ml of soluble anti-CD28 mAb (both a kind gift from G. Jung, Tuebingen, Germany) or with 50 ng/mL phorbol 12-myristate 13-acetate (PMA; Sigma-Aldrich) and 750 ng/mL ionomycin (Life Technologies) for cytokine analysis, and the supernatants were harvested after 48 hours. Flow cytometry. Cell surface staining of DCs and T cells was performed using FITC‑, PE-, PerCP-, or APCconjugated mouse monoclonal antibodies (mAbs) against CD4, CD14, CD11c, MHC II (HLA-DR), and CD86 (Caltag/Invitrogen Corporation, CA, USA), CD83 (Beckman Coulter Inc., Fullerton, CA, USA), BDCA-1 (CD1c) and BDCA-3 (CD141) (MiltenyiBiotec), and CD3 (BD Biosciences). Appropriate IgGmAbs served as the isotype control. The results were acquired using a ® FACSCalibur equipped with CellQuestPro Software or FACSCanto and LRSII equipped with FACSDiva ® Software , all from BD Biosciences. The analysis was performed with FCS 3 Express Research Edition software (De Novo Software, Los Angeles, CA, USA). Intracellular FACS-Analysis of T cell cytokine production was performed on day 12 of the co-culture, after 6 hours of stimulation with PMA (50 ng/ml; Sigma-Aldrich) and ionomycin (1 µg/ml; Sigma-Aldrich) and in the presence of Brefeldin A (10 µg/ml; Sigma-Aldrich) for the last 4 hours, the cells were fixed with 2% paraformaldehyde, permeabilized with 0.1% saponin (Sigma-Aldrich), and labeled with PE-, APC-, or FITC-conjugated mAbs against IL-4 (APC), IL-2 (PE), and IFN-γ (FITC) (BD Biosciences) or IL-17 (PE) (eBioscience) for 30 minutes at room temperature. Antihuman/mouse phospho-STAT6 (Y641) from eBioscience (Clone: CHI2S4N) was used following a two-step fixation/methanol protocol recommended from the manufacturer. Appropriate mouse and rat IgGmAbs served as isotype controls. Murine DC generation and stimulation. mBMDC were isolated as previously described (2). The cell culture medium (R10) was RPMI 1640 supplemented with 10% heat-inactivated FCS, penicillin (100 U/ml), streptomycin (100 µg/ml), l-glutamine (2 mM), 2-mercaptoethanol (50 µM), and 200 U/ml rmGM-CSF (RnD Systems, Inc.). Bone marrow cells of 8- to 12-wk-old female C57BL/6 mice were obtained by flushing the marrow with PBS. The cells were washed twice with PBS and seeded at a 5 density of 2x10 cells/ml in 100 mm Petri dishes (BD Falcon; BD Biosciences) in 10 ml R10 medium supplemented with GM-CSF. At d7, cells were collected, 6 washed with PBS, and seeded at 2x10 cells/ml in 24well plates (Greiner bio-one, Frickenhausen, Germany) at a volume of 1 ml/well in R10 medium. The DCs were stimulated with 100 ng/ml LPS from S. minnesota R595 (Sigma Aldrich) in the presence or absence of rmIL-4 (PromoCell GmbH, Germany) for 24 h. Supernatants were collected and examined for cytokine production by ELISA. RNA isolation and quantitative RT-PCR. Total RNA was isolated from the cryopreserved skin biopsies, as described previously(3). For RT-PCR analysis, dendritic cells were rapidly collected and flash-frozen in liquid nitrogen. Total RNA from shock-frozen samples was ® isolated using NucleoSpin RNA II (Macherey-Nagel GmbH & Co. KG, Düren, Germany), according to the manufacturer's instructions. UV spectroscopy was used to assess the RNA concentration and purity (Bio Photometer, Eppendorf AG, Hamburg, Germany). The absorbance of a diluted RNA sample was measured at 260 and 280 nm. cDNA synthesis was performed using SuperScript® III First-Strand Synthesis SuperMix (Invitrogen Corporation), following the manufacturer's instructions. Quantitative RT-PCR (QRT-PCR). For relative quantification by RT-PCR, 20 ng of each cDNA was analyzed in a LightCycler® 480 Real Time PCR System plus using FastStart DNA Master SYBR Green I kit (Roche Diagnostics, Mannheim, Germany). A standard curve was developed for each primer pair. Annealing temperatures and elongation times were optimized for primer generation and exclusion of artifacts. The sequences of the primer pairs used are as follows: Enzyme-linked immunosorbent assay (ELISA). IL12p70, IL-12p40 and IL-23 production by dendritic cells was measured by ELISA using matched Ab pairs (IL12p70 and IL-12p40) and IL-23 (p19/p40) ELISA Kit Ready-SET-Go from eBioscience, Inc (San Diego, CA, USA),according to the manufacturer's recommendations. 2 Guenova et al. (2015) www.pnas.org/cgi/doi/10.1073/pnas.14116922112 dilution of Cy3-donkey anti-mouse and Cy5-donkey antirabbit antibodies, as well as Cy3-donkey anti-rabbit and Cy5-donkey anti-mouse antibodies, all from Dianova, for 1 h. Cell nuclei were stained with YO-PRO (Molecular ® Probes , Invitrogen Corporation, Carlsbad, CA, USA). The sections were mounted with Mowiol (Carl Roth GmbH + Co. KG, Karlsruhe, Germany) and analyzed by confocal laser scanning microscopy (Leica TCS SP, Leica Microsystems, Bensheim, Germany). Human: G6PD 5′‑ATCGACCACTACCTGGGCAA‑3′ & 5′‑TTCTGCATCACGTCCCGG‑3′; IL23A 5′‑TTCCCCATATCCAGTGTGGAG‑3′ & 5′‑CAGGGAGCAGAGAAGGCTC‑3′; IL12A 5′‑AGCCTCCTCCTTGTGGCTA‑3′ & 5′‑TGTGCTGGTTTTATCTTTTGTG‑3′; IL12B 5′‑CATGGTGGATGCCGTTCA‑3′& 5′‑ACCTCCACCTGCCGAGAAT‑3′; IL17A 5′‑AACCGATCCACCTCACCTT‑3′ & 5′‑GGCACTTTGCCTCCCAGAT‑3′; IL22 5′‑GCAGGCTTGACAAGTCCAACT‑3′ & 5′‑GCCTCCTTAGCCAGCATGAA‑3′; ATF3 5′‑AAGAGGCGACGAGAAAGAAA‑3′ & 5′‑TGGAGTCCTCCCATTCTGAG‑3′; TNCB-induced DTHR. Eight- to twelve-week-old female C57BL/6 mice (Charles River, Sulzfeld, Germany) or −/− Atf3 mice (provided from Tsonwin Hai, Department of Molecular and Cellular Biochemistry, Neurobiotechnology Center, The Ohio State University, Columbus, Ohio, USA) were sensitized on their shaved abdomens with 7% TNCB (Sigma-Aldrich) in acetone/olive oil (4:1) and were challenged with 1% TNCB (20 µl) on both sides of one ear after 7 days. During the challenge with 1% TNCB, mice received intraperitoneal injections with 100 µl PBS or 0.3 µg/100 µl IL-4 and/or 0.175 µg/100 µl IL-23, every 3 hours over 24 hours. Where indicated, 20 µg of IL-6 were administered intraperitoneal prior to challenge. Specific ear swelling was determined by measuring the ear thickness with a micrometer (Oditest®, Kroeplin, Germany) before and 24 h after the TNCB challenge. For rechallenge experiments the other ear was challenged 7 days after the first challenge. Nonspecific swelling, determined in non-sensitized animals, was always subtracted from the results. Mouse: mATF3 5′–CTAGAATCCCAGCAGCCAAG–3′ & 5′–GAGGCCAGCTAGGTCATCTG–3′; mIL12A 5′–CCATCAGCAGATCATTCTAGACAA–3′ & 5′–CGCCATTATGATTCAGAGACTG–3′; mIL12B 5′–CAGTACACCTGCCACAAAGGAGGC–3′ & 5′–GTCCAGTGTGACCTTCTCTGCAGAC-3′; mIL23A 5′–AATAATGTGCCCCGTATCCA–3′; & 5′–CTGGAGGAGTTGGCTGAGTC–3′; mIL17A 5′–TTCAGGGTCGAGAAGATGCT–3′ & 5′–AAACGTGGGGGTTTCTTAGG–3′; mG6PD 5′–TGAAGCAGTCACCAAGAACA–3′ & 5′–TGGTCCTCACGGAAAAGAGA–3′; mIFNG 5′–AACGCTACACACTGCATCT–3′ & 5′–GAGCTCATTGAATGCTTGG–3′; -/- -/- -/- Reconstitution experiments. Tcrb Tcrd (Tc ) mice, -/+ STAT6 mice and CD45.2 C57BL/6 mice were purchased from the Jackson Laboratory (Bar Harbor, -/Maine 04609 USA). MHCII mice were a gift from Ludger Klein, Institute of Immunology, Ludwig Maximillian University, Munich, Germany. Recipient mice were 6 lethally irradiated at 7.0 Gy and bone marrow cells (10 cells per recipient) of donor mice were intravenously injected into recipient mice. Donor hematopoietic cells + were either bone marrow cells from CD45.1 mice, a 1:1 -/-/mixture of bone marrow cells from STAT6 and Tc -/-/and MHCII mice. To mice, or a 1:1 mixture of STAT6 confirm the chimerism of mice, flow cytometry was made + + for analysis of CD45.2 (recipient mice) and CD45.1 (donor mice). TNCB sensitization experiments were performed eight weeks after irradiation. The fold difference in gene expression was normalized to the housekeeping gene G6PD, as detailed preliminary investigations using different housekeeping genes (ALDOA, B2M, G6PD, GAPDH, HMBS, POLR2A, SDHA, TBP, UBC, and YWHAZ) indicated that G6PD shows the most consistent level of expression in our experimental setting. Western blot. Human APC were incubated with 100ng/ml IL-4 or with 50, 100 and 200ng/ml IL-13. Cells were washed with ice-cold PBS before lysates were separated by SDS-PAGE and blotted onto polyvinylidenefluoride membranes. phospho-STAT6 (Tyr641) was detected with rabbit pAb (dilution 1:1,000; Cell Signaling Technology). Immunoblots were visualized by incubation with horseradish peroxidase– conjugated goat anti–rabbit IgG (dilution 1:2,000; Cell Signaling Technology) followed by enhanced chemiluminescence (GE Healthcare). Subjects and study design. Patients with at least a 1year history of psoriasis were eligible for an open-label, serial dose-escalation study with rhuIL-4 (ScheringPlough Research Institute, Kenilworth, NJ) and were divided into 5 groups of 4 or 5 patients each. The study design was previously published (3). Briefly, 5 groups of 4 patients were administered increasing doses of IL-4 (0.05, 0.1, 0.2, 0.3 and 0.5 µg/kg; 3 times daily; 5 days a week) subcutaneously. For all groups except the last group, the next highest dose was then continued until week 6. The psoriasis area severity index (PASI) was scored at weeks 0, 3, 6, and 12, and the data for 22 patients were available at week 6 (2 drop-outs). Skin biopsies obtained from an indicator plaque, which was distant from the injection site, were either formalin-fixed or snap-frozen. The current analysis is based on 19 patients because the cDNA from one patient was degraded and could not be included in this study. The ethics committees of the Medical School of Ludwig Maximilian University of Munich and of Eberhard Karls University of Tuebingen approved the studies. Histology and triple color immunofluorescence. For histological analysis, paraffin-embedded sections were stained with hematoxilin and eosin. For immunofluorescence analysis, sections were deparaffinized and subjected to either heat-induced epitope retrieval using a pressure cooker and sodium citrate buffer (10 mM, pH 6.0), or to enzymatic epitope retrieval using proteinase K (Dianova, Hamburg, Germany). The deparaffinized sections were incubated with mouse anti-IL-17 (dilution 1:50; RnD Systems, Inc.) ® and rabbit anti-CD3 (Histoprime ready-to-use, LinarisBiologischeProdukte GmbH, Wertheim-Bettingen, Germany), as well as rabbit anti-IL-23p19 (dilution 1:250; Abcamplc, Cambridge, UK) and mouse anti-MHC II (dilution 1:50; AXXORA DEUTSCHLAND GmbH, Lörrach, Germany) antibodies for 1 h. The primary antibodies were visualized by incubation with a 1:500 3 Guenova et al. (2015) www.pnas.org/cgi/doi/10.1073/pnas.14116922112 Supplementary References Statistical analyses. A standard two-sample Student’s t-test was used to compare the mean scores of two different patient groups/experimental conditions. The data were previously tested for the normal distribution (Shapiro-Wilk test) and the homogeneity of variance. A one-way between-group analysis of variance (ANOVA) and linear regression was used for the statistical analysis of the differences between three or more groups. P-values ≤0.05 (*) were considered to be significant, and P-values ≤0.01 (**) were considered to be highly significant. 1. 2. 3. 4. 4 Schäkel K, et al. (2002) 6-Sulfo LacNAc, a novel carbohydrate modification of PSGL-1, defines an inflammatory type of human dendritic cells. Immunity 17(3):289-301. Hoetzenecker W, et al. (2012) ROS-induced ATF3 causes susceptibility to secondary infections during sepsis-associated immunosuppression. Nature medicine 18(1):128-134. Ghoreschi K, et al. (2003) Interleukin-4 therapy of psoriasis induces Th2 responses and improves human autoimmune disease. Nature medicine 9(1):40-46. Veldhoen M, Hirota K, Christensen J, O'Garra A, & Stockinger B (2009) Natural agonists for aryl hydrocarbon receptor in culture medium are essential for optimal differentiation of Th17 T cells. J Exp Med 206(1):43-49. Guenova et al. (2015) www.pnas.org/cgi/doi/10.1073/pnas.14116922112 Supplementary Figures Fig. S1. High concentration of IL-13 abrogate IL-23 secretion by DC. (A) Human DC were incubated with 100ng/ml IL-4 or 50200ng/ml IL-13 for either 30 or 120 min. Phosphorylation of STAT6 was analyzed by western blot. (B) Human DC were preincubated with 10ng/ml IL-4 or 10-1000ng/ml IL-13 and then stimulated with LPS for 24 hours. IL-23 levels in culture supernatants were determined by ELISA. (C) Mouse BMDC were incubated with 200ng/ml IL-4 or IL-13 for 30 min and phosphorylation of STAT6 was analyzed by flow cytometry. (D) Mouse BMDC were pre-incubated with 200ng/ml IL-4 or 200ng/ml IL-13 and then stimulated with LPS for 24h. IL-23 levels in the supernatants were determined by ELISA. Data are expressed as means +/- SD of triplicates. 5 Guenova et al. (2015) www.pnas.org/cgi/doi/10.1073/pnas.14116922112 wt Fig. S2. IL-4, but not IL-5 abrogate IL-23 secretion by DC. (A) Mouse BMDC from C57BL/6 mice were pre-incubated with IL-5 and then stimulated with LPS. IL-23 levels in culture supernatants were determined by ELISA. (B) Mouse BMDC wt from C57BL6 mice were pre-incubated with IL-4 or IL-13 alone or in combination with IL-23 and then stimulated with LPS. A bead-based multiplexing technology was used for cytokine analysis of the culture supernatants. The data represent at least three independent experiments, and the results are expressed as means ± SD. n.s. - not significant. 6 Guenova et al. (2015) www.pnas.org/cgi/doi/10.1073/pnas.14116922112 Fig. S3. IL-4 abrogates the TH17 cell-maintaining capacity of human DC. Viable IL-17 secreting cells magnetically enriched from human blood via IL-17 secretion assay (purity > 90%) were co-cultured with autologous DC stimulated with LPS in the presence or absence of 100ng/ml IL-4 over 12 days. Upon co-culture, IL-17 secretion was re-analyzed by flow cytometry (A) and by ELISA (B) following re-stimulation with PMA and ionomycin. To study the impact of DC-derived IL-23 on the maintenance of TH17 cells, 20ng/ml IL-23 were added as indicated. The results are expressed as means ± SD, and represent two independent experiments. 7 Guenova et al. (2015) www.pnas.org/cgi/doi/10.1073/pnas.14116922112 Fig. S4. IL-23 rescues the TH17 cell-maintaining capacity of human IL-4-DC. Human DC stimulated with LPS in the presence or absence of 100ng/ml IL-4 and control DC were co-cultured with autologous CD4+ T cells over 12 days. Upon re-stimulation with PMA and ionomycin, IL-17 secretion was determined by flow cytometry (A) and ELISA (B). To study the contribution of DC cytokines to the differentiation and/or maintenance of TH17 cells, 10ng/ml IL-4, 20ng/ml IL-6, 10ng/ml IL-1 and/or 20ng/ml IL-23 were added as indicated. The cytokine concentrations were adapted from a protocol published by Veldhoen et al (4). The results are expressed as means ± SD, and the data shown represent independent experiments from three different donors. 8 Guenova et al. (2015) www.pnas.org/cgi/doi/10.1073/pnas.14116922112 Fig. S5. IL-4-induced immune suppression does not depend on reduction of IL-12 or IFN-. Expression of transcripts encoding IL12A (A), IL12B (B), and IFN- (C) in DTHR ear samples in sensitized C57BL/6 mice, treated intraperitoneally with either PBS or IL4 during TNCB-challenge. The data represent at least three independent experiments expressed as means ± SD. n.d. – not detected. 9 Guenova et al. (2015) www.pnas.org/cgi/doi/10.1073/pnas.14116922112 Fig. S6. IL-4 induced suppression of cutaneous inflammation in vivo in a model of DTHR is not IL-6 dependent. (A) Time course of the ear swelling after TNCB-challenge in sensitized C57BL/6 mice, treated intraperitoneally with IL-4, IL-6 or a combination of both during challenge. (B) Ear swelling 48 hours after re-challenge with TNCB of mice treated as described in (A). The results are expressed as means ± SD. 10 Guenova et al. (2015) www.pnas.org/cgi/doi/10.1073/pnas.14116922112 Fig. S7. Lineage reconstitution in bone marrow (BM) chimeric mice. Flow cytometry on splenocytes from BM-chimeric + mice 8 weeks after transplantation. Representative dot plots from control CD45.1 -BM chimeric mice on wild type nonko ko ko ko hematopoietic background (A), STAT6 /Tc -BM chimeric mice (B), and STAT6 /MHCII -BM chimeric mice on wild type non-hematopoietic background (C). 11 Guenova et al. (2015) www.pnas.org/cgi/doi/10.1073/pnas.14116922112 + Fig. S8. Engraftment efficiency in control bone marrow chimeric mice. Flow cytometry on splenocytes from control CD45.1 + BM chimeric mice on CD45.2 -wild type non-hematopoietic background. 12 Guenova et al. (2015) www.pnas.org/cgi/doi/10.1073/pnas.14116922112 Fig. S9. IL-4 abrogates in vitro the TH17 cell-inducing capacity of mouse DC. WT or Stat6ko BMDC stimulated with LPS in the presence or absence of 100ng/ml IL-4 or control BMDC were co-cultured with WT or Stat6ko CD4+ T cells in the presence of SEB over 12 days. Afterwards T cells were re-stimulated with PMA and ionomycin for 6 hours in the presence of brefeldin A, or with antiCD3/CD28 for 48h. IL-17 production by CD4+ T cells was determined by flow cytometry (A) or ELISA (B) following re-stimulation. The results are expressed as means +/- SD of triplicates. 13 Guenova et al. (2015) www.pnas.org/cgi/doi/10.1073/pnas.14116922112 Fig. S10. IL-4 mediated suppression of IL-23 is paralleled by IL-17 reduction in DTHR in wild type but not ATF3ko mice. Expression of transcripts encoding IL17 (A) and IFN- (B) in DTHR ear samples 48 hours after challenge with TNCB in sensitized C57BL/6 and ATF3ko mice. Mice were treated intraperitoneally with either PBS or IL-4 during challenge. The data represent at least three independent experiments expressed as means ± SD. n.d. – not detected. 14 Guenova et al. (2015) www.pnas.org/cgi/doi/10.1073/pnas.14116922112 Fig. S11. IL-23 and IL-17 are selectively elevated in psoriatic skin lesions. (A) The expression of transcripts encoding IL23A and IL17A in normal skin from healthy donors (n=8) and from lesional human psoriatic skin (n=19), as detected by quantitative realtime PCR. Each dot represents one specimen; horizontal bars indicate the mean values. The results are expressed relative to the housekeeping gene G6PD. (B and C) Visualization of the co-localization of IL-23 (red) and MHC II (blue) (B) and of IL-17 (red) and CD3 (blue) (C) in human psoriatic skin lesions by immunofluorescent double-staining. The nuclei are stained with YO-PRO. The data represent skin samples from ten different donors. Scale bars = 15 µm. Colorblind-accessible images are shown in Supplementary Fig. 12. 15 Guenova et al. (2015) www.pnas.org/cgi/doi/10.1073/pnas.14116922112 Fig. S12. IL-23 and IL-17 are selectively elevated in psoriatic skin lesions. Colorblind-friendly, false colors. Visualization of co-localized IL-23 (red) and MHC II (green) (A) and of IL-17 (red) and CD3 (green) (B) in human psoriatic skin lesions by immunofluorescence double-staining. Nuclei are stained with YO-PRO. Data represent skin samples from ten different donors. Scale bars = 15 µm. 16 Guenova et al. (2015) www.pnas.org/cgi/doi/10.1073/pnas.14116922112 Fig. S13. Absence of IL-23 and Th17 cells in healthy skin. Visualization of co-localized IL-23 (red) and MHCII (blue) (A) and of IL-17 (red) and CD3 (blue) (B) in healthy human skin. Cell nuclei were stained with YO-PRO. Pictures are representative of experiments performed using skin samples from ten different donors. Scale bars = 15 µm. For color-blind friendly images please refer to Supplementary Fig. 14. 17 Guenova et al. (2015) www.pnas.org/cgi/doi/10.1073/pnas.14116922112 Fig. S14. Absence of IL-23 and Th17 cells in healthy skin. Colorblind-friendly, false colors. Visualization of co-localized IL-23 (red) and MHCII (green) (A) and of IL-17 (red) and CD3 (green) (B) in healthy human skin. Cell nuclei were stained with YO-PRO. Pictures represent experiments performed using skin samples from ten different donors. Scale bars = 15 µm. 18 Guenova et al. (2015) www.pnas.org/cgi/doi/10.1073/pnas.14116922112 Fig. S15. IL-4 therapy of psoriasis abrogates intralesional IL-23 and IL-17. Colorblind-friendly, false colors. Visualization of co-localized IL-23 (red) and MHC II (green) and of IL-17 (red) and CD3 (green) in human psoriatic skin lesions before (A) and after (B) IL-4 therapy. Nuclei are stained with YO-PRO. Data represent 12 different study patients. 19
© Copyright 2026
