
Chemical composition and seasonality of aromatic Mediterranean
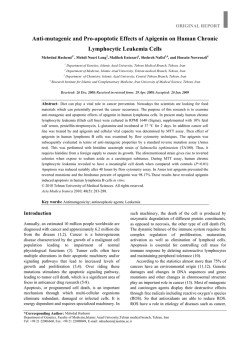
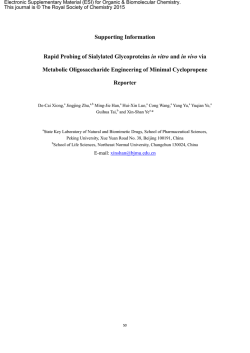
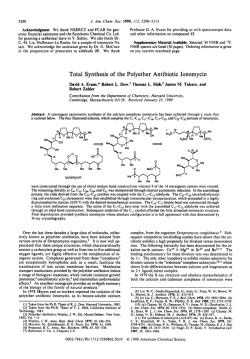
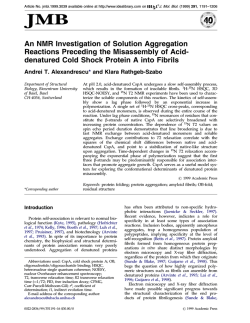
Chemical composition and seasonality of aromatic Mediterranean plant species
by NMR-based metabolomics
Monica Scognamiglio*, Brigida D’Abrosca, Assunta Esposito, and Antonio Fiorentino
Department of Environmental Biological and Pharmaceutical Sciences and Technologies, Second
University of Naples, via Vivaldi 43, I-81100, Caserta, Italy
*
Corresponding author. Tel: +39-0823-274579; Fax: +39-0823-274571; e-mail: [email protected]
1
Abstract
An NMR-based metabolomic approach has been applied to analyse seven aromatic Mediterranean
plant species used in traditional cuisine. Based on the ethnobotanical use of these plants, the
approach has been employed in order to study the metabolic changes during different seasons.
Primary and secondary metabolites have been detected and quantified. Flavonoids (apigenin,
quercetin and kaempferol derivatives) and phenylpropanoid derivatives (e.g. chlorogenic and
rosmarinic acid) are the main identified polyphenols.
The richness in these metabolites could explain the biological properties ascribed to these plant
species.
Keywords: NMR-based metabolomics, Mediterranean plants, Seasonal variation, Metabolites, NMR Spectroscopy
2
Introduction
Aromatic plants are widespread throughout the world and they are extensively added to different
food preparations. The use of these plants is very popular and has a long tradition in Mediterranean
area [1].
Plants in general have been shown to produce a wide range of chemicals, traditionally categorized
into primary and secondary metabolites. For the sake of simplicity, primary metabolites can be
thought to serve nutritional purposes, while secondary metabolites are required by plants as
weapons against competitors, herbivores, or pathogens, etc. [2]. However, both classes of
metabolites are important for the plant itself, but also for their actions on plant consumers and
mainly in case of edible plants.
Many aromatic plants are added to foods and eaten. The whole plants or one or some of their
components are used as e.g. food preservatives, flavour, additives, etc. Nevertheless, it has been
shown that chemical composition of plants is highly variable along the year. Several analytical
techniques are available for studying plant metabolites’ content. Most of them are targeted
techniques as an a priori knowledge on the metabolites to be analysed is required [2, 3].
Furthermore, for aromatic plants a great effort has been devoted to the study of essential oils [2, 4].
Given this background, a wider knowledge about their whole metabolite content is needed. To this
end, a very powerful approach is metabolomics, the comprehensive analysis of the set of low
molecular weight compounds of a biological system under a given condition [5]. Analogously,
other related approaches, like metabolic profiling [6], could be used.
In particular, NMR based metabolomics has been shown to be very useful due to its untargeted and
unbiased features [7]. Furthermore, it is highly reproducible, it allows the contemporary
identification and quantification of a large number of compounds, and needs short times of analysis
(including the extraction procedures) [6]. The only limitation of NMR is its low sensitivity when
compared to mass spectrometry, although sensitivity has been drastically increased with recent
advances like higher magnetic fields and the introduction of microcryoprobes [5, 8]. On the other
3
hand, NMR allows the identification of unknown compounds in the analysed mixtures, as it gives
important structural information [8].
In order to demonstrate the potentiality of this approach, it has been applied to seven aromatic plant
species characteristic of Mediterranean garrigue: the metabolites’ content of these plants has been
determined and the seasonality of their accumulation has been studied.
Materials and Methods
Plant material sampling and processing
Seven plant species (Table 1) were collected in a garrigue on the calcareous hills of Durazzano,
(41º3’N, 14º27’E; southern Italy) in winter (February 2012), spring (May 2012), summer (July
2012) and autumn (October 2012). The plants were selected based on their occurrence in the study
site. Origanum vulgare samples were not available in autumn. Plant leaf samples were collected in
the field always at the same moment of the day, in order to minimize differences due to metabolites
changing based on circadian clock.
Three leaf samples (biological replicates) of each plant species were harvested and immediately
frozen in liquid N2 in order to avoid unwanted enzymatic reactions and stored at -80 °C up to the
freeze drying process. Once freeze dried they were powdered in liquid nitrogen and stored at -20
°C. Each sample was extracted and analysed by NMR.
Voucher specimens for all the plant species were deposited at the herbarium of the Second
University of Naples (Table 1).
Metabolomics analysis
Freeze-dried plant material (50 mg) was transferred to a 2 mL microtube. NMR samples were
prepared in a mixture of phosphate buffer (Fluka Chemika; 90 mM; pH 6.0) in D 2O (Cambridge
Isotope Laboratories) containing 0.1% w/w trimethylsilylpropionic-2,2,3,3-d4 acid sodium salt
(TMSP, Sigma-Aldrich) and methanol-d4 (Sigma-Aldrich). A volume of 1.5 mL of phosphate
4
buffer and methanol-d4 (1:1) was added to the plant samples. The mixture was vortexed at room
temperature for 1 min, ultrasonicated (Elma® Transonic Digitals) for 40 min, and centrifuged
(Beckman AllegraTM 64R) at 13000 rpm for 10 min. An aliquot of 0.6 mL was transferred to an
NMR tube and analysed by NMR [17]. NMR spectra were recorded at 25 °C on a 300.03 MHz for
1
H and 75.45 MHz for
13
C on a Varian Mercury Plus 300 Fourier transform NMR. CD3OD was
used as the internal lock. Each 1H NMR spectrum consisted of 256 scans with the following
parameters: 0.16 Hz/point, acquisition time (AQ) = 1.0 s, relaxation delay (RD) = 1.5 s, 90° pulse
width (PW) = 13.8 μs. A presaturation sequence was used to suppress the residual H2O signal. Free
induction decays (FIDs) were Fourier transformed with LB = 0.3 Hz and the resulting spectra were
manually phased and baseline-corrected and calibrated to TMSP at 0.0 ppm, using 1H NMR
processor (MestReNova, version 8.0.2).
Quantitative analysis
The main metabolites identified in plant extracts were analyzed by quantitative analysis.
1H
-NMR
spectra were bucketed, reducing it to integral segments with a width of 0.02 ppm with ACDLABS
12.0 1H NMR processor (ACDLABS 12.0, Toronto, Canada). Spectra were scaled to the internal
standard (whose area, from -0.01 to 0.01 ppm, was set equal to 1). For each metabolite, buckets
corresponding to non-overlapping signals were used to calculate the relative amount, as follows:
𝑀𝑒𝑡𝑎𝑏𝑜𝑙𝑖𝑡𝑒 𝑟𝑒𝑙𝑎𝑡𝑖𝑣𝑒 𝑎𝑚𝑜𝑢𝑛𝑡 =
𝑆𝐴 × 𝑛𝐻𝑇𝑀𝑆𝑃
𝑛𝑆
where SA is the metabolite signal area, but it is also equal to the signal area/standard area ratio, as
standard area is equal to 1; nHTMSP is a constant equal to 9 (the number of protons responsible for
the signal between -0.01 and 0.01 ppm) and ns is the number of protons of the metabolite signal area
[23].
5
Results and discussion
Recent research has shown culinary herbs and spices as a source of bioactive compounds [18].
Although most of them have been extensively studied for their essential oil composition, far less
information is available on their polar and semi-polar chemical composition.
Herewith, seven Mediterranean plants (Calamintha nepeta, Helichrysum italicum, Foeniculum
vulgare, Micromeria graeca, Origanum vulgare, Satureja montana and Thymus longicaulis) have
been studied for their metabolite content by NMR. The identification of metabolites was carried out
by comparing NMR data with an in-house library, with databases [19] and with some literature data
[20-23]. 1H-NMR data and extract composition are given in table 2 and spectra are shown in figure
1.
Primary metabolites were easily identified based on data extensively reported in literature of spectra
acquired in the same solvent mixture [19-23]. Among free amino acids, alanine was observed in all
of the plants, while threonine was only detected in Micromeria graeca and Foeniculum vulgare.
The sugar content was highly variable, with glucose and sucrose as the main free carbohydrates
detected.
Finally, some organic acids were identified. Quinic acid was present in all of the plants but
Helichrysum italicum and Satureja montana, while malic acid was clearly detected in all of the
plants.
Concerning the secondary metabolite content, the analysed Lamiaceae plants were all characterized
by the presence of high amounts of rosmarinic acid (with the exception of C. nepeta), along with
analogous compounds. Caffeic acid was identified based on comparison of NMR data with the
literature [22-23] and confirmed by comparison with NMR spectra of an in-house library.
Rosmarinic acid was identified based on the comparison with already reported data [23] and the
structure was confirmed by 2D NMR analysis. Indeed, the olefinic proton at δ 7.50 (H7) (showing
HSQC correlation with the carbon at δ 145.9) and that at δ 6.30 (showing HSQC correlation with
the carbon at δ 114.3) showed long-range correlations with a carbon at δ 168.4 (C9). This carbon
6
was in turn correlated with the proton at δ 5.02 (H8’), confirming the linkage between a ceffeoyl
moiety and the 3,4-dihydroxyphenyl lactic acid moiety. Furthermore, the former was identified
based on the long range correlation of the H7 olefinic proton with the aromatic carbon at δ 126.4
(C1), showing further correlations with the signals belonging to an ortho/para trisubstituted
aromatic ring (Table 2). The latter, was identified as follows: the proton H8’ showed correlations
with a carboxylic carbon at δ 176.5 and with a methylene carbon at δ 36.9 (C7’), showing HSQC
correlations with the diasterotopic protons H7’ (Table 2). The proton H8’ also showed long range
correlation with a quaternary aromatic carbon at δ 130.0 (C1’), in turn correlated with the signals
belonging to a second ortho/para trisubstituted aromatic ring (Table 2).
Some phenylpropanoids in the extracts were not definitively characterized, inasmuch as, based on
their scarce abundance and/or strong signal overlapping, they did not show clear correlations in 2D
NMR spectra. However, the characteristic signals and correlations of the trans-propenylic chain
suggested their presence. Indeed, correlations were observed in the HSQC, among the olefinic
signals with carbons at 140-145 ppm (for the proton at lower fields) and at 114-120 ppm (for the
proton at higher fields) and long range correlations were shown with carbon resonances attributable
to estereal carboxyl carbons and with quaternary aromatic carbons.
Calamintha nepeta extracts were also rich in several flavonoids and phenylpropanoids.
Unfortunately, it was not possible to definitely characterize these compounds, but all of the
flavonoids were identified as apigenin derivatives (Table 2). Indeed, several sets of resonances
attributable to meta coupled protons H7/H8 (ring A), to proton H3 and to B ring ortho coupled
protons were detected. Interestingly, the compounds, probably characterized by a different degree
of glycosylation, showed a peculiar distribution along the seasons. Two apigenin derivatives were
detected in spring and autumn (apigenin derivatives 1 and 2), while two different couples of these
compounds were detected in summer (apigenin derivatives 3 and 4) and winter (apigenin
derivatives 5 and 6) samples. Moreover, apigenin derivatives 5 and 6, were detected only in winter
also in Satureja montana.
7
Analogously, as shown in table 2, the presence of some phenylpropanoids was strongly dependent
on the collection season (Table 2): phenylpropanoid 2 was detected only in winter, phenylpropanoid
5 only in spring, phenylpropanoid 6 only in summer and phenylpropanoid 7 only in autumn
samples.
The most stable metabolome along the seasons was detected for Thymus longicaulis while
Micromeria graeca and Origanum vulgare only changed for some metabolites. However,
differences in the amounts of the compounds were observed. Indeed, for all the Lamiaceae plants, a
higher amount of aromatic compounds (Table 2) was observed in spring and summer samples
compared to autumn and winter samples. Helichrysum italicum and Foeniculum vulgare extracts
showed an analogous behaviour, with changes of metabolites mainly on the quantitative point of
view.
Helichrysum italicum extracts, besides chlorogenic acids, also showed signals attributable to a 3hydroxybenzofurane and an isobenzofuranone derivative. Chlorogenic, neochlorogenic and
dicaffeoyquinic acids were identified based on comparison of 1H-NMR data with the literature [2223] and with the in-house library. The caffeoyl moiety was clearly identified based on 1D and 2D
NMR data and the linkage(s) with the quinic acid moiety was confirmed by the correlation observed
in the long range spectrum. The 3-hydroxybenzofurane and an isobenzofuranone derivatives were
identified based on comparison with the NMR spectrum of the compound previously isolated [11].
Finally, Foeniculum vulgare was characterized by chlorogenic acids and flavonoids, identified,
based on 1H-NMR data as kaempferol and quercetin [24]. Chlorogenic acid was reported for the
first time from this species, to the best of our knowledge.
The identification of water soluble compounds in these plants is very important as most of them are
added to dishes, hence they might be eaten or however they could release bioactive compounds into
food. In this framework, it is worth to underline that first of all the health promoting capacity of
bioactive compounds could be dependent on synergisms. Secondly, these plants could also contain
potential toxic compounds, as reported for several Lamiaceae [24]. Nevertheless, the role in
8
nutrition of primary metabolites is often disregarded [25]. These considerations raise the attention to
the need for a comprehensive profiling of their metabolites.
Furthermore, the NMR based metabolomic approach here proposed, due to the short time of
analyses and to lower costs compared to other analytical methods, was very useful for the study of
seasonal variation of metabolites.
Indeed, although it is clear that secondary metabolites show peculiar trends, only fragmentary
information is available, mainly because of the used approaches.
The most common and easiest procedure was to perform the phytochemical study on samples
collected in a specific time of the year and then compare the other months (or seasons) by setting up
a series of target analyses, often by HPLC [26, 27] or by less time and resource consuming
approaches based on colorimetric assays [28].
The improvement of analytical methods, and especially the availability of a high-throughput
approach like metabolomics [5], gives the chance to further explore the issue of seasonality [29],
and to thoroughly study these changes.
Concerning the metabolites identified within the extracts, it is important to underline their
biological activity.
Phenols are well known for their antioxidant activity [18]. As the studied plants are all very rich in
phenolics, they have a great antioxidant potential. This could also explain the use of some of these
herbs as natural food preservatives (Table 1).
Among the detected compounds, rosmarinic acid is the most widespread and the most abundant. A
plethora of biological activities has been attributed to this compound, among them: adstringent,
antioxidative, antiinflammatory, antimutagen, antibacterial and antiviral [30].
Many other phenylpropanoids and flavonoids were also detected. Several properties have been
reported for these compounds, such as antiinflammatory, antimicrobial, and antitumor activity [31].
The richness in these compounds of the studied plants supports their traditional uses.
9
However, the study evidenced that qualitative and quantitative variations of metabolites are
observed along the year.
This is, to the best of our knowledge, the first report of metabolite content and seasonal qualitative
and quantitative variation of this set of food spices. Furthermore, it is evidenced that a higher
content of compounds known for their health-promoting capacities can be found in spring and
summer samples of all the analysed species, although season-specific compounds were also
detected.
Conclusions
NMR-based metabolomics has been applied to the study of chemical composition of selected
aromatic plants of Mediterranean vegetation.
The method allowed to determine the chemical composition of plant extracts in terms of primary
and secondary metabolites. The abundance of aromatic secondary metabolites suggested that the
traditional uses of these plants might be supported by their chemical composition.
Furthermore, the seasonality of the accumulation of these metabolites was studied.
Conflict of interest
The authors declare that there is no conflict of interests regarding the publication of this article.
Acknowledgments
We would like to thank the anonymous reviewers for their valuable suggestions.
10
References
[1] A. M. Scherrer, R. Motti, and C.S. Weckerle. "Traditional plant use in the areas of Monte
Vesole
and
Ascea,
Cilento
National
Park (Campania,
Southern
Italy)."
Journal
of
Ethnopharmacology, 97, pp. 129-143, 2005.
[2] T. Efferth, and H. J. Greten, "Medicinal and aromatic plant research in the 21st century."
Medicinal and Aromatic Plants, 1 pp. e110, 2012.
[3] R. Rodríguez‐Solana, J.M. Salgado, J.M. Domínguez and S. Cortés‐Diéguez, “Comparison of
Soxhlet, Accelerated Solvent and Supercritical Fluid Extraction Techniques for Volatile (GC–MS
and GC/FID) and Phenolic Compounds (HPLC–ESI/MS/MS) from Lamiaceae Species.”
Phytochemical Analysis, DOI 10.1002/pca.2537, 2014.
[4] T. Fornari, G. Vicente, E. Vázquez, M. R. García-Risco and G. Reglero, “Isolation of essential
oil from different plants and herbs by supercritical fluid extraction.” Journal of Chromatography A,
1250, pp. 34-48, 2012.
[5] H.K. Kim, Y.H. Choi and R. Verpoorte, “NMR-based metabolomics: where do we stand, where
do we go?” Trends in Biotechnology, 29, pp. 267-275, 2011.
[6] M. Scognamiglio, B. D’Abrosca, A. Esposito, and A. Fiorentino, “Metabolomics: an unexplored
tool for allelopathy studies.” Journal of Allelochemical Interactions 1, pp. 9-23, 2015.
[7] J.W. Allwood, D.I. Ellis, and R. Goodacre, “Metabolomic technologies and their application to
the study of plants and plant–host interactions.” Physiologia Plantarum, 132, pp. 117-135, 2008.
[8] R.R. Forseth, and F.C. Schroeder, “NMR-spectroscopic analysis of mixtures: from structure to
function.” Current opinion in chemical biology, 15, pp. 38-47, 2011.
[9] G. Tibaldi, E. Fontana, and S.Nicola. "Postharvest management affects spearmint and calamint
essential oils." Journal of the Science of Food and Agriculture, 93, pp. 580-586, 2013.
[10] K. Hammer, G. Laghetti, and K. Pistrick. "Calamintha nepeta (L.) Savi and Micromeria
thymifolia (Scop.) Fritsch cultivated in Italy." Genetic Resources and Crop Evolution, 52, pp. 215219, 2005.
[11] B. D’Abrosca, E. Buommino, G. D’Angelo, L. Coretti, M. Scognamiglio, V. Severino, S.
Pacifico, G. Donnarumma, A. Fiorentino, “Spectroscopic identification and anti-biofilm properties
of polar metabolites from the medicinal plant Helichrysum italicum against Pseudomonas
aeruginosa.” Bioorganic and Medicinal Chemistry, 21, pp. 7038-7046, 2013.
11
[12] G. Appendino, M. Ottino, N. Marquez, F. Bianchi, A. Giana, M. Ballero, O. Sterner, B.L.
Fiebich, and E. Munoz, “Arzanol, an anti-inflammatory and anti-HIV-1 phloroglucinol α-pyrone
from Helichrysum italicum ssp. microphyllum." Journal of Natural Products, 70, pp. 608-6124,
2007.
[13] W.R. Diao, Q.P. Hu, H. Zhang, and J. G. Xu, "Chemical composition, antibacterial activity and
mechanism of action of essential oil from seeds of fennel (Foeniculum vulgare Mill.)." Food
Control, 35, pp. 109-116, 2014.
[14] N. Martins, L. Barros, C. Santos-Buelga, M. Henriques, S. Silva, and I.C. Ferreira,
"Decoction, infusion and hydroalcoholic extract of Origanum vulgare L.: Different performances
regarding bioactivity and phenolic compounds." Food Chemistry, 158, pp. 73-80, 2014.
[15] T. Mihajilov-Krstev, D. Radnović, D. Kitić, V.S. Jovanović, V. Mitić, Z. Stojanović-Radić,
and B. Zlatković, "Chemical composition, antimicrobial, antioxidative and anticholinesterase
activity of Satureja montana L. ssp montana essential oil." Central European Journal of Biology, 9,
pp. 668-677, 2014.
[16] C. Sarikurkcu, C. Cengiz, M. Sabih Ozer, M. Eskici, B. Tepe, Ş. Can, and E. Mete, "Essential
oil composition and antioxidant activity of Thymus longicaulis C. Presl subsp. longicaulis var.
longicaulis." Food and Chemical Toxicology, 48, pp. 1801-1805, 2010.
[17] H.K. Kim, Y.H. Choi, and R. Verpoorte, “NMR-based metabolomic analysis of plants.”
Nature Protocols, 5, pp. 536–549, 2010.
[18] A. Vallverdú-Queralt, J. Regueiro, M. Martínez-Huélamo, J. F. Rinaldi Alvarenga, L.N. Leal,
and R. M. Lamuela-Raventos, "A comprehensive study on the phenolic profile of widely used
culinary herbs and spices: rosemary, thyme, oregano, cinnamon, cumin and bay." Food chemistry,
154, pp. 299-307, 2014.
[19] Q. Cui, I.A. Lewis, A.D. Hegeman, M.E. Anderson, J. Li, C.F. Schulte, W.M. Westler, H.R.
Eghbalnia, M.R. Sussman, and J.L. Markley, “Metabolite identification via the Madison
Metabolomics Consortium Database.” Nature Biotechnoly, 26, pp. 162-164, 2008.
[20] A. Lubbe, H. Gude, R. Verpoorte, and Y.H. Choi, “Seasonal accumulation of major alkaloids
in organs of pharmaceutical crop Narcissus Carlton.” Phytochemistry, 88, pp. 43–53, 2013.
[21] R. Verpoorte, Y.H. Choi, and H.K. Kim,” NMR-based metabolomics at work in
phytochemistry.” Phytochemistry Reviews, 6, pp. 3–14, 2007.
12
[22] J.L. Wolfender, S. Rudaz, Y.H. Choi, and H.K. Kim, “Plant metabolomics: from holistic data
to relevant biomarkers.” Current Medicinal Chemistry, 20, pp. 1056–1090, 2013.
[23] M. Scognamiglio, V. Fiumano, B. D’Abrosca, A. Esposito, Y.H. Choi, R. Verpoorte, and A.
Fiorentino, “Chemical interactions between plants in Mediterranean vegetation: The influence of
selected plant extracts on Aegilops geniculata metabolome.” Phytochemistry DOI:
10.1016/j.phytochem.2014.07.006, 2014.
[24] S. Pacifico, B. D’Abrosca, M. Scognamiglio, G. D’Angelo, M. Gallicchio, S. Galasso, P.
Monaco, and A. Fiorentino "NMR-based metabolic profiling and in vitro antioxidant and
hepatotoxic assessment of partially purified fractions from Golden germander (Teucrium polium L.)
methanolic extract." Food Chemistry, 135, pp. 1957-1967, 2012.
[25] R. Scherer, A. C. P. Rybka, C. A. Ballus, A. D. Meinhart, and H. T. Godoy, "Validation of a
HPLC method for simultaneous determination of main organic acids in fruits and juices." Food
Chemistry 135, pp. 150-154, 2012.
[26] J. Liimatainen, M. Karonen, J. Sinkkonen, M. Helander, and J-P. Salminen, “Phenolic
Compounds of the Inner Bark of Betula pendula: Seasonal and Genetic Variation and Induction by
Wounding.” Journal of Chemical Ecology, 38, pp. 1410–1418, 2012.
[27] K. Hosni, K. Msaada, M.B. Taârit, and B.Marzouk, “Phenological variations of secondary
metabolites from Hypericum triquetrifolium Turra.” Biochemical Systematics and Ecology 39, pp.
43–50, 2011.
[28] F. Brahmi, B. Mechri, S. Dabbou, M. Dhibi, and M. Hammami. “The efficacy of phenolics
compounds with different polarities as antioxidants from olive leaves depending on seasonal
variations.£ Industrial Crops and Products 38, pp. 146–152, 2012.
[29] A. Lubbe, H. Gude, R. Verpoorte, and Y.H. Choi, “Seasonal accumulation of major alkaloids
in organs of pharmaceutical crop Narcissus Carlton.” Phytochemistry 88, pp. 43–53, 2013.
[30] M. Petersen, and Monique SJ Simmonds. "Rosmarinic acid." Phytochemistry, 62, pp. 121-125,
2003.
[31] R. Quirantes-Piné, M. Herranz-López, L. Funes, I. Borrás-Linares, V. Micol, A.SeguraCarretero, and A. Fernández-Gutiérrez, "Phenylpropanoids and their metabolites are the major
compounds responsible for blood-cell protection against oxidative stress after administration of
Lippia citriodora in rats." Phytomedicine 20, pp. 1112-1118, 2013.
13
Table 1: Studied plants
Species and voucher specimen
Family
Uses
Calamintha nepeta L.
Lamiaceae
Leaf used as food spice (usually added to meat, fish and vegetable dishes;
CE236
mint aroma) and for medicinal purposes (antiseptic, tonic, antispasmodic,
diaphoretic, expectorant, etc.) [9, 10]
Helichrysum italicum G. Don
Asteraceae
CE233
Leaf used as food spice (also known as “curry plant”) and for medicinal
purposes (anti-inflammatory and anti-infective, antiallergic, etc.) essential
oils used in cosmetics [11, 12]
Foeniculum vulgare Mill.
Apiaceae
CE237
Micromeria graeca L.
Leaf and fruits used to flavour several kind of dishes. Also used in
cosmetics and pharmaceutical products [13]
Lamiaceae
Leaf used as food spice (added to meat and vegetables)
Lamiaceae
Dried plant (epigeous part) used as food spice. The most common spice in
CE238
Origanum vulgare L.
CE239
Mediterranean cuisine. Used, since ancient times, for medicinal purposes
(antioxidant digestive, expectorant, antiseptic, antispasmodic, etc.) [14]
Satureja montana L.
Lamiaceae
CE234
Leaf used as food spice (usually added to meat, fish and vegetable dishes).
Natural food preservative. Savory honey is a very common ingredient in
folk remedies. Used for medicinal purposes [15]
Thymus longicaulis C. Presl
CE235
Lamiaceae
Leaf used as food spice (usually added to meat, fish and vegetable dishes).
Natural food preservative. Used also for medicinal purposes [16]
14
Table 2: Main metabolites detected in plant extracts. 1H-NMR data are measured in ppm and coupling constants (J) in Hertz. Relative amount is
expressed as the mean value (n=3) ± SD. For some metabolites, the quantitative analysis was not possible due to strongly overlapping signals, hence
Calamintha nepeta
Plant
species
the presence is indicated by “X”
Metabolites
NMR
Wi
Sp
Su
Au
Alanine
1.48 (H3, d J= 7.2)
X
X
X
X
Apigenin derivative 1*
6.51 (H6 d J=2.1); 6.70 (H3 s); 6.78 (H8 d J=2.1); 7.10 (H3’/H5’ d J=8.7); 7.94 (H2’/H6’ d J=8.7)
Apigenin derivative 2*
6.54 (H6 d J=2.1); 6.67 (H3 s); 6.73 (H8 d J=2.1); 7.07 (H3’/H5’ d J=8.7); 7.90 (H2’/H6’ d J=8.7)
Apigenin derivative 3*
6.50 (H6 d J=2.1); 6.66 (H3 s); 6.78 (H8 d J=2.1); 7.02 (H3’/H5’ d J=8.7); 7.88 (H2’/H6’ d J=8.7)
Apigenin derivative 4*
6.49 (H6 d J=2.1); 6.61 (H3 s); 6.69 (H8 d J=2.1); 7.06 (H3’/H5’ d J=8.7); 7.84 (H2’/H6’ d J=8.7)
Apigenin derivative 5*
6.55 (H6 d J=2.1); 6.65 (H3 s); 6.69 (H8 d J=2.1); 7.12 (H3’/H5’ d J=8.7); 7.95 (H2’/H6’ d J=8.7)
Apigenin derivative 6*
6.53 (H6 d J=2.1); 6.65 (H3 s); 6.66 (H8 d J=2.1); 7.09 (H3’/H5’ d J=8.7); 7.92 (H2’/H6’ d J=8.7)
5.16±0.59
Citric acid
2.59 (H2a, d, J= 17.6); 2.72 (H2b, d, J= 17.6)
8.38±3.46 13.66±3.31
8.04±0.17
13.44±0.02
Glucose
4.59 (H1 β, d, J= 7.8); 5.19 (H1 α, d, J= 3.8)
5.89±2.33
5.61±0.28
5.64±1.71
Malic acid
2.39 (H3a, dd, J= 15.6, 9.3); 2.78 (H3a, dd, J= 15.6, 3.6); 4.31 (H2, dd, J= 9.3, 3.6)
Phenylpropanoid 1
5.97 (H8 d J=15.9); 7.43 (H7 d J=15.9)
3.04±3.01
Phenylpropanoid 2
6.17 (H8 d J=15.9); 7.30 (H7 d J=15.9)
X
Phenylpropanoid 3
6.31 (H8 d J=15.9); 7.52 (H7 d J=15.9)
Phenylpropanoid 4
6.45 (H8 d J=15.9); 7.67 (H7 d J=15.9)
Phenylpropanoid 5
6.16 (H8 d J=15.9); 7.25 (H7 d J=15.9)
Phenylpropanoid 6
6.11 (H8 d J=15.9); 7.37 (H7 d J=15.9)
Phenylpropanoid 7
6.14 (H8 d J=15.9); 7.39 (H7 d J=15.9)
Quinic acid
8.52±1.08
5.25±3.73
7.81±3.24
6.87±2.99
26.72±10.80
37.57±2.72 31.45±7.13
5.94±0.45
3.05±0.62
1.02±0.99
4.62±1.99
6.58±1.51
X
X
X
2.57±0.67
X
X
X
X
1.87 (H2a, m); 1.96 (H6a, m); 2.01 (H2b, m); 2.02 (H6b, m), 3.40 (H4, ov); 4.00 (H3, ov); 4.11
(H5, ov);
45.28±6.65 55.09±4.83 64.02±4.16 71.61±8.84
15
Sucrose
4.15 (H3’, d, J= 8.4); 5.38 (H1, d, J= 3.6)
8.24±3.63
7.09±3.01
15.51±2.84 10.37±0.54
Alanine
See C. nepeta
1.24±0.19
0.87±0.60
0.91±0.15
1.51±0.44
8.31±1.55
9.03±1.24
3.63±2.59
3.26±0.77
Helichrysum italicum
Chlorogenic acid
7.07 (H6’, dd, J= 8.4, 2.1); 7.15 (H2’, d, J= 2.1); 7.62 (H7’, d, J= 15.9)
Dicaffeoylquinic acid
6.30 (H8’, d, J= 16.2); 6.48 (H8”, d, J= 15.6); 7.65 (H7’, d, J= 16.2); 7.66 (H7”, d, J= 15.6)
10.86±1.38 10.88±5.16 11.53±2.38
7.83±2.07
Glucose
See C. nepeta
3.77±1.74
3.56±0.04
2.73±0.59
3.78±2.01
3-OH benzofurane
5.18 (H2 d J=6.3); 5.22 (H3 d J=6.3); 6.90 (H7 ov); 8.04 (H6 dd J=8.4, 1.8)
4.06±0.27
3.13±1.39
5.37±1.89
4.06±1.47
Isobenzofuranone
5.33 (H3 s); 6.73 (H4 d J=1.8); 6.84 (H6 d J=1.8)
6.03±2.70
Malic acid
See C. nepeta
X
X
X
X
Neochlorogenic acid
6.39 (H8’, d, J= 15.9); 7.52 (H7’, d, J= 15.9)
X
X
X
X
Sucrose
See C. nepeta
16.93±8.55 9.15±4.57
10.24±4.45 10.14±3.75
Alanine
See C. nepeta
1.17±0.05
0.90±0.49
1.24±0.25
1.09±0.09
(H7’, d, J= 15.9)
X
X
X
X
Chlorogenic acid
See H. italicum
X
X
X
X
Dicaffeoylquinic acid
See H. italicum
X
X
X
Glucose
See C. nepeta
1.17±0.02
5.55±2.89
5.77±1.64
6.29±1.38
X
X
1.78±1.56
Caffeic acid
Foeniculum vulgare
1.84-2.20 (H2 and H6 quinic acid, m); 5.45 (H5, m); 6.37 (H8’, d, J= 15.9); 6.90 (H5’, d, J= 8.1);
GABA (γ-aminobutirric
acid)
6.29 (H8’, d, J= 15.9); 6.88 (H5’, d, J= 8.1); 7.03 (H6’, dd, J= 8.4, 2.1); 7.12 (H2’, d, J= 2.1); 7.52
1.92 (H3, m); 2.36 (H2, t, J= 7.5); 3.01 (H4, t, J= 7.5)
X
Kaempferol
6.35 (H6, d, J= 2.1); 6.52 (H8, d, J= 2.1); 7.00 (H2’/H6’, d, J= 8.4); 8.09 (H3’/H5’, d, J= 8.4)
1.28±0.17
Malic acid
See C. nepeta
44.68±7.11 47.40±10.23 168.52±11.15 86.62±3.49
Quercetin
1.46±0.44
1.18±0.82
6.27 (H6, d, J= 2.1); 6.48 (H8, d, J= 2.1); 6.99 (H5’, d J= 8.5); 7.59 (H6’, d J= 8.5, 2.1); 7.75 (H2’,
d J= 2.1)
1.93±0.36
5.55±3.61
6.23±1.25
2.94±2.09
Quinic acid
See C. nepeta
25.09±2.62 31.61±17.48 33.49±6.73 27.30±2.25
Sucrose
See C. nepeta
44.94±2.28 36.80±13.85 54.36±11.86 30.62±9.03
Threonine
1.32 (H4, d, J= 6.6)
X
X
X
X
16
Micromeria graeca
Origanum vulgare
Satureja montana
Alanine
See C. nepeta
0.93±0.55
Citric acid
See C. nepeta
19.89±9.44 18.65±1.56 17.13±6.84 15.43±5.10
Glucose
See C. nepeta
4.81±2.49
6.87±2.99
5.61±0.28
5.64±1.71
Malic acid
See C. nepeta
X
X
X
X
Quinic acid
See C. nepeta
1.40±0.88
2.09±0.89
5.75±4.04
39.75±10.68 55.09±4.83 64.02±4.16 57.41±11.24
3.00 (H7’a, dd, J= 14.1, 9.6); 3.15 (H7’b, dd, J= 14.1, 3.6); 5.02 (H8’, dd, J= 10.0, 3.3); 6.30 (H8,
Rosmarinic acid
d, J=15.9); 6.71 (H6’, dd, J=7.8, 2.1); 6.81 (H5’, d, J=7.8); 6.82 (H5, d, J=8.1); 6.89 (H2’, d,
1.02±0.99
4.62±1.98
6.58±1.51
1.54±0.79
7.99±2.60
7.09±3.02
15.51±2.84
8.22±3.73
J=2.1); 7.00 (H6, dd, J=8.1, 1.8); 7.11 (H2, d, J=1.8); 7.50 (H7, d, J=15.9)
Sucrose
See C. nepeta
Threonine
See F. vulgare
Apigenin derivative 2
See C. nepeta
4.32±0.24
2.95±0.91
Alanine
See C. nepeta
0.58±0.12
0.90±0.17
Choline
3.20 (s)
X
X
-
Citric acid
See C. nepeta
14.74±1.02 22.92±4.13 15.54±1.91
-
Glucose
See C. nepeta
16.59±2.64 3.62±2.88
4.39±3.82
-
Lithospermic acid
3.00 (H7’a and b, ov) 6.30 (H8, d, J=15.9); 7.82 (H7, d, J=15.9)
X
-
Malic acid
See C. nepeta
27.59±1.69 32.40±8.10 14.74±8.51
-
Quinic acid
See C. nepeta
30.94±2.86 45.91±1.83 43.12±9.81
-
Rosmarinic acid
See M. graeca
11.47±6.11 15.73±4.82 35.50±5.91
-
Sucrose
See C. nepeta
10.05±1.58 4.98±0.45
14.92±4.36
-
Apigenin derivative 5
See C. nepeta
X
Apigenin derivative 6
See C. nepeta
X
Alanine
See C. nepeta
X
X
X
X
Choline
See O. vulgare
X
X
X
Chlorogenic acid
See H. italicum
9.47±1.20 15.01±0.51 12.50±5.54
3.66±1.84
Glucose
See C. nepeta
1.01±0.67
4.27±1.54
X
X
X
3.96±1.55
1.07±0.14
2.87±1.47
-
17
Thymus longicaulis
Malic acid
See C. nepeta
39.32±2.60 32.40±0.99
8.55±3.31
Rosmarinic acid
See M. graeca
7.15±1.26 10.90±1.64
8.84±4.32
Sucrose
See C. nepeta
10.09±0.93 8.56±4.42
10.07±1.25
9.37±3.91
Alanine
See C. nepeta
0.34±0.24
1.05±0.11
1.08±0.22
1.28±0.07
Citric acid
See C. nepeta
X
X
X
X
Malic acid
See C. nepeta
26.92±15.44 60.05±3.28 35.56±6.80 54.64±14.72
Quinic acid
See C. nepeta
19.85±8.63 41.16±7.50 40.71±8.30 31.96±3.17
Glucose
See C. nepeta
3.06±0.33
3.20±0.83
2.65±1.76
3.36±1.41
Phenylpropanoid 8
6.13 (H8 d J=15.9); 7.46 (H7 d J=15.9)
3.67±1.13
5.65±0.61
4.77±1.24
1.90±1.24
Rosmarinic acid
See M. graeca
7.10±3.70
7.78±1.98
10.12±1.76
4.87±2.14
Sucrose
See C. nepeta
7.10±3.70
7.78±1.98
10.12±1.76
4.87±2.14
48.76±6.78
Signal multiplicity indicated as: d=doublet, dd= doublet of doublets, m= multiplet, ov= overlapped, q=quartet, s= singlet, t= triplet.
*Apigenin derivatives 1 and 2; 3 and 4; 5 and 6 were quantified together due to overlapping signals.
18
Figure 1: 1H-NMR spectra of studied plants (Au= autumn; Sp= spring; Su= summer; Wi= winter).
The main resonances of the main compounds are indicated on the spectra as follows: 1, alanine; 2,
apigenin derivative 1; 3, apigenin derivative 2; 4, apigenin derivative 3; 5, apigenin derivative 4; 6,
apigenin derivative 5; 7, apigenin derivative 6; 8, citric acid; 9, glucose; 10, malic acid; 11,
phenylpropanoid 1; 12, phenylpropanoid 2; 13, phenylpropanoid 3; 14, phenylpropanoid 4; 15,
phenylpropanoid 5; 16, phenylpropanoid 6; 17, phenylpropanoid 7; 18, quinic acid; 19, sucrose; 20,
chlorogenic acid; 21, GABA; 22, kaempferol; 23, quercetin; 24, threonine; 25, rosmarinic acid.
Calamintha nepeta
19
19
Wi
10
6/7 11/12/13/146/7
Sp
6/7
14 1312 11
2/3
2/3
Su
9
8 8
10
10
18
1
9
2/3
4/5
4/5
45
16
Au
17
Helichrysum italicum
Wi
20
20
20
20
20
20
Sp
Su
Au
19
Figure 1 (continued)
Foeniculum vulgare
Wi
21
21
22
23 22
23 23
21
24
Sp
Su
Au
Micromeria graeca
Wi
25
Sp
25
25
25
25
Su
Au
Origanum vulgare
Wi
Sp
Su
20
Figure 1 (continued)
Satureja montana
Wi
Sp
Su
Au
Thymus longicaulis
Wi
Sp
Su
Au
21
© Copyright 2026