
Chapter 5
01:30 Wednesday 28th January, 2015
Copyright c Cosma Rohilla Shalizi; do not distribute without permission
updates at http://www.stat.cmu.edu/~cshalizi/ADAfaEPoV/
Chapter 5
Simulation
[[TODO: Insert forward references to detailed simulation You will recall from your previous statistics courses that quantifying uncertainty in
examples in other chapters ]] statistical inference requires us to get at the sampling distributions of things like estimators. When the very strong simplifying assumptions of basic statistics courses do
not apply1 , or when estimators are themselves complex objects, like kernel regression
curves or even histograms, there is little hope of being able to write down sampling
distributions in closed form. We get around this by using simulation to approximate
the sampling distributions we can’t calculate.
5.1
What Do We Mean by “Simulation”?
|=
A stochastic model is a mathematical story about how the data could have been generated. Simulating the model means implementing it, step by step, in order to produce something which should look like the data — what’s sometimes called synthetic
data, or surrogate data, or a realization of the model. In a stochastic model, some
of the steps we need to follow involve a random component, and so multiple simulations starting from exactly the same initial conditions will not give exactly the same
outputs or realizations. Rather, will be a distribution over the realizations. Doing
large numbers of simulations gives us a good estimate of this distribution.
For a trivial example, consider a model with three random variables, X1 ⇠ N (µ1 , 12 ),
X2 ⇠ N (µ2 , 22 ), with X1 X2 , and X3 = X1 +X2 . Simulating from this model means
drawing a random value from the first normal distribution for X1 , drawing a second
random value for X2 , and adding them together to get X3 . The marginal distribution
of X3 , and the joint distribution of (X1 , X2 , X3 ), are implicit in this specification of
the model, and we can find them by running the simulation.
In this particular case, we could also find the distribution of X3 , and the joint
distribution, by probability calculations of the kind you learned how to do in your
1 In your linear models class, you learn about the sampling distribution of regression coefficients when
the linear model is true, and the noise is Gaussian, independent of the predictor variables, and has constant
variance. As an exercise, try to get parallel results when the noise has a t distribution with 10 degrees of
freedom.
108
109
5.2. HOW DO WE SIMULATE STOCHASTIC MODELS?
basic probability courses. For instance, X3 is N (µ1 + µ2 , 12 + 22 ). These analytical
probability calculations can usually be thought of as just short-cuts for exhaustive
simulations.
5.2
5.2.1
How Do We Simulate Stochastic Models?
Chaining Together Random Variables
Stochastic models are usually specified by sets of conditional distributions for one
random variable, given some other variable or variables. For instance, a simple linear
regression model might have the specification
X
Y |X
⇠
⇠
N (µ x ,
N(
0
2
)
1
+
(5.1)
1X ,
2
)
2
(5.2)
If we knew how to generate a random variable from the distributions given on the
right-hand sides, we could simulate the whole model by chaining together draws from
those conditional distributions. This is in fact the general strategy for simulating any
sort of stochastic model, by chaining together random variables.2
What this means is that we can reduce the problem of simulating to that of generating random variables.
5.2.2
Random Variable Generation
5.2.2.1
Built-in Random Number Generators
R provides random number generators for most of the most common distributions.
By convention, the names of these functions all begin with the letter “r”, followed
by the abbreviation of the functions, and the first argument is always the number of
draws to make, followed by the parameters of the distribution:
rnorm(n,mean=0,sd=1)
runif(n,min=0,max=1)
rexp(n,rate=1)
rpois(n,lambda)
rbinom(n,size,prob)
#
#
#
#
#
Gaussian
Uniform
Exponential, rate is 1/mean
Poisson, lambda is mean
Binomial
etc., etc. A further convention is that these parameters can be vectorized. Rather
than giving a single mean and standard deviation (say) for multiple draws from the
Gaussian distribution, each draw can have its own:
rnorm(10,mean=1:10,sd=1/sqrt(1:10))
That instance is rather trivial, but the exact same principle would be at work here:
2 In this case, we could in principle first generate Y , and then draw from Y |X , but have fun finding
those distributions. Especially have fun if, say, X has a t distribution with 5 degrees of freedom — a very
small change to the specification.
01:30 Wednesday 28th January, 2015
5.2. HOW DO WE SIMULATE STOCHASTIC MODELS?
110
rnorm(nrow(x),mean=predict(regression.model,newdata=x),
sd=predict(volatility.model,newdata=x)
where regression.model and volatility.model are previously-defined parts of
the model which tell us about conditional expectations and conditional variances.
Of course, none of this explains how R actually draws from any of these distributions; it’s all at the level of a black box, which is to say black magic. Because
ignorance is evil, and, even worse, unhelpful when we need to go beyond the standard
distributions, it’s worth open the black box at least a little. We’ll look at using transformations between distributions, and, in particular, transforming uniform distributions into others (§5.2.2.3). Appendix M explains some more advanced methods, and
looks at the issue of how to get uniformly-distributed random numbers in the first
place.
5.2.2.2
Transformations
If we can generate a random variable Z with some distribution, and V = g (Z), then
we can generate V . So one thing which gets a lot of attention is writing random
variables as transformations of one another — ideally as transformations of easy-togenerate variables.
Example. Suppose we can generate random numbers from the standard Gaussian
distribution Z ⇠ N (0, 1). Then we can generate from N (µ, 2 ) as Z + µ. We can
generate 2 random variables with 1 degree of freedom as Z 2 . We can generate 2
random variables with d degrees of freedom by summing d independent copies of
Z 2.
In particular, if we can generate random numbers uniformly distributed between
0 and 1, we can use this to generate anything which is a transformation of a uniform
distribution. How far does that extend?
5.2.2.3
Quantile Method
Suppose that we know the quantile function QZ for the random variable X we want,
so that QZ (0.5) is the median of X , QZ (0.9) is the 90th percentile, and in general
QZ ( p) is bigger than or equal to X with probability p. QZ comes as a pair with the
cumulative distribution function FZ , since
QZ (FZ (a)) = a, FZ (QZ ( p)) = p
(5.3)
In the quantile method (or inverse distribution transform method), we generate a
uniform random number U and feed it as the argument to QZ . Now QZ (U ) has the
distribution function FZ :
Pr (QZ (U ) a)
=
=
=
Pr (FZ (QZ (U )) FZ (a))
Pr (U FZ (a))
FZ (a)
(5.4)
(5.5)
(5.6)
where the last line uses the fact that U is uniform on [0, 1], and the first line uses the
fact that FZ is a non-decreasing function, so b a is true if and only if FZ (b ) FZ (a).
01:30 Wednesday 28th January, 2015
111
5.2. HOW DO WE SIMULATE STOCHASTIC MODELS?
Example. The CDF of the exponential distribution with rate is 1 e x . The
log (1 p)
quantile function Q( p) is thus
. (Notice that this is positive, because 1 p <
1 and so log (1 p) < 0, and that it has units of 1/ , which are the units of x, as it
log (1 U )
should.) Therefore, if U Unif(0, 1), then
⇠ Exp( ). This is the method
used by rexp().
Example. The Pareto distribution or power law is a two-parameter family,
⇣ ⌘ ↵
f (x; ↵, x0 ) = ↵x 1 xx
if x
x0 , with density 0 otherwise. Integration shows
0
0
⇣ ⌘ ↵+1
x
that the cumulative distribution function is F (x; ↵, x0 ) = 1
. The quantile
x
1
0
function therefore is Q( p; ↵, x0 ) = x0 (1 p) ↵ 1 . (Notice that this has the same units
as x, as it should.)
Example. The standard Gaussian N (0, 1) does not have a closed form for its quantile function, but there are fast and accurate ways of calculating it numerically (they’re
what stand behind qnorm), so the quantile method can be used. In practice, there are
other transformation methods which are even faster, but rely on special tricks.
Since QZ (U ) has the same distribution function as X , we can use the quantile
method, as long as we can calculate QZ . Since QZ always exists, in principle this
solves the problem. In practice, we need to calculate QZ before we can use it, and this
may not have a closed form, and numerical approximations may be in tractable.3 In
such situations, we turn to more advanced methods, like those described in Appendix
M.
5.2.3
Sampling
A complement to drawing from given distributions is to sample from a given collection of objects. This is a common task, so R has a function to do it:
sample(x,size,replace=FALSE,prob=NULL)
Here x is a vector which contains the objects we’re going to sample from. size is the
number of samples we want to draw from x. replace says whether the samples are
drawn with or without replacement. (If replace=TRUE, then size can be arbitrarily
larger than the length of x. If replace=FALSE, having a larger size doesn’t make
sense.) Finally, the optional argument prob allows for weighted sampling; ideally,
prob is a vector of probabilities as long as x, giving the probability of drawing each
element of x4 .
As a convenience for a common situation, running sample with one argument
produces a random permutation of the input, i.e.,
sample(x)
is equivalent to
3 In
essence, we have to solve the nonlinear equation FZ (x) = p for x over and over — and that assumes
we can easily calculate FZ .
4 If the elements of prob do not add up to 1, but are positive, they will be normalized by their sum,
9 9 1
e.g., setting prob=c(9,9,1) will assign probabilities ( 19
, 19 , 19 ) to the three elements of x.
01:30 Wednesday 28th January, 2015
5.2. HOW DO WE SIMULATE STOCHASTIC MODELS?
112
sample(x,size=length(x),replace=FALSE)
For example, the code for k-fold cross-validation, Code Example 2, had the lines
fold.labels <- sample(rep(1:nfolds, length.out=nrow(data)))
Here, rep repeats the numbers from 1 to nfolds until we have one number for
each row of the data frame, say 1, 2, 3, 4, 5, 1, 2, 3, 4, 5, 1, 2 if there were twelve rows.
Then sample shuffles the order of those numbers randomly. This then would give
an assignment of each row of df to one (and only one) of five folds.
5.2.3.1
Sampling Rows from Data Frames
When we have multivariate data (which is the usual situation), we typically arrange
it into a data-frame, where each row records one unit of observation, with multiple
interdependent columns. The natural notion of sampling is then to draw a random
sample of the data points, which in that representation amounts to a random sample
of the rows. We can implement this simply by sampling row numbers. For instance,
this command,
df[sample(1:nrow(df),size=b),]
will create a new data frame from b, by selecting b rows from df without replacement.
It is an easy exercise to figure out how to sample from a data frame with replacement,
and with unequal probabilities per row.
5.2.3.2
Multinomials and Multinoullis
If we want to draw one value from a multinomial distribution with probabilities
p = ( p1 , p2 , . . . pk ), then we can use sample:
sample(1:k,size=1,prob=p)
If we want to simulate a “multinoulli” process5 , i.e., a sequence of independent and
identically distributed multinomial random variables, then we can easily do so:
rmultinoulli <- function(n,prob) {
k <- length(prob)
return(sample(1:k,size=n,replace=TRUE,prob=prob))
}
Of course, the labels needn’t be the integers 1 : k (exercise 1).
5.2.3.3
Probabilities of Observation
Often, our models of how the data are generated will break up into two parts. One
part is a model of how actual variables are related to each other out in the world.
(E.g., we might model how education and racial categories are related to occupation,
and occupation is related to income.) The other part is a model of how variables come
5A
handy term I learned from Gustavo Lacerda.
01:30 Wednesday 28th January, 2015
113
5.3. REPEATING SIMULATIONS
to be recorded in our data, and the distortions they might undergo in the course of
doing so. (E.g., we might model the probability that someone appears in a survey
as a function of race and income.) Plausible sampling mechanisms often make the
probability of appearing in the data a function of some of the variables. This can
then have important consequences when we try to draw inferences about the whole
population or process from the sample we happen to have seen.
[[TODO: Check — do we really come back to this?]]
income <- rnorm(n,mean=predict(income.model,x),sd=sigma)
capture.probabilities <- predict(observation.model,x)
observed.income <- sample(income,size=b,prob=capture.probabilities)
5.3
Repeating Simulations
Because simulations are often most useful when they are repeated many times, R has
a command to repeat a whole block of code:
replicate(n,expr)
Here expr is some executable “expression” in R, basically something you could type
in the terminal without trouble, and n is the number of times to repeat it.
For instance,
output <- replicate(1000,rnorm(length(x),beta0+beta1*x,sigma))
will replicate, 1000 times, sampling from the predictive distribution of a Gaussian
linear regression model. Conceptually, this is equivalent to doing something like
output <- matrix(0,nrow=1000,ncol=length(x))
for (i in 1:1000) {
output[i,] <- rnorm(length(x),beta0+beta1*x,sigma)
}
but the replicate version has two great advantages. First, it is faster, because R
processes it with specially-optimized code. (Loops are especially slow in R.) Second,
and far more importantly, it is clearer: it makes it obvious what is being done, in one
line, and leaves the computer to figure out the boring and mundane details of how
best to implement it.
5.4
Why Simulate?
There are three major uses for simulation: to understand a model, to check it, and to
fit it. We will deal with the first two here, and return to fitting in chapter 30, after
we’ve looked at dealing with dependence and hidden variables.
01:30 Wednesday 28th January, 2015
5.4. WHY SIMULATE?
5.4.1
114
Understanding the Model; Monte Carlo
We understand a model by seeing what it predicts about the variables we care about,
and the relationships between them. Sometimes those predictions are easy to extract from a mathematical representation of the model, but often they aren’t. With a
model we can simulate, however, we can just run the model and see what happens.
Our stochastic model gives a distribution for some random variable Z, which in
general is a complicated, multivariate object with lots of interdependent components.
We may also be interested in some complicated function g of Z, such as, say, the
ratio of two components of Z, or even some nonparametric curve fit through the
data points. How do we know what the model says about g ?
Assuming we can make draws from the distribution of Z, we can find the distribution of any function of it we like, to as much precision as we want. Suppose that
Z˜1 , Z˜2 , . . . Z˜b are the outputs of b independent runs of the model — b different replicates of the model. (The tilde is a reminder that these are just simulations.) We can
calculate g on each of them, getting g (Z˜1 ), g (Z˜2 ), . . . g (Z˜b ). If averaging makes sense
for these values, then
b
1X
g (Z˜i ) ! E [ g (Z)]
(5.7)
b !1
b i =1
by the law of large numbers. So simulation and averaging lets us get expectation
values. This basic observation is the seed of the Monte Carlo method.6 If our
simulations are independent, we can even use the central limit theorem to say that
1 Pb
g (Z˜i ) has approximately the distribution N (E [ g (Z)] ,Var [ g (Z)] /b ). Of
b
i=1
course, if you can get expectation values, you can also get variances. (This is handy if
trying to apply the central limit theorem!) You can also get any higher moments —
if you need the kurtosis for whatever reason, you just have to simulate enough.
You can also pick any set s and get the probability that g (Z) falls into that set:
b
1X
b
i =1
1 s ( g (Zi ))
! Pr ( g (Z) 2 s )
b !1
(5.8)
⇥
⇤
The reason this works is of course that Pr ( g (Z) 2 s) = E 1 s ( g (Z)) , and we can
use the law of large numbers again. So we can get the whole distribution of any
complicated function of the model that we want, as soon as we can simulate the
model. It is really only a little harder to get the complete sampling distribution than
it is to get the expectation value, and the exact same ideas apply.
5.4.2
Checking the Model
An important but under-appreciated use for simulation is to check models after they
have been fit. If the model is right, after all, it represents the mechanism which generates the data. This means that when we simulate, we run that mechanism, and the
6 The name comes from the physicists who used the method to do calculations relating to designing the
hydrogen bomb; see Metropolis et al. (1953). Folklore among physicists says that the method goes back at
least to Enrico Fermi in the 1930s, without the cutesy name.
01:30 Wednesday 28th January, 2015
115
5.4. WHY SIMULATE?
rgeyser <- function() {
n <- nrow(geyser)
sigma <- summary(fit.ols)$sigma
new.waiting <- rnorm(n,mean=fitted(fit.ols),sd=sigma)
new.geyser <- data.frame(duration=geyser$duration,
waiting=new.waiting)
return(new.geyser)
}
Code Example 5: Function for generating surrogate data sets from the linear model
fit to geyser.
surrogate data which comes out of the machine should look like the real data. More
exactly, the real data should look like a typical realization of the model. If it does not,
then the model’s account of the data-generating mechanism is systematically wrong
in some way. By carefully choosing the simulations we perform, we can learn a lot
about how the model breaks down and how it might need to be improved.7
5.4.2.1
“Exploratory” Analysis of Simulations
Often the comparison between simulations and data can be done qualitatively and
visually. For example, a classic data set concerns the time between eruptions of the
Old Faithful geyser in Yellowstone, and how they relate to the duration of the latest
eruption. A common exercise is to fit a regression line to the data by ordinary least
squares:
library(MASS)
data(geyser)
fit.ols <- lm(waiting~duration,data=geyser)
Figure 5.1 shows the data, together with the OLS regression line. It doesn’t look
that great, but if someone insisted it was a triumph of quantitative vulcanology, how
could you show they were wrong?
Well, OLS is usually presented as part of a probability model for the response
conditional on the input, with Gaussian and homoskedastic noise. In this case, the
probability model is waiting = 0 + 1 duration + ✏, with ✏ ⇠ N (0, 2 ). If we
simulate from this probability model, we’ll get something we can compare to the
actual data, to help us assess whether the scatter around that regression line is really
bothersome. Since OLS doesn’t require us to assume a distribution for the input
variable (here, duration), the simulation function in Code Example 5 leaves those
values alone, but regenerates values of the response (waiting) according the model
assumptions.
A useful principle for model checking is that if we do some exploratory data
analyses of the real data, doing the same analyses to realizations of the model should
7 “Might”, because sometimes we’re better off with a model that makes systematic mistakes, if they’re
small and getting it right would be a hassle.
01:30 Wednesday 28th January, 2015
5.4. WHY SIMULATE?
116
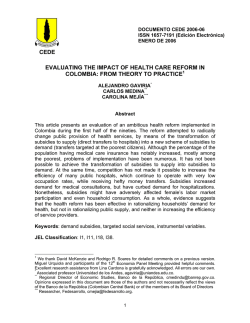
plot(geyser$duration,geyser$waiting,xlab="duration",ylab="waiting")
abline(fit.ols)
Figure 5.1: Data for the geyser data set, plus the OLS regression line.
01:30 Wednesday 28th January, 2015
117
5.4. WHY SIMULATE?
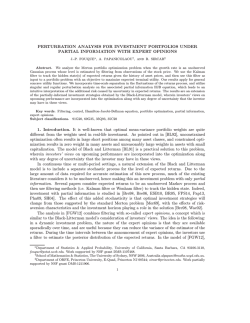
plot(density(geyser$waiting),xlab="waiting",main="",sub="")
lines(density(rgeyser()$waiting),lty=2)
Figure 5.2: Actual density of the waiting time between eruptions (solid curve) an that
produced by simulating the OLS model (dashed).
give roughly the same results. This is a test the model fails. Figure 5.2 shows the
actual density of waiting, plus the density produced by simulating — reality is clearly
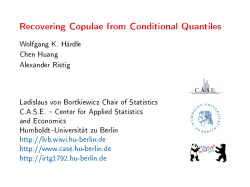
bimodal, but the model is unimodal. Similarly, Figure 5.3 shows the real data, the
OLS line, and a simulation from the OLS model. It’s visually clear that the deviations
of the real data from the regression line are both bigger and more patterned than those
we get from simulating the model, so something is wrong with the latter.
By itself, just seeing that data doesn’t look like a realization of the model isn’t
super informative, since we’d really like to know how the model’s broken, and so
how to fix it. Further simulations, comparing more detailed analyses of the data to
analyses of the simulation output, are often very helpful here. Looking at Figure 5.3,
we might suspect that one problem is heteroskedasticity — the variance isn’t constant.
This suspicion is entirely correct, and will be explored in §7.3.2.
5.4.3
Sensitivity Analysis
Often, the statistical inference we do on the data is predicated on certain assumptions about how the data is generated. For instance, if we have missing values for
some variables and just ignore incomplete rows, we are implicitly assuming that data
are “missing at random”, rather than in some systematic way. If we are not totally
confident in such assumptions, we might wish to see what happens they break down.
That is, we set up a model where the assumptions are more or less violated, and then
run our original analysis on the simulation output. Because it’s a simulation, we
know the complete truth about the data-generating process, and can assess how far
01:30 Wednesday 28th January, 2015
[[TODO: Citations]]
[[ATTN: Forward ref to density estimation, or replace
with histogram?]]
[[TODO: Expand on this]]
5.4. WHY SIMULATE?
118
plot(geyser$duration,geyser$waiting,xlab="duration",ylab="waiting")
abline(fit.ols)
points(rgeyser(),pch=20,cex=0.5)
Figure 5.3: As in Figure 5.1, plus one realization of simulating the OLS model (small
black dots).
01:30 Wednesday 28th January, 2015
119
5.5. FURTHER READING
off our inferences are. In favorable circumstances, our inferences don’t mess up too
much even when the assumptions we used to motivate the analysis are badly wrong.
Sometimes, however, we discover that even tiny violations of our initial assumptions
lead to large errors in our inferences. Then we either need to make some compelling
case for those assumptions, or be very cautious in our inferences.
Sections on simulation-based
inference moved to new chapter after time series
5.5
Further Reading
On stochastic simulation in general, see [[Ripley]], [[ ]]. Many references on simulation present it as almost completely disconnected from statistics and data analysis,
giving the impression that probability models just fall from the sky. Guttorp (1995)
is an excellent exception.
[[CRAN task view on random variable generation]]
For further reading on methods of drawing random variables from a given distribution, on Monte Carlo, and on generating uniform random numbers, see Appendix
M.
5.6
Exercises
1. Modify rmultinoulli from §5.2.3.2 so that the values in the output are not
the integers from 1 to k, but come from a vector of arbitrary labels.
01:30 Wednesday 28th January, 2015


© Copyright 2026