
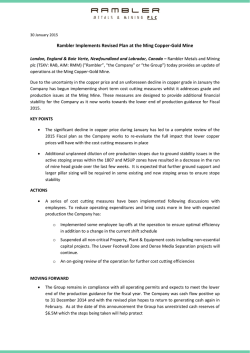
THE CUPRIC COMPLEXES OF GLYCINE AND OF
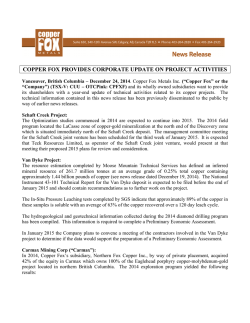
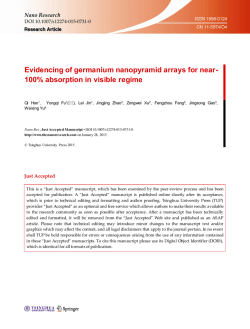
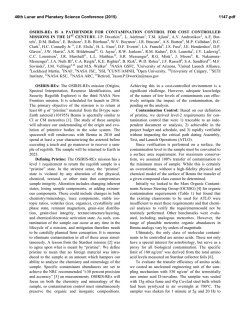
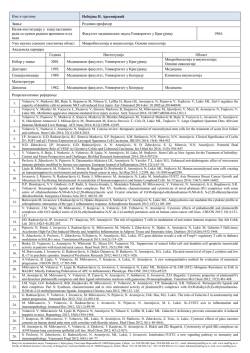
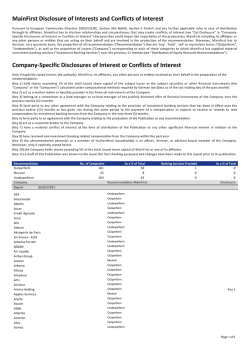
THE CUPRIC
BY
COMPLEXES
HENRY
(From the William
OF GLYCINE
BORSOOK
G. Kerckhoff
KENNETH
V. THIlMANN
Laboratom’es of the Biological
of Technology,
Pasadena)
AND
California Institute
(Received for publication,
I.
AND OF ALANINE
Sciences,
June 4, 1932)
INTRODUCTION
(U)
HISTORICAL
The following report is the first of a projected series of studies
of the physical chemistry of the compounds of the heavy metals,
particularly of copper and of iron, with substances of biological
importance. These studies are invited by the accumulation in
recent years of examples of the importance of the heavy metals
in biological chemistry.
The copper compounds of glycine and of alanine were studied
first, in the hope that the analysis of the factors affecting the
formation of these relatively simple compounds would facilitate
the elucidation of the more complex systems.
It has long been known that amino acids and cupric ion react
to form stable complexes. Ley, in 1904 (l), suggested for the
copper-glycine complex the formula
0
-OC-H&-NH*
__-- _.-*
_--
\
O--OC-HG-NH2
the dotted lines signifying secondary valencies. In support of
this formula Ley and his collaborators later published spectrophotometric absorption data in the visible and ultra-violet regions
for copper-glycine and for copper-alanine (2, 3). The chief evidence adduced by Ley for the accompanying formula was the
similarity between the absorption spectra, in the visible region
671
672
Cupriglycine
and Cuprialanine
of the copper complexes of the monoaminamonocarboxylic
acids
and those of the cupriammonium
complexes.
Barker, in 1907 (4), reported the results of potentiometric
and
freezing point measurements
in aqueous solutions of copper sulfate and glycine, from which the conclusion was drawn that 4
molecules of glycine were combined with 1 of copper, the combination being effected by the four secondary valencies of the copper
with the nitrogen atoms of the amino acids,
Most of the results
published by Barker,
without
special interpretation,
may be
taken equally well to indicate that 3 instead of 4 molecules of
glycine are combined with 1 of copper.
The interpretation
of freezing point data here is complicated by
the formation of aggregates between the amino acid molecules (5),
which has only been discovered in the last few years, and which
the earlier irrlestigators
failed to take into account.
An additional
uncertain correction must be introduced also for the activity coefficients of the electrolytes in solution.
These qualifications also weaken the evidence adduced by Pfeiffer (6) from freezing point measurements
for the formation of
complexes between neutral salts and amino acids. Direct evidence that these compounds may exist at least in the solid state
was, however, obtained by Anslow and King (7), who crystallized
a number of complexes of inorganic neutral salts and dicarboxylic
amino acids.
In a series of interesting
and suggestive studies Kober and
Sugiura (8) and Kober and Haw (9) showed that cupric ion forms
with monocarboxylic-a-amino
acids compounds of the type CUAZ,
where A refers to the amino acid molecule; and with glutamic acid,
aspartic acid, isoserine, and all polypeptides,
compounds of the
type CuA.
From the examination of a large number of compounds they deduced the rule that the region of absorption is
shifted more and more toward the blue as the number of nitrogen
atoms attached to the copper in a stable ring, either by secondary
or primary valencies, increases from 2 to 4. Accordingly, in strong
alkali monoamino acids and dipeptides give a blue color similar to
that of cupriammonia,
and an absorption
maximum at 6300 8. ;
tripeptides,
a bluish violet with absorption maximum at about
5400 8.; and tetrapeptides,
a red color with absorption maximum
at 4430 8. The latter is the true biuret color, while the color
given by proteins resembles that of the tripeptides.
H. Borsook and K. V. Thimann
673
Pfeiffer (6) has acce ted the type of formula proposed by Ley
for the copper compounds of glycine and alanine; i.e., an internal
complex with the primary valencies of the copper attached to the
carboxyl groups.
Ley and Pfeiffer, in their formulation
of the
copper compounds of the amino acids, have tacitly accepted the
classical conception of the strength of the acid and basic radicals
of the amino acids. Since the Zwitter Ion constitution
of amino
acids seems now firmly established
(lo), we have employed it
throughout
in designating the species of ionic form of the amino
acid existing at any given hydrogen ion concentration.
The interesting
point which the present study has revealed is
the variation of the constitution
of the copper-glycine
or copperalanine complexes present in any solution with the hydrogen ion
This phenomenon seems, up to now, to have been
concentration.
Ley andHegge (2) statec that copperalmost entirely overlooked.
glycine can be obtained in two forms, in plate-like and needleBy
like crystals; but that no difference is detectable in solution.
conductivity
and electrode potential measurements
Barker found
that the addition of glycine to solutions of zinc sulfate increased
the hydrogen ion concentration
of the solution; and from the similarity in behavior of the conductivities
of glycine-zinc and glytine-copper sulfate solutions he concluded that the formation of a
glycine-copper
sulfate compound also increased the hydrogen ion
concentration
of the solution.
This we have confirmed.
Kober
and Haw observed that the absorption
of a given complex is
somewhat dependent on the concentration
of the hydroxyl ions.
As far as the amino acid complexes are concerned they reported
only that, “In the amino-acid blue complexes there is no visible
change with weak alkali; but in strong alkali most of the copper
is precipitated.”
This oversight was due, it seems, to the practice of attempting
to account for all the properties of solutions of copper compounds
of glycine and of alanine by those of the crystals.
This amounts
in effect to considering only saturated solutions in which the copper
and amino acid are in equivalent proportions.
It is obvious that
such compounds can be of only remote significance under physiological conditions where the concentration
of nitrogenous
substances is enormously in excess of that of the copper, which is
present only in traces.
674
Cupriglycine
and Cuprialanine
One of the few attempts to consider the equilibria in solution
was made by Shibata and Matsuno
(11). They noted that
changes occurred in the absorption spectra of copper sulfate solutions with changes in concentration,
but limited their explanations to the postulate of the formation of aquo complexes.
(b) Absorption
Spectra
The data presented below indicate that as the hydrogen ion
concentration
is varied from pH values of 0 to 13, at least four
compounds of cupriglycine
and cuprialanine
are formed.
In
Figs. 1 and 3 the absorptions in the visible spectra of these four
compounds are set out and compared with those of copper sulfate, of undissociated
copper acetate (i.e. in alcoholic solution),
and of cupriammonium
sulfate.
The effect of varying the hydrogen ion concentration
at constant relative concentration
of amino acid to copper is shown in
Figs. 2 and 4, which give only a few curves from the series of thirtyfour obtained.
As discussed in Section III, a it was impossible to
interpret
the changes in absorption
in terms of less than four
compounds.
Furthermore,
analysis of combined spectrophotometric and potentiometric
data showed that in some solutions
three copper-amino
acid compounds were present at once. On
this account it would be extremely difficult, if not impossible, to
obtain from aqueous solutions the second acid copper-glycine
or
alanine complex in the pure crystalline
state.
Even if these
compounds were prepared, on re-solution a rearrangement
would
occur, with the result that the solutions so formed would contain
more than one complex.
The same consideration, in lesser degree,
applies to the other complexes.
The pure neutral compound,if
prepared and dissolved in water, would probably suffer the least
change, though even here the absorption data of Ley and of Kober
and Haw suggest that a detectable’amount
of the second acid
complex is formed (cf. p. 683).
Since a solution of the crystals of any one copper-glycine
or
alanine complex would therefore at once become a mixture, the
only way these compounds can be obtained alone in solution is by
increasing the concentration
of amino acid (with the pH kept
constant within a suitable range) until no further change in the
absorption of the solution occurs.
By t,his method the absorption
H. Borsook and K. V. Thimann
675
curves of the pure neutral and basic complexes were obtained.
The determination
of the absorption curves of the two acid complexes-one,
designated the first acid complex, predominating
at
pH 2.0, the other, the second acid complex, predominating
at pH
about 4.0-presented
more difficulty, since their ranges of stability overlap.
The curves deduced are therefore less certain than
those of the neutral and basic complexes.
The curves for the
first acid complexes were obtained from dilute solutions of amino
acid after the absorption due to the free cupric ion, whose concentration
was determined
potentiometrically,
had been subtracted from the total absorption observed.
The curves for the
second acid complexes were obtained by a method of trial and
error described below.
(c) Potential Measurements
By means of copper electrode potential measurements
we have
also attempted
to determine by the following method, due to
Bodliinder and Storbeck (12), the number of molecules of amino
acid combined with 1 molecule of copper.
The general equation for the formation of any one of the complexes (where AH represents that form of the amino acid taking
part in the reaction, and CuA, the complex) is
CuA,
+ rH+ =
Cu++ + m(AH)
(1)
In it the CuA, bears a charge which varies with the complex
under consideration and also contains (m - r) H atoms. The
general treatment of the equilibria is facilitated (without being
invalidated in any way) by omitting these from mass law equations. The mass law expression for the equilibrium is therefore
(Cu++) . (AH)m
=K
(CuA,) - (H+)r
(2)
where m is the number of molecules of amino acid in the complex and r the number of hydrogen ions set free in the formation
of 1 molecule of complex.
Therefore, for two different amino acid and hydrogen ion concentrations we may write
(Cu++)l
(Cu-Lh
- (AHIm1
(Cu++)z - (AH)m
. (H+F 1 = (CuA&
. (H+;;
(3)
676
Cupriglycine
and Cuprialanine
which on conversion to logarithms
(AH)1
m log (AH)~
and rearrangement
(cu++)z
= log
(cu++)l
becomes
(CuAA
+
1%
(CuA,)2
+ T(PHZ
-
PHII
(4)
Since the potential difference between copper electrodes, in two
solutions where all other ions except the cupric ions are at practically the same concentration, is
g
E=
nF
ln
(CU++)I
(CU++)Z
-
(5)
therefore, by being converted to base 10 and inserted in Equation
4 the latter becomes
(AH)1
nF
(CuAmh
m log (~11)2= (-7%- Ed 2.303RT + log cCuA,12+
~PHZ
-
PHI
(6)
If practically the whole of the copper is in the complex form, the
second term on the right-hand side disappears, and hence the value
of m, i.e. the number of molecules of amino acid combined with 1
cupric ion in a given complex, can be obtained from the potential
difference between copper electrodes, if the hydrogen ion concentrations are the same in the two solutions.
In those solutions in which an appreciable fraction of the copper
is not in the complex form, a correction for this has to be applied.
This was done either by assuming the copper electrode potentials
to give absolute Cu++ concentrations, and deducting these from
the total copper present, or else by algebraic analysis of the absorption curves, as described in Section III, a. Where possible,
both methods were used, and the results checked each other fairly
satisfactorily.
In acid solutions it was found that hydrogen ion concentrations
great enough to suppress ionization of the COOH group of the
amino acid also suppressed all complex formation (cf. Fig. 2, A).
This means that only the Zwitter Ion form of glycine and alanine
takes part in the complex formation with copper in the acid range.
Consequently, the concentration of free amino acid employed in
Equation 6 refers only to that in the Zwitter Ion form. This is
therefore the difference between the total calculated concentration
of Zwitter Ion form of amino acid at the pH of the solution and
H. Borsook and K. V. Thimann
677
that bound in the complex.
Where the concentration
of amino
acid was greatly in excess of that of the copper, and the pH between 4.5 and 8.0, no error is incurred by taking as the concentration of free amino acid the total amount added initially.
For the determination
of hydrogen ion concentrations
in the
presence of copper the glass electrode was used, as described in
Section II, b.
When the value of m had been obtained from solutions in which
the pH was the same, i.e. where only the amino acid concentrations were different, this value of m was then employed in other
solutions for the determination
of r. By using several determinations mean values for m and r were obtained, and from these the
approximate equilibrium constants were computed.
In the case of the neutral compounds of glycine and of alanine,
and of the second acid compound of alanine, another, independent,
method of obtaining the value of r was also employed.
This
consisted in the measurement of the small change in hydrogen ion
concentration
of the amino acid solution, resulting from the addition of measured small amounts of copper sulfate solution.
The
method is described in Section III, b; the results are shown in
Tables III, VII, and IX.
In this method, when the amino acid
concentration was greatly in excess of that of the copper, all of the
copper could be considered to be in complex form; in more dilute
solutions, the free copper, and hence by subtraction
the amount
of complex, was determined by means of the copper electrode.
II.
EXPERIMENTAL
(a) Absorption
Spectra
The absorption
data were obtained
with a Konig-Martens
spectrophotometer.
The cell employed was a T-piece 73.5 mm.
long, with plate glass ends cemented on. This length of absorption solution permitted the use of low concentrations
of copper
(usually 0.002 M) and of correspondingly
large variations in the
relative excess of amino acid. In order to maintain the composition as uniform as possible with respect to SO, ions, which
facilitated the interpretation
of the copper electrode potentials,
K&O4 was added to all solutions to a final concentration of 0.1 M.
Owing to the large error which traces of opalescence introduce,
678
Cupriglycine
and Cuprialanine
all solutions were filtered into the absorption cell before measurements were made. To allow for absorption due to water and to
reflection by the cell surfaces, blank determinations
were made on
distilled water similarly filtered into the cell.
(b) Hydrogen
Ion Concentrations
In the solutions marked * in Tables I, II, and V, a quantity of
HzS04 estimated to be equivalent to the hydrogen ions set free by
the formation of the copper-amino acid complex was added to the
solution of amino acid, together with potassium sulfate, and the
acid or alkali necessary to bring the hydrogen ion concentration of
the solution to the desired pH.
The pH was then measured
electrometrically
with a Moloney hydrogen electrode (13). The
value obtained was checked calorimetrically
on the similar solution containing CuS04 (instead of the excess acid) on which the
spectrophotometric
and copper electrode potential measurements
were carried out. The pH values given for these solutions are
uncertain to ~tO.2 pH units.
In the solutions marked t in Tables I, II, V, VI, and VIII,
the hydrogen ion concentrations
were measured in the final mixture containing copper.
This was done with the glass electrode,
the modified electrical arrangement described by Robertson (14)
being used. With this set-up, potentials were determined by
means of a high sensitivity
galvanometer
(Leeds and Northrup
type 2500) and a type K Leeds and Northrup
potentiometer,
without the use of vacuum tubes.
The electrodes were made from
the special Corning glass employed by MacInnes and Dole (15).
The electrode used was calibrated before each measurement with
buffer solutions whose pH values bracketed that of the solution
to be measured.
The uncertainty
of the values obtained was not
greater than 0.02 pH unit.
(c) Copper Ion Concentrations
Copper foil electrodes have been used in complex ion work by
Riley (16). The use of foil or wire electrodes, however,
was
shown by Getman (17) to introduce variations in the potential
according to the metallurgical
treatment of the copper, and the
electrodes here employed were therefore prepared according to
the directions of Lewis and Lacey (18) and of Getman (17).
H. Borsook and K. V. Thimann
679
Spongy copper was obtained by electrolyzing a solution of twice
recrystallized
CuS04 between platinum
foil electrodes with a
high current density, so that the copper was deposited in streamers
of spongy metal which did not adhere to the cathode but sank to
the bottom of the beaker.
This was thoroughly washed in freshly
boiled distilled water (redistilled through a block tin condenser)
until quite free from SO4 and then set away in a bottle filled with
freshly boiled redistilled water to preserve it from oxidation in
the air. The copper electrodes consisted of platinum wire very
thinly covered by a film of copper deposited out of a 0.01 M CuSO4
solution by means of the current from one dry cell for 30 seconds.
These electrodes were then covered by spongy copper which had
been washed several times with the solution in which the elecBefore being used on
trode was finally brought to equilibrium.
amino acid solutions the electrodes were checked by measuring
the potential difference between known concentrations
of copper
sulfate in the two electrodes, usually 0.01 M against 0.001 M. The
potential difference found at 25’ for this concentration
difference
was 22 millivolts, the identical value obtained by Labendzinski
(19) for this cell. When both CuSOl solutions contained 0.1 M
K&SO+ values of 29.5 t,o 30.1 millivolts were obtained.
In the
operation of this cell it was found that difference in hydrogen ion
concentration
produces a large liquid junction potential.
Accordingly, when the cupric ion potential difference between solutions containing different concentrations
of amino acid was desired, the pH values of the standard and the unknown solutions
were made as nearly as possible the same. In spite of these precautions discrepancies
sometimes occurred between the values
for the concentration
of free cupric ions, deduced from copper
electrode pot,ential, and those obtained from spectrophotometric
data. It is possible that this was due to a solution of metallic
ion by the acid in the presence of small amounts of dissolved oxygen. In most cases, however, the values found by potentiometric
and spect’rophotometric
methods were in fairly good agreement.
The usual procedure in t,he determination
of the cupric ion potential was as follows: The t’wo electrode vessels, one containing
the standard copper sulfate solution, the other the amino acid
and consequently an unknown concentration
of cupric ions, connected by an intermediate
solution which was the same as the
680
Cupriglycine
and Cuprialanine
standard, were set away in an air bath at 25’, with the stop-cocks
closed. These were opened only while readings were being taken.
Fresh liquid junctions were made for each reading by opening
screw clamps on top of each electrode vessel.
Readings were
taken from time to time until the potential was observed not to
drift more than 1 millivolt in 1 hour.
The time elapsed was as
a rule from 2 to 3 hours.
The employment of 0.1 M KzS04 in the standard and in the solutions containing amino acid eliminated potentials due to SO4
ion concentration
difference, and maintained a nearly constant
ionic strength in all solutions.
It was hoped that this nearly constant concentration of strong electrolyte would minimize the effect
of varying amino acid concentrations
on the activity of the cupric
ion, and, on the assumption
of constant ionic strength, would
justify the calculation directly from the potentials of cupric ion
concentrations
instead of cupric ion activities.
The copper sulfate used in the preparation of the spongy copper
and in the solutions was twice recrystallized
from a C.P. specimen,
care being taken to obtain small crystals; and then powdered and
dried at 120”. From this salt a stock 0.1 M solution was made
which served for all subsequent dilutions.
The specimens of glycine and dl-alanine used were recrystallized several times from isoelectric solutions of commercial prepaAfter drying, these gave the melting points cited in the
rations.
literature, 235” for glycine and 295” for alanine.
III.
Cupric Salts of Glycine
(a) Absorption
Spectra
Fig. 2 shows the variation in the absorption of solutions containing a constant concentration
of CuSOd (0.002 M) and of glycine
(0.5 M) when the hydrogen ion concentration is changed from pH
0 to 12. Beginning with the absorption of free CuS04 in extreme
acidity, the absorption in the red rises, at first slowly, then more
rapidly, and then falls again. The absorption in the neighborhood
of 6250 8. increases steadily and attains a constant value. From
pH 5 to 8 the absorption remains constant.
It was concluded,
therefore-a
conclusion corroborated
by all subsequent analysis
of the data-that
all but a negligible quantity of the copper was
bound in the form of only one complex, whose absorption curve was
H. Borsook and K. V. Thimann
681
that found in these solutions, from pH 5 to 8. This compound was
designated as neutral copper-glycine.
In alkalinities higher than pH 8 a further increase in absorption
was observed in the orange and red end of the spectrum.
This
was taken to indicate the formation of another compound, which
was designated as basic copper-glycine.
The extrapolation method
by which the absorption curve was established is described below.
All attempts to interpret the absorption curves of the solutions
more acid than pH 5 in terms of a neutral complex and of only
one acid complex failed. The increasing and then diminishing
absorption at the red end of the spectrum could be accounted for
completely only by postulating a second acid complex occurring
between the first acid and the neutral complexes.
Similar results were obtained with alanine.
In Fig. 1 are set out the final absorption spectra of the four salts.
The curve for the first acid copper-glycine
(Curve 3) was derived
from dilute acid solutions (pH 4.4 to 4.6) in which the free cupric
ion was calculated from copper electrode potentials, amounting
to 63 and 53 per cent of the total copper respectively;
the absorption due to this amount of Cu++ was deducted from the total
absorption.
The accuracy of the curve so obtained was confirmed
by the absorption of a solution containing 1 M glycine and 0.002
M copper at pH 2.05, where the large excess of glycine caused
practically all of the copper to be combined in this form.
The
absorption of the first acid complex having been thus obtained, it
was possible by means of simultaneous equations to solve, with
good agreement, the absorption curves of other solutions in the
acid range.
The general method for solving such curves is as follows:
Let
Then
x = fraction
1 _ x =
“
of total
“
“
Al = absorption
of
B1 =
“
“
A1 = total
absorption
x& + (1 - 2) B1 =
xdz
+
(1 -
x) &
=
copper
‘I
as cupric
ion
in complex
cupric
ion at wave-length
X1
copper
in complex
form at wave-length
of solution
at wave-length
Xl
A,.
Similarly
at another
wave-length,
AZ, etc.
X1
Proceeding through the visible spectrum we obtain a value for zr,
from the solutions of pairs of simultaneous equations, which will
682
Cupriglycine
and Cuprialanine
be constant throughout
the spectrum if the absorption
curves
chosen, i.e. the values of Al, A,, AS, B,, B,, B,, etc., are correct.
Values for A, At, A,, etc., were obtained from a pure copper
sulfate solution at high dilution (see Curve 1, Fig. 1). If a constant value of x is obtained for any given set of values for B1, B,,
B,, etc., the accuracy of these values for the absorption spectrum
of the unknown compound is established.
The absorpt.ion spectrum for the first acid compound so obtained was then combined with that for CuS04 to yield concordant
FIG.
1. Absorption
101
coefficients
log T . - .
c
copper
sulfate;
Curve
cupriglycine;
Curve
4,
glycine;
Curve
6, basic
curves
1
of
cupriglycine
compounds.
Extinction
at various
wave-lengths
in pg.
Curve
1,
L(cm.)
2; copper
acetate
in alcohol;
Curve
3, first
acid
second
acid cupriglycine;
Curve
5, neutral
cupricupriglycine;
Curve
7, cupriammonium
sulfate.
figures for the concentrations
of each in solutions in which the
glycine concentration varied from 1 M to 0.004 M, and the pH from
0.25 to 4.6. In spite of this concordance, it is still possible that this
curve is too high. The absorption is so near to that of the CuSO4
that spectrophotometric
data alone cannot lead to a very reliable
curve for the first acid complex.
If a lower absorption
curve
were taken, the simultaneous equations would yield different but,
within the limits of experimental error, almost concordant values
for the amounts of free and bound copper.
Further, the curve
H. Borsook and K. V. Thimann
683
given is much higher than that for the corresponding
copper-alanine, which is more firmly established.
However, there is a good
reason for this (see Section IV, b), and also the curve is supported
by the agreement between potentiometric
data for the amounts
of free copper and those calculated from the absorption spectra.
Its close resemblance to the curve of undissociated cupric acetate
is also probably significant.
The absorption
spectrum of the second acid compound was
constructed
arbitrarily,
by trial and error, to account for the
absorptions
of the solutions between pH 3 and 6. This curve
(Curve 4 in Fig. 1) was not, obt.ained unmixed with those of other
complexes in any solution.
The absolute values are accordingly
somewhat uncertain.
However,
combination of this curve with
the others satisfactorily
accounted for the absorptions of solutions
ranging from 0.5 M glycine at pH 2.9 to 0.002 M glycine at pH 7.2.
Thus the complex appears to exist in concentrated
solutions, i.e.
when glycine is greatly in excess of copper, around pH 4, and in
neutral solutions when the concentrations
of glycine and copper
are nearly the same and b0t.h very dilute.
The neutral copper-glycine
is the only form described in the
literature.
Its absorption curve (Curve 5 in Fig. 1) is based on
the absorptions of solutions at pH 5 to 8 in which the concenkat,ions of glycine varied from 0.05 to 1.0 M. Since practically all the
copper in these solutions was bound in this form, the absorptions
obtained were almost the same in spit,e of the 20-fold variation
in concentration of glycine.
This absorption curve is high$r t,han any previously
quoted
for this complex.
Thus at 6250 A., where we have found the extinction coefficient to be 47, Kober and Haw give 40, and Ley
and Vanheiden (3) give 46. The explanation of these lower values
lies in the fact that their solutions were prepared by dissolving crystals of copper-glycine
in water, with a resulting total molal concentration of glycine only twice that of the copper.
Some decomposition, therefore, occurred into the second acid form, and
to a slighter extent into free Cu++ and glycine.
The absorption
would accordingly be less than that of a solution containing only
neutral complex.
However, the form of the curve given in both
instances is the same as that given here.
The existence of a basic copper-glycine
complex was indicated
Cupriglycine
684
and Cuprialanine
from the change in absorption, clearly visible in the color of the
solutions, beyond pH 8. The absorption of this basic form was
obtained by extrapolating
the values obtained in solutions of increasing alkalinity,
containing 0.5 M glycine and 0.002 M copper
sulfate.
The quantities plotted were the excess absorption over
that of the pure neutral complex, for each wave-length measured,
7Yo
zo
700
680
Vhf--LENGTH
FIG. 2, A. Effect
cupriglycine
solutions
tine; Cu = 0.002 M,
FIG. 2, B. Same
cipitation
occurred
660
640
620
600
583
IN 7zw
of changing
H ion concentration
on the absorption
of
containing
the same amounts
of copper
and of glyglycine
= 0.50 M; acid range.
Solutions
in which
preas Fig. 2, A; alkaline
range.
are shown in broken
lines (pH 12.1 and 13.5).
against pH. The curves so obtained were of the form of dissociation curves, and flattened rapidly towards pH 11.1. From each
the absorption at one wave-length was taken, and the resulting
extrapolated curve for the basic complex is Curve 6 in Fig. 1.
By combining this curve with that for the neutral compound it
was possible to solve wit’h good agreement, the absorption curves
H. Borsook and K. V. Thimann
685
of solutions in which the pH varied from 8.05 to 13.5 and the glytine concentration
from 0.06 to 0.5 M.
The diminishing absorption beyond pH 11.1, shown in Fig. 2,
B, is due in part at least to the precipitation
of inorganic cupric
hydroxide,
since filtration of these solutions left a visible pale
blue precipitate on the paper. Kjeldahl analysis of this precipitate showed it to be free of nitrogen.
The curves in this pH region are therefore dotted in Fig. 2, B.
(b) Potentiometric
First
Data and Constitution
Acid Complex-In
Table I are collected the data from
measurements,
and the calculations of m and r for the first
acid copper-glycine;
i.e., the number of molecules of glycine combined with 1 of copper, and the number of hydrogen ions set free
in the formation of 1 molecule of complex.
The data indicate
that in this complex 2 molecules of glycine combine with 1 of
copper, liberating 1 hydrogen ion.
In the calculation of the instability
constant (Column 11) the
concentrations
of free Zwitter Ion glycine (Column 8) and not of
total uncombined glycine were taken.
This procedure is based on
the observations shown in Fig. 2, and discussed in Section I, c, that
complex formation progressively
diminishes with suppression of
ionization of the carboxyl group and disappears at high acidity;
i.e., only the Zwitter Ion glycine participates in this equilibrium.
The absorption spectra of the first two solutions in Table I were
analyzed algebraically as described above, and the resulting concentrations of cupric ion and complex are given in Columns 4 and
5. Of the remaining four solutions, in one pair the pH was the
same, but the glycine concentrations
were different, while in the
other the concentrations
of glycine were the same, and those of
hydrogen ion different.
Since it is not possible to decide, a
priori, the value of r, values of m were calculated for different
values of r = 0, 1, and 2, respectively.
From Column 10 it is
clear that only when r is taken equal to 1 is a concordant value,
2, obtained for m.
The values for the instability
constant K are different for each
pair of experiments.
This variation is due in the first pair to the
uncertainty
of the pH values, which were obtained colorimetritally, and in the other solutions is probably due to hydrogen ion
E.M.F.
(2)
volt
(3
E.M.F.
1.P
2.0*
2.24.t +0.0206
2.25t+0.0067
1.97t -0.0048
2.27t -0.0070
-~
PH
CU
electrode
mol
(4)
cu++
in alI
0.0014 s
O.CM@4 S
0.00020
0.00059
0.00145
0.00058
of &So4
-2.85
-3.08
-3.70
-3.23
-2.84
-3.24
Loa
SOhtiOnS
of m, r, and
M,
mol
(5)
Log
-3.24
-2.94
-2.74
-2.85
-3.26
-2.85
--
Cu in complex
o.C%!
I
0.50
0.50
0.20
0.10
0.40
0.40
md
(6)
Total
glycint
-
--
t
-
(I%+)’
(GZycine*)m
TABLE
(CuGZycine,)
0.00058S
0.00116 S
0.00180
0.00141
0.00055
0.00142
=
K for
* = pH determined calorimetrically;
error f 0.2.
t = pH determined by glass electrode; error =t 0.02.
S = from analysis of absorption spectra.
G 7
G8
G 22
G 23
G 41
G 42
(1)
Solution
NO.
Concentration
Values
(Cu++)
20
30
44.8
45.4
29.2
46.3
per em
= K for
Acid
Values
Glycine
of m
(9)
r=O r=l
I Log --moz
(8)
Free glycine*
First
fO.lE
f0.2C
-0.82
-0.8:
to.51
t0.4c
1.4
1.6
0.15
0.14
3.2
2.5
E.
E
R
6
zt.
ft%
E
H. Borsook and K. V. Thimann
687
liquid junct,ion potentials.
Since the value of m is based only on the
difference in potential between two members of a pair, it is probably
unaffected by this junction potential, which will be nearly the same
in each member of the pair. The possibility discussed above, of
the existence of still another complex in this pH region, may also
be responsible for variations in the value of K. The agreement
previously
found between absorption
curves indicates that the
range of stability within which this other complex exists, if it
exists at all, is very narrow.
The present data, therefore, point to the conclusion that the
compound whose absorption spectrum is Curve 3 in Fig. 1, and
to which the values of m = 2, and r = 1 apply, is the principal one
found in high acidity.
Second Acid Complex-The
conditions under which the second
acid copper-glycine
exists are too rest.ricted to allow of any reliable determination
of the values of m and r by these methods.
It appears within only a narrow range of hydrogen ion and glycine
concentrations.
The minimum variation in glycine concentration
necessary for a reliable determination
of the value of m causes this
compound to disappear in one or other of the solutions.
At pH 6,
and with glycine concentrations
varying from 0.002 to 0.005 M,
the absorption spectra indicated that the principal compound was
this second acid complex.
The value deduced for m from a few
measurements
made on these solutions was between 2 and 3;
and the power of (H+) was apparently fract.ional; i.e., 1 H ion
was released by the formation of 2 or more complex cupric ions.
The absorption curve of the second acid copper-glycine is nearly
identical with that of the second acid copper-alanine.
The constitution of the latter compound seems to be firmly established as
Cufalanines.
From this identity the constitution
of the second
acid copper-glycine may be taken to be similar; i.e., Cuzglycines.
Such a constitution would account for the effect of dilution favoring the second acid compound instead of the neutral complex
whose formula is Cu glycinez, since the compound containing fewer
amino acid molecules to 1 of copper would be more stable at lower
total amino acid concentrations.
This is discussed below in connection with neutral and basic alanine.
Neutral Complex-The
data and the calculations of m and r for
the neutral copper-glycine are set out in Table II. The data fall
E
x 10-a 8.00
1.0
G 48 0.0010.148
8.301
X 1O-a 3.301
X IO6.28t
6.137
“
0.16
0.10
0.20
6‘ 0.10
x 10-a
0.0212.322
---_-mol
0.0962.982
0.1961.292
x 10-a 0.1561.193
X10-3
4
4
X 10-a
x 1O-a 0.0962.982
4
4
3.98 X 1O-a 0.0462.663
3.7
mols
Copper-Glycine
Mean value of m from Solutions G 43, G 44, G 45, and G 46 (pHz - pH1 = 0) = 2.1.
In Solution G 47, K = 0.25; in Solution G 48, K = 0.23.
* = by electrometric
and calorimetric
methods described in the text.
t = by glass electrode in solution containing copper.
2
8.60 2
X IO-
4.0
G 47 0.0010.130
5.5”
x 10-a 3.301
1.05 x 10-e 6.02 2
5.5*
x 10-a 3.301
‘I 0.05
5.5*
Totai
ionized
dytine
1.99 x 10-a 3.299
G 46 0.01 0.118
5.14
Cu
M.
mol
5.5* ca. 0.02!
Bound
= 0.002
= K for Neutral
II
mozs
1.87 X 10-S 3.272
4.17 X 10-B 6.62 2
1.38 x 10⁻⁶
mols
1.29 X 10m4 4.11
Free Cu++
of Gus04 in all sohrtions
0.100
0.084!
G 44 0.01
G 45 0.01
0.056
volt
G 43 0.k
Concentration
TABLE
(Cu++) (GZycine)*
G47+
G 48
r=l
G 43 +
G 44
G43 +
G 45
G44 +
G 45
G44 $
G 46
1.8
7=2
1.5
2.9 G45 + 1.9
G 46
2.3 G 43 + 2.3
G 46
1.6
H. Borsook and K. V. Thimann
into two groups.
In Solutions G 43 to G 46 the pH was obtained
calorimetrically
and the cupric ion concentrations
given cannot
be considered, therefore, as absolute values.
However, the differences in potential correspond to actual differences in cupric ion
concentration, and the value obtained for m, which is derived only
from these differences, we therefore consider reliable.
In Solutions
G 47 and G 48 the hydrogen ion concentrations
were measured by
means of the glass electrode in the final solutions containing copper,
and the pH of the standard CuSO* solution was adjusted to 6.1.
The data obtained from these two solutions are therefore the most
trustworthy.
Both groups of data indicate clearly that the value
of m is 2, agreeing with the constitution found for the crystals of
neutral copper-glycine
in the literature.
On the other hand, these data do not permit of a decision regarding the value of r, since the hydrogen ion concentrations
were
maintained constant, or varied only slightly, in order to calculate
m. When m = 2 is substituted
in the mass law equation and the
data of Solutions G 47 and G 48 are used, a value of 1.1 is obtained
for r, but the pH difference is too small for this value to be relied
upon. Larger differences in pH are not experimentally
feasible
here, since it would then be impossible to estimate the true copper
electrode potential difference on account of the varying and unknown hydrogen ion liquid junction potentials.
This difficulty
was circumvented
by measuring the change in hydrogen ion concentration after the addition of CuS04 to an isoelectric solution
of the amino acid containing 0.1 M KzS04. The increase in hydrogen ion concentration
plus the hydrogen ions absorbed by the
glycine corresponds to the number of hydrogen ions released in
the formation of the copper complex.
The ratio of the number of
hydrogen ions released to the number of molecules of copper
known to be bound gives the value of r. The changes in hydrogen
ion concentration
were measured by means of the glass electrode.
The procedure was as follows: 0.1 M CuS04 was added from a
micro burette to 25 cc. of 0.5 M glycine in 0.1 M K,SO,, initially
present in the glass electrode vessel.
After each addition, with
continuous, thorough stirring by means of a current of nitrogen, 3
to 5 minutes were allowed for the attainment of a steady potential which did not drift more than 0.3 millivolt during this interval.
These potentials were converted to pH values by means of a
690
Cupriglycine
and Cuprialanine
graph constructed from the glass electrode potentials of a series of
phthalate buffers extending between pH 3.6 and 6.1. The graph obtained was a straight line so that no uncertainty was incurred in interpolation.
I& slope at 23” was found to be 57.6 millivolts per
unit difference in pH. At the end of the titration, which as a rule
occupied about an hour, the constancy of the glass electrode during the titration was checked by measuring again the potential
of one or more of the buffer solutions.
The change was never
more than 0.3 millivolt.
TABLE
Number
of Equivalents
III
of Hydrogen
Ions Set Free
Copper-Glycine
25 cc. of 0.5 M glycine
containing
0.1 M KdOa
T
0.1 M
2Ei
Glycine
in
undissociated
form =
cc.
mol per 2.
0
0.3
0.4
0.5
0.6
0.7
0.8
1.0
0
0.00119
0.00158
0.00196
0.00234
0.00272
0.00310
0.00385
were
initially
Total (H+)
liberated
(4) + (5)
PH
@+I
(3)
(4)
(5)
(‘3
mol per 1.
mol per 1.
no1 per 1.
boYf
(2)
in Formation
6.04
4.90
4.77
4.65
4.58
4.52
4.47
4.38
0.0000126
0.0000170
0.0000224
0.0000263
0.0000302
0.0000339
0.0000417
iH”
0.00131
0.00177
0.00231
0.00271
0.00308
0.00345
0.00418
0.00132
0.00179
0.00233
0.00274
0.00311
0.00348
0.00422
of Neutral
present.
Ratio
(H+) set free
Complex
formed
@
(2)
(7)
1.1
1.1
1.2
1.2
1.1
1.1
1.1
The total concentration of bound copper in the neutral complex
form (Column 2, Table III) was taken as equal to the amount
added. The error so incurred is negligible at this pH, when the
glycine, as it is here, is greatly in excess of the copper.
The undissociated glycine (1 - (Y) in Column 5 was calculated on the
basis of a Zwitter Ion pK, of 2.33, and a value of m for the neutral
complex of 2. Column 7 shows that 1 hydrogen ion is liberated
When 1
when 1 cupric ion is bound as neutral copper-glycine.
is used for the value of r, the instability
constant K, from the
data of Solutions G 47 and G 48 in Table II, is 0.24.
Basic Complex-We
were unable to obtain cupric ion measurements of sufficient reliability at alkalinities
at about pH 11 to
H. Borsook and K. V. Thimann
691
attempt determinations
of m, r, and K for the basic complex.
The following facts can be deduced about it, however.
First, the peak of absorption is still in the orange, though shifted
some 400 A. towards the red (cf. Curves 5 and 6, Fig. 1). This
may be taken to indicate that whatever inner complex structure
is assigned to the neutral complex, that assigned to the basic
complex cannot be very different in type, the difference being
probably quantitative rather than qualitative.
Secondly, the
ratio of concentrations of neutral and basic complexes present in a
mixture, at any one pH, is not largely influenced by changing the
TABLE
Dependence
of Relative
Amounts
Hydrogen
IV
of Neutral
of Basic
and
Concentration
Ion
Per cent tots1 glyoine
PH
NHI’
Total
glycine
CHz
/
I-
Per cent tots1 cu a8
NH2
CHs
\
in
on
Copper-Glycine
/
\
cooform
cooform
98
98
98
92
92
78
47
27
4
2
2
2
8
8
22
53
73
96
Basic
copperglycine
Neutral
copperglycine
mol per 1.
8.05
8.1
8.1
8.7
8.7
9.2
9.8
10.2
11.1
0.5
0.05
0.002
0.5
0.05
0.1
0.5
0.5
0.5
94
99
100
85
90
79
41
29
12
-
6
1
0
15
10
21
59
71
88
concentration of amino acid (see Solutions 2 to 5, Table IV).
This fact indicates that the number of molecules of glycine per
molecule of copper is the samein both these complexes. The third
point is that, within the limits of accuracy of the pH determinations
and absorption measurements involved, the ratio of concentrations
of basic and neutral complexes present in a mixture is the same as
the ratio of concentrations of basic and neutral forms of glycine.
In Table IV the amounts of the two complexes were obtained by
algebraic treatment of the absorption curves, and the proportion
of glycine in the basic form is calculated from the pK of 9.75.
692
Cupriglycine
and Cuprialanine
It is clear that these proportions agree with the proportions of the
basic complex present.
In the absence of confirmatory
data,
therefore, the simplest interpretation
would be as follows: the
neutral complex is formed from 2 molecules of glycine and 1
cupric ion, with elimination of 1 H ion; the basic complex is formed
from this by elimination of a 2nd H ion. That is
[ ;;;I:-;;;;;]
+ cu++ ---f [TV++]
[ ::$gy
+ H’ (neutral complex)
+ H+ (basic complex)
This formulation agrees with the finding that the equilibrium between these two complexes is controlled only by the pH and is uninfluenced by the amino acid concentration. The absorption
spectrum to be expected would still be of the same general type,
though with some change corresponding to the change in charge.
IV.
Cupric Salts of Alanine
(a) Absorption Spectra
As with glycine, the absorption curves indicated the existence
of four copper-alanine complexes, two in the acid, one in the neutral, and one in the alkaline range of pH. In Fig. 3 the absorptions in the visible spectrum of the four compounds are set out and
compared with those of copper sulfate (i.e. cupric ion), undissociated copper acetate, and cupriammonium sulfate.
In acid solutions the absorption due to the complex was obtained, as with glycine, by determining the free cupric ion with
the copper electrode and subtracting the absorption due to this.
The extinction coefficients were then computed, the concentration
of complex being that of the total copper minus the free cupric ion.
The absorption for the first acid complex was derived from the last
four sets of measurements in Table V, the absorption spectra of
these solutions being taken at the same time. The curve for the
second acid complex was obtained from solutions in which the
pH varied from 2.0 to 4.0 and the alanine concentration from 0.005
t0 0.5 M.
H. Borsook and K. V. Thimann
693
The absorption curve for the neutral complex is the mean from
a large number of solutions in which it was clear that only this
complex was present.
Twelve solutions, in which the pH varied
from 6.5 to 11.1 and the alanine concentration from 0.5 to 0.07 M,
gave practically identical absorptions.
Fig. 4, which is the alanine analogue of Fig. 2, shows the change in absorption with pH,
at constant concentrations
of copper and alanine, and also shows
the relative constancy
of the absorption
in the neutral range.
730
?I0
690
670
650
630
MvE-LENGTH
6/O
i~d.f-ct
590
570
550
530
3. Absorption
curves of cuprialanine
compounds.
Extinction
co101
1
efficients, log - . - . __
at various wave-lengths
in pp. Curve 1,
I
c L (cm.1
copper sulfate; Curve 2, copper acetate in alcohol; Curve 3, first acid cuprialanine; Curve 4, second acid cuprialanine;
Curve 5, neutral cuprialanine;
Curve 6, basic cuprialanine;
Curve 7, cupriammonium
sulfate.
FIG.
Curve 6 in Fig. 3 is the mean of the twelve curves thus obtained.
With this curve and those of the first and second acid complexes,
together with the curve for CuSOa, it was possible to account for
the absorptions of all the other solutions in the acid range up to pH
6.8, and with alanine concentration from 0.002 to 0.5 M, the copper
being always constant at 0.002 M.
In alkaline solutions the change in absorption with pH was
different from that found with glycine. As Fig. 4, B shows, with
694
Cypriglycine
and Cuprialanine
alanine 0.1 M very little increase in absorption occurs even up to
pH 11; i.e., the basic compound either has an absorption curve
similar to that of the neutral compound or else is not being formed
at this dilution,
The latter alternative is the true explanation,
for at pH 11.1 the absorption in the red steadily increased as the
M/AK-LENGTHN
-w
FIG. 4, A. Effect
of changing
H ion concentration
cuprialanine
solutions
containing
the same amounts
nine; Cu = 0.002 M, alanine
= 0.10 M; acid range.
FIG. 4, B. Same as Fig. 4,A; alkaline
range.
on the absorption
of
of copper
and of ala-
alanine concentration was increased. Fig. 5 shows this change
from a 7 times excess of alanine over copper concentrationwhich gives a curve almost identical with that of the neutral
complex-to a 500 times excess. The absorption of the solution
containing 500 times excess alanine over copper was the same as
that of a solution containing 0.001 M copper and 0.9 M alanine,
H. Borsook and K. V. Thimann
695
i.e. a 900 times excess, at the same pH.
This curve was therefore
considered to be that of the pure basic complex.
Its accuracy
was corroborated
by the concordant
results obtained when it
was employed, with the absorption curve of the neutral copperalanine, in the analysis of the absorption of all other solutions in
the alkaline range. In extreme alkalinity,
as with glycine, precipitation
occurred,
and the absorption
was correspondingly
lowered.
Comparison of Figs. 4, A and 4, B with Figs. 2, A and 2, B
shows that the change of absorption with pH in the acid ranges is
very similar with alanine and glycine, while in the alkaline range
730
670
650
630
610
590
570
3-o
WAG-LENGTH IN -t/-u
FIG. 5. Effect of increasing
alanine concentration
at constant pH =
11.1, Cu = 0.002 M. Curve 1, &nine
0.016 M; Curve 2, alanine 0.20 M;
Curve 3, alanine 0.50 M; Curve 4, alanine 1.0 M; Curve 5, neutral cuprialanine (cf. Fig. 3).
a considerable difference is noticeable.
is further discussed below.
The significance of t,his
(b) Potentiometric Data and Constitution
First Acid Copper-Alanine-The
values of m amd r for this
complex were obtained from the data in Table V. A concordant
and reasonable value for m was obtained only when r was taken
equal to 0; m is then clearly 2. This complex therefore differs
from the first acid copper-glycine, in which 1 hydrogen ion is released. A corresponding difference appears in the absorption
curves of these two complexes. The curve of cupric alanine, for
Q,
8
0.002
0.002
0.002
0.002
0.002
0.002
~__
no1
~g$
0.001
0.001
0.001
0.001
moz
mlutior
cp++
+-
-0.0031
t-0.010
to.030
to.014
volt
electrode
E.M.F.
Calculation
0.00066
s
0.0005 s
0.00126
0.00046
0.000096
0.00033
?lLOZ
K for
mol
21.82 0.00134
4.6990.0015
3.10 0.00074
4.66 0.00154
5.98 0.00191
4.52 0.00167
--__
of m, r, and
--
mol
Cy++
??bOZ
&$lso,ution
7 = pH
determined
A 103 0.0020.001
A 104 0.0020.001
A 106 0.0020.001
.
~~ta4
u
by means
moz
nZOZ
Bound
K for
of glass
electrode
3.2350.00028
3.1700.00052
4.88
0.00124
Log
-~--
Free Cu++
of a, m, r, and
-0.00700.00172
-0.00510.00148
-0.00360.00076
vozt
01
electrode
E.M.F.
Calculation
V
--__-?TLOZ
on final
solution
containing
copper.
mol
FrFkGFd
Acid
in text.
3.308
3.491
3.771
Ia3
A
A
A
A
34
33
34
34
A
A
A
A
33
31
31
32
A 103 + A 104
A 104 + A 106
A 103 + A 106
From;~hm
+
+
+
+
A 20 + A 21
Copper-Alanine
2.491
2.568
2.431
2.857
i.204
2.792
Copper-Alanine
WLOZ
0.031
0.037
0.027
0.072
0.16
0.062
--
Acid
Second
??ZOZ
Bound
alanine
a=2
m=3
= K for
??ZOl
Total
$.anine
mnized
0.003
0.003
0.001
0.003
0.004
0.003
P?ZOZ
First
as described
0.034
0.040
0.028
0.075
0.16
0.065
VZOZ
= K for
~.4474.00t0.00250.002450.000420.00263
4.7163.88t0.004
0.003880.000780.00310
3.0933.92t0.008
0.007760.001860.00590
Log
PH
,~ao$&
VI
0.1
0.1
0.25
0.25
0.5
0.5
mol
(H+)p
(Alanine)”
TA4BLE
calorimetrically
(Cu,AZanine,)
Cu
-~--
‘3.1272.05*
3.1762.5*
4.8691.40t
3.1881.971
3.2811.99t
3.22
1.51t
(CU++)~
S = from analysis
of spectrophotometric
data only.
* = determined
by means of hydrogen
electrode
and
t = determined
by means of glass electrode.
20
21
34
33
31
32
Solution
A
A
A
A
A
A
Solution
NO.
-
TABLE
(Cu++)
(AZanine)m
(CuAlanine,,
~H+,~
2.7
3.3
3.1
?n
r=l
a=2
1.8
2.2
2.0
2.2
9
9.5
9
KX107
4.7
4.6
12
15
14
8
x 101
H. Borsook and K. V. Thimann
697
which T = 0, is very low in the visible spectrum, resembling the
curve of CuSO+ while that for the copper-glycine, for which r =
1, is much higher.
The former approximates the curve of a simple
salt; the latter that of a “complex.”
The values of K derived from spectrophotometric
data (Solutions A 20 and A 21, Table V) are distinctly lower than those derived from potentiometric
measurements.
Probably, as in the
case of glycine, the discrepancy is due to the hydrogen liquid junction potentials.
However,
the variation in the value of K, in
view of the experimental difficulties in these solutions, is not great,
and its mean value may be taken to be close to 1 X 10W3.
TABLE
Calculation
of Number
of Hydrogen
Acid
Alanine
--
(1)
PH
after
sddition of
0.002 M
cuso4
(2)
(H+)
(3)
Fra:F
Lw
l--a=
pK:
VII
Ions Released
Copper-Alanine
&nine
undisaocirtted
1-a
(5)
pB
(4)
-I
dif:d
0
(3) + (6)
(6)
(7)
3.98
3.99
3.99
3.90
3.94
3.80
3.84
0.000105
0.000099
0.000102
0.00013
0.00012
0.00016
0.00014
0.022
0.022
0.022
0.026
0.024
0.033
0.030
2.35
2.34
2.34
2.43
2.39
2.53
2.49
m&l
bo&
(8)
of Second
(Hf)
Ratio
*et free
&I In complex
jg
(8)
(9)
-1-I
mol per 1.
0.0020
0.0025
0.0040
0.0040
0.0050
0.0080
0.0100
Formation
T;iM&+)
al;zne
-I
in
mot per 2. moz per 2.
0.0000440.0001490.00038
0.0000550.0001540.00028
0.0000880.0001900.00049
0.0001040.0002340.00052
0.00012
0.00024
0.00054
0.0002610.0004210.00124
0.00030
0.00044
0.00085
0.4
0.6
0.4
0.5
0.5
0.4
0.5
Second Acid Complex-The second acid alanine complex presented the same difficulty as the corresponding glycine compound;
i.e., the restricted range of concentrations of amino acid and of
hydrogen ion in which this form exists free of other complexes.
After a number of trials a few solutions containing only this
compound in equilibrium with cupric ions were obtained. The
resulting data are given in Table VI. Concordant values for m,
r, and K were obtained only when the reaction was taken to be
Cu&ninef++
+
H+
= 2Cu++
+
3alanine
*
(i.e., m has the value 1.5, or is 3 if a = 2, where a is the number of
Cu atoms in the complex. Also, if Q = 2, r = 1).
698
Cupriglycine
and Cuprialanine
Further corroboration
of this formula is found in the results of
direct estimation of the hydrogen ions set free when this complex is
formed (Table VII).
The hydrogen ion activities in these solutions were measured by means of the glass electrode, free cupric
ion concentrations
by means of copper electrode potentials.
Spectrophotometric
measurements
showed that the major part of the
bound copper was in the form of the second acid complex.
The
ratio of t’he numbers of hydrogen ions set free to cupric ions bound
(Column 9) is clearly 0.5; i.e., if a = 2, r = 1.
The absorption
curve of the second acid copper-alanine
is
nearly identical with that found by trial and error for the corresponding copper-glycine.
This coincidence suggests, as pointed
out above, that the constitution
of the latter compound is similarly Cuzglycines.
The findings, mentioned above, that for the
second acid glycine complex, T, the power of (H+), appeared to be
fractional and that m appeared to be of the order of 2 or 3, also
support this formula.
In the absence of other evidence, we have
therefore assumed it to be correct.
Neutral Copper-Alanine-The
electrometric
data for the neutral complex (Table VIII) fall into two groups: those derived from
solutions at pH about 6.8, and those at pH 7.9. The hydrogen
ion liquid junction potentials are again probably responsible for
the discrepancy in the values of K. The value of m is either 2.5
or 3; i.e., the complex has the constitution
Cu alanines or CUZ alanines. In either case, the direct estimation of the hydrogen ions
set free in the formation of this compound, given in Table IX,
shows unequivocally that 1 hydrogen ion is set free for each cupric
ion bound.
In this respect the complex resembles the corresponding copper-glycine.
The power of (Hf) was accordingly
taken
as 1 in the calculation of m in Table VIII.
The absorption curve
of this complex is somewhat higher than that of the neutral copperglycine, though the maximum is in nearly the same part of the
spectrum.
A possible explanation for these facts is that the higher
absorption of neutral copper-alanine is due to the larger number of
molecules of amino-acid relative to copper in its composition, but
that the number of nitrogen atoms attached to copper, which according to Kober and Haw governs the position of the peak of absorption, is the same in the two compounds.
Basic Copper-Alanine-The
basic alanine complex is much
A
A
A
A
--
+0.100
+0.0835
+0 .0728
+0.0427
+O. 156
+o. 110
+0.050
volt
CU
electrode
E.Y.F.
measurements
10-b
10-s
i 10-t
10-b
10-S
10-S
10-5
mols
Cut+ in
standard
solution
t = pH
116
117
118
119
A 115
A 114
Solution
NO.
2.0
5.37
4.47
2.04
3.47
4.17
made
Calculation
r for
.I
mol
(Cu,
TABLE
,
3.301
3.301
3.301
3.301
3.301
3.301
containing
copper.
0.0060.094
0.0060.244
0.0060.0565
0.0060.0096
0.0060.194
mol
Neutral
0.0060.394
mol
= K for
md
6.89tO.l
7.91t0.25
7.93tO.0625
7.89t0.0156
6.81t0.2
6.71t0.4
(H+)’
mixtures
AZaninem)
,*,
VIII
a ( AZanine)m
in final
0.002
0.002
0.002
0 002
0.002
0.002
electrode
6.30
iT.73
9.28
7.31
7.54
8.62
.-----~-___
glass
10-6
lo-”
10-Q
10-7
lo-’
10-g
with
x
x
x
X
x
x
mols
Free cu++
of a, m, and
(Cu++)
2.973
T.387
2.752
3.982
T.288
T.596
A
A
A
A
115
117
117
118
+
+
+
+
A
A
A
A
116
118
119
119
A 114 + A 116
A 114 + A 115
Copper-Alan&e
2.6
2.5
2.5
2.6
3.0
3.3
m
r=l
1.3
1.0
0.8
1.3
-1.5
-1.2
-1.8
-1.2
-2.1-1.1
0.9
0.8
m = 3 m=2.5
-~
Log K
Cupriglycine
700
and Cuprialanine
more sensitive to changes in the concentration of amino acid than
is the basic glycine compound.
At pH 11.1, increase in the concentration of alanine from 0.2 to 1.0 M changed the amount of the
basic complex (by analysis of the curves in Fig. 5) from 25 to 100
per cent of the total copper.
This indicates that the number of
TABLE
Number
oj Equivalents
Experiment
(1)
I
II
Cu in
complex
formed
;“f,$
Set Free
on
Formation
I. 25 cc. of 0.4 M alanine containing 0.1 M
II. 25 “ “ 0.5 “
“
‘I
0.1 “
“
Experi
merit
No.
IX
of Hydrogen
Ions
Copper-Alanine
(2)
(3)
__~-~__
:, 0.1 M moZpt?rl.
FraiP
pH
(4)
@+I
(5)
moz per 2.
alanine
,~c$ed
l--or
(6)
Neutral
ILSO~.
“
Ratio
(H+) set free
Total (H+ )
:omplexformed
set free
i
so&ted
(5) + (7)
<s,
(3)
(9)
(7)
(8)
-moz per 1. moz per I
fz6i-e
0.20
0.30
0.40
0.50
0.60
0.70
0.80
1.00
6.08
0.000795.020.00000960.002040.0008130.00082~3
0.001184.850.00001410.003070.00120 0.00121
0.001574.720.00001910.004070.00162 0.00164
0.001964.620.00002400.005100.00203 0.00205
0.002344.540.00002890.006130.00242 0.00245
0.00272 4.46 0.00003470.00735 0.00290 0.00293
0.003104.410.00003890.008260.00324 0.00328
0.003844.330.00004680.010000.00385 0.00390
0.30
0.40
0.50
0.60
0.70
0.80
0.001185.070.00000850.001820.00091
0.001574.880.00001300.002810.00138
0.001964.760.00001740.003700.00181
0.002344.670.00002140.004550.00221
0.002724.600.00002510.005340.00260
0.003104.550.00002820.005990.00292
0
of
0
0.00092
0.00139
0.00183
0.00223
0.00263
0.00295
-
1.04
1.03
1.04
1.04
1.05
1.07
1.06
1.02
0.78
0.89
0.93
0.95
0.97
0.95
Mean 0.99
molecules of alanine bound to 1 of copper is not the same in the
neutral and basic compounds.
From the expressions
(Cu) (alanine)"
= K, for the neutral complex
(Cu alanine,) (H+)r'
and
(Cu) (alanine)u
- = Ka for the basic complex
(Cu alanine,,) (H+)r"
H. Borsook and K. V. Thimann
701
it follows that at any one pH, where both complexes are present,
the term for Cu ion vanishes, and the expression
(Cu alanine,)
(Cu
is obtained,
= k . (alanine)u-2
. (Hf)l’-7”
alanine,)
-where k = 2.
Hence at constant
pH, if y is greater
than x, the proportion of basic to neutral complex will become
greater with increasing alanine concentration.
This is, in fact,
what occurs, so that the value of m for the basic copper-alanine is
therefore greater than 2.5 or 3, according to which figure is taken
for the neutral complex.
In the case of glycine the distribution
of
copper between neutral and basic complexes was shown above to
be almost independent of amino acid concentration,
and hence it
was concluded, by similar reasoning, that the number of molecules of glycine bound by 1 of copper is the same in the neutral as
in the basic complex.
V.
DISCUSSION
(CL) Constitution
of Complexes
The properties of the eight complexes described here are summarized in Table X, with their ranges of stability,
empirical
form&e, and references to the data. We have not set down definite structural
formulae because we feel that the data so far obtained are insufficient.
Nevertheless,
certain deductions may be
made regarding their structure from the characteristic
absorption
spectra of the four types of compounds formed, on the basis (a)
of the rule proposed by Kober and Haw, and (6) of a second rule
suggested by our observations,
that the height of an absorption
curve, without reference to its position in the spectrum, is greater
the larger the number of amino acid molecules in the complex.
The spectra of the first acid complexes show a low absorption in
the visible portion limited to the red and orange (Figs. 1 and 3).
By application of the above rules, the copper in these compounds
therefore is linked only to the oxygen atoms of the carboxyl
groups; i.e., they approximate undissociated
salts. The peaks of
their curves are presumably far in the infra-red.
The maximum
absorption of the second acid complexes, on the assumption that
58,
8.
“
Basic
58,
“
Neutral
,,,a
“
“
2nd
//
1st acid alanine
“
Basic
“
glycine..
“
Neutral
2nd
,,
.
,
. .. .
. .
. .. .
.
. .. .
3
3
3
1
1
1
,./
5
,,
,
Figs. 3,
“
“
“
“
“
“
Fig. 1
v
II,
.I
Tables VI,
VII
Tables VIII,
IX
((
Table IV
Tables
III
Table I
(3)
(1)
.
Formula
Complex
1st acid glycine..
TABLE
X
(4)
of stability
pH 2.56; favored by
dilution
pH 5-9; in dilute solutions to pH 11
pH 8-11; only in concentrated solutions
pH 2-5; in high dilu
tion, up to pH 7
pH 5-8; overlapping
basic complex to pH
10.5
pH 8-12; not affected
by dilution
Ca. pH 0.5-2.5
Ca. pH 0.5-2.5
Range
Summary of Copper Complexes of Glycine
Cu alanines or
Cuzalanines
Cu alanineF$
Cmalaninea
Cu alanine
Cu glycinez
Cu glycinez
Cuzglyciner
Cu glycinez
(5)
Probable
formula
of complex
and Alanine
- -
2
1
0.5
0
2
1
0.5
1
(6)
CU
bound
H ions
set free
13er atom
(7)
characteristics
“ 6700
“
at 6250 A.
Very low absorption;
about half that of
1st acid glycine and
close to that of cupric ion
Exactly similar to 2nd
acid glycine
Peak at 6200 d.; higher
than neutral glycine
Peak at 6460 A. ; higher
than basic glycine
“
“
Curve similar to Cu(0Ac)z in alcohol
Peak just in infra-red
Absorption
H. Borsook and K. V. Thimann
the form of all the curves is the same, may be taken to be in the
very near infra-red.
This suggests the first appearance of a
Cu-N
bond, which the liberation of 1 hydrogen for every 2 cupric
ions bound also indicates.
In the case of both neutral complexes
1 hydrogen ion is released for every cupric ion bound.
The number
of Cu-N
bonds of this type is therefore twice as great as in the
second acid compounds, which is in accord with the o!served
shift of the absorption maximum to approximately
6200 A.
As indicated in Column 5, Table X, an unexpected difference
occurs between glycine and alanine in the number of amino acid
molecules bound per atom of copper in the neutral and probably
Tentatively
we have interpreted the
also in the basic complexes.
higher absorption of the alanine compounds to be due to the larger
number of amino acid molecules in the complex.
(b) Application
to Donnan Equilibria
It is probable that the variety of complexes formed by protein
with bi- and polyvalent cations is at least as great as that found
between copper and glycine and alanine. This phenomenon complicates the calculation of Donnan equilibrium
relations with
proteins.
Since the type and extent of complex formation as in
the case of amino acids probably varies throughout the whole pH
range usually studied, a continually varying correction is necessary for the ions bound in undissociated
complexes to the protein.
This must be one of the factors responsible for the divergence of
the values for the ratios of the calcium concentrations
on two sides
of a semipermeable membrane from those calculated by means of
the unmodified Donnan equation when protein is present on one
side (20). Complex formation
probably accounts also for the
findings of Pincus and Kramer (21) who showed that though the
distribution
of the monovalent ions between cerebrospinal
fluid
and serum was in accord with the Donnan equilibrium, the calcium distribution
was markedly different.
There are indications that this complication of simple Donnan
equilibrium relations by complex formation occurs even with monovalent ions (22). Since complex formation occurs least in highly
acid solutions where ionization of the acid groups is suppressed,
it would be expected that in this zone simple Donnan equilibrium
relations would hold best. This has, in fact, been observed by
704
Cupriglycine
and Cuprialanine
Bonino and Garello (23) in their study of Donnan equilibria between ovalbumin and cobaltous salts. At low pH values, the Donnan relation was found to be obeyed; as neutrality was approached,
the divergence of the ion concentrations
from the calculated values
became progressively
greater.
SUMMARY
1. The equilibrium relations existing in solution at room temperature between cupric ions and glycine and alanine have been
studied by measurement of the absorption in the visible spectrum,
and by copper electrode potentials, through a range of hydrogen
ion concentrations from pH 0 to 13.
2. The variations
in absorption
indicate the existence of at
least four types of complexes with both glycine and alanine. According to the range of hydrogen ion concentration
in which each
predominates they have been designated as first acid, second acid,
neutral, and basic complexes.
The approximate
ranges of hydrogen ion and relative amino acid concentrations,
in which
each type of complex predominates, are delineated.
3. The absolute absorption
spectra, in the visible region, of
each of the eight complexes in a pure state have been determined.
In some cases t,hese were obtained directly, in others by deduction
from mixtures.
From these curves the absorption spectra of all
the mixed systems examined could be derived.
4. The constitution of these eight compounds has been deduced
from potentiometric
and spectrophotometric
data. Of these the
constitutions
of the second acid glycine, neutral alanine, and basic
alanine are uncertain.
5. The number of hydrogen ions set free in the formation of all
except the two basic compounds was estimated.
The orders of
magnitude of the instability
constants of the first acid and neutral copper-glycines
and of the first acid, second acid, and neutral
copper-alanines were determined.
6. The significance is discussed of the phenomena described here
in Donnan equilibria involving proteins.
BIBLIOGRAPHY
1. Ley, H., 2. Elektrochem.,
10, 954 (1904).
2. Ley, H., and Hegge, H., Ber. them. Ges.,
allgem. Chem., 164,377 (1927).
78, 70
(1915); 2. anorg. U.
H. Borsook and K. V. Thimann
705
3. Ley, H., and Vanheiden,
F., 2. anorg. u. allgem.
Chem., 188, 240 (1930).
4. Barker,
J. T., Tr. Faraday
Sot., 3, 188 (1907).
5. Frankel,
M., Biochem.
Z., 21’7, 378 (1930).
Lewis,
W. C. McC.,
Chem.
Rev.,
8, 81 (1931).
Hoskins,
W. M., Randall,
M.,
and Schmidt,
C. L. A., J. Biol. Chem.,
88, 215 (1930).
6. Pfeiffer,
P., Organische
Molekiilverbindungen,
Stuttgart,
2nd edition
(1927).
7. Anslow,
W. K., and King, H., Biochem.
J., 21, 1168 (1927).
8. Kober,
P. A., and Sugiura,
K., Am. Chem. J., 48, 383 (1912).
9. Kober,
P. A., and Haw, A. B., J. Am. Chem. Sot., 38, 457 (1916).
10. Harris,
L. J., Proc. Roy. Sot. London,
Series
B, 104, 412 (1929).
Birch,
T. W., and Harris,
L. J., Biochem.
J., 24, 564 (1930).
Harris,
L. J.,
Biochem.
J., 24, 1080 (1930).
Borsook,
H., and MacFadyen,
D. A.,
J. Gen. Physiol.,
13, 509 (1930).
Emerson,
0. H., and Kirk,
P. L.,
J. Biol. Chem., 87, 597 (1930).
11. Shibata,
Y., and Matsuno,
K., J. Coil. SC., Imp.
Univ.
Tokyo,
41, 1
(1920).
12. Bodlander,
G., and Storbeck,
O., 2. anorg. Chem., 31, 1 (1902).
13. Moloney,
P. S., J. Physic.
Chem., 26, 758 (1921).
14. Robertson,
G. R., Ind. and Eng. Chem., Anal. Ed., 3, 5 (1931).
15. MacInnes,
D. A., and Dole, M., Ind. and Eng. Chem., Anal. Ed., 1, 57
(1929);
J. Gen. Physiol.,
12, 805 (1929).
16. Riley,
H. L., J. Chem. Sot., 1307 (1929); 1642 (1930).
17. Getman,
F. H., Tr. Am. Electrochem.
Xoc., 26,67 (1914).
18. Lewis,
G. N., and Lacey,
W. N., J. Am. Chem. Sot., 36, 804 (1914).
19. Labendzinski,
quoted
by Abegg,
R., Auerbach,
F., and Luther,
R.,
Messungen
elektromotorische
Krafte
galvanischen
Ketten
mit wassrigen Elektrolyten,
Leipsic,
6 (1911).
20. Northrop,
J. H., and Kunitz,
M., J. Gen. Physiol.,
11,481
(1927-28).
21. Pincus,
J. B., and Kramer,
B., J. Bio2. Chem., 6’7, 463 (1923).
22. Thimann,
K. V., J. Gen. Physiol.,
14, 215 (1930).
23. Bonino,
G. B., and Garello,
A., Arch. sot. biol., 11,212 (1928).


© Copyright 2026