
UNEQUILIBRATED SPINELS IN STARDUST TRACK C2062,2,162
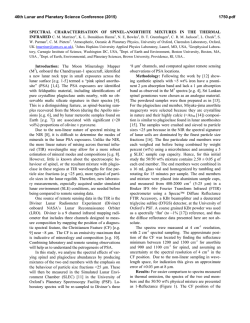
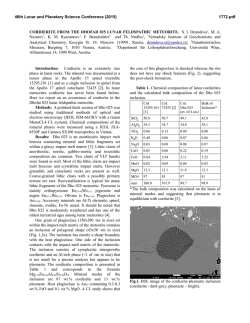
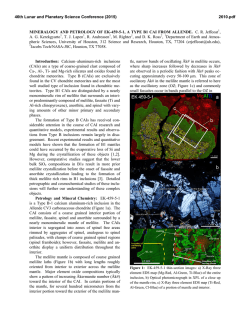
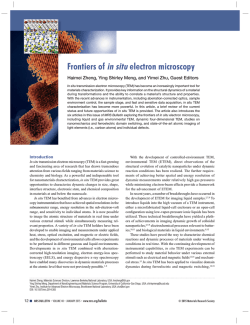
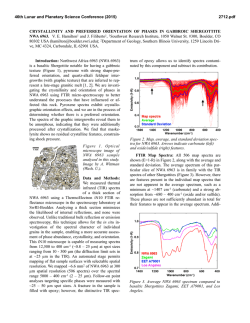
46th Lunar and Planetary Science Conference (2015)
2974.pdf
UNEQUILIBRATED SPINELS IN STARDUST TRACK C2062,2,162 (CECIL). Zack Gainsforth1 , Anna Butterworth1 , Andrew J. Westphal1 , 1 Space Sciences Laboratory, University of California at Berkeley, Berkeley CA 94720, USA, .
Introduction
Spinels found in comet Wild 2 samples returned by the
Stardust mission have multiple formation pathways. In type II
chondrule objects, spinels can crystallize from liquidus and can
be found embedded within other olivines or as standalone crystallites in the chondrule [1, 2]. On the other hand, magnetites
in Track 80 probably formed via an aqueous pathway[4]. Magnesiospinel is also thought to form via a condensation pathway
(e.g. [5]). While most condensation calculations do not predict Fe-, Cr-rich spinels, they occur nevertheless as presolar
grains[7] suggesting that a condensation pathway for Fe-, Crrich spinel exists.
Because many spinels in unequilibrated assemblages do
not have clear relationships to the phases around them, petrographic work becomes difficult or impossible in many cases.
Therefore, understanding their history requires obtaining all
the necessary information from the crystal itself. Luckily,
spinel is especially well suited to this since it contains multiple
crystalline sites which can accommodate Ti, V, and Fe in multiple oxidation states. Because of this, spinel can be a sensitive
indicator of oxygen fugacity over a range of more than 15 log
units[9], and can even record changing fugacities during the
formation/alteration of a single grain[8].
However, in Stardust, the spinels are nm in size, requiring quantitative analysis to be done largely with Transmission
Electron Microscopy (TEM) and soft X-ray techniques. While
hard X-ray barometers have been used for some time on meteoritic materials, the same calibrations do not translate directly
to soft X-ray or TEM. Therefore, we are still in the early days
of characterizing nano-spinels from Stardust as we simultaneously acquire measurements and develop progressively more
robust calibrations to understand the measurements. Here we
show progress in analyzing oxidation state and site occupancy
of cations in Stardust nano-spinels.
Experimental
Cecil is a terminal particle from Stardust track C2062,2,162
which was embedded in epoxy and ultramicrotomed onto TEM
grids. TEM analysis was done at the National Center for Electron Microscopy at Lawrence Berkeley National Laboratory
using an FEI Titan TEM at 80 keV with a 0.6 sr EDS detector, and a Zeiss Libra 200 MC at 200 keV with an in-column
Omega energy filter for imaging and diffraction. EDS mapping was done at about 30 kcps for two hours to acquire a stack
with 2.3·108 counts.
Atom Location by Channeling Enhanced Microanalysis
(ALCHEMI) is a technique for isolating the crystallographic
sites for atoms[11]. It can be used, for instance, to differentiate
between the octahedral and tetrahedral sites in spinel, and
works by causing the electron wave in a TEM to constructively
or destructively interfere on specific crystallographic sites by
carefully tilting the electron beam or sample. We acquired
2D ALCHEMI near the spinel 111 zone axis by tilting the
beam axis and acquiring a twenty second EDS spectrum at
each beam tilt from -3 to +3 nm−1 on two orthogonal tilt axes.
The number of counts in each peak of each spectrum was fit
using a Python script and used to generate ratio images such
as shown in Fig. 2. The patterns can be used to statistically
quantify site occupancy of the various cations[10].
The ultramicrotomed slices were also imaged using Scanning Transmission X-ray Microscopy (STXM) at the Advanced Light Source (ALS) in P
Berkeley, CA to acquire Fe-L
and Ti-L edge XANES. Fe3+ / Fe was computed using the
calibration of van Aken[6], though it is known that crystallographic effects can lead to large errors. For example, Fig.
2c of van
P Aken[6] shows spectra for two spinels, both with
Fe3+ / Fe = 2/3, yet with different XANES. We note that
while a better calibration is needed, in the standards we have
investigated, the van Aken calibration has always worked with
an accuracy better than 30%. We did not attempt to quantify
the Ti oxidation state since existing calibrations did not give
correct results on a chromite standard.
Observations
Cecil is an unequilibrated assemblage containing a likely
igneous object alongside primitive, possibly nebular nanosulfides[3], olivines, pyroxenes and spinels embedded in a
glassy matrix. The spinels are mostly <= 200 nm in size and
varied in composition.
One spinel was embedded in SiO2 -rich material, 200 nm
in diameter and comprised several euhedral grains oriented
within a few degrees of each other based on electron diffraction. TEM/EDS shows an average composition in oxide wt %
of TiO2 = 3.52, Al2 O3 =18.08, Cr2 O3 = 40.25, V2 O3 = 1.37,
FeO = 31.33, MgO = 4.38, MnO = 0.79. However, the crystal
is highly inhomogenous. In Fig. 1, the blue band corresponds
to a Ti-, Fe-, Cr-rich, Al-poor region with composition in oxide
wt % of TiO2 = 4.64, Al2 O3 =11.97, Cr2 O3 = 43.43, V2 O3 =
1.54, FeO = 33.46, MgO = 3.79, MnO = 0.83. The red portion
in the upper right corresponds to composition in oxide wt %
Figure 1: (A) EDS map and (B) TEM brightfield image of a
spinel in Cecil surrounded by SiO2 -rich amorphous material.
EDS colors are Ti (cyan), Fe (magenta), Al (yellow) showing extreme heterogeneity within the spinel. The brightfield is
along the 110 zone axis, tilted 37 degrees from the EDS map
– the presence of multiple crystal domains can be seen in B.
Scalebar is 100 nm.
46th Lunar and Planetary Science Conference (2015)
of TiO2 = 2.46, Al2 O3 =21.06, Cr2 O3 = 39.38, V2 O3 = 1.20,
FeO = 30.04, MgO = 5.10, MnO = 0.70. Notice that the Ti
and Al contents vary by almost aP
factor of two. From Fe-L
edge XANES, we estimate Fe3+ / Fe < 8%, consistent with
no Fe3+ .
A second spinel was 50 nm in diameter and single crystalline, possibly associated with sulfide, Fig. 2. TEM/EDS
gives a composition in oxide wt % of TiO2 = 1.14, Al2 O3 =37.14,
Cr2 O3 = 17.02, FeO = 12.79, MgO = 30.99, ZnO = 0.92. Notice that the composition is dramatically different than the
previous spinel. We acquired an ALCHEMI stack along the
111 zone of the spinel, shown in Fig. 2. The O/Ti and O/Cr
maps show a similar pattern with the highest cation detection
at (-3, -3) nm−1 beam tilt, and the lowest cation detection at
(0, +3) nm−1 beam tilt. The Ti image is noisier than the Cr
image as a consequence of the low concentration of Ti in the
sample (≈1 ox wt % TiO2 ). Thus, while it is not possible
from this stack to assign an accurate site occupancy for the Ti,
it is clear that at least some of the Ti occupies the same site
as the Cr. This is actually not expected; usual stoichiometry
calculations place all Ti as Ti4+ in the octahedral site and the
Cr3+ in the tetrahedral site. Fig. 2 also shows an O/Mg image.
While the Mg concentration is lower than Cr, and therefore the
image is noisier, it still shows a statistically significant difference from the O/Cr image with the lowest Mg detection at
(-3, -3) nm−1 beam tilt, which shows the highest Ti and Cr
detection. Therefore, the Mg occupies a different site from the
Cr as is expected. For comparison, a zoomin of the Ti, Cr and
Fe peaks for the spectra acquired at (-3, -3) and (0, +3) nm−1
are shown and demonstrate a 2X difference in the detection for
the three cations. The spectra are normalized to the oxygen
peak (not shown). Al has a similar crystallographic orientation to Cr, while Fe shows a slightly different dependence than
either Mg or Cr alone (not shown). Fe likely occupies multiple
2974.pdf
crystallographic sites.
Discussion and Future Work
It is too early to make meaningful conclusions about what
these spinels are telling us about comet Wild 2 and early solar
formation processes. However, the variation in composition
between and within spinels in Cecil demonstrate at least that
it is highly unequilibrated.
The spinel shown in Fig. 1 is poor in Mg, but rich in Cr,
Fe and Al. It is contains multiple domains containing Ti and
Al concentrations varying by a factor of two. It is plausible
that the Cecil grain formed from a high fugacity nebular condensation/alteration process. However, the low Fe3+ content
measured by XANES suggests a negligible magnetite component and probably restricts the oxygen fugacity below the
FMQ buffer. A better restriction on the oxygen fugacity should
be possible when an accurate Ti-L edge barometer becomes
available.
Fig. 2 shows a spinel with a drastically different composition and which is found in association with a sulfide, though
it is hard to make a conclusive link because of the process of
ultramicrotomy. The different chemical composition suggests
a different formation mechanism from the first spinel, or at
least demonstrates different conditions during formation. Understanding the affinity of Ti to the Cr crystallographic site in
the spinel measured by ALCHEMI is important since the current Ti-oxidation measurement methods are dependent on the
crystallographic symmetries around the Ti atom. Therefore,
this study demonstrates that quantitative analysis of Ti-L edge
spectra from Stardust grains will also require an independent
measurement of the Ti site occupancy (such as using ALCHEMI). Likely, this restriction generalizes to all nano-phase
spinels in astromaterials unless their formation environment is
already demonstrated to be in a calibrated regime (e.g. igneous
spinels in achondrites). In the future, it may be possible to determine both the crystallographic site and the oxidation state
from Ti-L edge XANES, but only after clean XANES spectra
from each oxidation/crystallographic symmetry combination
have been independently determined.
Acknowledgments
The ALS and NCEM are supported by the Director, Office
of Energy Research, Office of Basic Energy Sciences, Materials Sciences Division of the U.S. Department of Energy, under
Contract No. DE-AC02-05CH11231.
References
Figure 2: ALCHEMI tilt images giving oxygen/cation count
ratios for Ti (A), Cr (B) and Mg (C). Two spectra (D), are
normalized to the oxygen intensity and show a factor of two
variation the Cr, Fe, and Ti count rates. The blue spectrum
was taken with a beam tilt of (-3, -3) nm−1 , and the green
spectrum at (0, +3) nm−1 . The tilt positions are shown in the
O/Mg image (C).
[1] Joswiak, D., et al., (2012) Meteoritics & Planet. Sci., 47,
471. [2] Gainsforth, Z., et al., (2011) MetSoc [3] Gainsforth,
Z., et al., (2013) LPSC [4] Stodolna, J., et al., (2012) GGA 87,
35-50. [5] Ebel, S. E., (2006) Meteorites and the Early Solar
System, II. [6] van Aken, P.A., Liebscher, B., (2002) Phys.
Chem. Min., 29, 188. [7] Zega, T. J., et al., (2008) LPSC.
[8] Simon, S. B., et al., (2008) LPSC. [9] Papike, J. J., et al.,
(2004) Am. Min., 89, 1557-1560. [10] Rossouw, C. J., (2006)
Phil. Mag. A, 74:1, 57-76. [11] Tafto., J., Krivanek, O. L.,
Phys. Rev. Lett., 48, 560-563.

© Copyright 2026