
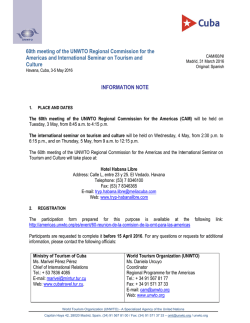
Over 1.1 billion tourists travelled abroad in 2014
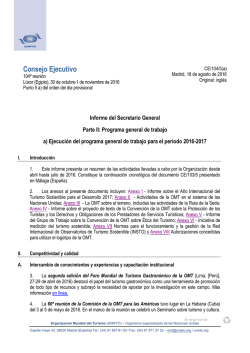
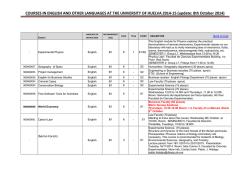
Volume 13 • January 2015
Contents
Regional results
International tourism receipts
International tourism expenditure
UNWTO’s Panel of Tourism Experts
UNWTO outlook for 2015
Air transport results 2014 ICAO and IATA
Air transport booking trends ForwardKeys
Travel Insurance Trends
The economic environment
Statistical Annex
The number of international tourists (overnight visitors)
reached 1,138 million in 2014, 51 million more than in 2013. With
a 4.7% increase, 2014 marks the fifth consecutive year of robust
growth above the long term average since the financial crisis of
2009. Compared to pre-crisis year 2008, international tourism
gained 211 million additional arrivals a year.
World: Inbound Tourism
International Tourist Arrivals
1200
1100
1000
900
Over 1.1 billion tourists travelled
abroad in 2014
International tourist arrivals reached 1,138 million in 2014, a
4.7% increase over the previous year, according to the data
analysed in this issue of the UNWTO World Tourism
Barometer. Overall demand was robust with 51 million more
tourists travelling the world. For 2015, UNWTO forecasts
international tourism to grow by 3% to 4%, further
contributing to the global economic recovery.
1
800
700
600
1,138
1,087
1,038
997
949
910927891
854
809
764
674675696692
625
602
561587
527
500
400
19
95
19
96
19
97
19
98
19
99
20
00
20
01
20
02
20
03
20
04
20
05
20
06
20
07
20
08
20
09
20
10
20
11
20
12
20
13
20
14
This issue and the accompanying Statistical Annex of the
UNWTO World Tourism Barometer present full year results for
international tourism in 2014 based on preliminary data for international overnight visitors reported by destinations around the
world. This analysis is complemented by data on receipts from
international tourism reported by destinations around the world,
as well on international tourism expenditure data for source
markets for the first part of 2014.
Furthermore, this issue includes an outlook for 2015 based
on current trends and the assessment by the UNWTO Panel of
Tourism Experts. Members of the Panel evaluated tourism
development in their destination or business for the full year 2014
as well as the last four months of the year, and assessed their
prospects for the full year 2015 and the first four months. Finally,
it presents an overview of air transport trends in 2014 based on
ICAO and IATA, as well as booking trends for the first four
months of 2015 based on business intelligence tool Forwardkeys.
This release is available only in electronic format, through
the UNWTO elibrary, and is free of charge for members. The
release is provided in English only, while the Statistical Annex is
available in English, French, Spanish and Russian.
(million)
Source: World Tourism Organization (UNWTO) ©
“Over the past years, tourism has proven to be a surprisingly strong and resilient economic activity and a fundamental
contributor to the economic recovery by generating billions of
dollars in exports and creating millions of jobs. This has been true
for destinations all around the world, but particularly for Europe,
as the region struggles to consolidate its way out of one of the
worst economic periods in its history,” said UNWTO SecretaryGeneral, Taleb Rifai.
By region, the strongest growth in 2014 was registered in
the Americas (+7%) and Asia and the Pacific (+5%), while Europe
(+4%), the Middle East (+4%) and Africa (+2%) grew at a slightly
more modest pace. By subregion, North America (+8%) recorded
the best results, followed by North-East Asia, South Asia,
Southern and Mediterranean Europe, Northern Europe and the
Caribbean, all increasing by 7%.
Growth in receipts expected to follow growth in international
arrivals
Receipts in destinations from international tourism reached US$
1,197 billion in 2013, US$ 230 billion more compared to the precrisis year 2008. As the majority of countries compile receipts
data on a quarterly basis and reporting tend to lag about two
months behind arrivals data, UNWTO will analyse 2014 data in
the coming months and release 2014 results for international
tourism receipts in the next issue of the UNWTO World Tourism
Barometer of April 2015. As in recent years, growth in receipts is
expected to have followed growth in arrivals fairly closely.
Volume 13 • January 2015
The UNWTO World Tourism Barometer is a publication of the
World Tourism Organization (UNWTO). By monitoring short-term
tourism trends on a regular basis, UNWTO aims to provide all
those involved, directly or indirectly, in tourism with adequate upto-date statistics and analysis in a timely fashion.
The UNWTO World Tourism Barometer is periodically
updated. Issues contain as regular sections: an overview of
short-term tourism data from destinations, generating countries
and air transport; the results of the latest survey among the
UNWTO Panel of Tourism Experts, providing an evaluation of
and prospects for short-term tourism performance; and selected
economic data relevant for tourism. The objective for future
editions of the UNWTO World Tourism Barometer will be to
broaden its scope and improve coverage gradually over time.
The UNWTO World Tourism Barometer is prepared by
UNWTO’s Tourism Market Trends Programme. The UNWTO
Secretariat wishes to express its sincere gratitude to all those
who have participated in the elaboration of the UNWTO World
Tourism Barometer, in particular all institutions that supplied data,
and to the members of the UNWTO Panel of Tourism Experts for
their valuable contributions.
For more information on the UNWTO World Tourism
Barometer, including copies of previous issues, please refer to
the Facts & Figures section on the UNWTO website at
www.unwto.org/facts/menu.html.
We welcome your comments and suggestions at
[email protected], tel +34 915678198 / fax +34 915678217.
The World Tourism Organization (UNWTO), a United Nations
specialized agency, is the leading international organization with
the decisive and central role in promoting the development of
responsible, sustainable and universally accessible tourism. It
serves as a global forum for tourism policy issues and a practical
source of tourism know-how. Its membership includes 156
countries, 6 territories, 2 permanent observers and over 400
Affiliate Members.
Copyright © 2015 World Tourism Organization
Calle Capitán Haya, 42, 28020 Madrid, Spain
UNWTO World Tourism Barometer
ISSN: 1728-9246
Published and printed by the World Tourism Organization,
Madrid, Spain - First printing: 2015 (version 27/01/15)
All rights reserved
The designations employed and the presentation of material in
this publication do not imply the expression of any opinions
whatsoever on the part of the Secretariat of the World Tourism
Organization concerning the legal status of any country, territory,
city or area, or of its authorities, or concerning the delimitation
of its frontiers or boundaries.
All UNWTO publications are protected by copyright. Therefore
and unless otherwise specified, no part of an UNWTO
publication may be reproduced, stored in a retrieval system or
utilized in any form or by any means, electronic or mechanical,
including photocopying, microfilm, scanning, without prior
permission in writing. UNWTO encourages dissemination of its
work and is pleased to consider permissions, licensing, and
translation requests related to UNWTO publications. For
permission to photocopy UNWTO material, refer to the
UNWTO website at www.unwto.org/pub/rights.htm.
The contents of this issue may be quoted provided the source is
given accurately and clearly. Distribution or reproduction in full
is permitted for own or internal use only. Please do not post
electronic copies on publicly accessible websites, UNWTO
encourages you to include a link to the Facts & Figures section
of the UNWTO website instead at mkt.unwto.org.
World Tourism Organization
Capitán Haya 42, 28020 Madrid, Spain
Tel (34) 91 567 81 00 / Fax (34) 91 571 37 33
[email protected]
www.unwto.org
Data collection for this issue was closed mid January 2015.
The next issue of the UNWTO World Tourism Barometer is
scheduled to be published April 2015.
2
Volume 13 • January 2015
Equal 100
75
Worse 50
131
140
139
127
122
121
125
129
138
136
133
125
98
Better 150
Prospects (before)
71
72
Looking ahead, the UNWTO Confidence Index –based on
feedback from over 300 tourism experts worldwide – suggests
tourism growth will continue in 2015. Experts expect tourism
performance to be better in 2015, though they were not as
upbeat as a year ago with regard to their expectations for 2014.
Based on current trends and the UNWTO Confidence Index,
UNWTO forecasts international tourist arrivals to grow between
3% and 4% in 2015. By region, growth is expected to be
strongest in the Americas and in Asia and the Pacific (both +4%
to +5%), and somewhat more moderate in Europe (+3% to +4%).
Africa (+3% to +5%) and the Middle East (+2% to +5%) are two
regions with a larger degree of uncertainty and volatility.
“We expect demand to continue growing in 2015 as the
global economic situation improves even though there are still
plenty of challenges ahead. On the positive side, oil prices have
declined to a level not seen since 2009. This will lower transport
costs and boost economic growth by lifting purchasing power and
private demand in oil importing economies. Yet, it could also
negatively impact some of the oil exporting countries which have
emerged as strong tourism source markets,” added Mr Rifai.
119
175
150
144
144
140
140
136
137
143
132
UNWTO Panel of Tourism Experts: World
Favourable prospects for 2015
Evaluation (after)
25
2003 2004 2005 2006 2007 2008 2009 2010 2011 2012 2013 2014 2015
Source: World Tourism Organization (UNWTO) ©
Crude Oil Spot Price Brent (daily)
(US$ per barrel)
160
140
120
100
80
60
International Tourist Arrivals, World
12
40
20
10.4
10
0
7.8
8 6.4
6
4.5
4
(% change)
6.5
5.9 5.7 6.5
2.6
3.8
2
3.1
5.1
4.1
Source: US Department of Energy, Energy Information Administration
4.7 4.7
1.9
All world regions shared in growth in 2014
0.2
0
-0.6
-2
-4
Europe (+4%), the most visited region with over half of the
world’s international tourists, saw an increase of 22 million
arrivals in 2014, reaching a total of 588 million. Thanks to these
results, tourism has been a major contributor to the European
economic recovery. Northern Europe and Southern and
Mediterranean Europe led growth (both +7%), while results were
more modest in Western Europe (+2%). Arrivals in Central and
Eastern Europe (0%) stagnated after three years of strong
growth. The 28 countries of the European Union together
recorded 457 million international arrivals in 2014, an increase of
5%, higher than in 2013 (+4%).
-3.9
96
/9
97 5
/96
98
/9
99 7
/9
00 8
/99
01
/0
02 0
/01
03
/0
04 2
/0
05 3
/0
06 4
/05
07
/0
08 6
/0
09 7
/0
10 8
/0
11 9
/
12 10
* /1
13 1
*/
Fo
rec 14* 12
as /13
t2
01
5
-6
Long-term average
Source: World Tourism Organization (UNWTO) ©
Outlook for International Tourist Arrivals
2009
2010
World
Europe
Asia and the Pacific
Americas
Africa
Middle East
-3.9%
-5.0%
-1.6%
-4.7%
3.4%
-5.4%
6.5%
3.1%
13.1%
6.5%
8.9%
13.1%
Source: World Tourism Organization (UNWTO) ©
3
1987 1989 1991 1993 1995 1997 1999 2001 2003 2005 2007 2009 2011 2013 2015
2011
2012
real, change
full year
5.1%
4.1%
6.6%
3.7%
6.5%
6.9%
3.5%
4.4%
-0.1%
5.2%
-3.5%
-5.6%
2013
2014*
4.7%
5.0%
6.8%
3.5%
4.8%
-3.4%
Jan.-Dec.
4.7%
3.9%
5.3%
7.4%
2.2%
4.4%
projection 2014*
(issued January)
between
+4% and +4.5%
+3% and +4%
+5% and +6%
+3% and +4%
+4% and +6%
+0% and +5%
average
a year
2005-2014
3.9%
3.0%
6.1%
3.4%
5.4%
4.6%
projection 2015*
(issued January)
between
+3% and +4%
+3% and +4%
+4% and +5%
+4% and +5%
+3% and +5%
+2% and +5%
(Data as collected by UNWTO January 2015)
Volume 13 • January 2015
International Tourist Arrivals by (Sub)region
Full year
Share
Change Monthly/quarterly data series
(percentage change over same period of the previous year)
2000 2005 2010 2012
2013 2014* 2014* 12/11 13/12 14*/13
(million)
(%)
100
4.1
2014*
2013
(%)
Q1
Q2
Q3
Q4 Sep Oct Nov Dec
Q1
Q2
Q3
Q4
4.7
4.7
3.9
5.8
4.3
4.8
3.9
5.8
4.1
4.2
6.3
4.3
4.1
4.1
World
674
809
949 1,038 1,087 1,138
Advanced economies¹
419
463
510
555
582
615
54.0
3.8
4.8
5.7
4.8
7.6
4.9
5.5
4.9
7.1
4.9
4.2
4.7
3.8
5.3
5.6
Emerging economies¹
255
346
439
482
505
523
46.0
4.4
4.7
3.6
3.1
3.6
3.5
4.0
2.7
4.4
3.4
4.2
7.8
5.0
2.4
2.5
386.4 452.9 488.3 539.6 566.3 588.4
4.9
By UNWTO regions:
Europe
Northern Europe
51.7
3.7
5.0
3.9
2.9
5.1
3.6
3.6
3.3
4.5
2.9
3.2
5.7
4.2
4.7
72.6
6.4
1.4
4.1
6.9
8.9
8.5
5.8
4.8
7.1
3.8
5.3
5.6
3.4
2.5
4.6
6.0
139.7 141.7 154.4 167.3 171.8 175.6
15.4
3.6
2.7
2.2
-0.5
4.9
1.3
2.8
1.7
3.8
2.0
2.2
2.8
1.3
3.2
3.7
44.8
Western Europe
Central/Eastern Eu.
59.8
69.3
Southern/Mediter. Eu.
62.7
95.1
65.3
68.0
97.9 116.7 125.6 125.1
11.0
8.5
7.6
-0.4
1.6 -0.5 -1.8
0.4 -1.9
0.5
0.3
0.5
11.8
7.4
6.5
2.8
132.6 156.4 173.3 190.4 201.0 215.2
18.9
1.9
5.6
7.0
5.1
6.4
7.5
5.0
5.8
5.4
5.4
5.0
7.2
7.5
7.7
6.6
- of which EU-28
330.5 367.8 383.7 416.7 433.7 456.6
40.1
2.8
4.1
5.3
3.3
6.6
5.0
5.5
5.5
6.4
5.0
4.7
3.6
3.0
4.6
5.4
Asia and the Pacific
110.3 154.0 205.4 233.8 249.8 263.0
23.1
6.9
6.8
5.3
5.0
5.6
4.0
6.5
4.1
7.3
5.6
6.7
8.3
6.1
7.6
5.5
6.0
3.7
1.6
4.4
4.1
14.8 12.1
11.7
7.2
4.1
4.3
5.0
North-East Asia
58.3
85.9 111.5 122.8 127.0 136.0
3.4
7.1
5.2
8.6
6.4
8.2
6.2
8.8
8.8
7.0
South-East Asia
36.3
49.0
70.5
84.7
94.3
96.6
8.5
8.7 11.3
2.4
4.5
0.6 -0.4
4.7
0.6
5.3
1.7
6.7
9.6
10.9
11.4
11.9
12.5
13.2
1.2
4.2
5.9
4.9
8.3
6.0
4.5
6.1
6.7
5.5
6.1
8.1
12.0
14.4
16.0
17.1
1.5
128.2 133.3 150.5 162.5 168.1 180.6
15.9
Oceania
South Asia
Americas
11.9
4.6
4.7
4.9
5.9 11.4
7.1
5.9
7.8
9.5
5.4
6.7
6.9
2.9
6.5
10.6 13.2
15.4
7.7
4.4
7.4
5.3 11.8
6.6
6.3
4.2
8.8
5.8
4.5
3.1
4.0
4.5
3.5
1.9
North America
91.5
89.9
99.5 106.4 110.5 119.5
10.5
4.1
3.9
8.2
6.9 13.3
6.4
6.3
3.6
9.7
6.8
2.7
4.4
2.9
4.3
3.8
Caribbean
17.1
18.8
19.5
20.6
21.1
22.5
2.0
3.1
2.8
6.6
3.7
7.5
7.6
8.4
8.1 10.5
7.9
7.5
1.0
-0.2
1.8
6.5
Central America
4.3
6.3
7.9
8.9
9.1
9.6
0.8
7.3
2.6
5.6
3.7
9.2
4.3
5.8
5.4
3.3
3.5
9.3
3.2
0.6
2.2
3.9
South America
15.3
18.3
23.5
26.7
27.4
29.0
2.5
5.8
2.7
5.7
2.4
9.6
7.5
4.8
4.5
5.6
1.4
6.9
0.8
0.0
4.2
6.0
5.7
Africa
26.2
34.8
49.7
52.2
54.7
56.0
4.9
5.2
4.8
2.3
6.2
2.3
1.9 -1.0 -1.4 -1.8
-0.1
-1.1
3.1
2.5
5.7
North Africa
10.2
13.9
18.8
18.5
19.6
19.7
1.7
8.7
6.0
0.6
7.9
1.8
1.1 -8.8 -4.7 -9.6
-6.5
-9.6
0.1
0.7
7.1
4.8
Subsaharan Africa
16.0
20.9
30.9
33.7
35.1
36.3
3.2
3.4
4.2
3.3
5.5
2.6
2.5
2.7
2.4
2.4
4.4
3.7
4.6
6.2
22.4
33.7
54.7
49.8
48.2
50.3
4.4
-5.6
-3.4
4.4
0.2
0.1 13.8
7.0 24.9 11.0
5.9
2.4
14.4
Middle East
2.5
0.6
Source: World Tourism Organization (UNWTO) ©
6.6 -25.0 -13.0
(Data as collected by UNWTO January 2015)
¹ Classification based on the International Monetary Fund (IMF), see the Statistical Annex of the IMF World Economic Outlook of April 2012, page 177,
at www.imf.org/external/pubs/ft/weo/2012/01.
See box at page 'Annex-1' for explanation of abbreviations and signs used
International Tourist Arrivals, monthly evolution
World
140
(million)
2011
120
(% change)
15
2010
130
International Tourist Arrivals, monthly evolution
World
10
2012
110
2013
100
2014*
5
0
90
80
-5
70
-10
60
50
-15
1
2
3
4
5
6
Source: World Tourism Organization (UNWTO) ©
4
7
8
9
10
11
12
2009
2010
2011
Source: World Tourism Organization (UNWTO) ©
2012
2013
2014*
Volume 13 • January 2015
International Tourist Arrivals
8
6
(% change)
7
6.8
5
5.0
4.7 5
4
4
4.8
4
3.5
2
2
0
13/12
-2
14*/13
-4
World
Europe
Asia and
the Pacific
Americas
Africa
-3.4
Middle East
Source: World Tourism Organization (UNWTO) ©
International tourist arrivals in Asia and the Pacific (+5%)
increased by 13 million to 263 million. The best performance was
recorded in North-East Asia and South Asia (both +7%). Arrivals
in Oceania grew by 6%, while growth slowed down in South-East
Asia (+2%) as compared to previous years.
The Americas was the best performing region in relative
terms with a growth of 7%, welcoming an additional 13 million
international tourists and raising the total to 181 million. Growth
was driven by North America (+8%), where Mexico posted a
double-digit increase, and the Caribbean (+7%). Arrivals to
Central America and South America (both +6%) also grew at
double the rate recorded in 2013 and well above the world
average.
International tourism in the Middle East (+4%) shows signs
of rebound with good results in most destinations. The region
attracted an additional 2 million arrivals, bringing the total to 50
million. Africa’s international tourist numbers grew by an
estimated 2%, equivalent to an increase of one million arrivals.
The region reached 56 million tourists. While arrivals to North
Africa were weak (+1%), Sub-Saharan Africa saw international
tourist numbers rise by 3% despite the Ebola Disease Outbreak
in a few West African countries. Data for Africa and the Middle
East should be read with caution as it is based on limited and
volatile data.
The detailed information in the continuation of the UNWTO World
Tourism Barometer and its Statistical Annex is not included in the
complimentary excerpt of this document.
The full document is available in electronic format for sale and free of
charge for UNWTO members and subscribed institutions through the
UNWTO elibrary at www.e-unwto.org/content/w83v37.
For more information on the UNWTO World Tourism Barometer, please
refer to the Facts & Figures section on the UNWTO website at
www.unwto.org/facts.
Copyright © 2015 World Tourism Organization
5
Volume 13 • January 2015
International Tourist Arrivals
(% change over same period of the previous year)
14
13/12
11
11
12
10
8
6
4.7 4.7
8
8
7
7
7
7
6
5
4
3
7
6
6
4
14*/13
4
4
4
3
3
2
2
6
6
3
3
3
2
0
0
0
-2
-4
-3
Source: World Tourism Organization (UNWTO) ©
www2.unwto.org/event/fitur-2015
6
an
Af
ric
a
Mi
dd
le
Ea
st
Su
bs
a
ha
r
Af
ric
a
ica
No
rth
Am
er
me
ric
a
So
uth
n
ica
be
a
Ce
ntr
al
A
Ca
rib
me
r
As
ia
No
rth
A
So
uth
nia
Oc
ea
Eu
Ce
rop
ntr
e
al/
Ea
st e
So
rn
uth
Eu
ern
.
/M
ed
ite
r. E
u.
No
rth
-E
as
tA
sia
So
uth
-E
as
tA
sia
pe
W
es
ter
n
rn
Eu
ro
No
rth
e
W
orl
d
-6
UNWTO World Tourism Barometer
The UNWTO World Tourism Barometer aims at providing
all those involved in tourism with up-to-date statistics and
adequate analysis, in a timely fashion. Issues cover shortterm tourism trends, a retrospective and prospective
evaluation of current tourism performance by the UNWTO
Panel of Experts, and a summary of economic data
relevant for tourism. The information is updated throughout
the year.
Available in English, French, Spanish and Russian
Tourism Towards 2030
UNWTO Tourism Towards 2030 is UNWTO’s long-term
outlook and assessment of future tourism trends from 2010
to 2030. It is a broad research project building on
UNWTO’s on-going work in the field of long-term
forecasting, initiated in the 1990s. Key outputs of the study
are quantitative projections for international tourism flows
up until 2030, based on data series on international tourist
arrivals by subregion of destination, region of origin and
mode of transport for the period 1980-2010.
Available in English
Handbook on E-Marketing for Tourism
Destinations (revised version)
This UNWTO/ETC fully revised and extended version 3.0
covers all essential aspects of an e-marketing strategy
including strategic planning, branding measures, contentbuilding, search engine optimization, e-commerce and
email marketing. It also provides practical information on
latest trends and developments in mobile marketing and
social media, as well as detailed insight into the
measurement of effective e-marketing strategies using the
latest technologies.
Available in English
Handbook on Tourism Product
Development
The UNWTO/ETC Handbook on Tourism Product
Development outlines the essential elements in the
process of tourism product development planning and
implementation. It demonstrates a range of successful
approaches and case studies from around the world and
sets out best practice examples and benchmarks by which
destinations can assess their own product development
system and methods.
Available in English
The Chinese Outbound Travel Market and
Understanding Chinese Outbound Tourism
China is the fastest-growing tourism source market in the
world and the top international tourism spender since
2012. In view of the worldwide interest in this market, ETC
and UNWTO have prepared two joint reports on this
subject: The Chinese Outbound Travel Market – 2012
Update, which offers an overview of the features and rapid
evolution of the Chinese outbound tourism market, and
Understanding Chinese Outbound Tourism – What the
Chinese Blogosphere is Saying about Europe, which
analyses the trends, themes and behaviour of Chinese
tourists based on the analysis of online social media and
internet searches.
Available in English
Understanding Brazilian Outbound
Tourism – What the Brazilian blogosphere
is saying about Europe
With over 70 million internet users in 2012, Brazil has Latin
America’s biggest population of ‘netizens’ or social media
users, the 5th largest in the world. An increasing number of
National Tourist Organizations (NTO’s) are interested in
targeting this important market through websites, blogs
and other social media. This joint research project by ETC
and UNWTO analyses the trends, themes and behaviour
of Brazilian tourists in Europe based on internet searches
and social media activity.
Available in English
Compendium of Tourism Statistics,
2014 Edition, Data 2008–2012
The Compendium of Tourism Statistics provides data and
indicators on inbound, outbound and domestic tourism, as
well as on the number and types of tourism industries, the
number of employees by tourism industries, and
macroeconomic indicators related to international tourism.
The 2014 edition presents data for 203 countries from
2008 to 2012, with methodological notes in English,
French and Spanish.
Yearbook of Tourism Statistics,
2014 Edition, Data 2008–2012
The Yearbook of Tourism Statistics focuses on inbound
tourism-related data (total arrivals and overnight stays),
broken down by country of origin. The 2014 edition
presents data for 197 countries from 2008 to 2012, with
methodological notes in English, French and Spanish.
Handbook on Tourism Destination
Branding
This handbook is a recognition by UNWTO and ETC of the
value of successfully building and managing a
destination’s brand. With an Introduction by Simon Anholt,
the handbook presents a step-by-step guide to the
branding process, accompanied by strategies for brand
management. Given case studies illustrate concepts,
present best practices from around the world and provide
fresh insight into destination branding.
Available in English and Spanish
The easy way to obtain UNWTO publications in print
or electronic format and download full catalogue:
www.unwto.org/pub

© Copyright 2025