
The Evaluation of the Environmental Quality in Romania
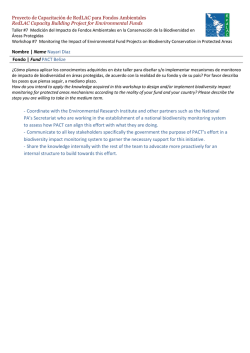
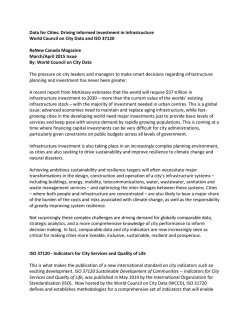
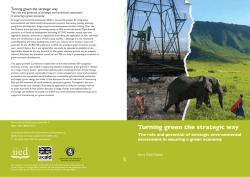
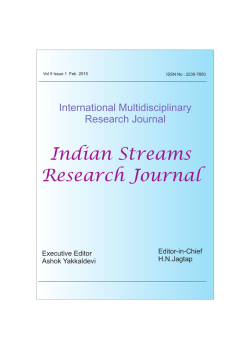
ISSN 0354-8724 (hard copy) | ISSN 1820-7138 (online) The Evaluation of the Environmental Quality in Romania Surd VasileA*, Alexe RădiţaB, Kantor Camelia-MariaC, Tanislav DănuţB, Sencovici MihaelaB Received: March 2011 | Revised: May 2011 | Accepted: May 2011 Abstract The evaluation of the environmental quality concerns the analysis of the physical, chemical, biological and statistical features that allow the scientists to classify a territory in a certain category or hierarchic scale. In the model used in this study, the environmental quality was assessed at the administrative unit level (county), as a result of the interaction of different components. Fifty indicators were selected and included into 6 major groups based on several factors (natural hazards, air quality, biodiversity, water quality, human health, soil quality, economic activities) that increase the communities’ susceptibility to different negative aspects concerning the environment. Each indicator was classified on a scale from 1 to 5 (1-very good…5-very weak). The sum of the indicators was reclassified according to the same model, until the total environmental quality was finally determined. The analysis of the environmental quality on a departmental level provides the opportunity to identify the regions that need to be allotted financial resources in order to diminish the negative impact of the disturbing (anthropic and natural) factors. At the same time, by focusing the research on the most vulnerable counties, a more detailed analysis has revealed the most vulnerable administrative units (towns and communes). Key word: environmental quality; vulnerability; evaluation; indicators; county. Introduction A large array of methods helping to evaluate environmental quality is available today, ranging from simple to highly advanced conceptual and methodological approaches. If, in the beginning, the first environmental “evaluation” started from the basic human needs (food and dwelling) - the basic evaluation of the potential and its possible outcome -, in time, as the society gradually evolved (demographic explosion and industrialization), the so-called “environmental awareness” developed, highlighted in the evaluation of the environmental quality and of man’s impact on the environment. Environmental quality can be defined as a conventional set of physical, chemical, biological and other (statistical) environmental characteristics, expressed in numbers, which allow the scientists to situate the environment in a certain category or within a hierarchic scale. According to the European Environment Agency, environmental quality is a general term for propA erties and characteristics of the environment, either generalized or local, as they affect the human beings and other organisms. It can refer to: various characteristics such as air and water purity or pollution, noise, access to open space, the visual effects of buildings, and the potential effects that such characteristics may have on physical and mental health, caused by human activities. Environmental quality is a state of environmental conditions in environmental media, expressed in terms of indicators or indices related to environmental quality standards (OECD, 1997). Considering the high degree of generalization and representativeness of the environmental information, and the increase of the volume of data concerning the environment, a minimum level of organization of these data is required when using unitary environmental indicators due to the subjectivity of the human factor in the evaluation of the condition of the environmental factors. Babes-Bolyai University, Clinicelor Str. 5-7, Cluj Napoca, Romania, [email protected], University of Târgovişte, Lt. Stancu Ion street, no. 35, Târgovişte, Romania C Claflin University, Orangeburg, 400 Magnolia Street, South Carolina, U.S.A. *Corresponding author: Vasile Surd, e-mail: [email protected] B „Valahia” 42 Geographica Pannonica • Volume 15, Issue 2, 42-50 (June 2011) Surd Vasile, Alexe Rădiţa, Kantor Camelia-Maria, Tanislav Dănuţ, Sencovici Mihaela Furthermore, it is absolutely necessary that the demand for complete, actual and comparable information be met based on the available data when evaluating environmental problems. The information available is not always what we need, and at the same time, the necessary data is not always available. The evaluation of the environmental quality includes both the indicators that concern the causes, and those that refer to the effects of the environmental changes. Therefore, the information refers to the assessment of the environmental condition (air, water, soil quality) and to the analysis of the influential factors (population, economy) of the pressure on the environment and of the impact of the environmental degradation on society (loss of biodiversity, human health condition, etc.). Until now, all official reports and studies aimed only quality estimation on the three main components (air, water, soil), taking into account a number of parameters monitored by the Environmental Protection Agencies. The method used in assessing environmental quality refers to the selection of indicators (monitored continuously and available in all analyzed units), grouped by major categories. Methodology The international research has highlighted the existence of a series of indicators or indices concerning the environment, of which we shall recall: • State of Environment Indicators – OECD (Organization for Economic Cooperation and Development), 1991 – to provide a cost-effective and powerful tool for tracking and charting environmental progress and measuring environmental performance; • Environmental Pressure Indicators – EUROSTAT (Statistical Office of the European Communities), 1997 – to describe human activities and indirect pressure; • Environmental Sustainability Index - World Economic Forum (Yale Centre for Environmental Law and Policy, Yale University Centre for International Earth Science Information Network, Columbia University), a multi-dimensional model which includes environmental hazards, anthropogenic activities, political institutions, environmental management- to provide a measure of factors that compromise environmental sustainability; • Environmental Vulnerability Index – SOPAC (South Pacific Applied Geosciences Commission) - to reflect the extent to which the natural environment of a country is prone to damage and degradation; • Environmental Performance Index - World Economic Forum (Yale Centre for Environmental Law and Policy – Yale University, Center for International Earth Science Information Network (CIESIN) - Columbia University) – measures the effectiveness of national environmental protection efforts. The indicators are included in the policy categories, which refer to the broad objectives (environmental health, ecosystem vitality). In Romania, the National Agency for Environmental Protection (which is part of the Environmental and Forestry Ministry), produces a yearly Report concerning the environmental condition in Romania, based on the data provided by the 42 Departmental Environmental Protection Agencies. The document comprises 14 chapters (1. Natural environment, demographic data and administrative-territorial organization; 2. Atmosphere; 3. Climatic changes; 4. Water; 5. Soil; 6. Conservation of nature and biodiversity, biosecurity; 7. Waste; 8. Hazardous substances and chemical mixtures; 9. Radioactivity; 10. Urban environment; 11. Environmental pressures; 12. Energy; 13. Transports and the environment; 14. Instruments of the environmental policy), but there is no correlation made between them. The need for a simple and general evaluation of the environmental condition has led to the adoption of a number of environmental indicators by some states or international organizations, which differ according to the purpose of the approach, the selected approach or even the access to different data. Starting from the specialized literature (Alfsen, Hans, 1993; Levett, 1998; Corvalan, et al., 2000; Backhaus, et al., 2002; Booysen, 2002; Paris, Kates, 2003; Färe, et al., 2004; Grafton, Knowles, 2004; EVI, 2004; Chess, et al., 2005; ESI, 2006; Polfeldt, 2006; EPI, 2010), we have opted for a model of evaluation of the environmental quality as a result of the interaction between its components. In order to evaluate the environmental quality, 50 indicators have been selected and included into 6 major groups according to the main factors increasing the communities’ vulnerability to different negative aspects concerning the environment. The formula used to quantify them is: EnvQual = NatHaz + AirQual + Biodiv + + WaterHealth + SoilQual + EconAct (1) Each indicator, expressed under diverse forms (density – the relation between the total value and the surface of the administrative unit; weight percentage – the relation between the total area and the area of the administrative unit; numerical Geographica Pannonica • Volume 15, Issue 2, 42-50 (June 2011) 43 The Evaluation of the Environmental Quality in Romania Natural Hazards Strong Winds1 Drought Periods2 Wet Periods2 Heat Waves1 Cold Waves1 Earthquakes3 Landslides4 Floods4 Air Quality Sulphur Dioxide5 Nitrogen Oxides5 Ammonia5 Volatile Organic Compounds5 Heavy Metal5 Dusts in Suspension5 Ozone5 Greenhouse Effect Gases5 Biodiversity Dispersion Habitat Fragmentation6 Neighbors Natural Habitats5 Endangered Species5 Rare Species5 Endemic Species5 Protected Areas5 Water and Human Settlements Water Consumption5 Population Density6 Population Growth6, 7 Sanitary Service6 River Water Condition5 Drinkable Water6 Sewerage6 Rate of Disease8 value), was classified on a scale from 1 to 5 (1-very good, 2-good, 3-moderate, 4-weak, 5-very weak), using the Natural Breaks method in ArcView GIS. The sum of indicators was reclassified according to the same model, until the final determination of the total environmental quality (Fig. 1). The evaluation of the environmental quality was achieved on the level of the administrativeterritorial units (41 counties and the municipality of Bucharest), for the year 2009. Soil Quality Relief Energy Natural Vegetation9 Modifications of the Vegetation10 Fertilizers5 Pesticides5 Degraded Lands11 Polluted Lands11 Biotechnologies5 Economic Activities Animal Agricultural Production12 Fishing5 Procesing Industry12 Oil Extraction13 Mining production13 Tourists6 Accidental Pollution5 Waste Production5 Figure 1. Conceptual model for the assessment of the environmental quality Data sources: (1) Romanian Climate (2008), p. 324;. (2) Păltineanu C., et al. (2007), p. 43-50 and p. 58-67; (3) Order of the Ministry of Transportation, Constructions and Tourism no. 1711/2006 regards the approval of the Technical Regulation „The Seismic Projecting Code – part I – Buildings Projecting Stipulations”, indicative P 100-1/2006 (Official Journal no. 803/25.IX.2006); (4) Low no. 575/2001 concerning the National Territory Arrangement Plan – section V – Natural Risk Areas (Official Journal no. 726/14:XI.2001); (5) County Agencies for Environmental Protection – State of the environment report in the year 2009; (6) Statistical Yearbook of Romania, 2009, National Institute of Statistics (www.insse.ro); (7) Statistical Yearbook of Romania, 1989, National Institute of Statistics; (8) The National Center for Organization and Anssura of Informational and Informatic Health System Bucharest (www.ccss.ro); (9) Land use map 2009, after Ministry of Agriculture and Rural Development, Agency for Payments and Intervention in Agriculture (http://lpis.apia.org. ro); (10)Land use map 1910, after 3rd Military Mapping Survey of Austria-Hungary (http://lazarus.elte.hu/hun/digkonyv/topo/3felmeres.htm); (11)National Agency for Environmental Protection (www.anpm.ro), Institute of Research for Pedology and Agrochemistry (www.icpa.ro), County Offices of Pedological and Agrochemistry Studies; (12)County Statistics Directorates; (13)Ministry of Economy, Commerce and Bussines Environment (www.minind. ro); (14)Directorate of Driving License and Vehicle Matriculation Certificates Regime (www.drpciv.mai.gov.ro). 44 Geographica Pannonica • Volume 15, Issue 2, 42-50 (June 2011) Results and discussion (A). Natural hazards (NatHaz) The natural phenomena taken into consideration are those potentially damaging for man and for human activities, as they have a significant impact on all the environmental factors. The area of the administrative-territorial units affected by different extreme phenomena and processes were considered as follows: 1. strong winds; 2. drought periods; 3. wet periods; 4. heat waves; 5. cold waves; 6. earthquakes; 7. landslides; 8. floods. As observed, the most exposed counties are (Fig. 2): Bacău-BC (especially for earthquakes and floods), Botoşani-BT and Iaşi-IS (landslides), Vaslui-VS (drought), Dolj-DJ (waves of cold and strong winds), Prahova-PH (earthquakes) and Ilfov-IF (strong winds). The least exposed counties are Ialomiţa-IL, Tulcea-TL and Satu Mare-SM, due to their natural conditions – low altitudes, low values of the liquid flow – which do not favor the occurrence of extreme natural phenomena. (B). Air quality (AirQual) The values of the atmospheric pollutants emissions represent an important element in the definition of the impact of the socioeconomic development on the environment due to the fact that the atmosphere is the largest and, at the same time, the most unpredictable vector of propagation for pollutants, whose effects are felt directly and indirectly by man and by the other environmental components. The indicators concerning the air quality were determined based on the data provided by the air quality monitoring system and the emission inventories, the main goal being to evaluate concrete situations by comparing them to the quality targets established by today’s regulations. Gaseous pollutants can persist from a few hours to a few days in the atmosphere, and can be transported several hundred kilometers away from the place where they were produced. Consequently, gas emissions were monitored with an acidifying effect, the precursors of the oxidant Surd Vasile, Alexe Rădiţa, Kantor Camelia-Maria, Tanislav Dănuţ, Sencovici Mihaela pollutants, the compounds that remain in the environment for a long time, and the gases with a direct impact on climatic changes. The indicators are: 9. sulphur dioxide - SO2; 10. nitrogen oxides – NOx; 11. ammonia - NH3; 12. non-metallic volatile organic compounds - NMVOC; 13. heavy metals; 14. dusts in suspension PM10; 15. ozone – O3; 16. greenhouse effect gases – CO2, CH4, N2O. The most exposed territorial units were determined as follows (Fig. 3): Bucharest (the largest industrial-urban concentration of the country, with diverse air pollution sources: industrial enterprises, usually concentrated on large industrial platforms, and also intercalated with intensively populated areas; traffic, especially along the large arteries, including heavy means of transportation; building sites and concrete mixers; thermoelectric power station), Prahova-PH (oil distilleries, the pharmaceutical industry, waste platforms and intensive animal breeding), Gorj-GJ (emissions coming from burning fossil fuels in power stations and processing industries – the high voltage power plants of Turceni, Rovinari and Motru), Dâmboviţa-DB (especially in the sector of bird breeding and the emissions in the sector of home heat production), Iaşi-IS (dejections from animal breeding and nitrogen-rich chemical fertilizers applied, as well as waste treatment and depositing; home heat production, railroad and road transport) and Sibiu-SB (heavy metals – the major source being the activities in the zinc- and leadproducing metallurgical industry from Copşa Mică). The least exposed counties were those with a weaker concentration of the industrial activities, such as: Tulcea-TL, Bistriţa-Năsăud-BN, VasluiVS, Cluj-CJ, Bacău-BC, Covasna-CV, Satu MareSM and Timiş-TM. 21. endangered species; 22. vulnerable species; 23. rare species; 24. endemic species; 25. protected areas. The most exposed counties were those hosting natural ecosystems with a great diversity of mammal, bird and invertebrate species (Fig. 4): Bihor-BH (high concentration of the number of bird, mammal, amphibian, reptile, fish and invertebrate species, of interest for the country and for the community, validated as Natura 2000 sites), Mehedinţi-MH (diversity of plant species – rare, endangered and endemic), Iaşi-IS (high number of natural habitats), Braşov-BV, Hunedoara-HD, Satu Mare-SM and Constanţa-CT (high number of protected plant and animal species). The least exposed were: Bucharest municipality, Brăila-BR, Teleorman-TR, Călăraşi-CL, DoljDJ and Ialomiţa-IL (the strong anthropic impact (C). Biodiversity (Biodiv) Biodiversity assures the ecosystems’ optimal functionality, expressing the environment’s capacity to adapt to changes caused by any destructive human action. Yet, lately, the issue of biodiversity conservation in point of ecosystems and species is becoming increasingly acute because of the intensification of the human impact. In this context, beside the elements that are specific to biodiversity and its conservation (endangered natural habitats and endangered plant and animal species, protected natural areas), a series of characteristics were selected, expressing the influence of the geographic conditions on the repartition of biodiversity (habitat fragmentation because of road arrangement, extension or form of the territorial unit under analysis, number of neighbors): 17. county dispersion; 18. habitat fragmentation; 19. neighbors; 20. natural habitats; Figure 3. Air quality Figure 2. Natural hazards Geographica Pannonica • Volume 15, Issue 2, 42-50 (June 2011) 45 The Evaluation of the Environmental Quality in Romania Figure 4. Biodiversity of the industry and of the intensive agriculture determined the unreasonable exploitation of the wild plant and animal species, or the destruction or disappearance of the habitats where they used to live). (D). Water and human health (WaterHealth) Water resources have a major economic and environmental importance, constituting a basic element of the ecosystems. Their deterioration represents a pressure on the natural resources and on the population that should not be neglected. The impact on the environment depends on the existence of effective anti-polluting technologies, and on the existing agricultural and industrial activities. The selected indicators are: 26. water consumption; 27. population density; 28. population increase; 29. sanitary services; 30. river water con- Figure 5. Water and human health 46 Geographica Pannonica • Volume 15, Issue 2, 42-50 (June 2011) dition; 31. drinkable water; 32. public sewerage; 33. ratio of diseases. The most exposed were the counties situated in areas with insufficient humidity, corresponding to the low plains and plateaus, where water resources are intensely used for irrigations and fisheries; to this aspect one can add as well a weak development of the drinkable water distribution network and of the public sewerage network, with negative consequences on the number of catching diseases recorded following the consumption of water: Giurgiu-GR, Vaslui-VS, Dolj-DJ and Călăraşi-CL (Fig. 5). The least exposed counties were: PrahovaPH, Constanţa-CT, Vâlcea-VL, Maramureş-MM, Harghita-HR and Arad-AR (with a large number of localities with centralized potable water systems and public sewerage, and a better organized sanitary services system). (E). Soil quality (SoilQual) Soils determine the agricultural production and the condition of the vegetal layer, as well as the river, lake and underground water quality. They regulate the liquid and solid flow in the hydrographic basins, and act for diminishing air and water pollution by retaining, recycling and neutralizing pollutants, such as chemicals used in agriculture, wastes, organic residues and other chemical substances. Consequently, characteristic indicators were selected concerning the soil degradation potential and the appearance of the danger of desertification: 34. relief energy; 35. natural vegetation; 36. modifications of the vegetation; 37. fertilizers; 38. pesticides; 39. degraded lands; 40. polluted lands; 41. biotechnologies. The most exposed were the counties (Fig. 6): Satu Mare-SM (soils polluted through chemical treatments accumulated year in year out, through gleying and pseudo-gleying processes, moderate/ strong acidity and secondary compaction), GalaţiGL (large extension of the agricultural lands and continual increase of the quantities of chemical fertilizers and pesticides), Dâmboviţa-DB (high potential of natural and anthropic land degradation), Călăraşi-CL (high ratio of the arable lands, intensive use of chemical fertilizers, as well as the existence of large areas with GMOs), and Ilfov-IF (forest vegetation deficit because of the deforestation related to the human habitats and the arable lands extension ). The least exposed are the counties which have kept a certain balance between the natural vegetation and the agricultural areas, with a restrained use of fertilizers and pesticides, the main restrictions in relation to soil quality being given by the occurrence of natural phenomena and to a Surd Vasile, Alexe Rădiţa, Kantor Camelia-Maria, Tanislav Dănuţ, Sencovici Mihaela lesser extent of anthropic phenomena: Vâlcea-VL, Bistriţa-Năsăud-BN, Caraş- Severin-CS, Harghita-HR and Maramureş-MM. (F). Economic activities (EconAct) This environmental quality element refers to the pressures exerted by the economic activities (agriculture, fishing, industry, tourism, transports). The economic activity is a determining factor for the environmental quality and protection considering the sustainable development. On the one hand, the economic growth exerts a pressure on the environment through pollution and the natural resources used. On the other hand, the economic growth provides opportunities concerning the public expenses for environmental protection and for financing the necessary research to introduce clean technologies that consume less natural resources. The indicator are: 42. animal agricultural production; 43. fishing; 44. processing industry; 45. oil extraction; 46. mining production; 47. tourists; 48. vehicles; 49. accidental pollutions; 50. waste production. The most exposed administrative units were (Fig. 7): Dâmboviţa-DB (high density of animal population, oil products extraction, transport and depositing), Prahova-PH, Argeş-AG (development of the zootechnical sector, accidental pollutions given by oil products transport and processing), Bucharest municipality (high concentration of industrial activities, numerous cars, high volume of waste and intense tourism), and Ilfov-IF (intensive animal breeding). The least exposed counties are: Călăraşi-CL, Vaslui-VS, Harghita-HR, Tulcea-TL, Botoşani-BT, Bistriţa Năsăud-BN, VranceaVN, Arad-AR and Mehedinţi-MH, with a less significant industrial development and a higher weight of the agricultural activities, to which can be added low values of the urban settlements density, the result being a less significant impact on the environment. By combining (summing up) the value of each group of indicators, we obtained as a result the value of the total environmental quality (Fig. 8). A very high vulnerability characterizes the counties overlapping areas highly susceptible to the occurrence of extreme phenomena (drought, strong winds, landslides, waves of heat and cold, earthquakes), industrial activities (metal production and processing, building materials, oil extraction) and agricultural activities (intensive agriculture using fertilizers and pesticides), with a significant impact on the environmental factors, which sometimes host significant natural ecosystems, too: (1) Iaşi-IS; (2) Ilfov-IF and (3) Dâmboviţa-DB. The counties with a very good environmental quality were: Tulcea-TL, Harghita-HR, Bistriţa Năsăud-BN, Maramureş-MM and Caraş Sever- Figure 6. Soil quality in-CS, characterized by a weaker development of the agricultural and industrial activities, to which are usually associated low population and human settlement densities, which triggers a lower pressure on the environmental factors (soil, air, water), much better highlighted if the respective territories are situated in areas little prone to the manifestation of extreme natural phenomena. This can be explained as well through an extension of the ecological activities (mainly tourism and the designation of protected areas). The environmental indicators’ model relies on the fact that, on the one hand, the environmental condition has certain precise causes and, on the other hand, it imposes an effort from society in order to diminish and even eliminate the negative environmental effects of the human activities or of the natural anomalies. Figure 7. Economic activities Geographica Pannonica • Volume 15, Issue 2, 42-50 (June 2011) 47 The Evaluation of the Environmental Quality in Romania Although there seems to be a linear relation between human activity and environment, in reality, things are much more complex. Using Kendall’s coefficient of concordance, it can be stated that there is a connection between environmental condition, GDP/inhabitant1 and poverty rate2 (0.57 respectively 0.44). In other words, the units (counties) with a high quality environmental record low values of GDP and high values of the poverty rate. Lack of economic activities (with the possibility of degrading environmental factors) does not diminish its quality, but human communities do not receive significant revenue from activities considered clean. Conclusion Figure 8. Integral map of the environmental quality 28 26 24 env qua 22 20 18 16 14 12 10 0 50 100 150 200 250 300 350 400 GDP/inhb 28 26 24 env qua 22 20 18 16 14 12 10 0.00 0.25 0.30 0.35 0.40 0.45 poverty rate Figure 9. Environmental quality in relation to the GDP/inhabitant and the poverty rate 48 Geographica Pannonica • Volume 15, Issue 2, 42-50 (June 2011) Once the regions (counties) with a weak environmental quality were identified, future challenges consist in finding the reasons that triggered this situation with the purpose of delimiting the actions and measures that must be taken. The actions should be formulated with a view to removing the reasons of environmental degradation, and consequently, to choosing and delimiting the necessary instruments. These actions must not be applied only by the governmental factors of decision, but also by individuals, private companies and non-profit agencies. It is important to mention as well that, even though human activities exert pressure on the environment and change the condition of the environmental quality, it is also the human society that adopts measures of environmental, economic and activity oriented policies. The present analysis offers the chance to identify the regions that need to be allotted financial resources in order to diminish the negative impact of the disturbing (anthropic and natural) factors. Administrative-territorial units most exposed or with a low environmental quality should be considered for a series of measures to mitigate adverse ef1 Gross domestic product (GDP), by National Institute of Statistics (www.insse.ro), represents the final result of the production activity of resident producer units. This aggregate could be calculated according to the following approaches: production approach, expenditure approach, income approach. 2 In accordance with CASPIS (Anti Poverty and Social Inclusion Commision), the poverty threshold is defined depending on the household consumption, including an alimentary and a non-alimentary component. The alimentary component is calculated as value of an alimentary basket with a content of 2,550 calories, taking into account the structure of the alimentary consumption characteristic of the population within the second and the third deciles. The nonalimentary component is evaluated as that nonalimentary consumption level affordable for the households with an alimentary consumption equal with the alimentary threshold (Tanislav et al., 2009). Surd Vasile, Alexe Rădiţa, Kantor Camelia-Maria, Tanislav Dănuţ, Sencovici Mihaela fects, taking into account mainly the parts that are most vulnerable (for example: air quality situation the adoption of policies for upgrading the polluting sectors; biodiversity - the adoption of measures to protect endangered species and increase protected areas; soil quality - the adoption of measures for reducing soil loss and maintaining natural vegetation areas; natural hazards - adoption of measures to mitigate the negative effects of extreme natural phenomena; economic activities - focus on specific activities much lower environmental impact; water and human health – fill the water and needs of medical services in regions faced with a deficit). References Alfsen, K.H., Hans, V.S. 1993. Environmental Quality Indicators: Background, Principles and Examples from Norway. Environmental and Resource Economics 3, 415-435. Backhaus, R., Bock, M., Weiers, S. 2002. The Spatial Dimension of Landscape Sustainability. Environment, Development and Sustainability 4, 237-251. Booysen, F. 2002. An Overview and Evaluation of Composite Indices of Development. Social Indicators Research 59, 115-151. Chess, C., Johnson, B.B., Gibson, G. 2005. Communicating About Environmental Indicators. Journal of Risk Research 8, 1, 63-75. Corvalan, C., Briggs, D., Zielhuis, G. 2000. Decision-making in Environmental Health – from evidence to action. World Health Organization, E&FN Spon, London, 115 pp. Färe, R., Grosskopf, S., Hernandez-Sancho, F. 2004. Environmental Performance: An Index Number Approach. Resource and Energy Economic, 26, 343-352. Grafton, R.Q., Knowles, S. 2004. Social Capital and National Environmental Performance: A Cross-Sectional Analysis. Journal of Environment & Development, 13, 4, 336-370. Levett, R. 1998. Sustainability Indicators - Integrating Quality of Life and Environmental Protection. Journal of the Royal Statistical Society, Series A (Statistics in Society, 161, 3, 291-302. Parris, T.M., Kates, R.W. 2003. Characterizing and Measuring Sustainable Development. Annual Review of Environment and Resources 28, 559-586. Păltineanu, C., Mihăilescu, I.F., Seceleanu, I., Dragotă, C., Vasenciuc, F. 2007. Aridity, drought, evapotranspiration and water requirements of crops in Romania. Ovidius University Press, Constanta, 319 pp. (in Romanian with English summary). Polfeldt, T. 2006. Making Environment Statistics Useful: A Third World Perspective. Environmetrics 17, 219-226. Tanislav, D., Costache, A., Murătoreanu, G. 2009. Vulnerability to natural hazards in Romania. Forum Geografic 8, 8, 131-138. * * * 1997. Glossary of Environment Statistics. Studies in Methods, Series F 67, UN, New York. * * * 2005, SOPAC (South Pacific Applied Geoscience Commission), The Environmental Vulnerability Index (EVI), SOPAC Technical Report 384. Available at: http://www.vulnerabilityindex.net/EVI_2005.htm. * * * 2005, CIESIN (Center for International Earth Science Information Network) Columbia University & YCELP (Yale Center for Environmental Law and Policy), Environmental Sustainability Index (ESI). Available at: http://sedac. ciesin.columbia.edu/es/esi. * * * 2008. Romanian Climate. Romanian Academy Press, Bucharest, 365 pp. (in Romanian with English summary). * * * 2010, Yale Center for Environmental Law and Policy, Yale University & Center for International Earth Science Information Network (CIESIN), Columbia University, in collaboration with World Economic Forum - Geneva, Switzerland & Joint Research Centre of the European Commission - Ispra, Italy, Environmental Performance Index (EPI). Available at: http://epi.yale. edu or http://sedac.ciesin.columbia.edu/es/epi/. CASPIS (Anti Poverty and Social Inclusion Commision). Available at: http://www.caspis.ro Geographica Pannonica • Volume 15, Issue 2, 42-50 (June 2011) 49 The Evaluation of the Environmental Quality in Romania Appendix (A). Natural hazards (B). Air quality 1. strong winds (average annual frequency of the days when the wind exceeded 16 m/s); 2. drought periods (frequency of the years with WASP<-1,5); 3. wet periods (frequency of the years with WASP>1,5); 4. heat waves (absolute maximum yearly temperatures with a return period of 50 years); 5. cold waves (absolute minimum yearly temperatures with a return period of 50 years); 6. earthquakes (peak values of the land acceleration, having an average recurrence interval ARI=100 years); 7. landslides (primary and/or reactivated landslides, according to their potential of occurrence – low, average and high); 8. floods (floods caused by the overflow of a watercourse or by torrents). 9. sulphur dioxide - SO2 (annual emissions – t/year); 10.nitrogen oxides – NO x (annual emissions of NO and NO2 – t/ year); 11.ammonia - NH3 (annual emissions – t/year); 12. non-metallic volatile organic compounds - NMVOC (annual emissions – t/year); 13.heavy metals (annual emissions of Hg, Cd, Pb and Ni – kg/ year); 14. dusts in suspension PM10 (average annual concentration – μg/m3); 15.ozone – O3 (average annual concentration – μg/m3); 16.greenhouse effect gases – CO2 , CH4 , N2O (annual emissions expressed in CO2 equivalent – thousands t/year). (C). Biodiversity (D). Water and human health 17. county dispersion (length of the boundaries / area); 18.habitat fragmentation (road network density); 19.neighbors (number of neighbors on land or water); 20.natural habitats (number of habitats of interest for the community); 21.endangered species (number of endangered species/area); 22.vulnerable species (number of vulnerable species/area); 23.rare species (number of rare species / area); 24.endemic species (number of endemic species/area); 25.protected areas (biosphere reserves, Ramsar sites, national or natural parks, natural reserves and monuments; Natura 2000 sites: sites of community importance or special protection areas). 26.water consumption (total volume taken as percentage of the water resources that can technically be used – surface and underground waters); 27. population density (inhabitants/km2); 28.population increase (present number of inhabitants as percentage of the number of inhabitants of the last population census, namely 2009 compared to 1989); 29.sanitary services (hospital beds/health centers and doctors); 30.river water condition (density of the waters belonging to the 3rd-5th quality classes); 31.drinkable water (localities with drinkable water installations; simple total length of the potable water distribution network); 32. public sewerage (localities with public sewerage installations; simple total length of the sewerage pipes); 33.ratio of diseases (number of infections/100.000 inhabitants due to respiratory and intestinal diseases). (E). Soil quality (F). Economic activities 34.relief energy (difference between maximum and minimum altitude); 35.natural vegetation (weight of the remaining natural and secondary vegetation, namely: forests, steppe and sylvosteppe, subalpine and alpine associations); 36. modifications of the vegetation (percentage of the modification of the natural vegetal layer, by comparing the present situation to that of 1910); 37. fertilizers (chemical fertilizers used: N, P 2O5, K 2O – tons of active substance /km2); 38.pesticides (quantity of products for plant protection: herbicides, fungicides, insecticides – tons of active substance / km2); 39.degraded lands (ratio of the area affected in a strong, very strong and excessively strong way, by natural processes in the total of the county’s area; shallow and deep erosion and landslides; primary and secondary compaction; clogging; salt-affected soils; acidic soils; water excess; excess or deficit of nutrients and organic matter); 40.polluted lands (ratio of the area affected in a strong, very strong and excessively strong way, by different industrial and agricultural activities in the county’s total area: surface excavation works; waste dumps, decantation ponds, sterile dumps, waste deposits: industrial, agricultural and forestry waste and residues; air-borne substances; radioactive matters; animal and human dejections; pesticides; contaminating pathogenic agents; salty water and oil products); 41.biotechnologies (area occupied by GMOs). 42.animal agricultural production (yearly quantity of products of animal origin: meat, milk, wool, eggs, honey); 43.fishing (yearly fish quantity in the inland or marine waters and aquaculture); 44.processing industry (turnover in industry and the number of active local units in the industry, on size classes according to the number of employees); 45.oil extraction (density of oil derricks); 46.mining production (value of the mining production: brown coal, lignite, copper, complex concentrates, iron and manganese ores, gold-silver, salt – thousands of tons); 47. tourists (yearly number of tourists – nights spent in a boarding place); 48.vehicles (number of vehicles); 49.accidental pollutions (number of cases of accidental pollutions or major environmental accidents occurring in all its structures and for very complex reasons); 50.waste production (total quantity of municipal waste, generated by manufacturing, batteries and accumulators, medical activities, electric and electronic equipments). 50 Geographica Pannonica • Volume 15, Issue 2, 42-50 (June 2011)


© Copyright 2026