
FORM 10-Q
UNITED STATES
SECURITIES AND EXCHANGE COMMISSION
Washington, D.C. 20549
FORM 10-Q
⌧ QUARTERLY REPORT PURSUANT TO SECTION 13 OR 15(d) OF THE SECURITIES EXCHANGE ACT OF 1934
(Mark One)
For the quarterly period ended December 27, 2014
or
TRANSITION REPORT PURSUANT TO SECTION 13 OR 15(d) OF THE SECURITIES EXCHANGE ACT OF 1934
to
For the transition period from
.
Commission File Number: 001-36743
Apple Inc.
(Exact name of registrant as specified in its charter)
California
94-2404110
(State or other jurisdiction
of incorporation or organization)
(I.R.S. Employer Identification No.)
1 Infinite Loop
Cupertino, California
95014
(Address of principal executive offices)
(Zip Code)
(408) 996-1010
(Registrant’s telephone number, including area code)
Indicate by check mark whether the registrant (1) has filed all reports required to be filed by Section 13 or 15(d) of the Securities
Exchange Act of 1934 during the preceding 12 months (or for such shorter period that the registrant was required to file such reports),
and (2) has been subject to such filing requirements for the past 90 days.
Yes
⌧
No
Indicate by check mark whether the registrant has submitted electronically and posted on its corporate Web site, if any, every
Interactive Data File required to be submitted and posted pursuant to Rule 405 of Regulation S-T (§232.405 of this chapter) during the
preceding 12 months (or for such shorter period that the registrant was required to submit and post such files).
Yes
⌧
No
Indicate by check mark whether the registrant is a large accelerated filer, an accelerated filer, a non-accelerated filer, or a smaller
reporting company. See the definitions of “large accelerated filer,” “accelerated filer” and “smaller reporting company” in Rule 12b-2 of
the Exchange Act.
Large accelerated filer
Non-accelerated filer
⌧
(Do not check if a smaller reporting company)
Accelerated filer
Smaller reporting company
Indicate by check mark whether the registrant is a shell company (as defined in Rule 12b-2 of the Exchange Act).
Yes
No
⌧
5,824,748,000 shares of common stock, par value $0.00001 per share, issued and outstanding as of January 9, 2015
Apple Inc.
Form 10-Q
For the Fiscal Quarter Ended December 27, 2014
TABLE OF CONTENTS
Page
Part I
Item 1.
Item 2.
Item 3.
Item 4.
Financial Statements
Management’s Discussion and Analysis of Financial Condition and Results of Operations
Quantitative and Qualitative Disclosures About Market Risk
Controls and Procedures
3
24
38
38
Item 1.
Item 1A.
Item 2.
Item 3.
Item 4.
Item 5.
Item 6.
Part II
Legal Proceedings
Risk Factors
Unregistered Sales of Equity Securities and Use of Proceeds
Defaults Upon Senior Securities
Mine Safety Disclosures
Other Information
Exhibits
39
40
50
50
50
50
51
2
PART I—FINANCIAL INFORMATION
Item 1.
Financial Statements
Apple Inc.
CONDENSED CONSOLIDATED STATEMENTS OF OPERATIONS (Unaudited)
(In millions, except number of shares which are reflected in thousands and per share amounts)
Three Months Ended
December 27,
December 28,
2014
2013
Net sales
Cost of sales
Gross margin
$
Operating expenses:
Research and development
Selling, general and administrative
Total operating expenses
Operating income
Other income/(expense), net
Income before provision for income taxes
74,599
44,858
29,741
$
57,594
35,748
21,846
1,895
3,600
5,495
1,330
3,053
4,383
24,246
170
24,416
17,463
246
17,709
Provision for income taxes
Net income
$
6,392
18,024
$
4,637
13,072
Earnings per share:
Basic
Diluted
$
$
3.08
3.06
$
$
2.08
2.07
Shares used in computing earnings per share:
Basic
Diluted
5,843,082
5,881,803
Cash dividends declared per common share
$
0.47
See accompanying Notes to Condensed Consolidated Financial Statements.
3
6,272,504
6,310,161
$
0.44
Apple Inc.
CONDENSED CONSOLIDATED STATEMENTS OF COMPREHENSIVE INCOME (Unaudited)
(In millions)
Three Months Ended
December 27,
December 28,
2014
2013
Net income
$
Other comprehensive income/(loss):
Change in foreign currency translation, net of tax
Change in unrecognized gains/losses on derivative instruments:
Change in fair value of derivatives, net of tax
Adjustment for net losses/(gains) realized and included in net income, net of
tax
Total change in unrecognized gains/losses on derivative instruments, net
of tax
Change in unrealized gains/losses on marketable securities:
Change in fair value of marketable securities, net of tax
Adjustment for net losses/(gains) realized and included in net income, net of
tax
Total change in unrealized gains/losses on marketable securities, net of
tax
Total other comprehensive income/(loss)
Total comprehensive income
$
18,024
(66)
1,982
(565)
1,417
13,072
(67)
213
72
285
(456)
(42)
(14)
(11)
(470)
881
18,905 $
See accompanying Notes to Condensed Consolidated Financial Statements.
4
$
(53)
165
13,237
Apple Inc.
CONDENSED CONSOLIDATED BALANCE SHEETS (Unaudited)
(In millions, except number of shares which are reflected in thousands and par value)
December 27,
2014
ASSETS:
Current assets:
Cash and cash equivalents
Short-term marketable securities
Accounts receivable, less allowances of $87 and $86, respectively
Inventories
Deferred tax assets
Vendor non-trade receivables
Other current assets
Total current assets
Long-term marketable securities
Property, plant and equipment, net
Goodwill
Acquired intangible assets, net
Other assets
Total assets
$
$
19,478
12,985
16,709
2,283
5,046
13,267
13,635
83,403
145,492
20,392
4,629
4,370
3,608
261,894
September 27,
2014
$
$
13,844
11,233
17,460
2,111
4,318
9,759
9,806
68,531
130,162
20,624
4,616
4,142
3,764
231,839
LIABILITIES AND SHAREHOLDERS’ EQUITY:
Current liabilities:
Accounts payable
Accrued expenses
Deferred revenue
Commercial paper
Total current liabilities
$
Deferred revenue – non-current
Long-term debt
Other non-current liabilities
Total liabilities
38,001
22,724
8,987
3,899
73,611
$
30,196
18,453
8,491
6,308
63,448
3,480
32,504
28,971
138,566
3,031
28,987
24,826
120,292
24,187
97,178
1,963
123,328
261,894
23,313
87,152
1,082
111,547
231,839
Commitments and contingencies
Shareholders’ equity:
Common stock and additional paid-in capital, $0.00001 par value: 12,600,000
shares authorized; 5,826,419 and 5,866,161 shares issued and outstanding,
respectively
Retained earnings
Accumulated other comprehensive income/(loss)
Total shareholders’ equity
Total liabilities and shareholders’ equity
$
See accompanying Notes to Condensed Consolidated Financial Statements.
5
$
Apple Inc.
CONDENSED CONSOLIDATED STATEMENTS OF CASH FLOWS (Unaudited)
(In millions)
Three Months Ended
December 27,
December 28,
2014
2013
Cash and cash equivalents, beginning of the period
Operating activities:
Net income
Adjustments to reconcile net income to cash generated by operating activities:
Depreciation and amortization
Share-based compensation expense
Deferred income tax expense
Changes in operating assets and liabilities:
Accounts receivable, net
Inventories
Vendor non-trade receivables
Other current and non-current assets
Accounts payable
Deferred revenue
Other current and non-current liabilities
Cash generated by operating activities
Investing activities:
Purchases of marketable securities
Proceeds from maturities of marketable securities
Proceeds from sales of marketable securities
Payments made in connection with business acquisitions, net
Payments for acquisition of property, plant and equipment
Payments for acquisition of intangible assets
Other
Cash used in investing activities
Financing activities:
Proceeds from issuance of common stock
Excess tax benefits from equity awards
Taxes paid related to net share settlement of equity awards
Dividends and dividend equivalents paid
Repurchase of common stock
Proceeds from issuance of long-term debt, net
Repayments of commercial paper, net
Cash used in financing activities
Increase/(decrease) in cash and cash equivalents
Cash and cash equivalents, end of the period
Supplemental cash flow disclosure:
Cash paid for income taxes, net
Cash paid for interest
$
$
$
$
13,844
14,259
18,024
13,072
2,575
888
2,197
2,144
681
1,253
751
(172)
(3,508)
(1,648)
9,003
945
4,667
33,722
(1,098)
(358)
(3,459)
(319)
8,191
1,368
1,195
22,670
(44,915)
2,807
24,166
(23)
(3,217)
(48)
65
(21,165)
(48,397)
5,556
30,302
(525)
(1,985)
(59)
5
(15,103)
80
264
(512)
(2,801)
(5,030)
3,485
(2,409)
(6,923)
5,634
19,478 $
3,869
202
See accompanying Notes to Condensed Consolidated Financial Statements.
6
$
$
$
134
280
(365)
(2,769)
(5,029)
0
0
(7,749)
(182)
14,077
3,387
161
Apple Inc.
Notes to Condensed Consolidated Financial Statements (Unaudited)
Note 1 – Summary of Significant Accounting Policies
Apple Inc. and its wholly-owned subsidiaries (collectively “Apple” or the “Company”) designs, manufactures and markets mobile
communication and media devices, personal computers and portable digital music players, and sells a variety of related software,
services, accessories, networking solutions and third-party digital content and applications. The Company sells its products
worldwide through its retail stores, online stores and direct sales force, as well as through third-party cellular network carriers,
wholesalers, retailers and value-added resellers. In addition, the Company sells a variety of third-party iPhone, iPad, Mac and
iPod compatible products, including application software, and various accessories through its online and retail stores. The
Company sells to consumers, small and mid-sized businesses and education, enterprise and government customers.
Basis of Presentation and Preparation
The accompanying condensed consolidated financial statements include the accounts of the Company. Intercompany accounts
and transactions have been eliminated. The preparation of these condensed consolidated financial statements in conformity with
U.S. generally accepted accounting principles (“GAAP”) requires management to make estimates and assumptions that affect the
amounts reported in these condensed consolidated financial statements and accompanying notes. Actual results could differ
materially from those estimates.
Certain prior period amounts in the notes to the condensed consolidated financial statements have been reclassified to conform
to the current period’s presentation. In the first quarter of 2015, the Company changed its reportable operating segments and
began allocating certain costs to its operating segments that were previously included in other corporate expenses. The
Company has reclassified the corresponding prior period amounts to conform to the current period’s presentation as further
described in Note 11, “Segment Information and Geographic Data.”
These condensed consolidated financial statements and accompanying notes should be read in conjunction with the Company’s
annual consolidated financial statements and the notes thereto for the fiscal year ended September 27, 2014, included in its
Annual Report on Form 10-K (the “2014 Form 10-K”). The Company’s fiscal year is the 52 or 53-week period that ends on the
last Saturday of September. An additional week is included in the first fiscal quarter approximately every six years to realign fiscal
quarters with calendar quarters. The Company’s fiscal years 2015 and 2014 each include 52 weeks. Unless otherwise stated,
references to particular years, quarters or months refer to the Company’s fiscal years ended in September and the associated
quarters or months of those fiscal years.
Earnings Per Share
Basic earnings per share is computed by dividing income available to common shareholders by the weighted-average number of
shares of common stock outstanding during the period. Diluted earnings per share is computed by dividing income available to
common shareholders by the weighted-average number of shares of common stock outstanding during the period increased to
include the number of additional shares of common stock that would have been outstanding if the potentially dilutive securities
had been issued. Potentially dilutive securities include outstanding stock options, shares to be purchased under the Company’s
employee stock purchase plan, unvested restricted stock and unvested restricted stock units (“RSUs”). The dilutive effect of
potentially dilutive securities is reflected in diluted earnings per share by application of the treasury stock method. Under the
treasury stock method, an increase in the fair market value of the Company’s common stock can result in a greater dilutive effect
from potentially dilutive securities.
The following table shows the computation of basic and diluted earnings per share for the three months ended December 27,
2014 and December 28, 2013 (net income in millions and shares in thousands):
Three Months Ended
December 27,
December 28,
2014
2013
Numerator:
Net income
$
Denominator:
Weighted-average shares outstanding
Effect of dilutive securities
Weighted-average diluted shares
18,024
$
5,843,082
38,721
5,881,803
Basic earnings per share
Diluted earnings per share
$
$
3.08
3.06
13,072
6,272,504
37,657
6,310,161
$
$
2.08
2.07
Potentially dilutive securities whose effect would have been antidilutive were not significant for the three months ended
December 27, 2014 and December 28, 2013. The Company excluded these securities from the computation of diluted earnings
per share.
7
Note 2 – Financial Instruments
Cash, Cash Equivalents and Marketable Securities
The following tables show the Company’s cash and available-for-sale securities’ adjusted cost, gross unrealized gains,
gross unrealized losses and fair value by significant investment category recorded as cash and cash equivalents or shortor long-term marketable securities as of December 27, 2014 and September 27, 2014 (in millions):
December 27, 2014
Adjusted
Cost
Cash
$
1 (1):
Level
Money market funds
Mutual funds
Subtotal
Level 2 (2):
U.S. Treasury securities
U.S. agency securities
Non-U.S. government securities
Certificates of deposit and time deposits
Commercial paper
Corporate securities
Municipal securities
Mortgage- and asset-backed securities
Subtotal
Total
$
13,757
Unrealized
Gains
$
0
Unrealized
Losses
$
0 $
Fair
Value
13,757
Cash and
Cash
Equivalents
Short-Term
Marketable
Securities
$
$
13,757
0
Long-Term
Marketable
Securities
$
0
3,346
2,544
5,890
0
0
0
0
(159)
(159)
3,346
2,385
5,731
3,346
0
3,346
0
2,385
2,385
0
0
0
35,107
6,788
6,498
2,778
1,159
92,371
939
13,501
159,141
16
2
58
0
0
159
4
32
271
(58)
(11)
(105)
0
0
(720)
(1)
(50)
(945)
35,065
6,779
6,451
2,778
1,159
91,810
942
13,483
158,467
545
582
0
272
879
97
0
0
2,375
692
291
177
1,168
280
7,932
0
60
10,600
33,828
5,906
6,274
1,338
0
83,781
942
13,423
145,492
(1,104) $
177,955
178,788
$
271
$
$
19,478
$
12,985
$
145,492
September 27, 2014
Adjusted
Cost
Cash
$
Level 1 (1):
Money market funds
Mutual funds
Subtotal
Level 2 (2):
U.S. Treasury securities
U.S. agency securities
Non-U.S. government securities
Certificates of deposit and time deposits
Commercial paper
Corporate securities
Municipal securities
Mortgage- and asset-backed securities
Subtotal
Total
$
10,232
Unrealized
Gains
$
0
Unrealized
Losses
$
0 $
Fair
Value
10,232
Cash and
Cash
Equivalents
Short-Term
Marketable
Securities
$
$
10,232
0
Long-Term
Marketable
Securities
$
0
1,546
2,531
4,077
0
1
1
0
(132)
(132)
1,546
2,400
3,946
1,546
0
1,546
0
2,400
2,400
0
0
0
23,140
7,373
6,925
3,832
475
85,431
940
12,907
141,023
15
3
69
0
0
296
8
26
417
(9)
(11)
(69)
0
0
(241)
0
(49)
(379)
23,146
7,365
6,925
3,832
475
85,486
948
12,884
141,061
12
652
0
1,230
166
6
0
0
2,066
607
157
204
1,233
309
6,298
0
25
8,833
22,527
6,556
6,721
1,369
0
79,182
948
12,859
130,162
(511) $
155,239
155,332
$
418
$
$
13,844
$
11,233
(1)
The fair value of Level 1 securities is estimated based on quoted prices in active markets for identical assets or
liabilities.
(2)
The fair value of Level 2 securities is estimated based on observable inputs other than quoted prices in active
markets for identical assets and liabilities, quoted prices for identical or similar assets or liabilities in inactive markets,
or other inputs that are observable or can be corroborated by observable market data for substantially the full term of
the assets or liabilities.
8
$
130,162
The Company may sell certain of its marketable securities prior to their stated maturities for strategic reasons including, but
not limited to, anticipation of credit deterioration and duration management. The net realized gains or losses recognized by
the Company related to such sales were not significant during the three months ended December 27, 2014 and
December 28, 2013. The maturities of the Company’s long-term marketable securities generally range from one to five
years.
As of December 27, 2014 and September 27, 2014, gross unrealized losses related to individual securities that had been in
a continuous loss position for 12 months or longer were not significant.
As of December 27, 2014, the Company considers the declines in market value of its marketable securities investment
portfolio to be temporary in nature and does not consider any of its investments other-than-temporarily impaired. The
Company typically invests in highly-rated securities, and its investment policy generally limits the amount of credit exposure
to any one issuer. The policy generally requires investments to be investment grade, with the primary objective of
minimizing the potential risk of principal loss. Fair values were determined for each individual security in the investment
portfolio. When evaluating an investment for other-than-temporary impairment the Company reviews factors such as the
length of time and extent to which fair value has been below its cost basis, the financial condition of the issuer and any
changes thereto, changes in market interest rates and the Company’s intent to sell, or whether it is more likely than not it
will be required to sell the investment before recovery of the investment’s cost basis. During the three months ended
December 27, 2014 and December 28, 2013, the Company did not recognize any significant impairment charges.
Derivative Financial Instruments
The Company uses derivatives to partially offset its business exposure to foreign currency and interest rate risk on expected
future cash flows, on net investments in certain foreign subsidiaries and on certain existing assets and liabilities. However,
the Company may choose not to hedge certain exposures for a variety of reasons including, but not limited to, accounting
considerations and the prohibitive economic cost of hedging particular exposures. There can be no assurance the hedges
will offset more than a portion of the financial impact resulting from movements in foreign currency exchange or interest
rates.
To help protect gross margins from fluctuations in foreign currency exchange rates, certain of the Company’s subsidiaries
whose functional currency is the U.S. dollar may hedge a portion of forecasted foreign currency revenue, and subsidiaries
whose functional currency is not the U.S. dollar and who sell in local currencies may hedge a portion of forecasted inventory
purchases not denominated in the subsidiaries’ functional currencies. The Company may enter into forward contracts,
option contracts or other instruments to manage this risk and may designate these instruments as cash flow hedges. The
Company typically hedges portions of its forecasted foreign currency exposure associated with revenue and inventory
purchases, typically for up to 12 months.
To help protect the net investment in a foreign operation from adverse changes in foreign currency exchange rates, the
Company may enter into foreign currency forward and option contracts to offset the changes in the carrying amounts of
these investments due to fluctuations in foreign currency exchange rates. The Company designates these instruments as
net investment hedges.
The Company may also enter into non-designated foreign currency contracts to partially offset the foreign currency
exchange gains and losses generated by the re-measurement of certain assets and liabilities denominated in non-functional
currencies.
The Company may enter into interest rate swaps, options, or other instruments to manage interest rate risk. These
instruments may offset a portion of changes in income or expense, or changes in fair value of the Company’s long-term debt
or investments. The Company designates these instruments as either cash flow or fair value hedges. The Company’s
hedged interest rate transactions as of December 27, 2014 are expected to be recognized within twelve years.
Cash Flow Hedges
The effective portions of cash flow hedges are recorded in accumulated other comprehensive income (“AOCI”) until the
hedged item is recognized in earnings. Deferred gains and losses associated with cash flow hedges of foreign currency
revenue are recognized as a component of net sales in the same period as the related revenue is recognized, and deferred
gains and losses related to cash flow hedges of inventory purchases are recognized as a component of cost of sales in the
same period as the related costs are recognized. Deferred gains and losses associated with cash flow hedges of interest
income or expense are recognized in other income/(expense), net in the same period as the related income or expense is
recognized.
The ineffective portions and amounts excluded from the effectiveness testing of cash flow hedges are recognized in other
income/(expense), net. These amounts were not significant during the three months ended December 27, 2014 and
December 28, 2013.
9
Derivative instruments designated as cash flow hedges must be de-designated as hedges when it is probable the
forecasted hedged transaction will not occur in the initially identified time period or within a subsequent two-month time
period. Deferred gains and losses in AOCI associated with such derivative instruments are reclassified immediately into
other income/(expense), net. Any subsequent changes in fair value of such derivative instruments are reflected in other
income and expense unless they are re-designated as hedges of other transactions. The Company did not recognize any
significant net gains or losses related to the loss of hedge designation on discontinued cash flow hedges during the three
months ended December 27, 2014 and December 28, 2013.
Net Investment Hedges
The effective portions of net investment hedges are recorded in other comprehensive income (“OCI”) as a part of the
cumulative translation adjustment. The ineffective portions and amounts excluded from the effectiveness testing of net
investment hedges are recognized in other income/(expense), net. These amounts were not significant during the three
months ended December 27, 2014 and December 28, 2013.
Fair Value Hedges
Gains and losses related to changes in fair value hedges are recognized in earnings along with a corresponding loss or
gain related to the change in value of the underlying hedged item. The ineffective portions and amounts excluded from
the effectiveness testing of fair value hedges recognized were not significant during the three months ended
December 27, 2014 and December 28, 2013.
Non-Designated Derivatives
Derivatives that are not designated as hedging instruments are adjusted to fair value through earnings in the financial
statement line item to which the derivative relates. The net gains and losses recognized for foreign currency forward and
option contracts not designated as hedging instruments was not significant during the three months ended December 27,
2014 and December 28, 2013.
The Company records all derivatives in the Condensed Consolidated Balance Sheets at fair value. The Company’s
accounting treatment for these derivative instruments is based on its hedge designation. The following tables show the
Company’s derivative instruments at gross fair value as of December 27, 2014 and September 27, 2014 (in millions):
Fair Value of
Derivatives
Designated as
Hedge Instruments
December 27, 2014
Fair Value of
Derivatives Not
Designated as
Hedge Instruments
Total
Fair Value
Derivative assets (1):
Foreign exchange contracts
Interest rate contracts
$
$
3,561
201
$
$
501
0
$
$
4,062
201
Derivative liabilities (2):
Foreign exchange contracts
Interest rate contracts
$
$
51
87
$
$
119
0
$
$
170
87
Fair Value of
Derivatives
Designated as
Hedge Instruments
September 27, 2014
Fair Value of
Derivatives Not
Designated as
Hedge Instruments
Total
Fair Value
Derivative assets (1):
Foreign exchange contracts
Interest rate contracts
$
$
1,332
81
$
$
222
0
$
$
1,554
81
Derivative liabilities (2):
Foreign exchange contracts
$
41
$
40
$
81
(1)
The fair value of derivative assets is measured using Level 2 fair value inputs and is recorded as other current assets
in the Condensed Consolidated Balance Sheets.
(2)
The fair value of derivative liabilities is measured using Level 2 fair value inputs and is recorded as accrued expenses
in the Condensed Consolidated Balance Sheets.
10
The following tables show the pre-tax effect of the Company’s derivative instruments designated as cash flow, net
investment and fair value hedges on OCI and the Condensed Consolidated Statements of Operations for the three
months ended December 27, 2014 and December 28, 2013 (in millions):
Gains/(Losses)
Reclassified from AOCI
into Net Income –
Effective Portion
Three Months Ended
December 27,
December 28,
2014
2013
Gains/(Losses)
Recognized in OCI –
Effective Portion
Three Months Ended
December 27,
December 28,
2014
2013
Cash flow hedges:
Foreign exchange contracts
Interest rate contracts
Total
Net investment hedges:
Foreign exchange contracts
$
264
21
285
$
$
2,585 $
(88)
2,497 $
$
762 $
(99)
663 $
$
118 $
24
$
0 $
Gains/(Losses) on
Derivative
Instruments
Three Months Ended
December 27,
December 28,
2014
2013
Fair value hedges:
Interest rate contracts
$
117 $
(74)
(4)
(78)
0
Gains/(Losses)
Related to
Hedged Items
Three Months Ended
December 27,
December 28,
2014
2013
0
$
(117) $
0
The following table shows the notional amounts of the Company’s outstanding derivative instruments and credit risk
amounts associated with outstanding or unsettled derivative instruments as of December 27, 2014 and September 27,
2014 (in millions):
December 27, 2014
Notional
Credit Risk
Amount
Amounts
September 27, 2014
Notional
Credit Risk
Amount
Amounts
Instruments designated as accounting hedges:
Foreign exchange contracts
Interest rate contracts
$
$
55,761
15,513
$
$
3,561
201
$
$
42,945
12,000
$
$
1,333
89
Instruments not designated as accounting hedges:
Foreign exchange contracts
$
39,872
$
501
$
38,510
$
222
The notional amounts for outstanding derivative instruments provide one measure of the transaction volume outstanding
and do not represent the amount of the Company’s exposure to credit or market loss. The credit risk amounts represent
the Company’s gross exposure to potential accounting loss on derivative instruments that are outstanding or unsettled if
all counterparties failed to perform according to the terms of the contract, based on then-current currency or interest rates
at each respective date. The Company’s exposure to credit loss and market risk will vary over time as currency and
interest rates change. Although the table above reflects the notional and credit risk amounts of the Company’s derivative
instruments, it does not reflect the gains or losses associated with the exposures and transactions that the instruments
are intended to hedge. The amounts ultimately realized upon settlement of these financial instruments, together with the
gains and losses on the underlying exposures, will depend on actual market conditions during the remaining life of the
instruments.
11
The Company generally enters into master netting arrangements, which are designed to reduce credit risk by permitting
net settlement of transactions with the same counterparty. To further limit credit risk, the Company generally enters into
collateral security arrangements that provide for collateral to be received or posted when the net fair value of certain
financial instruments fluctuates from contractually established thresholds. The Company presents its derivative assets
and derivative liabilities at their gross fair values in its Condensed Consolidated Balance Sheets. As of December 27,
2014 and September 27, 2014, the Company received $4.2 billion and $2.1 billion, respectively, of cash collateral related
to the derivative instruments under its collateral security arrangements, which were recorded as other current liabilities
within accrued expenses in the Condensed Consolidated Balance Sheets. The Company did not have any derivative
instruments with credit-risk related contingent features that would require it to post additional collateral as of
December 27, 2014 and September 27, 2014.
Under master netting arrangements with the respective counterparties to the Company’s derivative contracts,
the Company is allowed to net settle transactions with a single net amount payable by one party to the other. As of
December 27, 2014 and September 27, 2014, the potential effects of these rights of set-off associated with the
Company’s derivative contracts, including the effects of collateral, would be a reduction to both derivative assets and
derivative liabilities of $4.2 billion and $1.6 billion, respectively, resulting in net derivative liabilities of $184 million and
$549 million, respectively.
Accounts Receivable
Trade Receivables
The Company has considerable trade receivables outstanding with its third-party cellular network carriers, wholesalers,
retailers, value-added resellers, small and mid-sized businesses and education, enterprise and government customers
that are not covered by collateral, third-party financing arrangements or credit insurance. As of December 27, 2014, the
Company had one customer that represented 10% or more of total trade receivables, which accounted for 13%. As of
September 27, 2014, the Company had two customers that represented 10% or more of total trade receivables, one of
which accounted for 16% and the other 13%. The Company’s cellular network carriers accounted for 63% and 72% of
trade receivables as of December 27, 2014 and September 27, 2014, respectively.
Vendor Non-Trade Receivables
Additionally, the Company has non-trade receivables from certain of its manufacturing vendors resulting from the sale of
components to these vendors who manufacture sub-assemblies or assemble final products for the Company. Vendor
non-trade receivables from three of the Company’s vendors accounted for 57%, 14% and 12% of total vendor non-trade
receivables as of December 27, 2014 and three of the Company’s vendors accounted for 51%, 16% and 14% of total
vendor non-trade receivables as of September 27, 2014.
Note 3 – Condensed Consolidated Financial Statement Details
The following tables show the Company’s condensed consolidated financial statement details as of December 27, 2014
and September 27, 2014 (in millions):
Inventories
Components
Finished goods
Total inventories
December 27, 2014
September 27, 2014
$
$
$
228
2,055
2,283
$
471
1,640
2,111
Property, Plant and Equipment, Net
December 27, 2014
Land and buildings
Machinery, equipment and internal-use software
Leasehold improvements
Gross property, plant and equipment
Accumulated depreciation and amortization
Total property, plant and equipment, net
$
$
12
September 27, 2014
5,152 $
31,010
4,585
40,747
(20,355)
20,392 $
4,863
29,639
4,513
39,015
(18,391)
20,624
Accrued Expenses
Accrued warranty and related costs
Accrued marketing and selling expenses
Accrued taxes
Accrued compensation and employee benefits
Deferred margin on component sales
Other current liabilities
Total accrued expenses
December 27, 2014
September 27, 2014
$
$
5,195
1,960
1,642
1,316
1,133
11,478
22,724
$
4,159
2,321
1,209
1,209
1,057
8,498
18,453
$
Other Non-Current Liabilities
Deferred tax liabilities
Other non-current liabilities
Total other non-current liabilities
December 27, 2014
September 27, 2014
$
$
23,371
5,600
28,971
$
20,259
4,567
24,826
$
Other Income/(Expense), Net
The following table shows the detail of other income/(expense), net for the three months ended December 27, 2014 and
December 28, 2013 (in millions):
Three Months Ended
December 27, 2014
December 28, 2013
Interest and dividend income
Interest expense
Other expense, net
Total other income/(expense), net
$
654
(131)
(353)
170
$
$
427
(84)
(97)
246
$
Note 4 – Goodwill and Other Intangible Assets
The Company’s acquired intangible assets with definite useful lives primarily consist of patents and licenses and are
amortized over periods typically from three to seven years. The following table summarizes the components of gross and
net intangible asset balances as of December 27, 2014 and September 27, 2014 (in millions):
December 27, 2014
Gross
Carrying
Amount
Definite-lived and amortizable
acquired intangible assets
Indefinite-lived and nonamortizable acquired
intangible assets
Total acquired intangible
assets
$
7,641
Accumulated
Amortization
$
100
$
7,741
September 27, 2014
Net
Carrying
Amount
(3,371)
$
0
$
(3,371)
13
4,270
Gross
Carrying
Amount
$
100
$
4,370
7,127
$
100
$
7,227
Net
Carrying
Amount
Accumulated
Amortization
(3,085)
$
0
$
(3,085)
4,042
100
$
4,142
Note 5 – Income Taxes
As of December 27, 2014, the Company recorded gross unrecognized tax benefits of $4.4 billion, of which $1.6 billion, if
recognized, would affect the Company’s effective tax rate. As of September 27, 2014, the total amount of gross
unrecognized tax benefits was $4.0 billion, of which $1.4 billion, if recognized, would have affected the Company’s
effective tax rate. The Company’s total gross unrecognized tax benefits are classified as other non-current liabilities in the
Condensed Consolidated Balance Sheets. The Company had $821 million and $630 million of gross interest and
penalties accrued as of December 27, 2014 and September 27, 2014, respectively, which are classified as other noncurrent liabilities in the Condensed Consolidated Balance Sheets.
Management believes that an adequate provision has been made for any adjustments that may result from tax
examinations. However, the outcome of tax audits cannot be predicted with certainty. If any issues addressed in the
Company’s tax audits are resolved in a manner not consistent with management’s expectations, the Company could be
required to adjust its provision for income taxes in the period such resolution occurs. Although timing of the resolution
and/or closure of audits is not certain, the Company does not believe it is reasonably possible that its unrecognized tax
benefits would materially change in the next 12 months.
Note 6 – Debt
Commercial Paper
In April 2014, the Board of Directors authorized the Company to issue unsecured short-term promissory notes
(“Commercial Paper”) pursuant to a commercial paper program. The Company intends to use net proceeds from the
commercial paper program for general corporate purposes, including dividends and share repurchases. As of
December 27, 2014 and September 27, 2014, the Company had $3.9 billion and $6.3 billion of Commercial Paper
outstanding, respectively, with a weighted-average interest rate of 0.11% and 0.12%, respectively, and maturities
generally less than nine months.
The following table provides a summary of cash flows associated with the issuance and maturities of Commercial Paper
for the three months ended December 27, 2014 (in millions):
Maturities less than 90 days:
Proceeds from (repayments of) commercial paper, net
$
Maturities greater than 90 days:
Proceeds from commercial paper
Repayments of commercial paper
Maturities greater than 90 days, net
Total repayments of commercial paper, net
$
14
62
197
(2,668)
(2,471)
(2,409)
Long-Term Debt
As of December 27, 2014, the Company has issued floating- and fixed-rate notes with varying maturities for an aggregate
principal amount of $32.4 billion (collectively the “Notes”). The Notes are senior unsecured obligations, and interest is
payable in arrears, quarterly for the domestic floating-rate notes, semi-annually for the domestic fixed-rate notes and
annually for the foreign fixed-rate notes.
The following table provides a summary of the Company’s long-term debt as of December 27, 2014 and September 27,
2014:
December 27, 2014
Amount
Effective
(in millions)
Interest Rate
Floating-rate notes due 2016 (1)
$
Floating-rate notes due 2017 (2)
Floating-rate notes due 2018 (1)
Floating-rate notes due 2019 (2)
Fixed-rate 0.45% notes due 2016 (1)
Fixed-rate 1.05% notes due 2017 (2)
Fixed-rate 1.00% notes due 2018 (1)
Fixed-rate 2.10% notes due 2019 (2)
Fixed-rate 2.85% notes due 2021 (2)
Fixed-rate 1.00% Euro-denominated notes due 2022 (3)
Fixed-rate 2.40% notes due 2023 (1)
Fixed-rate 3.45% notes due 2024 (2)
Fixed-rate 1.63% Euro-denominated notes due 2026 (3)
Fixed-rate 3.85% notes due 2043 (1)
Fixed-rate 4.45% notes due 2044 (2)
Total borrowings
Unamortized discount
Hedge accounting fair value adjustments
Total long-term debt
$
1,000
1,000
2,000
1,000
1,500
1,500
4,000
2,000
3,000
1,709
5,500
2,500
1,709
3,000
1,000
32,418
(69)
155
32,504
0.51%
0.30%
1.10%
0.53%
0.51%
0.30%
1.08%
0.53%
0.78%
2.94%
2.44%
0.89%
3.45%
3.91%
4.48%
September 27, 2014
Amount
Effective
(in millions)
Interest Rate
$
$
(1)
Tranche relates to the $17.0 billion debt issuance in the third quarter of 2013.
(2)
Tranche relates to the $12.0 billion debt issuance in the third quarter of 2014.
(3)
Tranche relates to Euro-denominated debt issuance of €
€ 2.8 billion in the first quarter of 2015.
1,000
1,000
2,000
1,000
1,500
1,500
4,000
2,000
3,000
0
5,500
2,500
0
3,000
1,000
29,000
(52)
39
28,987
0.51%
0.31%
1.10%
0.54%
0.51%
0.30%
1.08%
0.53%
0.79%
0
2.44%
0.90%
0
3.91%
4.48%
The Company has entered, and in the future may enter, into interest rate swaps to manage interest rate risk on the
Notes. Such swaps allow the Company to effectively convert fixed-rate payments into floating-rate payments or floatingrate payments into fixed-rate payments. In addition, the Company has entered, and in the future may enter, into currency
swaps to manage foreign currency risk on the Notes.
In the first quarter of 2015, the Company issued €
€ 2.8 billion of Euro-denominated long-term debt. To manage foreign
currency risk associated with this issuance, the Company entered into currency swaps with an aggregate notional amount
of $3.5 billion, which effectively converted the Euro-denominated notes to U.S. dollar-denominated notes.
The effective rates for the Notes include the interest on the Notes, amortization of the discount and, if applicable,
adjustments related to hedging. The Company recognized $128 million and $84 million of interest expense on its longterm debt for the three months ended December 27, 2014 and December 28, 2013, respectively.
15
Future principal payments for the Company’s Notes as of December 27, 2014 are as follows (in millions):
2015
2016
2017
2018
2019
Thereafter
Total future principal payments
$
0
2,500
2,500
6,000
3,000
18,418
32,418
$
As of December 27, 2014 and September 27, 2014, the fair value of the Company’s Notes, based on Level 2 inputs, was
$32.4 billion and $28.5 billion, respectively.
Note 7 – Shareholders’ Equity
Dividends
The Company declared and paid cash dividends per common share during the periods presented as follows:
Dividends
Per Share
2015:
First quarter
2014:
Fourth quarter
Third quarter
Second quarter
First quarter
Total cash dividends declared and paid
Amount
(in millions)
$
0.47
$
2,750
$
0.47
0.47
0.44
0.44
1.82
$
2,807
2,830
2,655
2,739
11,031
$
$
Future dividends are subject to declaration by the Board of Directors.
Share Repurchase Program
In 2014, the Company’s Board of Directors increased the share repurchase authorization to $90 billion of the Company’s
common stock. As of December 27, 2014, $72.9 billion of the $90 billion had been utilized. The Company’s share
repurchase program does not obligate it to acquire any specific number of shares. Under the program, shares may be
repurchased in privately negotiated and/or open market transactions, including under plans complying with Rule 10b5-1
under the Securities Exchange Act of 1934, as amended (the “Exchange Act”).
The Company has entered, and in the future may enter, into accelerated share repurchase arrangements (“ASRs”) with
financial institutions. In exchange for up-front payments, the financial institutions deliver shares of the Company’s
common stock during the purchase periods of each ASR. The total number of shares ultimately delivered, and therefore
the average repurchase price paid per share, is determined at the end of the applicable purchase period of each ASR
based on the volume weighted-average price of the Company’s common stock during that period. The shares received
are retired in the periods they are delivered, and the up-front payments are accounted for as a reduction to shareholders’
equity in the Company’s Condensed Consolidated Balance Sheet in the periods the payments are made. The Company
reflects the ASRs as a repurchase of common stock in the period delivered for purposes of calculating earnings per share
and as forward contracts indexed to its own common stock. The ASRs met all of the applicable criteria for equity
classification, and therefore, were not accounted for as derivative instruments.
16
A summary of the Company’s ASR activity and related information during the periods presented, is as follows:
Purchase
Period End
Date
August 2014 ASR
January 2014 ASR
April 2013 ASR
(1)
Average
Repurchase
Price
Per Share
Number of
Shares
(in thousands)
(1)
December 2014
March 2014
68,273 (1)
134,247
172,548
(1)
$
$
89.39
69.55
ASR
Amount
(in millions)
$
$
$
9,000
12,000
12,000
Includes 8.3 million net shares delivered and retired under the August 2014 ASR in the first quarter of 2015. “Number
of Shares” represents those shares delivered in advance of settlement and does not represent the final number of
shares to be delivered under the ASRs. The total number of shares ultimately delivered, and therefore the average
repurchase price paid per share, will be determined at the end of the applicable purchase period based on the
volume weighted-average price of the Company’s common stock during that period. The August 2014 ASR purchase
period will end in or before February 2015.
Additionally, the Company repurchased shares of its common stock in the open market, which were retired upon
repurchase, during the periods presented as follows:
Average
Repurchase
Price
Per Share
Number of
Shares
(in thousands)
2015:
First quarter
2014:
Fourth quarter
Third quarter
Second quarter
First quarter
Total open market common stock repurchases
17
Amount
(in millions)
45,704
$
109.40
$
5,000
81,255
58,661
79,749
66,847
286,512
$
$
$
$
98.46
85.23
75.24
74.79
$
8,000
5,000
6,000
5,000
24,000
$
Note 8 – Comprehensive Income
Comprehensive income consists of two components, net income and OCI. OCI refers to revenue, expenses, and gains
and losses that under GAAP are recorded as an element of shareholders’ equity but are excluded from net income. The
Company’s OCI consists of foreign currency translation adjustments from those subsidiaries not using the U.S. dollar as
their functional currency, net deferred gains and losses on certain derivative instruments accounted for as cash flow
hedges and unrealized gains and losses on marketable securities classified as available-for-sale.
The following table shows the gross amounts reclassified from AOCI into the Condensed Consolidated Statements of
Operations and the associated financial statement line item, for the three months ended December 27, 2014 and
December 28, 2013 (in millions):
Comprehensive Income Components
Financial Statement Line Item
Unrecognized gains/losses on derivative instruments:
Foreign exchange contracts
Revenue
Cost of sales
Other income/expense, net
Other income/expense, net
Interest rate contracts
Unrealized gains/losses on marketable securities
Total amounts reclassified from AOCI
December 27,
2014
$
(449)
(313)
0
99
(663)
Other income/expense, net
(22)
(685)
$
December 28,
2013
$
184
(110)
10
4
88
(17)
71
$
The following table shows the changes in AOCI by component for the three months ended December 27, 2014 (in
millions):
Cumulative
Foreign
Currency
Translation
Balance at September 27, 2014
Other comprehensive income/(loss) before
reclassifications
Amounts reclassified from AOCI
Tax effect
Other comprehensive income/(loss)
Balance at December 27, 2014
Unrecognized
Gains/Losses
on Derivative
Instruments
Unrealized
Gains/Losses
on Marketable
Securities
Total
$
(242) $
1,364 $
(40) $
1,082
$
(114)
0
48
(66)
(308) $
2,390
(663)
(310)
1,417
2,781 $
(707)
(22)
259
(470)
(510) $
1,569
(685)
(3)
881
1,963
Note 9 – Benefit Plans
Stock Plans
The Company had 436.9 million shares reserved for future issuance under its stock plans as of December 27, 2014.
RSUs granted generally vest over four years, based on continued employment, and are settled upon vesting in shares of
the Company’s common stock on a one-for-one basis. Each share issued with respect to RSUs granted under the
Company’s stock plans reduces the number of shares available for grant under the plan by two shares. RSUs cancelled
and shares withheld to satisfy tax withholding obligations increase the number of shares available for grant under the
plans utilizing a factor of two times the number of RSUs cancelled or shares withheld. Stock options count against the
number of shares available for grant on a one-for-one basis.
Rule 10b5-1 Trading Plans
During the three months ended December 27, 2014, Section 16 officers Timothy D. Cook, Angela Ahrendts, Luca Maestri
and Daniel Riccio had equity trading plans in place in accordance with Rule 10b5-1(c)(1) under the Exchange Act. An
equity trading plan is a written document that pre-establishes the amounts, prices and dates (or formula for determining
the amounts, prices and dates) of future purchases or sales of the Company’s stock, including shares acquired pursuant
to the Company’s employee and director equity plans.
18
Restricted Stock Units
A summary of the Company’s RSU activity and related information for the three months ended December 27, 2014, is as
follows:
Number of
RSUs
(in thousands)
Balance at September 27, 2014
RSUs granted
RSUs vested
RSUs cancelled
Balance at December 27, 2014
103,822
36,294
(16,759)
(1,815)
121,542
Weighted-Average
Grant Date Fair
Value
Aggregate
Intrinsic Value
(in millions)
$
$
$
$
$
$
70.98
101.41
64.30
71.49
80.98
13,855
RSUs that vested during the three months ended December 27, 2014 and December 28, 2013 had a fair value of $1.7
billion and $1.1 billion, respectively, as of the vesting date.
Stock Options
The Company had 3.5 million stock options outstanding as of December 27, 2014, with a weighted average exercise
price per share of $19.61 and weighted average remaining contractual term of 2.2 years, substantially all of which are
exercisable. The aggregate intrinsic value of the stock options outstanding as of December 27, 2014 was $330 million,
which represents the value of the Company’s closing stock price on the last trading day of the period in excess of the
weighted-average exercise price multiplied by the number of options outstanding.
The total intrinsic value of options at the time of exercise was $248 million and $559 million for the three months ended
December 27, 2014 and December 28, 2013, respectively.
Share-Based Compensation
The following table shows a summary of the share-based compensation expense included in the Condensed
Consolidated Statements of Operations for the three months ended December 27, 2014 and December 28, 2013 (in
millions):
Three Months Ended
December 27,
December 28,
2014
2013
Cost of sales
Research and development
Selling, general and administrative
Total share-based compensation expense
$
$
140
374
374
888
$
$
109
289
283
681
The income tax benefit related to share-based compensation expense was $351 million and $265 million for the three
months ended December 27, 2014 and December 28, 2013, respectively. As of December 27, 2014, the total
unrecognized compensation cost related to outstanding stock options and RSUs expected to vest was $8.8 billion, which
the Company expects to recognize over a weighted-average period of 3.1 years.
19
Note 10 – Commitments and Contingencies
Accrued Warranty and Indemnification
The following table shows changes in the Company’s accrued warranties and related costs for the three months ended
December 27, 2014 and December 28, 2013 (in millions):
Three Months Ended
December 27,
December 28,
2014
2013
Beginning accrued warranty and related costs
Cost of warranty claims
Accruals for product warranty
Ending accrued warranty and related costs
$
$
4,159 $
(1,044)
2,080
5,195 $
2,967
(1,064)
2,077
3,980
The Company generally does not indemnify end-users of its operating system and application software against legal
claims that the software infringes third-party intellectual property rights. Other agreements entered into by the Company
sometimes include indemnification provisions under which the Company could be subject to costs and/or damages in the
event of an infringement claim against the Company or an indemnified third-party. However, the Company has not been
required to make any significant payments resulting from such an infringement claim asserted against it or an indemnified
third-party. In the opinion of management, there was not at least a reasonable possibility the Company may have incurred
a material loss with respect to indemnification of end-users of its operating system or application software for infringement
of third-party intellectual property rights. The Company did not record a liability for infringement costs related to
indemnification as of December 27, 2014 or September 27, 2014.
The Company has entered into indemnification agreements with its directors and executive officers. Under these
agreements, the Company has agreed to indemnify such individuals to the fullest extent permitted by law against
liabilities that arise by reason of their status as directors or officers and to advance expenses incurred by such individuals
in connection with related legal proceedings. It is not possible to determine the maximum potential amount of payments
the Company could be required to make under these agreements due to the limited history of prior indemnification claims
and the unique facts and circumstances involved in each claim. However, the Company maintains directors and officers
liability insurance coverage to reduce its exposure to such obligations, and payments made under these agreements
historically have not been material.
Concentrations in the Available Sources of Supply of Materials and Product
Although most components essential to the Company’s business are generally available from multiple sources, a number
of components are currently obtained from single or limited sources. In addition, the Company competes for various
components with other participants in the markets for mobile communication and media devices and personal computers.
Therefore, many components used by the Company, including those that are available from multiple sources, are at times
subject to industry-wide shortage and significant pricing fluctuations that could materially adversely affect the Company’s
financial condition and operating results.
The Company uses some custom components that are not commonly used by its competitors, and new products
introduced by the Company often utilize custom components available from only one source. When a component or
product uses new technologies, initial capacity constraints may exist until the suppliers’ yields have matured or
manufacturing capacity has increased. If the Company’s supply of components for a new or existing product were
delayed or constrained, or if an outsourcing partner delayed shipments of completed products to the Company, the
Company’s financial condition and operating results could be materially adversely affected. The Company’s business and
financial performance could also be materially adversely affected depending on the time required to obtain sufficient
quantities from the original source, or to identify and obtain sufficient quantities from an alternative source. Continued
availability of these components at acceptable prices, or at all, may be affected if those suppliers concentrated on the
production of common components instead of components customized to meet the Company’s requirements.
The Company has entered into agreements for the supply of many components; however, there can be no guarantee that
the Company will be able to extend or renew these agreements on similar terms, or at all. Therefore, the Company
remains subject to significant risks of supply shortages and price increases that could materially adversely affect its
financial condition and operating results.
20
Substantially all of the Company’s hardware products are manufactured by outsourcing partners that are located primarily
in Asia. A significant concentration of this manufacturing is currently performed by a small number of outsourcing
partners, often in single locations. Certain of these outsourcing partners are the sole-sourced suppliers of components
and manufacturers for many of the Company’s products. Although the Company works closely with its outsourcing
partners on manufacturing schedules, the Company’s operating results could be adversely affected if its outsourcing
partners were unable to meet their production commitments. The Company’s purchase commitments typically cover its
requirements for periods up to 150 days.
Other Off-Balance Sheet Commitments
Operating Leases
The Company leases various equipment and facilities, including retail space, under noncancelable operating lease
arrangements. The Company does not currently utilize any other off-balance sheet financing arrangements. The major
facility leases are typically for terms not exceeding 10 years and generally contain multi-year renewal options. As of
December 27, 2014, the Company had a total of 447 retail stores. Leases for retail space are for terms ranging from five
to 20 years, the majority of which are for 10 years, and often contain multi-year renewal options. As of December 27,
2014, the Company’s total future minimum lease payments under noncancelable operating leases were $4.8 billion, of
which $3.5 billion related to leases for retail space.
Other Commitments
The Company utilizes several outsourcing partners to manufacture sub-assemblies for the Company’s products and to
perform final assembly and testing of finished products. These outsourcing partners acquire components and build
product based on demand information supplied by the Company, which typically covers periods up to 150 days. The
Company also obtains individual components for its products from a wide variety of individual suppliers. Consistent with
industry practice, the Company acquires components through a combination of purchase orders, supplier contracts and
open orders based on projected demand information. Where appropriate, the purchases are applied to inventory
component prepayments that are outstanding with the respective supplier. As of December 27, 2014, the Company had
outstanding off-balance sheet third-party manufacturing commitments and component purchase commitments of $21.6
billion.
In addition to the commitments mentioned above, the Company had other off-balance sheet obligations of $3.9 billion as
of December 27, 2014, which were comprised of commitments to acquire capital assets, including product tooling and
manufacturing process equipment, and commitments related to advertising, research and development (“R&D”), Internet
and telecommunications services, energy and other obligations.
Contingencies
The Company is subject to various legal proceedings and claims that have arisen in the ordinary course of business and
that have not been fully adjudicated, certain of which are discussed in Part II, Item 1 of this Form 10-Q under the heading
“Legal Proceedings” and in Part II, Item 1A of this Form 10-Q under the heading “Risk Factors.” In the opinion of
management, there was not at least a reasonable possibility the Company may have incurred a material loss, or a
material loss in excess of a recorded accrual, with respect to loss contingencies. However, the outcome of litigation is
inherently uncertain. Therefore, although management considers the likelihood of such an outcome to be remote, if one
or more of these legal matters were resolved against the Company in a reporting period for amounts in excess of
management’s expectations, the Company’s consolidated financial statements for that reporting period could be
materially adversely affected.
Apple Inc. v. Samsung Electronics Co., Ltd, et al.
On August 24, 2012, a jury returned a verdict awarding the Company $1.05 billion in its lawsuit against Samsung
Electronics Co., Ltd and affiliated parties in the United States District Court, Northern District of California, San Jose
Division. On March 6, 2014, the District Court entered final judgment in favor of the Company in the amount of
approximately $930 million. Because the award is now subject to appeal, the Company has not recognized the award in
its results of operations.
21
Note 11 – Segment Information and Geographic Data
The Company reports segment information based on the “management” approach. The management approach
designates the internal reporting used by management for making decisions and assessing performance as the source of
the Company’s reportable operating segments.
The Company manages its business primarily on a geographic basis. As the Company continues to expand its business,
management believes collaboration across its online, retail and indirect channels is integral to better serving its
customers and optimizing its financial results. In the first quarter of 2015, management began reporting business
performance and making decisions primarily on a geographic basis, including the results of its retail stores in each
respective geographic segment. Accordingly, to align with the way the business is currently managed, the Company’s
reportable operating segments now consist of the Americas, Europe, Greater China, Japan and Rest of Asia Pacific.
Retail is no longer reported as a separate reportable operating segment. The Americas segment includes both North and
South America. The Europe segment includes European countries, as well as India, the Middle East and Africa. The
Greater China segment includes China, Hong Kong and Taiwan. The Rest of Asia Pacific segment includes Australia and
Asian countries, other than those countries included in the Company’s other operating segments. Each operating
segment provides similar hardware and software products and similar services. The accounting policies of the various
segments are the same as those described in Note 1, “Summary of Significant Accounting Policies” of the Notes to
Consolidated Financial Statements in Part II, Item 8 of the 2014 Form 10-K.
The Company evaluates the performance of its operating segments based on net sales and operating income. Net sales
for geographic segments are generally based on the location of customers and sales through the Company’s retail stores
located in those geographic locations. Operating income for each segment includes net sales to third parties, related cost
of sales and operating expenses directly attributable to the segment. In the first quarter of 2015, the Company also began
allocating certain costs to its operating segments that were previously included in other corporate expenses, including
certain share-based compensation costs. Advertising expenses are generally included in the geographic segment in
which the expenditures are incurred. Operating income for each segment excludes other income and expense and
certain expenses managed outside the operating segments. Costs excluded from segment operating income include
various corporate expenses such as R&D, corporate marketing expenses, certain share-based compensation expense,
income taxes, various nonrecurring charges and other separately managed general and administrative costs. The
Company does not include intercompany transfers between segments for management reporting purposes.
22
The following table shows information by operating segment for the three months ended December 27, 2014 and
December 28, 2013 (in millions):
Three Months Ended
December 27,
December 28,
2014
2013
Americas:
Net sales
Operating income
$
$
30,566
10,701
$
$
24,789
8,069
Europe:
Net sales
Operating income
$
$
17,214
5,882
$
$
14,335
4,623
Greater China:
Net sales
Operating income
$
$
16,144
6,366
$
$
9,496
3,247
Japan:
Net sales
Operating income
$
$
5,448
2,488
$
$
5,045
2,330
Rest of Asia Pacific:
Net sales
Operating income
$
$
5,227
1,849
$
$
3,929
1,368
A reconciliation of the Company’s segment operating income to the Condensed Consolidated Statements of Operations
for the three months ended December 27, 2014 and December 28, 2013 is as follows (in millions):
Three Months Ended
December 27,
December 28,
2014
2013
Segment operating income
Research and development expense
Other corporate expenses, net
Total operating income
$
$
23
27,286 $
(1,895)
(1,145)
24,246 $
19,637
(1,330)
(844)
17,463
Item 2.
Management’s Discussion and Analysis of Financial Condition and Results of Operations
This section and other parts of this Quarterly Report on Form 10-Q contain forward-looking statements, within the
meaning of the Private Securities Litigation Reform Act of 1995, that involve risks and uncertainties. Forward-looking
statements provide current expectations of future events based on certain assumptions and include any statement that
does not directly relate to any historical or current fact. Forward-looking statements can also be identified by words such
as “future,” “anticipates,” “believes,” “estimates,” “expects,” “intends,” “plans,” “predicts,” “will,” “would,” “could,” “can,”
“may,” and similar terms. Forward-looking statements are not guarantees of future performance and the Company’s
actual results may differ significantly from the results discussed in the forward-looking statements. Factors that might
cause such differences include, but are not limited to, those discussed in Part II, Item 1A of this Form 10-Q under the
heading “Risk Factors,” which are incorporated herein by reference. The following discussion should be read in
conjunction with the Company’s Annual Report on Form 10-K for the year ended September 27, 2014 (the “2014 Form
10-K”) filed with the U.S. Securities and Exchange Commission (the “SEC”) and the condensed consolidated financial
statements and notes thereto included elsewhere in this Form 10-Q. All information presented herein is based on the
Company’s fiscal calendar. Unless otherwise stated, references in this report to particular years, quarters, months or
periods refer to the Company’s fiscal years ended in September and the associated quarters, months, or periods of those
fiscal years. Each of the terms the “Company” and “Apple” as used herein refers collectively to Apple Inc. and its whollyowned subsidiaries, unless otherwise stated. The Company assumes no obligation to revise or update any forwardlooking statements for any reason, except as required by law.
Available Information
The Company’s Annual Report on Form 10-K, Quarterly Reports on Form 10-Q, Current Reports on Form 8-K, and
amendments to reports filed pursuant to Sections 13(a) and 15(d) of the Securities Exchange Act of 1934, as amended
(the “Exchange Act”), are filed with the SEC. The Company is subject to the informational requirements of the Exchange
Act and files or furnishes reports, proxy statements, and other information with the SEC. Such reports and other
information filed by the Company with the SEC are available free of charge on the Company’s website at
investor.apple.com/sec.cfm when such reports are available on the SEC’s website. The public may read and copy any
materials filed by the Company with the SEC at the SEC’s Public Reference Room at 100 F Street, NE, Room 1580,
Washington, DC 20549. The public may obtain information on the operation of the Public Reference Room by calling the
SEC at 1-800-SEC-0330. The SEC maintains an Internet site that contains reports, proxy and information statements and
other information regarding issuers that file electronically with the SEC at www.sec.gov. The contents of these websites
are not incorporated into this filing. Further, the Company’s references to the URLs for these websites are intended to be
inactive textual references only.
Overview and Highlights
Company Background
The Company designs, manufactures and markets mobile communication and media devices, personal computers and
portable digital music players, and sells a variety of related software, services, accessories, networking solutions and
third-party digital content and applications. The Company’s products and services include iPhone®, iPad®, Mac®, iPod®,
Apple TV®, a portfolio of consumer and professional software applications, the iOS and OS X® operating systems,
iCloud®, Apple Pay™ and a variety of accessory, service and support offerings. In September 2014, the Company
announced Apple Watch™, which is expected to be available in early calendar year 2015. The Company also sells and
delivers digital content and applications through the iTunes Store®, App Store™, Mac App Store and iBooks Store™
(collectively “iTunes”). The Company sells its products worldwide through its retail stores, online stores and direct sales
force, as well as through third-party cellular network carriers, wholesalers, retailers and value-added resellers. In addition,
the Company sells a variety of third-party iPhone, iPad, Mac and iPod compatible products, including application
software, and various accessories through its online and retail stores. The Company sells to consumers, small and midsized businesses and education, enterprise and government customers.
24
Business Strategy
The Company is committed to bringing the best user experience to its customers through its innovative hardware,
software and services. The Company’s business strategy leverages its unique ability to design and develop its own
operating systems, hardware, application software and services to provide its customers products and solutions with
innovative design, superior ease-of-use and seamless integration. As part of its strategy, the Company continues to
expand its platform for the discovery and delivery of digital content and applications through iTunes, which allows
customers to discover and download digital content, iOS and Mac applications, and books through either a Mac or
Windows-based computer or through iPhone, iPad and iPod touch® devices (“iOS devices”). The Company also supports
a community for the development of third-party software and hardware products and digital content that complement the
Company’s offerings. The Company believes a high-quality buying experience with knowledgeable salespersons who can
convey the value of the Company’s products and services greatly enhances its ability to attract and retain customers.
Therefore, the Company’s strategy also includes building and expanding its own retail and online stores and its third-party
distribution network to effectively reach more customers and provide them with a high-quality sales and post-sales
support experience. The Company believes ongoing investment in research and development (“R&D”), marketing and
advertising is critical to the development and sale of innovative products and technologies.
Business Seasonality and Product Introductions
The Company has historically experienced higher net sales in its first quarter compared to other quarters in its fiscal year
due in part to seasonal holiday demand. Additionally, new product introductions can significantly impact net sales,
product costs and operating expenses. Product introductions can also impact the Company’s net sales to its indirect
distribution channels as these channels are filled with new product inventory following a product introduction, and often,
channel inventory of a particular product declines as the next related major product launch approaches. Net sales can
also be affected when consumers and distributors anticipate a product introduction. However, neither historical seasonal
patterns nor historical patterns of product introductions should be considered reliable indicators of the Company’s future
pattern of product introductions, future net sales or financial performance.
First Quarter Fiscal 2015 Highlights
Net sales rose 30% or $17.0 billion during the first quarter of 2015 compared to the same quarter in 2014. Net sales and
unit sales increased for iPhone and Mac following the launches of new iPhone and Mac models, and net sales of
Services increased primarily due to growth from iOS apps sales and licensing. This growth was partially offset by lower
net sales and unit sales of iPad and by weakness in most foreign currencies relative to the U.S. dollar. Total net sales
increased in each of the Company’s operating segments, with particularly strong growth in Greater China where net sales
increased 70% year-over-year.
During the first quarter of 2015, the Company introduced iPad Air® 2, iPad mini™ 3, iMac® with Retina® 5K Display and
an updated Mac mini; and released OS X Yosemite.
The Company utilized $5.0 billion to repurchase its common stock and paid dividends of $2.8 billion or $0.47 per common
share during the first quarter of 2015. Additionally, the Company issued €
€ 2.8 billion of Euro-denominated long-term debt.
25
Sales Data
In the first quarter of 2015, the Company changed its reportable operating segments and categorization of product-level
net sales reporting to align with the way its business is managed and to better reflect its evolving products and services.
The following table shows net sales by operating segment and net sales and unit sales by product during the three
months ended December 27, 2014 and December 28, 2013 (dollars in millions and units in thousands):
December 27,
2014
Net Sales by Operating Segment:
Americas
Europe
Greater China
Japan
Rest of Asia Pacific
Total net sales
Net Sales by Product:
iPhone (1)
iPad (1)
Mac (1)
Services (2)
Other Products (1)(3)
Total net sales
Unit Sales by Product:
iPhone
iPad
Mac
$
$
$
$
Three Months Ended
December 28,
2013
30,566
17,214
16,144
5,448
5,227
74,599
$
51,182
8,985
6,944
4,799
2,689
74,599
$
$
$
74,468
21,419
5,519
24,789
14,335
9,496
5,045
3,929
57,594
23%
20%
70%
8%
33%
30%
32,498
11,468
6,395
4,397
2,836
57,594
57%
(22)%
9%
9%
(5)%
30%
51,025
26,035
4,837
46%
(18)%
14%
(1)
Includes deferrals and amortization of related non-software services and software upgrade rights.
(2)
Includes revenue from iTunes, AppleCare®, Apple Pay, licensing and other services.
(3)
Includes sales of iPod, Apple TV, Beats Electronics and Apple-branded and third-party accessories.
26
Change
Product Performance
iPhone
The following table presents iPhone net sales and unit sales information for the first quarter of 2015 and 2014 (dollars in
millions and units in thousands):
December 27,
2014
Net sales
Percentage of total net sales
Unit sales
$
Three Months Ended
December 28,
2013
51,182
69%
74,468
$
32,498
56%
51,025
Change
57%
46%
The year-over-year growth in iPhone net sales and unit sales resulted from the launch of new iPhones at the end of 2014
and in the first quarter of 2015; and expanded distribution. Demand for iPhone 6 and 6 Plus was greater than available
supply during the first quarter of 2015, and overall iPhone channel inventory decreased slightly from levels at the
beginning of the quarter. Overall average selling prices (“ASPs”) for iPhone increased by 8% in the first quarter of 2015
compared to the first quarter of 2014 due to the introduction of iPhone 6 Plus and an increased mix of higher storage
capacity iPhones, which was partially offset by the effect of weakness in most foreign currencies relative to the U.S.
dollar.
iPad
The following table presents iPad net sales and unit sales information for the first quarter of 2015 and 2014 (dollars in
millions and units in thousands):
December 27,
2014
Net sales
Percentage of total net sales
Unit sales
$
Three Months Ended
December 28,
2013
8,985
12%
21,419
$
11,468
20%
26,035
Change
(22)%
(18)%
iPad net sales and unit sales declined on a year-over-year basis. The Company believes the decline in sales is due in
part to a longer repurchase cycle for iPads and some level of cannibalization from the Company’s other products.
Additionally, while iPad channel inventory in all of the Company’s operating segments increased from the beginning to the
end of the quarter to support new product introductions and seasonal demand, it was less than the increase in iPad
channel inventory during the first quarter of 2014. iPad ASPs declined by 5% during the first quarter of 2015 compared to
the first quarter of 2014 primarily as a result of a shift in mix to lower-priced iPads and the effect of weakness in most
foreign currencies relative to the U.S. dollar.
Mac
The following table presents Mac net sales and unit sales information for the first quarter of 2015 and 2014 (dollars in
millions and units in thousands):
December 27,
2014
Net sales
Percentage of total net sales
Unit sales
$
Three Months Ended
December 28,
2013
6,944
9%
5,519
$
6,395
11%
4,837
Change
9%
14%
The year-over-year growth in Mac net sales and unit sales was driven by the launch of new Mac desktops and strong
demand for MacBook Air. Mac ASPs declined by 5% during the first quarter of 2015 compared to the first quarter of 2014
primarily as a result of price reductions on Mac portables in the second half of 2014 and the effect of weakness in most
foreign currencies relative to the U.S. dollar.
27
Services
The following table presents net sales information of Services for the first quarter of 2015 and 2014 (dollars in millions):
December 27,
2014
Net sales
Percentage of total net sales
$
Three Months Ended
December 28,
2013
4,799
6%
$
Change
4,397
8%
9%
The increase in net sales of Services in the first quarter of 2015 compared to the first quarter of 2014 was primarily due to
growth from iTunes and licensing. iTunes generated a total of $2.6 billion in net sales during the first quarter of 2015
compared to $2.4 billion during the first quarter of 2014. Growth from iTunes was driven by increases in revenue from
iOS app sales reflecting continued growth in the installed base of iOS devices, the expansion in third-party iOS apps
available, and increased volume of in-app purchases; partially offset by a 7% year-over-year decrease in net sales of
digital media consisting of music, movies, TV shows and books.
Segment Operating Performance
The Company manages its business primarily on a geographic basis. As the Company continues to expand its business,
management believes collaboration across its online, retail and indirect channels is integral to better serve its customers
and optimize its financial results. In the first quarter of 2015, the Company’s management began reporting business
performance and making decisions primarily on a geographic basis, including the results of its retail stores in each
respective geographic segment. Accordingly, to align with the way the business is currently managed, the Company’s
reportable operating segments now consist of the Americas, Europe, Greater China, Japan and Rest of Asia Pacific.
Retail is no longer reported as a separate reportable operating segment. The Americas segment includes both North and
South America. The Europe segment includes European countries, as well as India, the Middle East and Africa. The
Greater China segment includes China, Hong Kong and Taiwan. The Rest of Asia Pacific segment includes Australia and
Asian countries, other than those countries included in the Company’s other operating segments. Each operating
segment provides similar hardware and software products and similar services. Further information regarding the
Company’s operating segments may be found in Part I, Item 1 of this Form 10-Q in the Notes to Condensed
Consolidated Financial Statements, in Note 11, “Segment Information and Geographic Data.”
Americas
The following table presents Americas net sales information for the first quarter of 2015 and 2014 (dollars in millions):
December 27,
2014
Net sales
Percentage of total net sales
$
Three Months Ended
December 28,
2013
30,566
41%
$
24,789
43%
Change
23%
The year-over-year increase in Americas net sales was driven primarily by growth in net sales and unit sales of iPhone
and Mac, partially offset by a decline in net sales and unit sales of iPad and a stronger U.S. dollar, particularly relative to
Latin American currencies. Net sales from Services in the Americas increased due to continued strong sales of iOS apps,
partially offset by lower digital media sales.
28
Europe
The following table presents Europe net sales information for the first quarter of 2015 and 2014 (dollars in millions):
December 27,
2014
Net sales
Percentage of total net sales
$
Three Months Ended
December 28,
2013
17,214
23%
$
Change
14,335
25%
20%
The increase in Europe net sales during the first quarter of 2015 compared to the first quarter of 2014 primarily reflects
strong growth in net sales and unit sales in iPhone and Mac, partially offset by a decline in net sales and unit sales of
iPad and weaker European currencies relative to the U.S. dollar. iPhone channel inventory declined from the end of 2014
as demand for new iPhones was greater than available supply.
Greater China
The following table presents Greater China net sales information for the first quarter of 2015 and 2014 (dollars in
millions):
December 27,
2014
Net sales
Percentage of total net sales
$
Three Months Ended
December 28,
2013
16,144
22%
$
Change
9,496
16%
70%
During the first quarter of 2015, Greater China experienced a year-over-year increase in net sales significantly higher
than those experienced by the Company overall. iPhone and Mac net sales and unit sales grew strongly following the
launch of new iPhone models and Mac desktops in Greater China. The addition of a significant new carrier in the second
quarter of 2014 also contributed to the higher year-over-year iPhone net sales and unit sales growth. Additionally, Greater
China experienced strong growth in net sales from Services primarily due to increased sales of iOS apps. This growth
was partially offset by a decline in net sales and unit sales of iPad.
Japan
The following table presents Japan net sales information for the first quarter of 2015 and 2014 (dollars in millions):
December 27,
2014
Net sales
Percentage of total net sales
$
Three Months Ended
December 28,
2013
5,448
7%
$
5,045
9%
Change
8%
The increase in Japan net sales during the first quarter of 2015 compared to the first quarter of 2014 reflects higher net
sales and unit sales of iPhone and iPad following the Company’s recent product launches, partially offset by lower net
sales and unit sales of Mac and a significant adverse impact from weakness in the Japanese Yen relative to the U.S.
dollar. iPad net sales and unit sales increased in Japan primarily due to the introduction of new iPad models and strong
cellular network carrier performance. The increase in Japan net sales was also driven by strong growth in Services
primarily due to higher sales of iOS apps.
29
Rest of Asia Pacific
The following table presents Rest of Asia Pacific net sales information for the first quarter of 2015 and 2014 (dollars in
millions):
December 27,
2014
Net sales
Percentage of total net sales
$
Three Months Ended
December 28,
2013
5,227
7%
$
3,929
7%
Change
33%
The increase in Rest of Asia Pacific net sales during the first quarter of 2015 compared to the first quarter of 2014
primarily reflects strong growth in net sales and unit sales in iPhone and Mac, partially offset by a decline in net sales and
unit sales of iPad and weaker foreign currencies relative to the U.S. dollar. iPhone channel inventory increased
sequentially during the quarter to support recent product launches and seasonal demand.
Gross Margin
Gross margin for the first quarter of 2015 and 2014 was as follows (dollars in millions):
Three Months Ended
December 27,
December 28,
2014
2013
Net sales
Cost of sales
Gross margin
Gross margin percentage
$
$
74,599
44,858
29,741
39.9%
$
$
57,594
35,748
21,846
37.9%
The increase in the gross margin percentage during the first quarter of 2015 compared to the first quarter of 2014 was
driven by multiple factors including a favorable shift in mix to products with higher margins, improved leverage on fixed
costs from higher net sales and lower commodity costs for some components, which was partially offset by higher cost
structures on new products and the weakness in most foreign currencies relative to the U.S. dollar.
The Company anticipates gross margin during the second quarter of 2015 to be between 38.5% and 39.5%. The
foregoing statement regarding the Company’s expected gross margin percentage in the second quarter of 2015 is
forward-looking and could differ from actual results. The Company’s future gross margins can be impacted by multiple
factors including, but not limited to, those set forth in Part II, Item 1A of this Form 10-Q under the heading “Risk Factors”
and those described in this paragraph. In general, the Company believes gross margins will remain under downward
pressure due to a variety of factors, including continued industry wide global product pricing pressures, increased
competition, compressed product life cycles, product transitions, potential increases in the cost of components, and
potential strengthening of the U.S. dollar, as well as potential increases in the costs of outside manufacturing services
and a potential shift in the Company’s sales mix towards products with lower gross margins. In response to competitive
pressures, the Company expects it will continue to take product pricing actions, which would adversely affect gross
margins. Gross margins could also be affected by the Company’s ability to manage product quality and warranty costs
effectively and to stimulate demand for certain of its products. Due to the Company’s significant international operations,
financial results can be significantly affected by fluctuations in exchange rates.
30
Operating Expenses
Operating expenses for the first quarter of 2015 and 2014 were as follows (dollars in millions):
December 27,
2014
Three Months Ended
December 28,
2013
Change
Research and development
Percentage of total net sales
$
1,895
2.5%
$
1,330
2.3%
42%
Selling, general and administrative
Percentage of total net sales
$
3,600
4.8%
$
3,053
5.3%
18%
Total operating expenses
Percentage of total net sales
$
5,495
7.4%
$
4,383
7.6%
25%
Research and Development
The growth in R&D expense during the first quarter of 2015 compared to the first quarter of 2014 was driven primarily by
an increase in headcount and related expenses, including share-based compensation costs, and machinery and
equipment to support expanded R&D activities. The Company continues to believe that focused investments in R&D are
critical to its future growth and competitive position in the marketplace and are directly related to timely development of
new and enhanced products that are central to the Company’s core business strategy. As such, the Company expects to
make further investments in R&D to remain competitive.
Selling, General and Administrative
The growth in selling, general and administrative expense during the first quarter of 2015 compared to the first quarter of
2014 was primarily due to increased headcount and related expenses, including share-based compensation costs; higher
spending on marketing and advertising; and the Company’s continued expansion of its retail stores.
Other Income/(Expense), Net
Other income/(expense), net for the first quarter of 2015 and 2014 was as follows (dollars in millions):
December 27,
2014
Interest and dividend income
Interest expense
Other expense, net
Total other income/(expense), net
$
$
Three Months Ended
December 28,
2013
654 $
(131)
(353)
170 $
427
(84)
(97)
246
Change
(31)%
The decrease in other income/(expense), net during the first quarter of 2015 compared to the first quarter of 2014 was
due primarily to higher expenses associated with foreign exchange rate movements, higher premium expenses on
foreign exchange contracts and higher interest expense on debt, partially offset by higher interest income. The weightedaverage interest rate earned by the Company on its cash, cash equivalents and marketable securities was 1.41% and
1.03% in the first quarter of 2015 and 2014, respectively.
31
Provision for Income Taxes
Provision for income taxes and effective tax rates for the first quarter of 2015 and 2014 were as follows (dollars in
millions):
Three Months Ended
December 27,
December 28,
2014
2013
Provision for income taxes
Effective tax rate
$
6,392
26.2%
$
4,637
26.2%
The Company’s effective tax rates for the first quarter of 2015 and 2014 differ from the statutory federal income tax rate of
35% due primarily to certain undistributed foreign earnings, a substantial portion of which was generated by subsidiaries
organized in Ireland, for which no U.S. taxes are provided because such earnings are intended to be indefinitely
reinvested outside the U.S. Additionally, the passage of the Tax Increase Prevention Act of 2014, which temporarily
reinstated the research tax credit, reduced the effective tax rate for the first quarter of 2015.
The U.S. Internal Revenue Service is currently examining the years 2010 through 2012. In addition, the Company is
subject to audits by state, local and foreign tax authorities. Management believes that adequate provisions have been
made for any adjustments that may result from tax examinations. However, the outcome of tax audits cannot be predicted
with certainty. If any issues addressed in the Company’s tax audits are resolved in a manner not consistent with
management’s expectations, the Company could be required to adjust its provision for income taxes in the period such
resolution occurs.
Recent Accounting Pronouncements
In May 2014, the Financial Accounting Standards Board issued Accounting Standards Update No. 2014-09, Revenue
from Contracts with Customers (Topic 606) (“ASU 2014-09”), which amends the existing accounting standards for
revenue recognition. ASU 2014-09 is based on principles that govern the recognition of revenue at an amount an entity
expects to be entitled when products are transferred to customers. ASU 2014-09 will be effective for the Company
beginning in its first quarter of 2018. Early adoption is not permitted. The new revenue standard may be applied
retrospectively to each prior period presented or retrospectively with the cumulative effect recognized as of the date of
adoption. The Company is currently evaluating the impact of adopting the new revenue standard on its consolidated
financial statements.
Liquidity and Capital Resources
The following tables present selected financial information and statistics as of and during the three months ended
December 27, 2014 and September 27, 2014 (in millions):
December 27,
2014
Cash, cash equivalents and marketable securities
Property, plant and equipment, net
Long-term debt
Commercial paper
Working capital
$
$
$
$
$
177,955
20,392
32,504
3,899
9,792
September 27,
2014
$
$
$
$
$
155,239
20,624
28,987
6,308
5,083
Three Months Ended
December 27,
December 28,
2014
2013
Cash generated by operating activities
Cash used in investing activities
Cash used in financing activities
$
$
$
33,722 $
(21,165) $
(6,923) $
22,670
(15,103)
(7,749)
The Company believes its existing balances of cash, cash equivalents and marketable securities will be sufficient to
satisfy its working capital needs, capital asset purchases, outstanding commitments and other liquidity requirements
associated with its existing operations over the next 12 months. The Company currently anticipates the cash used for
future dividends and the share repurchase program will come from its current domestic cash, cash generated from ongoing U.S. operating activities and from borrowings.
32
As of December 27, 2014 and September 27, 2014, $157.8 billion and $137.1 billion, respectively, of the Company’s
cash, cash equivalents and marketable securities were held by foreign subsidiaries and are generally based in U.S.
dollar-denominated holdings. Amounts held by foreign subsidiaries are generally subject to U.S. income taxation on
repatriation to the U.S. The Company’s marketable securities investment portfolio is invested primarily in highly-rated
securities and its investment policy generally limits the amount of credit exposure to any one issuer. The policy requires
investments generally to be investment grade with the objective of minimizing the potential risk of principal loss.
During the three months ended December 27, 2014, cash generated from operating activities of $33.7 billion was a result
of $18.0 billion of net income, non-cash adjustments to net income of $5.7 billion and an increase in the net change in
operating assets and liabilities of $10.0 billion. Cash used in investing activities of $21.2 billion during the three months
ended December 27, 2014 consisted primarily of cash used for purchases of marketable securities, net of sales and
maturities, of $17.9 billion and cash used to acquire property, plant and equipment of $3.2 billion. Cash used in financing
activities of $6.9 billion during the three months ended December 27, 2014 consisted primarily of cash used to
repurchase common stock of $5.0 billion, cash used to pay dividends and dividend equivalents of $2.8 billion and cash
used for repayments of commercial paper, net of proceeds, of $2.4 billion, partially offset by proceeds from the issuance
of long-term debt of $3.5 billion.
During the three months ended December 28, 2013, cash generated from operating activities of $22.7 billion was a result
of $13.1 billion of net income, non-cash adjustments to net income of $4.1 billion and an increase in the net change in
operating assets and liabilities of $5.5 billion. Cash used in investing activities of $15.1 billion during the three months
ended December 28, 2013 consisted primarily of cash used for purchases of marketable securities, net of sales and
maturities, of $12.5 billion and cash used to acquire property, plant and equipment of $2.0 billion. Cash used in financing
activities of $7.7 billion during the three months ended December 28, 2013 consisted primarily of cash used to
repurchase common stock of $5.0 billion and cash used to pay dividends and dividend equivalents of $2.8 billion.
Capital Assets
The Company’s capital expenditures were $2.1 billion during the first quarter of 2015. The Company anticipates utilizing
approximately $13.0 billion for capital expenditures during 2015, which includes product tooling and manufacturing
process equipment; data centers; corporate facilities and infrastructure, including information systems hardware, software
and enhancements; and retail store facilities.
Debt
In April 2014, the Board of Directors authorized the Company to issue unsecured short-term promissory notes
(“Commercial Paper”) pursuant to a commercial paper program. The Company intends to use the net proceeds from the
commercial paper program for general corporate purposes, including dividends and share repurchases. As of
December 27, 2014, the Company had $3.9 billion of Commercial Paper outstanding, with a weighted-average interest
rate of 0.11% and maturities generally less than nine months.
As of December 27, 2014, the Company has issued floating- and fixed-rate notes with varying maturities for an aggregate
principal amount of $32.4 billion (collectively the “Notes”). The Company has entered, and in the future may enter, into
interest rate swaps to manage interest rate risk on the Notes. Interest rate swaps allow the Company to effectively
convert fixed-rate payments into floating-rate payments or floating-rate payments into fixed-rate payments. In addition,
the Company has entered, and in the future may enter, into currency swaps to manage foreign currency risk on the
Notes. In the first quarter of 2015, the Company issued €
€ 2.8 billion of Euro-denominated long-term debt. To manage
foreign currency risk associated with this issuance, the Company entered into currency swaps with an aggregate notional
amount of $3.5 billion, which effectively converted the Euro-denominated notes to U.S. dollar-denominated notes.
33
Capital Return Program
In April 2014, the Company’s Board of Directors increased the share repurchase program authorization from $60 billion to
$90 billion of the Company’s common stock, of which $72.9 billion had been utilized as of December 27, 2014. The share
repurchase program is expected to be completed by the end of December 2015. The Company’s share repurchase
program does not obligate it to acquire any specific number of shares. Under the program, shares may be repurchased in
privately negotiated or open market transactions, including under plans complying with Rule 10b5-1 under the Exchange
Act.
The increase to the Company’s share repurchase program authorization resulted in a total capital return program of over
$130 billion. The Company expects to complete the capital return program by the end of December 2015 by paying
dividends and dividend equivalents, repurchasing shares and remitting withheld taxes related to net share settlement of
restricted stock units. To assist in funding its capital return program, the Company expects to access the debt markets,
both domestically and internationally.
The following table presents the Company’s dividends, dividend equivalents, share repurchases and net share settlement
activity from the start of the capital return program in August 2012 through December 2014 (in millions):
Dividends and
Dividend
Equivalents
Paid
Q1 2015
2014
2013
2012
Total
$
$
2,801
11,126
10,564
2,488
26,979
Accelerated
Share
Repurchases
$
$
0
21,000
13,950
0
34,950
Open Market
Share
Repurchases
$
$
5,000
24,000
9,000
0
38,000
Taxes
Related to
Settlement of
Equity Awards
$
$
512
1,158
1,082
56
2,808
Total
$
$
8,313
57,284
34,596
2,544
102,737
In November 2014, the Company paid cash dividends of $0.47 per common share, totaling $2.8 billion. The Company
plans to increase its dividend on an annual basis subject to declaration by the Board of Directors.
Off-Balance Sheet Arrangements and Contractual Obligations
The Company has not entered into any transactions with unconsolidated entities whereby the Company has financial
guarantees, subordinated retained interests, derivative instruments, or other contingent arrangements that expose the
Company to material continuing risks, contingent liabilities, or any other obligation under a variable interest in an
unconsolidated entity that provides financing, liquidity, market risk, or credit risk support to the Company, or engages in
leasing, hedging, or R&D services with the Company.
Operating Leases
The Company’s major facility leases are typically for terms not exceeding 10 years and generally contain multi-year
renewal options. As of December 27, 2014, the Company had a total of 447 retail stores. Leases for retail space are for
terms ranging from five to 20 years, the majority of which are for 10 years, and often contain multi-year renewal options.
As of December 27, 2014, the Company’s total future minimum lease payments under noncancelable operating leases
were $4.8 billion, of which $3.5 billion related to leases for retail space.
Purchase Commitments
The Company utilizes several outsourcing partners to manufacture sub-assemblies for the Company’s products and to
perform final assembly and testing of finished products. These outsourcing partners acquire components and build
product based on demand information supplied by the Company, which typically covers periods up to 150 days. The
Company also obtains individual components for its products from a wide variety of individual suppliers. Consistent with
industry practice, the Company acquires components through a combination of purchase orders, supplier contracts, and
open orders based on projected demand information. Where appropriate, the purchases are applied to inventory
component prepayments that are outstanding with the respective supplier. As of December 27, 2014, the Company had
outstanding off-balance sheet third-party manufacturing commitments and component purchase commitments of $21.6
billion.
34
Other Obligations
In addition to the commitments mentioned above, the Company had other off-balance sheet obligations of $3.9 billion as
of December 27, 2014, that were comprised of commitments to acquire capital assets, including product tooling and
manufacturing process equipment, and commitments related to advertising, R&D, Internet and telecommunications
services, energy and other obligations.
The Company’s other non-current liabilities in the Condensed Consolidated Balance Sheets consist primarily of deferred
tax liabilities, gross unrecognized tax benefits and the related gross interest and penalties. As of December 27, 2014, the
Company had non-current deferred tax liabilities of $23.4 billion. Additionally, as of December 27, 2014, the Company
had gross unrecognized tax benefits of $4.4 billion and an additional $821 million for gross interest and penalties
classified as non-current liabilities. At this time, the Company is unable to make a reasonably reliable estimate of the
timing of payments due to uncertainties in the timing of tax audit outcomes.
Indemnification
The Company generally does not indemnify end-users of its operating system and application software against legal
claims that the software infringes third-party intellectual property rights. Other agreements entered into by the Company
sometimes include indemnification provisions under which the Company could be subject to costs and/or damages in the
event of an infringement claim against the Company or an indemnified third-party. However, the Company has not been
required to make any significant payments resulting from such an infringement claim asserted against it or an indemnified
third-party. In the opinion of management, there was not at least a reasonable possibility the Company may have incurred
a material loss with respect to indemnification of end-users of its operating system or application software for infringement
of third-party intellectual property rights. The Company did not record a liability for infringement costs related to
indemnification as of December 27, 2014 or September 27, 2014.
The Company has entered into indemnification agreements with its directors and executive officers. Under these
agreements, the Company has agreed to indemnify such individuals to the fullest extent permitted by law against
liabilities that arise by reason of their status as directors or officers and to advance expenses incurred by such individuals
in connection with related legal proceedings. It is not possible to determine the maximum potential amount of payments
the Company could be required to make under these agreements due to the limited history of prior indemnification claims
and the unique facts and circumstances involved in each claim. However, the Company maintains directors and officers
liability insurance coverage to reduce its exposure to such obligations, and payments made under these agreements
historically have not been material.
Critical Accounting Policies and Estimates
The preparation of financial statements and related disclosures in conformity with U.S. generally accepted accounting
principles (“GAAP”) and the Company’s discussion and analysis of its financial condition and operating results require the
Company’s management to make judgments, assumptions, and estimates that affect the amounts reported in its
condensed consolidated financial statements and accompanying notes. Note 1, “Summary of Significant Accounting
Policies” in Part I, Item 1 of this Form 10-Q and in the Notes to Consolidated Financial Statements in Part II, Item 8 of the
2014 Form 10-K describes the significant accounting policies and methods used in the preparation of the Company’s
condensed consolidated financial statements. Management bases its estimates on historical experience and on various
other assumptions it believes to be reasonable under the circumstances, the results of which form the basis for making
judgments about the carrying values of assets and liabilities. Actual results may differ from these estimates and such
differences may be material.
Management believes the Company’s critical accounting policies and estimates are those related to revenue recognition,
valuation and impairment of marketable securities, inventory valuation and valuation of manufacturing-related assets and
estimated purchase commitment cancellation fees, warranty costs, income taxes, and legal and other contingencies.
Management considers these policies critical because they are both important to the portrayal of the Company’s financial
condition and operating results, and they require management to make judgments and estimates about inherently
uncertain matters. The Company’s senior management has reviewed these critical accounting policies and related
disclosures with the Audit and Finance Committee of the Company’s Board of Directors.
35
Revenue Recognition
Net sales consist primarily of revenue from the sale of hardware, software, digital content and applications, accessories,
and service and support contracts. The Company recognizes revenue when persuasive evidence of an arrangement
exists, delivery has occurred, the sales price is fixed or determinable and collection is probable. Product is considered
delivered to the customer once it has been shipped and title, risk of loss and rewards of ownership have been transferred.
For most of the Company’s product sales, these criteria are met at the time the product is shipped. For online sales to
individuals, for some sales to education customers in the U.S., and for certain other sales, the Company defers revenue
until the customer receives the product because the Company retains a portion of the risk of loss on these sales during
transit. For payment terms in excess of the Company’s standard payment terms, revenue is recognized as payments
become due unless the Company has positive evidence that the sales price is fixed or determinable, such as a
successful history of collection, without concession, on comparable arrangements. The Company recognizes revenue
from the sale of hardware products, software bundled with hardware that is essential to the functionality of the hardware
and third-party digital content sold on the iTunes Store in accordance with general revenue recognition accounting
guidance. The Company recognizes revenue in accordance with industry specific software accounting guidance for the
following types of sales transactions: (i) standalone sales of software products, (ii) sales of software upgrades and
(iii) sales of software bundled with hardware not essential to the functionality of the hardware.
For multi-element arrangements that include hardware products containing software essential to the hardware product’s
functionality, undelivered software elements that relate to the hardware product’s essential software and/or undelivered
non-software services, the Company allocates revenue to all deliverables based on their relative selling prices. In such
circumstances, the Company uses a hierarchy to determine the selling price to be used for allocating revenue to
deliverables: (i) vendor-specific objective evidence of fair value (“VSOE”), (ii) third-party evidence of selling price (“TPE”)
and (iii) best estimate of selling price (“ESP”). VSOE generally exists only when the Company sells the deliverable
separately and is the price actually charged by the Company for that deliverable. ESPs reflect the Company’s best
estimates of what the selling prices of elements would be if they were sold regularly on a stand-alone basis.
For sales of qualifying versions of iOS devices, Mac and Apple TV, the Company has indicated it may from time to time
provide future unspecified software upgrades and features free of charge to customers. The Company also provides
various non-software services to owners of qualifying versions of iOS devices and Mac. Because the Company has
neither VSOE nor TPE for the unspecified software upgrade rights or the non-software services, revenue is allocated to
these rights and services based on the Company’s ESPs. Revenue allocated to the unspecified software upgrade rights
and non-software services based on the Company’s ESPs is deferred and recognized on a straight-line basis over the
estimated period the software upgrades and non-software services are expected to be provided for each of these
devices, which ranges from two to four years.
The Company’s process for determining ESPs involves management’s judgment and considers multiple factors that may
vary over time depending upon the unique facts and circumstances related to each deliverable. Should future facts and
circumstances change, the Company’s ESPs and the future rate of related amortization for software upgrades and nonsoftware services related to future sales of these devices could change. Factors subject to change include the
unspecified software upgrade rights offered, the estimated value of unspecified software upgrade rights, the estimated or
actual costs incurred to provide non-software services and the estimated period software upgrades and non-software
services are expected to be provided.
The Company records reductions to revenue for estimated commitments related to price protection and other customer
incentive programs. For transactions involving price protection, the Company recognizes revenue net of the estimated
amount to be refunded, provided the refund amount can be reasonably and reliably estimated and the other conditions for
revenue recognition have been met. The Company’s policy requires that, if refunds cannot be reliably estimated, revenue
is not recognized until reliable estimates can be made or the price protection lapses. For the Company’s other customer
incentive programs, the estimated cost is recognized at the later of the date at which the Company has sold the product
or the date at which the program is offered. The Company also records reductions to revenue for expected future product
returns based on the Company’s historical experience. Future market conditions and product transitions may require the
Company to increase customer incentive programs that could result in reductions to future revenue. Additionally, certain
customer incentive programs require management to estimate the number of customers who will actually redeem the
incentive. Management’s estimates are based on historical experience and the specific terms and conditions of particular
incentive programs. If a greater than estimated proportion of customers redeems such incentives, the Company would be
required to record additional reductions to revenue, which would have an adverse impact on the Company’s results of
operations.
36
Valuation and Impairment of Marketable Securities
The Company’s investments in available-for-sale securities are reported at fair value. Unrealized gains and losses related
to changes in the fair value of securities are recognized in accumulated other comprehensive income, net of tax, in the
Company’s Condensed Consolidated Balance Sheets. Changes in the fair value of available-for-sale securities impact
the Company’s net income only when such securities are sold or an other-than-temporary impairment is recognized.
Realized gains and losses on the sale of securities are determined by specific identification of each security’s cost basis.
The Company regularly reviews its investment portfolio to determine if any security is other-than-temporarily impaired,
which would require the Company to record an impairment charge in the period any such determination is made. In
making this judgment, the Company evaluates, among other things, the duration and extent to which the fair value of a
security is less than its cost; the financial condition of the issuer and any changes thereto; and the Company’s intent to
sell, or whether it will more likely than not be required to sell, the security before recovery of its amortized cost basis. The
Company’s assessment on whether a security is other-than-temporarily impaired could change in the future due to new
developments or changes in assumptions related to any particular security.
Inventory Valuation and Valuation of Manufacturing-Related Assets and Estimated Purchase Commitment Cancellation
Fees
The Company must order components for its products and build inventory in advance of product shipments and has
invested in manufacturing process equipment, including capital assets held at its suppliers’ facilities. In addition, the
Company has made prepayments to certain of its suppliers associated with long-term supply agreements to secure
supply of inventory components. The Company records a write-down for inventories of components and products,
including third-party products held for resale, which have become obsolete or are in excess of anticipated demand or net
realizable value. The Company performs a detailed review of inventory that considers multiple factors including demand
forecasts, product life cycle status, product development plans, current sales levels and component cost trends. The
Company also reviews its manufacturing-related capital assets and inventory prepayments for impairment whenever
events or circumstances indicate the carrying amount of such assets may not be recoverable. If the Company determines
that an asset is not recoverable, it records an impairment loss equal to the amount by which the carrying value of such an
asset exceeds its fair value.
The industries in which the Company competes are subject to a rapid and unpredictable pace of product and component
obsolescence and demand changes. In certain circumstances the Company may be required to record additional writedowns of inventory, inventory prepayments and/or manufacturing-related capital assets. These circumstances include
future demand or market conditions for the Company’s products being less favorable than forecasted, unforeseen
technological changes or changes to the Company’s product development plans that negatively impact the utility of any of
these assets, or significant deterioration in the financial condition of one or more of the Company’s suppliers that hold any
of the Company’s manufacturing process equipment or to whom the Company has made an inventory prepayment. Such
write-downs would adversely affect the Company’s results of operations in the period when the write-downs were
recorded.
The Company records accruals for estimated cancellation fees related to component orders that have been cancelled or
are expected to be cancelled. Consistent with industry practice, the Company acquires components through a
combination of purchase orders, supplier contracts and open orders in each case based on projected demand. Where
appropriate, the purchases are applied to inventory component prepayments that are outstanding with the respective
supplier. Purchase commitments typically cover the Company’s forecasted component and manufacturing requirements
for periods up to 150 days. If there is an abrupt and substantial decline in demand for one or more of the Company’s
products, if the Company’s product development plans change, or if there is an unanticipated change in technological
requirements for any of the Company’s products, then the Company may be required to record additional accruals for
cancellation fees that would adversely affect its results of operations in the period when the cancellation fees are
identified and recorded.
Warranty Costs
The Company provides for the estimated cost of warranties at the time the related revenue is recognized based on
historical and projected warranty claim rates, historical and projected cost-per-claim and knowledge of specific product
failures that are outside of the Company’s typical experience. Each quarter, the Company re-evaluates these estimates to
assess the adequacy of its recorded warranty liabilities considering the size of the installed base of products subject to
warranty protection and adjusts the amounts as necessary. If actual product failure rates or repair costs differ from
estimates, revisions to the estimated warranty liabilities would be required and could materially affect the Company’s
results of operations.
37
Income Taxes
The Company records a tax provision for the anticipated tax consequences of the reported results of operations. The
provision for income taxes is computed using the asset and liability method, under which deferred tax assets and liabilities
are recognized for the expected future tax consequences of temporary differences between the financial reporting and tax
bases of assets and liabilities, and for operating losses and tax credit carryforwards. Deferred tax assets and liabilities are
measured using the currently enacted tax rates that apply to taxable income in effect for the years in which those tax assets
are expected to be realized or settled. The Company records a valuation allowance to reduce deferred tax assets to the
amount that is believed more likely than not to be realized.
The Company recognizes tax benefits from uncertain tax positions only if it is more likely than not that the tax position will
be sustained on examination by the taxing authorities, based on the technical merits of the position. The tax benefits
recognized in the financial statements from such positions are then measured based on the largest benefit that has a
greater than 50% likelihood of being realized upon ultimate settlement.
Management believes it is more likely than not that forecasted income, including income that may be generated as a result
of certain tax planning strategies, together with future reversals of existing taxable temporary differences, will be sufficient to
fully recover the deferred tax assets. In the event that the Company determines all or part of the net deferred tax assets are
not realizable in the future, the Company will make an adjustment to the valuation allowance that would be charged to
earnings in the period such determination is made. In addition, the calculation of tax liabilities involves significant judgment
in estimating the impact of uncertainties in the application of GAAP and complex tax laws. Resolution of these uncertainties
in a manner inconsistent with management’s expectations could have a material impact on the Company’s financial
condition and operating results.
Legal and Other Contingencies
As discussed in Part II, Item 1 of this Form 10-Q under the heading “Legal Proceedings” and in Part I, Item 1 of this Form
10-Q in the Notes to Condensed Consolidated Financial Statements, in Note 10, “Commitments and Contingencies,” the
Company is subject to various legal proceedings and claims that arise in the ordinary course of business. The Company
records a liability when it is probable that a loss has been incurred and the amount is reasonably estimable. There is
significant judgment required in both the probability determination and as to whether an exposure can be reasonably
estimated. In the opinion of management, there was not at least a reasonable possibility the Company may have incurred a
material loss, or a material loss in excess of a recorded accrual, with respect to loss contingencies for legal and other
contingencies. However, the outcome of legal proceedings and claims brought against the Company is subject to significant
uncertainty. Therefore, although management considers the likelihood of such an outcome to be remote, if one or more of
these legal matters were resolved against the Company in a reporting period for amounts in excess of management’s
expectations, the Company’s consolidated financial statements for that reporting period could be materially adversely
affected.
Item 3.
Quantitative and Qualitative Disclosures About Market Risk
In the first quarter of 2015, the Company issued €€2.8 billion of Euro-denominated long-term debt. To manage foreign
currency risk associated with this issuance, the Company entered into currency swaps with an aggregate notional amount of
$3.5 billion, which effectively converted the Euro-denominated notes to U.S. dollar-denominated notes. Notwithstanding the
resulting foreign currency risk applicable to the long-term debt, there have been no material changes to the Company’s
market risk during the first quarter of 2015. For a discussion of the Company’s exposure to market risk, refer to the
Company’s market risk disclosures set forth in Part II, Item 7A, “Quantitative and Qualitative Disclosures About Market Risk”
of the 2014 Form 10-K.
Item 4.
Controls and Procedures
Evaluation of Disclosure Controls and Procedures
Based on an evaluation under the supervision and with the participation of the Company’s management, the Company’s
principal executive officer and principal financial officer have concluded that the Company’s disclosure controls and
procedures as defined in Rules 13a-15(e) and 15d-15(e) under the Exchange Act were effective as of December 27, 2014
to ensure that information required to be disclosed by the Company in reports that it files or submits under the Exchange Act
is (i) recorded, processed, summarized and reported within the time periods specified in the SEC rules and forms and
(ii) accumulated and communicated to the Company’s management, including its principal executive officer and principal
financial officer, as appropriate to allow timely decisions regarding required disclosure.
Changes in Internal Control Over Financial Reporting
There were no changes in the Company’s internal control over financial reporting during the first quarter of 2015, which
were identified in connection with management’s evaluation required by paragraph (d) of Rules 13a-15 and 15d-15 under
the Exchange Act, that have materially affected, or are reasonably likely to materially affect, the Company’s internal control
over financial reporting.
38
PART II—OTHER INFORMATION
Item 1.
Legal Proceedings
The Company is subject to the various legal proceedings and claims discussed below as well as certain other legal
proceedings and claims that have not been fully resolved and that have arisen in the ordinary course of business. In the
opinion of management, there was not at least a reasonable possibility the Company may have incurred a material loss,
or a material loss in excess of a recorded accrual, with respect to loss contingencies. However, the outcome of legal
proceedings and claims brought against the Company is subject to significant uncertainty. Therefore, although
management considers the likelihood of such an outcome to be remote, if one or more of these legal matters were
resolved against the Company in a reporting period for amounts in excess of management’s expectations, the Company’s
consolidated financial statements for that reporting period could be materially adversely affected. See the risk factor “The
Company could be impacted by unfavorable results of legal proceedings, such as being found to have infringed on
intellectual property rights” in Part II, Item 1A of this Form 10-Q under the heading “Risk Factors.” The Company settled
certain matters during the first quarter of 2015 that did not individually or in the aggregate have a material impact on the
Company’s financial condition or results of operations.
The Apple iPod iTunes Antitrust Litigation (formerly Charoensak v. Apple Computer, Inc. and Tucker v. Apple Computer,
Inc.)
These related cases were filed on January 3, 2005 and July 21, 2006 in the United States District Court for the Northern
District of California on behalf of a purported class of direct purchasers of iPods and iTunes Store content, alleging
various claims including alleged unlawful tying of music and video purchased on the iTunes Store with the purchase of
iPods and unlawful acquisition or maintenance of monopoly market power under §§1 and 2 of the Sherman Act, the
Cartwright Act, California Business & Professions Code §17200 (unfair competition), the California Consumer Legal
Remedies Act and California monopolization law. After a three week trial in December 2014, the jury returned a verdict in
favor of the Company and, on January 5, 2015, the District Court entered judgment in favor of the Company, dismissing
all claims against it with prejudice.
Apple eBooks Antitrust Litigation (United States of America v. Apple Inc., et al.)
On April 11, 2012, the U.S. Department of Justice filed a civil antitrust action against the Company and five major book
publishers in the U.S. District Court for the Southern District of New York, alleging an unreasonable restraint of interstate
trade and commerce in violation of §1 of the Sherman Act and seeking, among other things, injunctive relief, the District
Court’s declaration that the Company’s agency agreements with the publishers are null and void and/or the District
Court’s reformation of such agreements. On July 10, 2013, the District Court found, following a bench trial, that the
Company conspired to restrain trade in violation of §1 of the Sherman Act and relevant state statutes to the extent those
laws are congruent with §1 of the Sherman Act. The District Court entered a permanent injunction, which took effect on
October 6, 2013 and will be in effect for five years unless the judgment is overturned on appeal. The Company has taken
the necessary steps to comply with the terms of the District Court’s order, including renegotiating agreements with the
five major eBook publishers, updating its antitrust training program and hiring an antitrust compliance monitor. The
Company appealed the District Court’s decision. Pursuant to a settlement agreement reached by the parties in June
2014, any damages the Company may be obligated to pay will be determined by the outcome of the appellate decision.
39
Item 1A. Risk Factors
The following description of risk factors includes any material changes to, and supersedes the description of, risk factors
associated with the Company’s business previously disclosed in Part I, Item 1A of the 2014 Form 10-K under the heading
“Risk Factors.” The business, financial condition and operating results of the Company can be affected by a number of
factors, whether currently known or unknown, including but not limited to those described below, any one or more of
which could, directly or indirectly, cause the Company’s actual results of operations and financial condition to vary
materially from past, or from anticipated future, results of operations and financial condition. Any of these factors, in whole
or in part, could materially and adversely affect the Company’s business, financial condition, results of operations and
common stock price.
The following discussion of risk factors contains forward-looking statements. These risk factors may be important to
understanding any statement in this Form 10-Q or elsewhere. The following information should be read in conjunction
with the condensed consolidated financial statements and related notes in Part I, Item 1, “Financial Statements” and Part
I, Item 2, “Management’s Discussion and Analysis of Financial Condition and Results of Operations” of this Form 10-Q.
Because of the following factors, as well as other factors affecting the Company’s financial condition and operating
results, past financial performance should not be considered to be a reliable indicator of future performance, and
investors should not use historical trends to anticipate results or trends in future periods.
Global and regional economic conditions could materially adversely affect the Company.
The Company’s operations and performance depend significantly on global and regional economic conditions.
Uncertainty about global and regional economic conditions poses a risk as consumers and businesses may postpone
spending in response to tighter credit, higher unemployment, financial market volatility, government austerity programs,
negative financial news, declines in income or asset values and/or other factors. These worldwide and regional economic
conditions could have a material adverse effect on demand for the Company’s products and services. Demand also could
differ materially from the Company’s expectations as a result of currency fluctuations because the Company generally
raises prices on goods and services sold outside the U.S. to correspond with the effect of a strengthening of the U.S.
dollar. Other factors that could influence worldwide or regional demand include increases in fuel and other energy costs,
conditions in the real estate and mortgage markets, unemployment, labor and healthcare costs, access to credit,
consumer confidence and other macroeconomic factors affecting consumer spending behavior. These and other
economic factors could materially adversely affect demand for the Company’s products and services.
In the event of financial turmoil affecting the banking system and financial markets, additional consolidation of the
financial services industry, or significant financial service institution failures, there could be a new or incremental
tightening in the credit markets, low liquidity and extreme volatility in fixed income, credit, currency and equity markets.
This could have a number of effects on the Company’s business, including the insolvency or financial instability of
outsourcing partners or suppliers or their inability to obtain credit to finance development and/or manufacture products
resulting in product delays; inability of customers, including channel partners, to obtain credit to finance purchases of the
Company’s products; failure of derivative counterparties and other financial institutions; and restrictions on the
Company’s ability to issue new debt. Other income and expense also could vary materially from expectations depending
on gains or losses realized on the sale or exchange of financial instruments; impairment charges resulting from
revaluations of debt and equity securities and other investments; interest rates; cash balances; volatility in foreign
exchange rates; and changes in fair value of derivative instruments. Increased volatility in the financial markets and
overall economic uncertainty would increase the risk of the actual amounts realized in the future on the Company’s
financial instruments differing significantly from the fair values currently assigned to them.
40
Global markets for the Company’s products and services are highly competitive and subject to rapid technological
change, and the Company may be unable to compete effectively in these markets.
The Company’s products and services compete in highly competitive global markets characterized by aggressive price
cutting and resulting downward pressure on gross margins, frequent introduction of new products, short product life
cycles, evolving industry standards, continual improvement in product price/performance characteristics, rapid adoption of
technological and product advancements by competitors and price sensitivity on the part of consumers.
The Company’s ability to compete successfully depends heavily on its ability to ensure a continuing and timely
introduction of innovative new products and technologies to the marketplace. The Company believes it is unique in that it
designs and develops nearly the entire solution for its products, including the hardware, operating system, numerous
software applications and related services. As a result, the Company must make significant investments in R&D. The
Company currently holds a significant number of patents and copyrights and has registered and/or has applied to register
numerous patents, trademarks and service marks. In contrast, many of the Company’s competitors seek to compete
primarily through aggressive pricing and very low cost structures, and emulating the Company’s products and infringing
on its intellectual property. If the Company is unable to continue to develop and sell innovative new products with
attractive margins or if competitors infringe on the Company’s intellectual property, the Company’s ability to maintain a
competitive advantage could be adversely affected.
The Company markets certain mobile communication and media devices based on the iOS mobile operating system and
also markets related third-party digital content and applications. The Company faces substantial competition in these
markets from companies that have significant technical, marketing, distribution and other resources, as well as
established hardware, software and digital content supplier relationships; and the Company has a minority market share
in the smartphone market. Additionally, the Company faces significant price competition as competitors reduce their
selling prices and attempt to imitate the Company’s product features and applications within their own products or,
alternatively, collaborate with each other to offer solutions that are more competitive than those they currently offer. The
Company also competes with illegitimate ways to obtain third-party digital content and applications and with business
models that include content provided to users for free. Some of the Company’s competitors have greater experience,
product breadth and distribution channels than the Company. Because some current and potential competitors have
substantial resources and/or experience and a lower cost structure, they may be able to provide products and services at
little or no profit or even at a loss. The Company also expects competition to intensify as competitors attempt to imitate
the Company’s approach to providing components seamlessly within their individual offerings or work collaboratively to
offer integrated solutions. The Company’s financial condition and operating results depend substantially on the
Company’s ability to continually improve iOS and iOS devices in order to maintain their functional and design
advantages.
The Company is the only authorized maker of hardware using OS X, which has a minority market share in the personal
computer market. This market has been contracting and is dominated by computer makers using competing operating
systems, most notably Windows. In the market for personal computers and accessories, the Company faces a significant
number of competitors, many of which have broader product lines, lower priced products and a larger installed customer
base. Historically, consolidation in this market has resulted in larger competitors. Price competition has been particularly
intense as competitors selling Windows-based personal computers have aggressively cut prices and lowered product
margins. An increasing number of Internet-enabled devices that include software applications and are smaller and
simpler than traditional personal computers compete for market share with the Company’s existing products. The
Company’s financial condition and operating results also depend on its ability to continually improve the Mac platform to
maintain its functional and design advantages.
There can be no assurance the Company will be able to continue to provide products and services that compete
effectively.
41
To remain competitive and stimulate customer demand, the Company must successfully manage frequent product
introductions and transitions.
Due to the highly volatile and competitive nature of the industries in which the Company competes, the Company must
continually introduce new products, services and technologies, enhance existing products and services, and effectively
stimulate customer demand for new and upgraded products. The success of new product introductions depends on a
number of factors including, but not limited to, timely and successful product development, market acceptance, the
Company’s ability to manage the risks associated with new product production ramp-up issues, the availability of
application software for new products, the effective management of purchase commitments and inventory levels in line
with anticipated product demand, the availability of products in appropriate quantities and at expected costs to meet
anticipated demand, and the risk that new products may have quality or other defects or deficiencies in the early stages
of introduction. Accordingly, the Company cannot determine in advance the ultimate effect of new product introductions
and transitions.
The Company depends on the performance of distributors, carriers and other resellers.
The Company distributes its products through cellular network carriers, wholesalers, national and regional retailers, and
value-added resellers, many of whom distribute products from competing manufacturers. The Company also sells its
products and third-party products in most of its major markets directly to education, enterprise and government
customers, and consumers and small and mid-sized businesses through its online and retail stores.
Carriers providing cellular network service for iPhone typically subsidize users’ purchases of the device. There is no
assurance that such subsidies will be continued at all or in the same amounts upon renewal of the Company’s
agreements with these carriers or in agreements the Company enters into with new carriers.
Many resellers have narrow operating margins and have been adversely affected in the past by weak economic
conditions. Some resellers have perceived the expansion of the Company’s direct sales as conflicting with their business
interests as distributors and resellers of the Company’s products. Such a perception could discourage resellers from
investing resources in the distribution and sale of the Company’s products or lead them to limit or cease distribution of
those products. The Company has invested and will continue to invest in programs to enhance reseller sales, including
staffing selected resellers’ stores with Company employees and contractors, and improving product placement displays.
These programs could require a substantial investment while providing no assurance of return or incremental revenue.
The financial condition of these resellers could weaken, these resellers could stop distributing the Company’s products, or
uncertainty regarding demand for the Company’s products could cause resellers to reduce their ordering and marketing
of the Company’s products.
The Company faces substantial inventory and other asset risk in addition to purchase commitment cancellation risk.
The Company records a write-down for product and component inventories that have become obsolete or exceed
anticipated demand or net realizable value and accrues necessary cancellation fee reserves for orders of excess
products and components. The Company also reviews its long-lived assets, including capital assets held at its suppliers’
facilities and inventory prepayments, for impairment whenever events or circumstances indicate the carrying amount of
an asset may not be recoverable. If the Company determines that impairment has occurred, it records a write-down equal
to the amount by which the carrying value of the assets exceeds its fair value. Although the Company believes its
provisions related to inventory, capital assets, inventory prepayments and other assets and purchase commitments are
currently adequate, no assurance can be given that the Company will not incur additional related charges given the rapid
and unpredictable pace of product obsolescence in the industries in which the Company competes.
The Company must order components for its products and build inventory in advance of product announcements and
shipments. Consistent with industry practice, components are normally acquired through a combination of purchase
orders, supplier contracts and open orders, in each case based on projected demand. Where appropriate, the purchases
are applied to inventory component prepayments that are outstanding with the respective supplier. Purchase
commitments typically cover forecasted component and manufacturing requirements for periods up to 150 days. Because
the Company’s markets are volatile, competitive and subject to rapid technology and price changes, there is a risk the
Company will forecast incorrectly and order or produce excess or insufficient amounts of components or products, or not
fully utilize firm purchase commitments.
42
Future operating results depend upon the Company’s ability to obtain components in sufficient quantities.
Because the Company currently obtains components from single or limited sources, the Company is subject to significant
supply and pricing risks. Many components, including those that are available from multiple sources, are at times subject
to industry-wide shortages and significant commodity pricing fluctuations. While the Company has entered into
agreements for the supply of many components, there can be no assurance that the Company will be able to extend or
renew these agreements on similar terms, or at all. A number of suppliers of components may suffer from poor financial
conditions, which can lead to business failure for the supplier or consolidation within a particular industry, further limiting
the Company’s ability to obtain sufficient quantities of components. The follow-on effects from global economic conditions
on the Company’s suppliers, described in “Global and regional economic conditions could materially adversely affect the
Company” above, also could affect the Company’s ability to obtain components. Therefore, the Company remains subject
to significant risks of supply shortages and price increases.
The Company and other participants in the markets for mobile communication and media devices and personal
computers also compete for various components with other industries that have experienced increased demand for their
products. The Company uses some custom components that are not common to the rest of these industries. The
Company’s new products often utilize custom components available from only one source. When a component or product
uses new technologies, initial capacity constraints may exist until the suppliers’ yields have matured or manufacturing
capacity has increased. Continued availability of these components at acceptable prices, or at all, may be affected for any
number of reasons, including if those suppliers decide to concentrate on the production of common components instead
of components customized to meet the Company’s requirements. The supply of components for a new or existing product
could be delayed or constrained, or a key manufacturing vendor could delay shipments of completed products to the
Company.
The Company depends on component and product manufacturing and logistical services provided by outsourcing
partners, many of whom are located outside of the U.S.
Substantially all of the Company’s manufacturing is performed in whole or in part by a few outsourcing partners located
primarily in Asia. The Company has also outsourced much of its transportation and logistics management. While these
arrangements may lower operating costs, they also reduce the Company’s direct control over production and distribution.
It is uncertain what effect such diminished control will have on the quality or quantity of products or services, or the
Company’s flexibility to respond to changing conditions. Although arrangements with these partners may contain
provisions for warranty expense reimbursement, the Company may remain responsible to the consumer for warranty
service in the event of product defects and could experience an unanticipated product defect or warranty liability. While
the Company relies on its partners to adhere to its supplier code of conduct, material violations of the supplier code of
conduct could occur.
The Company relies on sole-sourced outsourcing partners in the U.S., Asia and Europe to supply and manufacture many
critical components, and on outsourcing partners primarily located in Asia, for final assembly of substantially all of the
Company’s hardware products. Any failure of these partners to perform may have a negative impact on the Company’s
cost or supply of components or finished goods. In addition, manufacturing or logistics in these locations or transit to final
destinations may be disrupted for a variety of reasons including, but not limited to, natural and man-made disasters,
information technology system failures, commercial disputes, military actions or economic, business, labor,
environmental, public health, or political issues.
The Company has invested in manufacturing process equipment, much of which is held at certain of its outsourcing
partners, and has made prepayments to certain of its suppliers associated with long-term supply agreements. While
these arrangements help ensure the supply of components and finished goods, if these outsourcing partners or suppliers
experience severe financial problems or other disruptions in their business, such continued supply could be reduced or
terminated and the net realizable value of these assets could be negatively impacted.
The Company’s products and services may experience quality problems from time to time that can result in decreased
sales and operating margin and harm to the Company’s reputation.
The Company sells complex hardware and software products and services that can contain design and manufacturing
defects. Sophisticated operating system software and applications, such as those sold by the Company, often contain
“bugs” that can unexpectedly interfere with the software’s intended operation. The Company’s online services may from
time to time experience outages, service slowdowns, or errors. Defects may also occur in components and products the
Company purchases from third parties. There can be no assurance the Company will be able to detect and fix all defects
in the hardware, software and services it sells. Failure to do so could result in lost revenue, significant warranty and other
expenses and harm to the Company’s reputation.
43
The Company relies on access to third-party digital content, which may not be available to the Company on commercially
reasonable terms or at all.
The Company contracts with numerous third parties to offer their digital content through the iTunes Store. This includes
the right to make available music, movies, TV shows and books currently available through the iTunes Store. The
licensing or other distribution arrangements with these third parties are for relatively short terms and do not guarantee the
continuation or renewal of these arrangements on reasonable terms, if at all. Some third-party content providers and
distributors currently or in the future may offer competing products and services, and could take action to make it more
difficult or impossible for the Company to license or otherwise distribute their content in the future. Other content owners,
providers or distributors may seek to limit the Company’s access to, or increase the cost of, such content. The Company
may be unable to continue to offer a wide variety of content at reasonable prices with acceptable usage rules, or continue
to expand its geographic reach. Failure to obtain the right to make available third-party digital content, or to make
available such content on commercially reasonable terms, could have a material adverse impact on the Company’s
financial condition and operating results.
Some third-party digital content providers require the Company to provide digital rights management and other security
solutions. If requirements change, the Company may have to develop or license new technology to provide these
solutions. There is no assurance the Company will be able to develop or license such solutions at a reasonable cost and
in a timely manner. In addition, certain countries have passed or may propose and adopt legislation that would force the
Company to license its digital rights management, which could lessen the protection of content and subject it to piracy
and also could negatively affect arrangements with the Company’s content providers.
The Company’s future performance depends in part on support from third-party software developers.
The Company believes decisions by customers to purchase its hardware products depend in part on the availability of
third-party software applications and services. There is no assurance that third-party developers will continue to develop
and maintain software applications and services for the Company’s products. If third-party software applications and
services cease to be developed and maintained for the Company’s products, customers may choose not to buy the
Company’s products.
With respect to its Mac products, the Company believes the availability of third-party software applications and services
depends in part on the developers’ perception and analysis of the relative benefits of developing, maintaining and
upgrading such software for the Company’s products compared to Windows-based products. This analysis may be based
on factors such as the market position of the Company and its products, the anticipated revenue that may be generated,
expected future growth of Mac sales and the costs of developing such applications and services. If the Company’s
minority share of the global personal computer market causes developers to question the Mac’s prospects, developers
could be less inclined to develop or upgrade software for the Company’s Mac products and more inclined to devote their
resources to developing and upgrading software for the larger Windows market.
With respect to iOS devices, the Company relies on the continued availability and development of compelling and
innovative software applications, which are distributed through a single distribution channel, the App Store. iOS devices
are subject to rapid technological change, and, if third-party developers are unable to or choose not to keep up with this
pace of change, third-party applications might not successfully operate and may result in dissatisfied customers. As with
applications for the Company’s Mac products, the availability and development of these applications also depend on
developers’ perceptions and analysis of the relative benefits of developing software for the Company’s iOS devices rather
than its competitors’ platforms, such as Android. If developers focus their efforts on these competing platforms, the
availability and quality of applications for the Company’s iOS devices may suffer.
The Company relies on access to third-party intellectual property, which may not be available to the Company on
commercially reasonable terms or at all.
Many of the Company’s products include third-party intellectual property, which requires licenses from those third parties.
Based on past experience and industry practice, the Company believes such licenses generally can be obtained on
reasonable terms. There is, however, no assurance that the necessary licenses can be obtained on acceptable terms or
at all. Failure to obtain the right to use third-party intellectual property, or to use such intellectual property on commercially
reasonable terms, could preclude the Company from selling certain products or otherwise have a material adverse impact
on the Company’s financial condition and operating results.
44
The Company could be impacted by unfavorable results of legal proceedings, such as being found to have infringed on
intellectual property rights.
The Company is subject to various legal proceedings and claims that have not yet been fully resolved and that have arisen in the
ordinary course of business, and additional claims may arise in the future.
For example, technology companies, including many of the Company’s competitors, frequently enter into litigation based on
allegations of patent infringement or other violations of intellectual property rights. In addition, patent holding companies seek to
monetize patents they have purchased or otherwise obtained. As the Company has grown, the intellectual property rights claims
against it have increased and may continue to increase. In particular, the Company’s cellular enabled products compete with
products from mobile communication and media device companies that hold significant patent portfolios, and the number of
patent claims against the Company has significantly increased. The Company is vigorously defending infringement actions in
courts in a number of U.S. jurisdictions and before the U.S. International Trade Commission, as well as internationally in various
countries. The plaintiffs in these actions frequently seek injunctions and substantial damages.
Regardless of the scope or validity of such patents or other intellectual property rights, or the merits of any claims by potential or
actual litigants, the Company may have to engage in protracted litigation. If the Company is found to infringe one or more patents
or other intellectual property rights, regardless of whether it can develop non-infringing technology, it may be required to pay
substantial damages or royalties to a third-party, or it may be subject to a temporary or permanent injunction prohibiting the
Company from marketing or selling certain products.
In certain cases, the Company may consider the desirability of entering into licensing agreements, although no assurance can be
given that such licenses can be obtained on acceptable terms or that litigation will not occur. These licenses may also
significantly increase the Company’s operating expenses.
Regardless of the merit of particular claims, litigation may be expensive, time-consuming, disruptive to the Company’s operations
and distracting to management. In recognition of these considerations, the Company may enter into arrangements to settle
litigation.
In management’s opinion, there is not at least a reasonable possibility the Company may have incurred a material loss, or a
material loss in excess of a recorded accrual, with respect to loss contingencies, including matters related to infringement of
intellectual property rights. However, the outcome of litigation is inherently uncertain.
Although management considers the likelihood of such an outcome to be remote, if one or more legal matters were resolved
against the Company in a reporting period for amounts in excess of management’s expectations, the Company’s consolidated
financial statements for that reporting period could be materially adversely affected. Further, such an outcome could result in
significant compensatory, punitive or trebled monetary damages, disgorgement of revenue or profits, remedial corporate
measures or injunctive relief against the Company that could materially adversely affect its financial condition and operating
results.
The Company is subject to laws and regulations worldwide, changes to which could increase the Company’s costs and
individually or in the aggregate adversely affect the Company’s business.
The Company is subject to laws and regulations affecting its domestic and international operations in a number of areas. These
U.S. and foreign laws and regulations affect the Company’s activities including, but not limited to, in areas of labor, advertising,
digital content, consumer protection, real estate, billing, e-commerce, promotions, quality of services, telecommunications, mobile
communications and media, television, intellectual property ownership and infringement, tax, import and export requirements,
anti-corruption, foreign exchange controls and cash repatriation restrictions, data privacy requirements, anti-competition,
environmental, health and safety.
By way of example, laws and regulations related to mobile communications and media devices in the many jurisdictions in which
the Company operates are extensive and subject to change. Such changes could include, among others, restrictions on the
production, manufacture, distribution and use of devices, locking devices to a carrier’s network, or mandating the use of devices
on more than one carrier’s network. These devices are also subject to certification and regulation by governmental and
standardization bodies, as well as by cellular network carriers for use on their networks. These certification processes are
extensive and time consuming, and could result in additional testing requirements, product modifications, or delays in product
shipment dates, or could preclude the Company from selling certain products.
Compliance with these laws, regulations and similar requirements may be onerous and expensive, and they may be inconsistent
from jurisdiction to jurisdiction, further increasing the cost of compliance and doing business. Any such costs, which may rise in
the future as a result of changes in these laws and regulations or in their interpretation, could individually or in the aggregate
make the Company’s products and services less attractive to the Company’s customers, delay the introduction of new products in
one or more regions, or cause the Company to change or limit its business practices. The Company has implemented policies
and procedures designed to ensure compliance with applicable laws and regulations, but there can be no assurance that the
Company’s employees, contractors, or agents will not violate such laws and regulations or the Company’s policies and
procedures.
45
The Company’s business is subject to the risks of international operations.
The Company derives a significant portion of its revenue and earnings from its international operations. Compliance with
applicable U.S. and foreign laws and regulations, such as import and export requirements, anti-corruption laws, tax laws,
foreign exchange controls and cash repatriation restrictions, data privacy requirements, environmental laws, labor laws
and anti-competition regulations, increases the costs of doing business in foreign jurisdictions. Although the Company
has implemented policies and procedures to comply with these laws and regulations, a violation by the Company’s
employees, contractors, or agents could nevertheless occur.
The Company also could be significantly affected by other risks associated with international activities including, but not
limited to, economic and labor conditions, increased duties, taxes and other costs and political instability. Margins on
sales of the Company’s products in foreign countries, and on sales of products that include components obtained from
foreign suppliers, could be materially adversely affected by international trade regulations, including duties, tariffs and
antidumping penalties. The Company is also exposed to credit and collectability risk on its trade receivables with
customers in certain international markets. There can be no assurance the Company can effectively limit its credit risk
and avoid losses.
The Company’s retail stores have required and will continue to require a substantial investment and commitment of
resources and are subject to numerous risks and uncertainties.
The Company’s retail stores have required substantial investment in equipment and leasehold improvements, information
systems, inventory and personnel. The Company also has entered into substantial operating lease commitments for retail
space. Certain stores have been designed and built to serve as high-profile venues to promote brand awareness and
serve as vehicles for corporate sales and marketing activities. Because of their unique design elements, locations and
size, these stores require substantially more investment than the Company’s more typical retail stores. Due to the high
cost structure associated with the Company’s retail stores, a decline in sales or the closure or poor performance of
individual or multiple stores could result in significant lease termination costs, write-offs of equipment and leasehold
improvements, and severance costs.
Many factors unique to retail operations, some of which are beyond the Company’s control, pose risks and uncertainties.
These risks and uncertainties include, but are not limited to, macro-economic factors that could have an adverse effect on
general retail activity, as well as the Company’s inability to manage costs associated with store construction and
operation, the Company’s failure to manage relationships with its existing retail partners, more challenging environments
in managing retail operations outside the U.S., costs associated with unanticipated fluctuations in the value of retail
inventory, and the Company’s inability to obtain and renew leases in quality retail locations at a reasonable cost.
Investment in new business strategies and acquisitions could disrupt the Company’s ongoing business and present risks
not originally contemplated.
The Company has invested, and in the future may invest, in new business strategies or acquisitions. Such endeavors
may involve significant risks and uncertainties, including distraction of management from current operations, greater than
expected liabilities and expenses, inadequate return of capital and unidentified issues not discovered in the Company’s
due diligence. These new ventures are inherently risky and may not be successful.
The Company’s business and reputation may be impacted by information technology system failures or network
disruptions.
The Company may be subject to information technology system failures and network disruptions. These may be caused
by natural disasters, accidents, power disruptions, telecommunications failures, acts of terrorism or war, computer
viruses, physical or electronic break-ins, or other events or disruptions. System redundancy may be ineffective or
inadequate, and the Company’s disaster recovery planning may not be sufficient for all eventualities. Such failures or
disruptions could prevent access to the Company’s online stores and services, preclude retail store transactions,
compromise Company or customer data, and result in delayed or cancelled orders. System failures and disruptions could
also impede the manufacturing and shipping of products, delivery of online services, transactions processing and
financial reporting.
46
There may be breaches of the Company’s information technology systems that materially damage business partner and
customer relationships, curtail or otherwise adversely impact access to online stores and services, or subject the
Company to significant reputational, financial, legal and operational consequences.
The Company’s business requires it to use and store customer, employee and business partner personally identifiable
information (“PII”). This may include, among other information, names, addresses, phone numbers, email addresses,
contact preferences, tax identification numbers and payment account information. Although malicious attacks to gain
access to PII affect many companies across various industries, the Company is at a relatively greater risk of being
targeted because of its high profile and the amount of PII it manages.
The Company requires user names and passwords in order to access its information technology systems. The Company
also uses encryption and authentication technologies designed to secure the transmission and storage of data and
prevent access to Company data or accounts. As with all companies, these security measures are subject to third-party
security breaches, employee error, malfeasance, faulty password management, or other irregularities. For example, third
parties may attempt to fraudulently induce employees or customers into disclosing user names, passwords or other
sensitive information, which may in turn be used to access the Company’s information technology systems. To help
protect customers and the Company, the Company monitors accounts and systems for unusual activity and may freeze
accounts under suspicious circumstances, which may result in the delay or loss of customer orders.
The Company devotes significant resources to network security, data encryption and other security measures to protect
its systems and data, but these security measures cannot provide absolute security. To the extent the Company was to
experience a breach of its systems and was unable to protect sensitive data, such a breach could materially damage
business partner and customer relationships, and curtail or otherwise adversely impact access to online stores and
services. Moreover, if a computer security breach affects the Company’s systems or results in the unauthorized release
of PII, the Company’s reputation and brand could be materially damaged, use of the Company’s products and services
could decrease, and the Company could be exposed to a risk of loss or litigation and possible liability. While the
Company maintains insurance coverage that, subject to policy terms and conditions and subject to a significant selfinsured retention, is designed to address certain aspects of cyber risks, such insurance coverage may be insufficient to
cover all losses or all types of claims that may arise in the continually evolving area of cyber risk.
The Company’s business is subject to a variety of U.S. and international laws, rules, policies and other obligations
regarding data protection.
The Company is subject to federal, state and international laws relating to the collection, use, retention, security and
transfer of PII. In many cases, these laws apply not only to third-party transactions, but also to transfers of information
between the Company and its subsidiaries, and among the Company, its subsidiaries and other parties with which the
Company has commercial relations. Several jurisdictions have passed laws in this area, and other jurisdictions are
considering imposing additional restrictions. These laws continue to develop and may be inconsistent from jurisdiction to
jurisdiction. Complying with emerging and changing international requirements may cause the Company to incur
substantial costs or require the Company to change its business practices. Noncompliance could result in penalties or
significant legal liability.
The Company’s privacy policy, which includes related practices concerning the use and disclosure of data, is posted on
its website. Any failure by the Company, its suppliers or other parties with whom the Company does business to comply
with its posted privacy policy or with other federal, state or international privacy-related or data protection laws and
regulations could result in proceedings against the Company by governmental entities or others.
The Company is also subject to payment card association rules and obligations under its contracts with payment card
processors. Under these rules and obligations, if information is compromised, the Company could be liable to payment
card issuers for associated expenses and penalties. In addition, if the Company fails to follow payment card industry
security standards, even if no customer information is compromised, the Company could incur significant fines or
experience a significant increase in payment card transaction costs.
The Company’s success depends largely on the continued service and availability of key personnel.
Much of the Company’s future success depends on the continued availability and service of key personnel, including its
Chief Executive Officer, executive team and other highly skilled employees. Experienced personnel in the technology
industry are in high demand and competition for their talents is intense, especially in Silicon Valley, where most of the
Company’s key personnel are located.
47
The Company’s business may be impacted by political events, war, terrorism, public health issues, natural disasters and
other business interruptions.
War, terrorism, geopolitical uncertainties, public health issues and other business interruptions have caused and could
cause damage or disruption to international commerce and the global economy, and thus could have a material adverse
effect on the Company, its suppliers, logistics providers, manufacturing vendors and customers, including channel
partners. The Company’s business operations are subject to interruption by, among others, natural disasters, whether as
a result of climate change or otherwise, fire, power shortages, nuclear power plant accidents, terrorist attacks and other
hostile acts, labor disputes, public health issues and other events beyond its control. Such events could decrease
demand for the Company’s products, make it difficult or impossible for the Company to make and deliver products to its
customers, including channel partners, or to receive components from its suppliers, and create delays and inefficiencies
in the Company’s supply chain. Should major public health issues, including pandemics, arise, the Company could be
adversely affected by more stringent employee travel restrictions, additional limitations in freight services, governmental
actions limiting the movement of products between regions, delays in production ramps of new products and disruptions
in the operations of the Company’s manufacturing vendors and component suppliers. The majority of the Company’s
R&D activities, its corporate headquarters, information technology systems and other critical business operations,
including certain component suppliers and manufacturing vendors, are in locations that could be affected by natural
disasters. In the event of a natural disaster, the Company could incur significant losses, require substantial recovery time
and experience significant expenditures in order to resume operations.
The Company expects its quarterly revenue and operating results to fluctuate.
The Company’s profit margins vary across its products and distribution channels. The Company’s software, accessories,
and service and support contracts generally have higher gross margins than certain of the Company’s other products.
Gross margins on the Company’s hardware products vary across product lines and can change over time as a result of
product transitions, pricing and configuration changes, and component, warranty, and other cost fluctuations. The
Company’s direct sales generally have higher associated gross margins than its indirect sales through its channel
partners. In addition, the Company’s gross margin and operating margin percentages, as well as overall profitability, may
be materially adversely impacted as a result of a shift in product, geographic or channel mix, component cost increases,
the strengthening U.S. dollar, price competition, or the introduction of new products, including those that have higher cost
structures with flat or reduced pricing.
The Company has typically experienced higher net sales in its first quarter compared to other quarters due in part to
seasonal holiday demand. Additionally, new product introductions can significantly impact net sales, product costs and
operating expenses. The Company could be subject to unexpected developments late in a quarter, such as lower-thananticipated demand for the Company’s products, issues with new product introductions, an internal systems failure, or
failure of one of the Company’s logistics, components supply, or manufacturing partners.
The Company’s stock price is subject to volatility.
The Company’s stock price has experienced substantial price volatility in the past and may continue to do so in the future.
Additionally, the Company, the technology industry and the stock market as a whole have experienced extreme stock
price and volume fluctuations that have affected stock prices in ways that may have been unrelated to these companies’
operating performance. Price volatility over a given period may cause the average price at which the Company
repurchases its own stock to exceed the stock’s price at a given point in time. The Company believes its stock price
reflects expectations of future growth and profitability. The Company also believes its stock price reflects expectations
that its cash dividend will continue at current levels or grow and that its current share repurchase program will be fully
consummated. Future dividends are subject to declaration by the Company’s Board of Directors, and the Company’s
share repurchase program does not obligate it to acquire any specific number of shares. If the Company fails to meet
expectations related to future growth, profitability, dividends, share repurchases or other market expectations, its stock
price may decline significantly, which could have a material adverse impact on investor confidence and employee
retention.
48
The Company’s financial performance is subject to risks associated with changes in the value of the U.S. dollar versus local
currencies.
The Company’s primary exposure to movements in foreign currency exchange rates relates to non-U.S. dollar denominated
sales and operating expenses worldwide. Weakening of foreign currencies relative to the U.S. dollar adversely affects the
U.S. dollar value of the Company’s foreign currency-denominated sales and earnings, and generally leads the Company to
raise international pricing, potentially reducing demand for the Company’s products. Margins on sales of the Company’s
products in foreign countries and on sales of products that include components obtained from foreign suppliers, could be
materially adversely affected by foreign currency exchange rate fluctuations. In some circumstances, for competitive or
other reasons, the Company may decide not to raise local prices to fully offset the dollar’s strengthening, or at all, which
would adversely affect the U.S. dollar value of the Company’s foreign currency denominated sales and earnings.
Conversely, a strengthening of foreign currencies relative to the U.S. dollar, while generally beneficial to the Company’s
foreign currency-denominated sales and earnings, could cause the Company to reduce international pricing and incur
losses on its foreign currency derivative instruments, thereby limiting the benefit. Additionally, strengthening of foreign
currencies may also increase the Company’s cost of product components denominated in those currencies, thus adversely
affecting gross margins.
The Company uses derivative instruments, such as foreign currency forward and option contracts, to hedge certain
exposures to fluctuations in foreign currency exchange rates. The use of such hedging activities may not offset any, or more
than a portion, of the adverse financial effects of unfavorable movements in foreign exchange rates over the limited time the
hedges are in place.
The Company is exposed to credit risk and fluctuations in the market values of its investment portfolio.
Given the global nature of its business, the Company has both domestic and international investments. Credit ratings and
pricing of the Company’s investments can be negatively affected by liquidity, credit deterioration, financial results, economic
risk, political risk, sovereign risk or other factors. As a result, the value and liquidity of the Company’s cash, cash
equivalents and marketable securities may fluctuate substantially. Therefore, although the Company has not realized any
significant losses on its cash, cash equivalents and marketable securities, future fluctuations in their value could result in a
significant realized loss.
The Company is exposed to credit risk on its trade accounts receivable, vendor non-trade receivables and prepayments
related to long-term supply agreements, and this risk is heightened during periods when economic conditions worsen.
The Company distributes its products through third-party cellular network carriers, wholesalers, retailers and value-added
resellers. The Company also sells its products directly to small and mid-sized businesses and education, enterprise and
government customers. A substantial majority of the Company’s outstanding trade receivables are not covered by collateral,
third-party financing arrangements or credit insurance. The Company’s exposure to credit and collectability risk on its trade
receivables is higher in certain international markets and its ability to mitigate such risks may be limited. The Company also
has unsecured vendor non-trade receivables resulting from purchases of components by outsourcing partners and other
vendors that manufacture sub-assemblies or assemble final products for the Company. In addition, the Company has made
prepayments associated with long-term supply agreements to secure supply of inventory components. As of December 27,
2014, a significant portion of the Company’s trade receivables was concentrated within cellular network carriers, and its
vendor non-trade receivables and prepayments related to long-term supply agreements were concentrated among a few
individual vendors located primarily in Asia. While the Company has procedures to monitor and limit exposure to credit risk
on its trade and vendor non-trade receivables, as well as long-term prepayments, there can be no assurance such
procedures will effectively limit its credit risk and avoid losses.
The Company could be subject to changes in its tax rates, the adoption of new U.S. or international tax legislation or
exposure to additional tax liabilities.
The Company is subject to taxes in the U.S. and numerous foreign jurisdictions, including Ireland, where a number of the
Company’s subsidiaries are organized. Due to economic and political conditions, tax rates in various jurisdictions may be
subject to significant change. The Company’s future effective tax rates could be affected by changes in the mix of earnings
in countries with differing statutory tax rates, changes in the valuation of deferred tax assets and liabilities, or changes in tax
laws or their interpretation, including in the U.S. and Ireland. For example, in June 2014, the European Commission opened
a formal investigation to examine whether decisions by the tax authorities in Ireland with regard to the corporate income tax
to be paid by two of the Company’s Irish subsidiaries comply with European Union rules on state aid. If the European
Commission were to take a final decision against Ireland, it could require Ireland to recover from the Company past taxes
reflective of the disallowed state aid.
The Company is also subject to the examination of its tax returns and other tax matters by the Internal Revenue Service and
other tax authorities and governmental bodies. The Company regularly assesses the likelihood of an adverse outcome
resulting from these examinations to determine the adequacy of its provision for taxes. There can be no assurance as to the
outcome of these examinations. If the Company’s effective tax rates were to increase, particularly in the U.S. or Ireland, or if
the ultimate determination of the Company’s taxes owed is for an amount in excess of amounts previously accrued, the
Company’s operating results, cash flows and financial condition could be adversely affected.
49
Item 2.
Unregistered Sales of Equity Securities and Use of Proceeds
Share repurchase activity during the three months ended December 27, 2014 was as follows (in millions, except number
of shares, which are reflected in thousands, and per share amounts):
Q1 Fiscal Periods
September 28, 2014 to November 1, 2014:
Open market and privately negotiated
purchases
November 2, 2014 to November 29, 2014:
August 2014 ASR
Open market and privately negotiated
purchases
November 30, 2014 to December 27, 2014:
August 2014 ASR
Open market and privately negotiated
purchases
Total
Total Number
of Shares
Purchased
16,246
Average
Price Paid
Per Share
$
6,500 (2)
24,664
104.02
(2)
$
1,850 (2)
4,794
54,054
Total Number of
Shares
Purchased as
Part of Publicly
Announced
Plans or
Programs
112.31
(2)
$
112.64
Approximate
Dollar Value of
Shares That
May Yet Be
Purchased
Under the Plans
or Programs (1)
16,246
6,500 (2)
24,664
1,850 (2)
4,794
$
(1)
In 2012, the Company’s Board of Directors authorized a program to repurchase up to $10 billion of the Company’s
common stock beginning in 2013. The Company’s Board of Directors increased the authorization to repurchase the
Company’s common stock to $60 billion in April 2013 and to $90 billion in April 2014. As of December 27, 2014,
$72.9 billion of the $90 billion had been utilized. The remaining $17.1 billion in the table represents the amount
available to repurchase shares under the authorized repurchase program as of December 27, 2014. The Company’s
share repurchase program does not obligate it to acquire any specific number of shares. Under the program, shares
may be repurchased in privately negotiated and/or open market transactions, including under plans complying with
Rule 10b5-1 under the Exchange Act.
(2)
In August 2014, the Company entered into a new accelerated share repurchase arrangement (“ASR”) to purchase up
to $9.0 billion of the Company’s common stock. In exchange for up-front payments totaling $9.0 billion, the financial
institutions committed to deliver shares during the ASR’s purchase period, which will end in or before February 2015.
The total number of shares ultimately delivered, and therefore the average price paid per share, will be determined at
the end of the applicable purchase period based on the volume weighted-average price of the Company’s common
stock during that period. During the first quarter of 2015, 8.3 million net shares were delivered and retired under the
August 2014 ASR, and the final number of shares to be delivered will be determined at the conclusion of the
purchase period.
Item 3.
17,050
Defaults Upon Senior Securities
None.
Item 4.
Mine Safety Disclosures
Not applicable.
Item 5.
Other Information
Effective January 26, 2015, the Company appointed Chris Kondo, the Company’s Senior Director of Corporate
Accounting, to the role of Principal Accounting Officer, replacing Luca Maestri in such role effective as of the same date.
Mr. Kondo, age 48, joined the Company in January 2010 and has previously served as the Company’s Director of
Technical Accounting. Prior to joining the Company, Mr. Kondo was an audit partner with KPMG LLP.
With respect to the disclosure required pursuant to Item 401(d) of Regulation S-K, there are no family relationships
between Mr. Kondo and any director or executive officer of the Company. With respect to Item 404(a) of Regulation S-K,
there are no transactions between Mr. Kondo and the Company that would be required to be disclosed.
50
Item 6.
Exhibits
Index to Exhibits
Exhibit Description
Incorporated by
Reference
Filing Date/
Period End
Form Exhibit Date
3.1
Restated Articles of Incorporation of the Registrant effective as of June 6, 2014.
8-K
3.1
6/6/14
3.2
Amended and Restated Bylaws of the Registrant effective as of February 28,
2014.
8-K
3.2
3/5/14
4.1
Form of Common Stock Certificate of the Registrant.
10-Q 4.1
12/30/06
4.2
Indenture, dated as of April 29, 2013, between the Registrant and The Bank of
New York Mellon Trust Company, N.A., as Trustee.
S-3
4.1
4/29/13
4.3
Officer’s Certificate of the Registrant, dated as of May 3, 2013, including forms of 8-K
global notes representing the Floating Rate Notes due 2016, Floating Rate Notes
due 2018, 0.45% Notes due 2016, 1.00% Notes due 2018, 2.40% Notes due 2023
and 3.85% Notes due 2043.
4.1
5/3/13
4.4
Officer’s Certificate of the Registrant, dated as of May 6, 2014, including forms of
global notes representing the Floating Rate Notes due 2017, Floating Rate Notes
due 2019, 1.05% Notes due 2017, 2.10% Notes due 2019, 2.85% Notes due
2021, 3.45% Notes due 2024 and 4.45% Notes due 2044.
8-K
4.1
5/6/14
4.5
Officer’s Certificate of the Registrant, dated as of November 10, 2014, including
forms of global notes representing the 1.00% Notes due 2022 and 1.625% Notes
due 2026.
8-K
4.1
11/10/14
10.1*
Amended Employee Stock Purchase Plan, effective as of March 8, 2010.
10-Q 10.1
3/27/10
10.2*
Form of Indemnification Agreement between the Registrant and each director and
executive officer of the Registrant.
10-Q 10.2
6/27/09
10.3*
1997 Director Stock Plan, as amended through August 23, 2012.
10-Q 10.3
12/28/13
10.4*
2003 Employee Stock Plan, as amended through February 25, 2010.
8-K
3/1/10
10.5*
Form of Restricted Stock Unit Award Agreement under 2003 Employee Stock Plan 10-Q 10.10
effective as of November 16, 2010.
12/25/10
10.6*
Form of Restricted Stock Unit Award Agreement under 2003 Employee Stock Plan 10-Q 10.8
effective as of April 6, 2012.
3/31/12
10.7*
Summary Description of Amendment, effective as of May 24, 2012, to certain
Restricted Stock Unit Award Agreements outstanding as of April 5, 2012.
10-Q 10.8
6/30/12
10.8*
2014 Employee Stock Plan.
8-K
10.1
3/5/14
10.9*
Form of Restricted Stock Unit Award Agreement under 2014 Employee Stock Plan 8-K
as of February 28, 2014.
10.2
3/5/14
10.10*
Form of Performance Award Agreement under 2014 Employee Stock Plan
effective as of February 28, 2014.
10.3
3/5/14
10.11*
Form of Restricted Stock Unit Award Agreement under 2014 Employee Stock Plan 10-K 10.11
effective as of August 26, 2014.
9/27/14
10.12*
Form of Performance Award Agreement under 2014 Employee Stock Plan
effective as of August 26, 2014.
10-K 10.12
9/27/14
10.13*
Form of Amendment, effective as of August 26, 2014, to Restricted Stock Unit
10-K 10.13
Award Agreements and Performance Award Agreements outstanding as of August
26, 2014.
9/27/14
Exhibit
Number
51
8-K
10.1
Exhibit
Number
Incorporated by
Reference
Filing Date/
Period End
Form Exhibit Date
Exhibit Description
10.14*, ** Offer Letter, dated August 1, 2013, from the Registrant to Angela Ahrendts.
31.1**
Rule 13a-14(a) / 15d-14(a) Certification of Chief Executive Officer.
31.2**
Rule 13a-14(a) / 15d-14(a) Certification of Chief Financial Officer.
32.1***
Section 1350 Certifications of Chief Executive Officer and Chief Financial Officer.
101.INS**
XBRL Instance Document.
101.SCH** XBRL Taxonomy Extension Schema Document.
101.CAL** XBRL Taxonomy Extension Calculation Linkbase Document.
101.DEF** XBRL Taxonomy Extension Definition Linkbase Document.
101.LAB** XBRL Taxonomy Extension Label Linkbase Document.
101.PRE** XBRL Taxonomy Extension Presentation Linkbase Document.
*
Indicates management contract or compensatory plan or arrangement.
**
Filed herewith.
*** Furnished herewith.
52
SIGNATURE
Pursuant to the requirements of the Securities Exchange Act of 1934, the registrant has duly caused this report to be
signed on its behalf by the undersigned thereunto duly authorized.
January 28, 2015
Apple Inc.
By: /s/ Luca Maestri
Luca Maestri
Senior Vice President,
Chief Financial Officer
53
Exhibit 10.14
August 1, 2013
Angela Ahrendts
Dear Angela:
I am delighted to offer you the newly created position of Senior Vice President, Retail and Online Store. In your new
position you will report to me, with the effective start date to be determined. I look forward to working together and having
you as a member of Apple’s executive team, which is collectively responsible for all of Apple’s key decisions. I know you
will have an incredible impact on Apple and, through Apple, the world.
While the offer below contains a number of facets, what underlies it all is my strong belief that you are the right leader for
Apple Retail and Apple’s Online Store.
Compensation
Salary
You will receive an annual base salary of (US)$875,000 (less deductions required by law) payable every other week in
accordance with Apple’s standard payroll procedures. Apple reserves the right to modify salaries and benefits from time
to time as it deems necessary, provided the criteria for determining any such modification shall be applied to you in a
manner that is consistent with other members of Apple’s executive team of equal stature.
FY’14 Annual Bonus Plan for Executive Officers
You will be eligible to participate in Apple’s bonus plan for Executive Officers. Details about the plan, including eligibility,
financial measurements and bonus targets, will be sent to you separately. The criteria used to determine your individual
bonus under this bonus plan shall be applied to you in a manner that is consistent with other members of Apple’s
executive team of equal stature.
Hire-On Bonus
You will be eligible to receive a hire-on bonus of Five Hundred Thousand Dollars (US)($500,000)(less deductions
required by law), subject to the following terms and conditions. Apple will advance you payment of the bonus on the first
payroll pay date following your start date. However, should you voluntarily terminate your employment with Apple within
12 months of your start date other than for Good Reason1, or if your employment is terminated by Apple
1
For purposes of this agreement and subject to the following provisions of this paragraph, “Good Reason” means you resign from
your employment with Apple following one or more of these events: (1) a material reduction or increase in your duties or responsibilities,
(2) your reporting structure is changed such that you no longer report to the CEO, (3) a material change in your primary work location
after you have relocated to the San Francisco Bay Area, (4) any other breach by Company of any of its material commitments in
connection with your employment. If you wish to claim Good Reason, you must (i) provide written notice to the CEO within 45 days after
the occurrence of an event covered under (1)-(4), and (ii) have not given written permission for that event. Apple has 30 days to cure the
event after receipt of your written notice. If Apple does not cure the event within that 30-day period, you may only terminate employment
for Good Reason within 90 days after the expiration of the cure period.
Apple Confidential
1
2
for Cause , you will be responsible for reimbursing a pro-rata portion (based on service) of the advance bonus payment
at Apple’s sole discretion.
Restricted Stock Unit Awards
You will be awarded restricted stock units (“RSUs”) as follows:
•
Make Whole Award. You will receive a make whole award of RSUs with an aggregate award value of (US)$37
million on the date of grant (“Make Whole RSUs”) (the date of grant being your start date). The Make Whole RSUs
will vest as follows: (1) 26% will vest on June 1, 2014; (2) 32% will vest on April 1, 2015; (3) 21% will vest on July 18,
2015; (4) 15% will vest on June 14, 2016; (5) 3% will vest on June 14, 2017; and (6) 3% will vest on June 14, 2018.
•
New Hire Award. You will also receive a new hire award of RSUs with an aggregate award value of (US)$33 million
on the date of grant (“New Hire RSUs”) (the date of grant being your start date). New Hire RSUs will be separated
into three equal tranches, with a tranche scheduled to vest on each of the first, second and third annual anniversaries
of the date of grant, provided that 40% of the RSUs in each tranche will be subject to performance-based vesting
conditions in addition to your continued employment through the applicable vesting date. The Compensation
Committee of the Board of Directors (“Compensation Committee”) will determine the additional performance-based
vesting conditions applicable to the performance-based portion of your New Hire RSUs.
An RSU is the right to receive shares of Apple common stock upon vesting; one unit represents one share of Apple stock.
The number of RSUs subject to an award will be determined by dividing the applicable award value set forth above by the
Nasdaq closing price of a share of Apple stock on the date of grant and rounding up to the nearest whole share. Subject
to the varying terms hereof, vesting of RSUs is subject to your continued employment by the Company through the
applicable vesting date. In the event that your employment is terminated by Apple other than for Cause or you resign your
employment with Apple for Good Reason, or in case of your death, your unvested Make Whole RSUs will fully vest upon
such termination of employment. Otherwise, your awards will be subject to the termination of employment provisions of
the applicable grant agreements.
After Compensation Committee approval of the awards, the specific terms and
2 For purposes of this agreement, “Cause” means (i) an act by you of fraud or material dishonesty in connection with your duties as an
employee of Apple; (ii) an act by you which constitutes gross misconduct and which you should have reasonably known would be and is
injurious to Apple in a significant way; (iii) your failure (after written notice and a reasonable opportunity to cure) to follow the lawful
direction of the CEO or the Board of Directors; (iv) your willful and continued failure (after written notice and a reasonable opportunity to
cure) to perform your material duties for Apple; or (v) a willful and material breach of an Apple policy or of your Intellectual Property
Agreement; provided, however, a termination for “Cause” must be consistent with Apple’s standard practices with respect to executives
of your stature.
Apple Confidential
2
conditions applicable to the awards will be available in the grant agreement. Participation in Apple’s 2003 Employee
Stock Plan (the “Stock Plan”) is subject to the written terms and conditions contained in the Stock Plan and the applicable
grant agreements. The terms and conditions of all grant agreements (other than amounts and vesting schedules) as
applied to you will be no less favorable than those terms and conditions applied to the regular awards granted to other
members of Apple’s executive team of equal stature.
Severance
In the event that, within the first three years of your start date, your employment is terminated by Apple other than for
Cause, or you resign your employment with Apple for Good Reason, Apple will pay you as severance (subject to
applicable withholding) the amount of your base salary (at the rate in effect immediately prior to the termination of your
employment) for the remainder of that three-year period. Any severance will be paid in a single lump sum payment on or
within ten days after the 40th day following the last day of your employment with Apple, and such amount shall not be
subject to mitigation or any reduction other than applicable withholding.
Benefits
As a full-time employee, you will be eligible to participate in Apple’s comprehensive benefits program, on a basis no less
favorable to you than to other members of Apple’s executive team of equal stature. We’ve enclosed a Corporate Benefits
Program Summary in this folder with more details.
Upon hire, you may immediately enroll in the Apple 401(k) Plan to which both you and Apple contribute. Apple matches
your contributions made through payroll withholding starting at 50 cents for each dollar you contribute up to 6% of eligible
pay. As a convenience to you, you will be automatically enrolled in the Apple 401(k) Plan with a before-tax contribution of
3% of your eligible base pay, with contributions starting approximately 30 days after your employment with Apple begins.
If you do not wish to be automatically enrolled in the Apple 401(k) Plan, or if you wish to contribute a different percentage
of eligible pay, you may opt-out or change your contribution election at any time. In addition, you will be enrolled in an
automatic increase program. This program will increase your contributions by 1% each year on the anniversary of your
automatic enrollment date, to a maximum of 6%. You can opt out of this program at any time, or you can choose to
maintain the annual increase program after reaching the 6% maximum.
Participation in any of Apple’s benefits plans is subject to the written terms and conditions contained in the various plans.
You will be given additional information regarding these benefits plans during your New Employee Orientation sessions.
All such plans and their applicable terms will be no less favorable, and will be applied to you no less favorably, than to
other members of Apple’s executive team of equal stature.
Relocation Package
The details of your relocation benefits are described in a separate Relocation Agreement.
Apple Confidential
3
Conditions
This offer of employment is contingent on the following conditions.
•
On your first day of employment, and possibly from time to time thereafter, you must show proof of identity and legal
right to work in the United States as required by federal immigration law. If you are unable to provide documentation
of your authorization to work in the United States, Apple may terminate your employment.
•
Due to U.S. Department of Commerce requirements, if you’re not a U.S. citizen, U.S. permanent resident, Canadian
citizen, political refugee, or a political asylum holder, you will be required to sign an assurance regarding obligations
not to export controlled technical data or software to certain countries. If you’re a citizen of a restricted country (as
identified by the Department of Commerce), Apple could be required to obtain an export license from the Department
of Commerce. Apple will work with you to obtain this license within a time limit established by Apple. If for any reason
Apple doesn’t receive a license within the established time frame, Apple may terminate your employment.
•
You must sign the Intellectual Property Agreement and return the signed agreement with this offer letter. Any
exceptions or approvals required under the terms of the Intellectual Property Agreement must be approved by Apple’s
Legal Department prior to your beginning work.
•
We believe that every employee should use good judgment and exercise uncompromising integrity when conducting
Apple business. By accepting this offer, you acknowledge that you have received and read Apple’s Business Conduct
Policy and that you agree to comply with its terms.
•
You must receive a satisfactory background check in accordance with Apple policy.
If any of the above conditions are not materially satisfied, Apple may withdraw this offer of employment.
Your employment relationship with Apple will be at will. This means that either you or Apple may terminate the
employment relationship at any time and for any or no reason with or without notice (subject of course to the terms
hereof).
Your employment will be governed by and interpreted under the laws of the State of California, without regard to conflict
of law principles.
By signing this letter you agree that these are the only terms and conditions of your employment and acknowledge that
you have not relied upon any other promises or representations, except those made in this letter, and in the Relocation
Agreement referred to above.
This offer of employment is irrevocable until October 15, 2013. We must receive your written acceptance of this offer no
later than 5:00 p.m. Pacific Time that day, and your start date with Apple must occur no later than May 1, 2014.
Apple Confidential
4
I look forward to working together.
Sincerely,
/s/ Tim Cook
Tim Cook
CEO
On behalf of Apple Inc.
I accept the offer (sign below):
/s/ Angela Ahrendts
Candidate Signature
Oct. 14, 2013
Date
Angela Ahrendts
Printed Full Candidate Name
Apple Inc. | 1 Infinite Loop | Cupertino, California 95014
Apple Confidential
5
Exhibit 31.1
CERTIFICATION
I, Timothy D. Cook, certify that:
1. I have reviewed this quarterly report on Form 10-Q of Apple Inc.;
2. Based on my knowledge, this report does not contain any untrue statement of a material fact or omit to state a
material fact necessary to make the statements made, in light of the circumstances under which such statements
were made, not misleading with respect to the period covered by this report;
3. Based on my knowledge, the financial statements, and other financial information included in this report, fairly present
in all material respects the financial condition, results of operations and cash flows of the registrant as of, and for, the
periods presented in this report;
4. The registrant’s other certifying officer(s) and I are responsible for establishing and maintaining disclosure controls
and procedures (as defined in Exchange Act Rules 13a-15(e) and 15d-15(e)) and internal control over financial
reporting (as defined in Exchange Act Rules 13a-15(f) and 15d-15(f)) for the registrant and have:
(a) Designed such disclosure controls and procedures, or caused such disclosure controls and procedures to be
designed under our supervision, to ensure that material information relating to the registrant, including its
consolidated subsidiaries, is made known to us by others within those entities, particularly during the period in
which this report is being prepared;
(b) Designed such internal control over financial reporting, or caused such internal control over financial reporting to
be designed under our supervision, to provide reasonable assurance regarding the reliability of financial
reporting and the preparation of financial statements for external purposes in accordance with generally
accepted accounting principles;
(c) Evaluated the effectiveness of the registrant’s disclosure controls and procedures and presented in this report
our conclusions about the effectiveness of the disclosure controls and procedures, as of the end of the period
covered by this report based on such evaluation; and
(d) Disclosed in this report any change in the registrant’s internal control over financial reporting that occurred during
the registrant’s most recent fiscal quarter (the registrant’s fourth fiscal quarter in the case of an annual report)
that has materially affected, or is reasonably likely to materially affect, the registrant’s internal control over
financial reporting; and
5. The registrant’s other certifying officer(s) and I have disclosed, based on our most recent evaluation of internal control
over financial reporting, to the registrant’s auditors and the audit committee of the registrant’s board of directors (or
persons performing the equivalent functions):
(a) All significant deficiencies and material weaknesses in the design or operation of internal control over financial
reporting which are reasonably likely to adversely affect the registrant’s ability to record, process, summarize,
and report financial information; and
(b) Any fraud, whether or not material, that involves management or other employees who have a significant role in
the registrant’s internal control over financial reporting.
Date: January 28, 2015
By: /s/ Timothy D. Cook
Timothy D. Cook
Chief Executive Officer
Exhibit 31.2
CERTIFICATION
I, Luca Maestri, certify that:
1. I have reviewed this quarterly report on Form 10-Q of Apple Inc.;
2. Based on my knowledge, this report does not contain any untrue statement of a material fact or omit to state a
material fact necessary to make the statements made, in light of the circumstances under which such statements
were made, not misleading with respect to the period covered by this report;
3. Based on my knowledge, the financial statements, and other financial information included in this report, fairly present
in all material respects the financial condition, results of operations and cash flows of the registrant as of, and for, the
periods presented in this report;
4. The registrant’s other certifying officer(s) and I are responsible for establishing and maintaining disclosure controls
and procedures (as defined in Exchange Act Rules 13a-15(e) and 15d-15(e)) and internal control over financial
reporting (as defined in Exchange Act Rules 13a-15(f) and 15d-15(f)) for the registrant and have:
(a) Designed such disclosure controls and procedures, or caused such disclosure controls and procedures to be
designed under our supervision, to ensure that material information relating to the registrant, including its
consolidated subsidiaries, is made known to us by others within those entities, particularly during the period in
which this report is being prepared;
(b) Designed such internal control over financial reporting, or caused such internal control over financial reporting to
be designed under our supervision, to provide reasonable assurance regarding the reliability of financial
reporting and the preparation of financial statements for external purposes in accordance with generally
accepted accounting principles;
(c) Evaluated the effectiveness of the registrant’s disclosure controls and procedures and presented in this report
our conclusions about the effectiveness of the disclosure controls and procedures, as of the end of the period
covered by this report based on such evaluation; and
(d) Disclosed in this report any change in the registrant’s internal control over financial reporting that occurred during
the registrant’s most recent fiscal quarter (the registrant’s fourth fiscal quarter in the case of an annual report)
that has materially affected, or is reasonably likely to materially affect, the registrant’s internal control over
financial reporting; and
5. The registrant’s other certifying officer(s) and I have disclosed, based on our most recent evaluation of internal control
over financial reporting, to the registrant’s auditors and the audit committee of the registrant’s board of directors (or
persons performing the equivalent functions):
(a) All significant deficiencies and material weaknesses in the design or operation of internal control over financial
reporting which are reasonably likely to adversely affect the registrant’s ability to record, process, summarize,
and report financial information; and
(b) Any fraud, whether or not material, that involves management or other employees who have a significant role in
the registrant’s internal control over financial reporting.
Date: January 28, 2015
By: /s/ Luca Maestri
Luca Maestri
Senior Vice President,
Chief Financial Officer
Exhibit 32.1
CERTIFICATION OF CHIEF EXECUTIVE OFFICER AND CHIEF FINANCIAL OFFICER
PURSUANT TO
18 U.S.C. SECTION 1350,
AS ADOPTED PURSUANT TO
SECTION 906 OF THE SARBANES-OXLEY ACT OF 2002
I, Timothy D. Cook, certify, as of the date hereof, pursuant to 18 U.S.C. Section 1350, as adopted pursuant to
Section 906 of the Sarbanes-Oxley Act of 2002, that the Quarterly Report of Apple Inc. on Form 10-Q for the period
ended December 27, 2014 fully complies with the requirements of Section 13(a) or 15(d) of the Securities Exchange Act
of 1934 and that information contained in such Form 10-Q fairly presents in all material respects the financial condition
and results of operations of Apple Inc. at the dates and for the periods indicated.
Date: January 28, 2015
By: /s/ Timothy D. Cook
Timothy D. Cook
Chief Executive Officer
I, Luca Maestri, certify, as of the date hereof, pursuant to 18 U.S.C. Section 1350, as adopted pursuant to Section 906 of
the Sarbanes-Oxley Act of 2002, that the Quarterly Report of Apple Inc. on Form 10-Q for the period ended
December 27, 2014 fully complies with the requirements of Section 13(a) or 15(d) of the Securities Exchange Act of 1934
and that information contained in such Form 10-Q fairly presents in all material respects the financial condition and
results of operations of Apple Inc. at the dates and for the periods indicated.
Date: January 28, 2015
By: /s/ Luca Maestri
Luca Maestri
Senior Vice President,
Chief Financial Officer


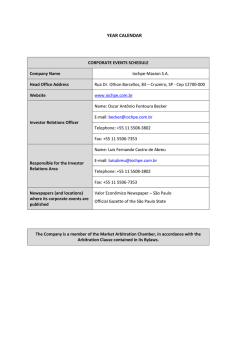

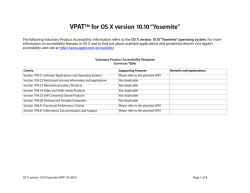
© Copyright 2026