
Grupo Catalana Occidente SA GCO
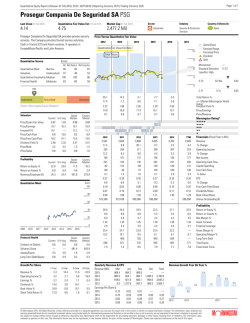
Page 1 of 1
Quantitative Equity Report | Release: 15 Apr 2016, 23:01, GMT-05:00 | Reporting Currency: EUR | Trading Currency: EUR | Exchange:XMCE
Grupo Catalana Occidente SA GCO
Last Close 15 Apr 2016
Quantitative Fair Value Est 15 Apr 2016
Market Cap 15 Apr 2016
Sector
Industry
26.48
29.49
3,124.5 Mil
y Financial Services
Insurance - Property &
Casualty
Grupo Catalana Occidente SA operates as an insurance
company in Spain. The Company is engaged in the insurance
and reinsurance sectors. Its products and services are
marketed through the segments Life, Non-Life and Other
Activities.
Quantitative Scores
Country of Domicile
Price Versus Quantitative Fair Value
2012
2013
2014
2015
2016
2017
Sales/Share
Forecast Range
Forcasted Price
Dividend
Split
Quantitative Fair Value Estimate
50
Total Return
40
Scores
Momentum:
—
Standard Deviation: 22.89
Liquidity: Medium
All Rel Sector Rel Country
Quantitative Moat
None
Valuation
Undervalued
Quantitative Uncertainty High
Financial Health
Strong
ESP Spain
22
67
94
98
11
50
93
86
30
20
75
83
95
20
23.02
52-Wk
32.50
9.15
5-Yr
32.50
10
GCO
y
ESP
Undervalued
Fairly Valued
Overvalued
Source: Morningstar Equity Research
Valuation
Sector
Median
Country
Median
0.98
10.8
—
8.0
9.2
3.05
1.5
0.9
0.89
12.8
10.4
8.4
9.2
3.48
1.0
2.5
0.95
16.1
12.8
8.8
13.2
3.46
1.6
1.2
Current 5-Yr Avg
Sector
Median
Country
Median
9.7
1.2
642.1
Current 5-Yr Avg
Price/Quant Fair Value
Price/Earnings
Forward P/E
Price/Cash Flow
Price/Free Cash Flow
Trailing Dividend Yield %
Price/Book
Price/Sales
0.90
11.8
—
13.8
16.4
2.44
1.4
0.9
Profitability
Return on Equity %
Return on Assets %
Revenue/Employee (K)
12.0
2.2
540.0
14.2
2.2
510.9
Quantitative Moat
16.9
-0.8
93.1
77.7
-5.5
-1.8
36.0
36.7
-16.9
-18.8
4.14
—
8.1
0.6
2.21
—
14.8
1.1
2.54
—
11.7
0.9
2.00
—
14.0
1.2
—
2.44
11.7
0.9
Total Return %
+/– Market (Morningstar World
Index)
Trailing Dividend Yield %
Forward Dividend Yield %
Price/Earnings
Price/Revenue
Morningstar RatingQ
QQQQQ
QQQQ
QQQ
QQ
Q
2012
2013
2014
2015
TTM
2,845
1.2
2,914
2.4
3,079
5.6
3,522
14.4
3,522
0.0
328
16.0
210
336
2.3
200
353
5.0
221
382
8.2
242
415
8.8
268
415
0.0
268
Operating Income
% Change
Net Income
11.7
3.1
276.9
301
-29
271
9.7
241
-36
204
7.2
302
-41
261
8.9
373
-33
341
11.1
229
-36
194
5.5
229
-36
194
5.5
Operating Cash Flow
Capital Spending
Free Cash Flow
% Sales
Score
100
1.79
16.1
4.69
1.70
-4.9
1.74
1.88
10.5
1.71
2.05
9.2
1.99
2.27
10.7
2.89
2.27
0.0
1.64
EPS
% Change
Free Cash Flow/Share
80
0.54
12.39
120,000
0.57
11.95
117,846
0.57
13.73
117,996
0.61
17.53
117,996
0.64
18.67
—
0.64
19.49
117,996
17.8
2.3
7.5
0.30
7.6
15.0
2.1
7.0
0.30
6.8
14.0
2.2
7.6
0.29
5.9
12.4
2.3
7.9
0.29
5.2
12.0
2.2
7.6
0.29
5.8
12.0
2.2
7.6
0.29
5.8
Profitability
Return on Equity %
Return on Assets %
Net Margin %
Asset Turnover
Financial Leverage
—
11.7
—
—
11.8
—
—
12.1
—
—
12.4
—
—
11.8
—
—
11.8
—
Gross Margin %
Operating Margin %
Long-Term Debt
1,234
9.8
1,433
11.4
1,724
12.0
2,167
13.1
2,300
13.9
2,300
13.9
60
40
20
0
2009
2010
2011
2012
2013
2014
2015
Financial Health
Current 5-Yr Avg
Distance to Default
Solvency Score
Assets/Equity
Long-Term Debt/Equity
2016
Sector
Median
Country
Median
0.7
503.6
3.9
0.4
0.6
603.3
2.8
0.4
0.9
—
5.8
—
0.7
—
6.3
—
1-Year
3-Year
5-Year
10-Year
14.4
8.8
10.7
5.0
6.1
-5.0
7.4
7.3
10.1
4.0
17.7
18.8
7.5
8.0
8.1
14.2
15.1
13.0
6.8
6.0
-32.5
—
-4.2
3.1
Growth Per Share
Revenue %
Operating Income %
Earnings %
Dividends %
Book Value %
Stock Total Return %
Financials (Fiscal Year in Mil)
Revenue
% Change
2011
2,811
14.8
Quarterly Revenue & EPS
Revenue (Mil)
Mar
2015
858.2
2014
865.6
2013
829.7
2012
827.7
Earnings Per Share ()
2015
0.59
2014
0.51
2013
0.48
2012
0.46
Dividends/Share
Book Value/Share
Shares Outstanding (K)
Total Equity
Fixed Asset Turns
Revenue Growth Year On Year %
Jun
525.6
446.9
626.3
599.7
Sep
1,289.0
1,173.8
937.3
943.8
Dec
849.1
592.3
521.2
473.8
Total
3,521.9
3,078.6
2,914.5
2,845.0
43.3
25.2
10.0
17.6
13.7
9.8
4.3
-0.9
0.63
0.55
0.49
0.48
0.64
0.56
0.48
0.45
0.41
0.43
0.44
0.31
2.27
2.05
1.88
1.70
-28.7
2013
2014
© Morningstar 2016. All Rights Reserved. Unless otherwise provided in a separate agreement, you may use this report only in the country in which its original distributor is based. The information, data, analyses and
opinions presented herein do not constitute investment advice; are provided solely for informational purposes and therefore is not an offer to buy or sell a security; are not warranted to be correct, complete or accurate; and
are subject to change without notice. Except as otherwise required by law, Morningstar shall not be responsible for any trading decisions, damages or other losses resulting from, or related to, the information, data,
analyses or opinions or their use. The information herein may not be reproduced, in any manner without the prior written consent of Morningstar. Please see important disclosures at the end of this report.
2015
®
ß
© Copyright 2026