
Mapping of Olivine Rich Layer in Nectaris Basalts Using Moon
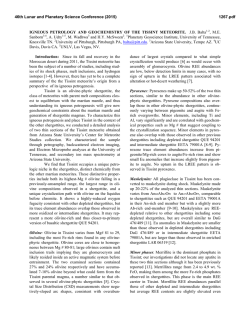
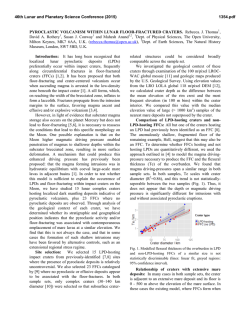
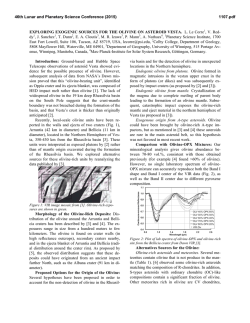
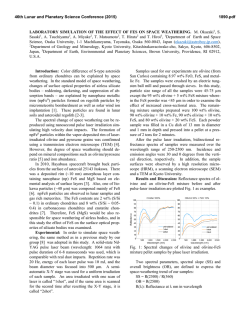
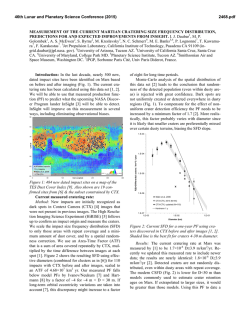
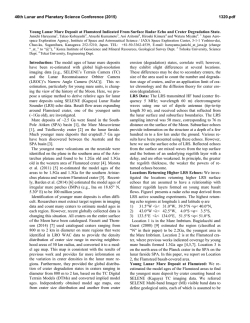
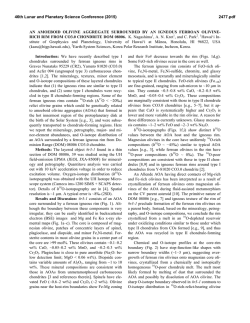
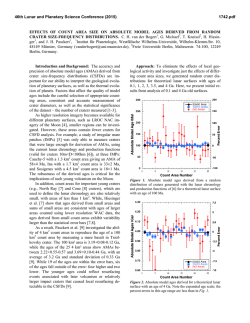
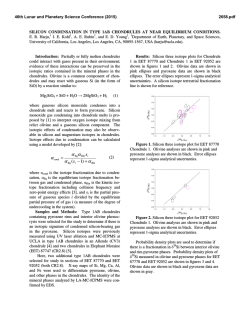
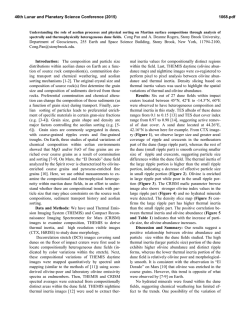
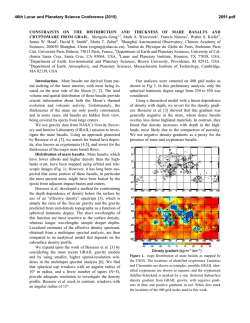
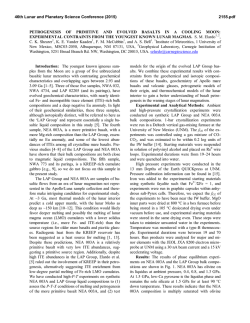
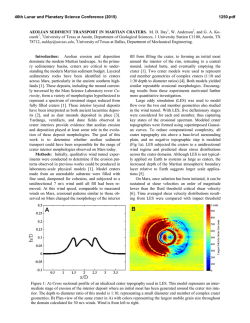
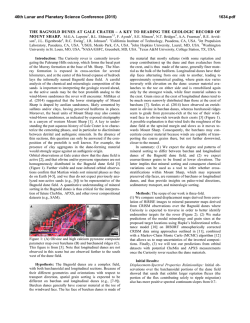
46th Lunar and Planetary Science Conference (2015)
1973.pdf
MAPPING OF OLIVINE RICH LAYER IN NECTRIS BASALTS USING MOON MINERALOGICAL
MAPPER (M3) DATA ONBOARD CHANDRAYAAN-1. Prabhjot Kaur1, 2, Prakash Chauhan1 and A. S. Rajawat1, 1Space Applications Centre, Ahmedabad, India-380058 ([email protected]), 2Nirma University, Ahmedabad, India-382481.
Introduction: Mare Nectaris is a multiring basin of
860 km diameter centered at 16º S, 34º E and located
on the eastern near side of the Moon. The basin exhibit
diverse geologic units, including mare basalts, dark
mantle or pyroclastic deposits of volcanic origin [1, 2].
The basin is heavily influenced by the ejecta cover
emplaced by the large craters such as Theophilus and
Madler and encloses many dark-halo craters (DHCs)
[3]. Previous studies suggested that Nectaris basin is
filled by two and possibly three basalt units and is
dominated by one with a high alumina (HA) composition (Iltm). Spectral profiles of the craters from Clementine data show two mineralogies- Unit Iltm may be
composed of two contemporaneous mare basalt flows,
both of a HA composition and a small mid-Ti unit caps
the near-center of Mare Nectaris [4]. Beaumont L
represents one such DHC of ~4 km (14.2º S 30.0º E)
and is located southeast of Theophilus and south of
Madler in the northwestern portion of the Mare Nectaris. Other unnamed DHCs are also present which lie
over the distal end of Theophilus and Madler continuous ejecta blanket. These dark-haloed craters have
been studied for their composition using M3 data,
where Beaumont L is found to be rich in olivine and
suggested to excavate olivine rich cryptomare layer
hidden beneath the Theophilus and Madler ejecta [5].
Olivine is the first mineral to crystallize from mafic magma and its composition is the direct indicator of
the composition and magmatic differentiation history
of the source magma [6]. Olivine is identified using
reflectance spectroscopy based on its characteristic
overlapping absorption near 1 µm and absence of 2 µm
absorption. Global distribution of olivine rich deposits
was mapped using Spectral profiler data onboard
SELENE which suggests that these exposures
represent some of the deepest materials excavated by
the basin-forming impact and are present largely in and
around the rims of large lunar impact basins [7]. The
mapped olivine rich sites may represent exposures of
the lunar mantle or differentiated plutons resulting
from secondary magmatic intrusions into the lunar
crust.
The aim of this study is to map the distribution of
olivine rich layer that may represent compositional
distinct flows present within the Nectaris basalts which
have not mentioned in earlier studies.
Data set and Method: We used data from Moon
Mineralogical Mapper (M3) onboard Chandrayaan-1
[8]. M3 is an imaging spectrometer with spectral range
0.45 - 3.00 μm and 85 spectral bands [9]. Data imaged
from 100 km orbit having spatial a resolution of ~140
m per pixel have been used for detailed mineralogical
analysis.
Around 350 craters were selected and investigated
for their spectral properties. Band centers and band
areas for 1µm and 2 µm absorption were estimated of
the continuum removed spectra.
Observations: The distribution of olivine-rich craters identified based on the strong 1 µm and a weak 2
µm along with BAR values less than 1.5 is shown in
figure 1. The depth of excavation of the craters were
calculated which is approximately 1/10th of the transient crater diameter [10]. Figure 1a shows map of
Mare Nectaris with thickness labeled as inferred from
the craters excavation depth. The minimum and maximum excavation depths of the olivine rich craters are
used to provide lower and upper bound for the thickness of olivine rich layer unit. The olivine rich layer
thus, present with a maximum thickness of around
370m and minimum of 20 m. The continuum removed
reflectance spectra display strong and symmetric band
I with an additional band around 1.3 µm and weak
band II characteristic of olivine are shown in figure 1b.
Out of all the craters investigated, Beaumont L which
is a dark-haloed crater display strongest olivine signatures. Band Area Ratio (BAR) and Band I center
(BC1) plot shows all data plot above the OC region
which represents olivine dominance over clinopyroxenes [11]. Variation in BAR as well as BC1 values
suggest variable olivine content, composition or mixing. A total of 350 craters were investigated for their
mineralogy, out of which 22 craters of variable diameters were found to rich in olivine. Rest of the craters
show a range of mineralogy from low-Ca to high Ca
pyroxenes and mixtures of olivine and pyroxenes.
Rosse crater (diameter ~12 km) with maximum excavation depth of ~ 1.01 km have excavated the basement anorthositic material and thus can be used to estimate the basalt fill thickness which is around 1.01 km
[12]. The presence and distribution of anorthositic material can be seen in figure 2 which shows the Integrated Band depth (IBD) map generated by assigning
red band to IBD at 1 µm, green band to IBD at 2 µm
and blue to 1.508 µm albedo channels. The blue color
in the map signifies presence of anorthositic material
on the walls and in the ejecta surrounding the crater.
Orange hue is attributable to strong 1 µm absorption
46th Lunar and Planetary Science Conference (2015)
1973.pdf
Continuum Removed Reflectance
because of olivine and is present mostly near the rim
area.
Beaumont L
b
Wavelength (µm)
Rosse
(µm) (um)
I Center
Band Band
I Center
1.10
1.00
c
a
0.90
0.00
0.50
1.00
1.50
2.00
2.50
3.00
BandBand
AreaArea
Ratio
(BAR)
Ratio
Figure 1(a) Map of Mare Nectaris generated from M3 images with thickness labeled as inferred from the craters excavation
depth. (b). continuum removed reflectance spectra of some of the craters represented by the same color as on map display strong
band I weak band II characteristic of olivine. (c). Band Area Ratio (BAR) and Band I center (BC1) plot shows all data plot near
the olivine dominance region.
2
10 km
Figure 2. Integrated Band depth (IBD) where the blue
color signifies weak or absence of 1 - and 2 µm absorption
due to presence of anorthositic material.
Conclusions: Mapping and thickness determination of the mare basalt flows is important to know
the compositional heterogeneity that exists within a
mare basin. This allows the evolution of the mare
source region to be investigated and cause of the formation of compositionally distinct lava flows. This
study has led to the identification of crater populations
which have excavated material from compositionally
distinct lava flows. The mapped olivine rich layers
may represent material of the lunar mantle and distributed within Nectaris basalts during its formation or
differentiated plutons resulting from secondary magmatic intrusions into the lunar crust.
References: [1] Whitford-Stark (1981) Icarus, 48,
393–427. [2] Wilhelms D. E. and McCauley, J. F.
(1971) Miscellaneous Geology Map, 1-604. [3] Hawke
B. R. et al. (1997) LPSC XXVIII, 529-530. [4] Kramer
G. Y. et al. (2008) JGR, 113, E0102. [5] Kaur P. et al.,
In communication with Planet. Space Sci. [6] Basaltic
Volcanism Study Project (BSVP) (1981) Basaltic Volcanism on the Terrestrial Planets. [7] Yamamoto S. et
al. (2010) Nat. Geosci., 3, 533–536. [8] Goswami J. N.
and Annadurai M. (2009) Curr. Sci., 96, 4, 486-491.
[9] Pieters C.M. et al. (2009) Curr. Sci., 96, 4, 500505. [10] Melosh H. J. (1989) Impact Cratering: A
Geologic Process, 245. [11] Gaffey M. J. et al., (2002)
Mineralogy of asteroids, 183–204. [12] Heather D. J.
and Dunkin S. K. (2002) Planet. Space Sci. 50, 1299–
1309.

© Copyright 2026