
The Subsurface Structure of the Compton - USRA
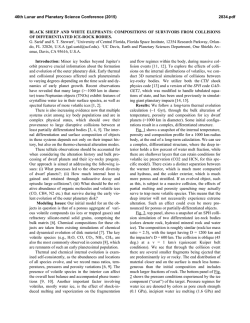
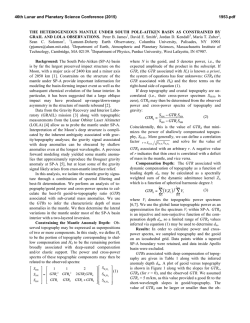
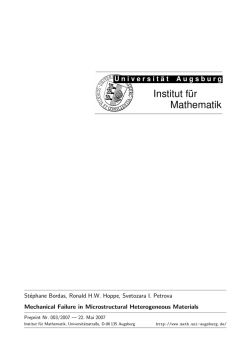
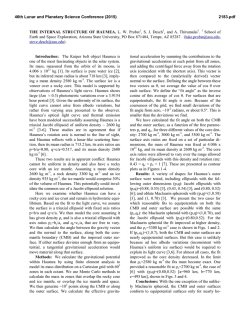
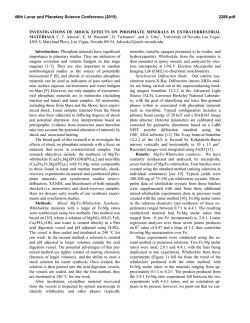
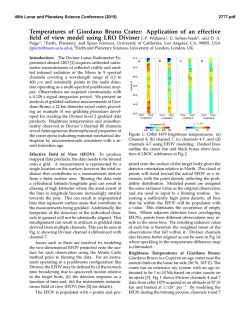
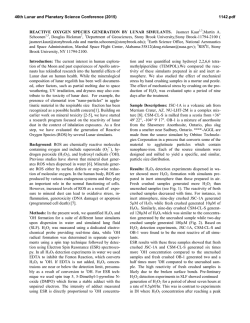
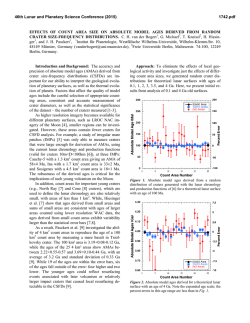
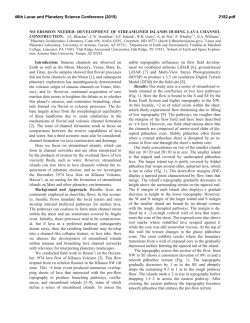
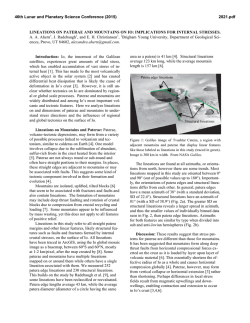
46th Lunar and Planetary Science Conference (2015)
2185.pdf
THE SUBSURFACE STRUCTURE OF THE COMPTON-BELKOVICH THORIUM ANOMALY AS
REVEALED BY GRAIL. J. C. Jansen1, J. C. Andrews-Hanna1, Y. Li1, J. Besserer2, S. Goossens3, J. W. Head III4,
W. S. Kiefer5, P. J. McGovern5, J. M. Soderblom6, G. J. Taylor7, M. A. Wieczorek8 and M. T. Zuber6, 1Department
of Geophysics, Colorado School of Mines, Golden, CO 80401, [email protected], 2Laboratoire de Planétologie et
Géodynamique de Nantes, Université de Nantés, France, 3Center for Research and Exploration in Space Science and
Technology, University of Maryland, Baltimore, MD 21250, 4Department of Earth, Environmental and Planetary
Sciences, Brown University, Providence, RI 02912. 5Lunar and Planetary Institute, Houston, TX 77058, 6Department
of Earth, Atmospheric and Planetary Sciences, Massachusetts Institute of Technology, Cambridge, MA 02139,
7
Hawaii Institute of Geophysics and Planetology, University of Hawaii, Honolulu, HI 96822. 8Institut de Physique du
Globe de Paris, Université Paris Diderot, 75013 Paris, France.
Introduction: The Compton-Belkovich region on
the lunar highlands (Fig. 1) was first identified as a
thorium-rich area based on Lunar Prospector GammaRay Spectrometer data [1]. Subsequent workers suggested that the high thorium anomaly in the ComptonBelkovich area is associated with silicic volcanism,
possibly caused by KREEP-rich intrusions within the
crust [2,3,4].
Figure 1. Cylindrical projection of LOLA [5] topography in
km, farside centered. The black box indicates the location of
the Compton-Belkovich region expanded in Fig. 2.
Figure 2. A) Topography (km), B) free-air gravity (mGal),
C) Bouguer gravity (mGal), and D) Thorium concentrations
(ppm) of the Compton-Belkovich high thorium region. The
black box is the Compton-Belkovich area, the Humboldtianum basin is labeled H.
Compton-Belkovich is observed in Lunar Oribiter
Laser Altimeter (LOLA) data [5] to be characterized by
average topographic relief that is approximately 1.6 km
below its surroundings. Gravity data from the Gravity
Recovery and Interior Laboratory (GRAIL) mission [6]
now reveal a positive Bouguer gravity signature associated with the feature that is approximately 155 mGal
greater than the surroundings (Fig. 2c).
Here we use three-dimensional inverse modeling
[7] of the Bouguer gravity to investigate the subsurface
structure of Compton-Belkovich. We test the hypothesis that both the observed gravity and topography are
the results of the loss of pore space in the crust caused
by thermal annealing due to an increase in temperature
from the high concentrations of heat producing elements present within the crust at this location.
Methods: We used the program GRAV3D [8,9],
which generates a three-dimensional density model
based on the observed gravity data. The model minimizes an objective function that relates the data misfit
and the model smoothness with a regularization parameter [7]. As input, we used the Bouguer-corrected
GRAIL gravity data with a low-pass cosine taper applied between degrees 480 and 500. The model was
used to predict density anomalies to a depth of 60 km,
which is a little deeper than the base of the crust in this
area [10]. The resulting three-dimensional density
model was then interpreted under the assumption that
all the density variations arise purely due to changes in
porosity, assuming an initial bulk density of 2550
kg/m3 and an initial porosity of 12% [10].
Results and interpretations: The best-fit density
model predicts a broad diffuse positive density anomaly beneath Compton-Belkovich, with a typical density
excess of ~150 kg m-3 (Fig. 3). The diffuse nature and
low magnitude of the predicted density anomalies are
not consistent with the uplift of the crust-mantle interface as might occur beneath an ancient impact basin. In
contrast, the mantle uplift below the nearby Humboldtianum basin is characterized by a sharply defined
positive density anomaly with a magnitude of 320 kg
m-3, consistent with the expected density contrast between the mantle and crust [10]. Furthermore, crater
counts suggest this area to be Copernican in age [2].
Higher densities could also be the signature of compositional variations as could arise from magmatic intru-
46th Lunar and Planetary Science Conference (2015)
sions in the lower crust. KREEP-rich intrusions may
contribute to the gravity, but cannot explain the observed topographic depression.
We now consider the possibility that both the positive density anomaly and the topography are results of
the thermal annealing of the pore space caused by the
enhanced concentrations of heat-producing elements in
the crust. However, the observed Th concentration may
be a result of a surficial volcanic deposit, and the concentration as a function of depth is poorly constrained
[2]. Thus, here we simply test whether loss of porosity
can explain the observed gravity and topography.
We used the density model to calcuate the corresponding changes in porosity (Fig. 3). The model indicates that the gravity can be explained by a decrease in
porosity by about ~6% relative to the surrounding terrain. This porosity decrease is less than typical crustal
porosities determined by GRAIL [10,11], which supports the plausibility of this interpretation.
From the inversion results, we calculated how much
elevation change would result from the decrease in
porosity. We consider the extreme case in which all of
the porosity decreases resulted in a lowering of the
topography (Fig. 4). The total change in elevation due
to the changes in porosity is approximately -1.7 km.
This is comparable to the observed relief of -1.6 km,
and also matches the shape of the observed depression.
Figure 3. A) Horizontal cross-sections of the density and
porosity models at 30 km depth, black line indicates where
the vertical cross section is taken. The black box is the location of Fig. 4. B) A vertical cross section of the models.
We next considered different porosity models
based on previous GRAIL analyses, assuming either
linear or exponential porosity profiles [11]. The linear
porosity profile uses a surface density of 2350 kg m-3, a
density gradient of 30 kg m-3 km-1, and a grain density
of 2917 kg m-3. The exponential porosity profiles use a
density contrast between fractured surface materials
and unfractured rock of 600 kg m-3, and a density increase depth scale of either 15 or 28 km.
2185.pdf
In the case of the linear porosity profile, integrating
the total loss of porosity throughout the crust would
result in surface subsidence by 1.8 km, which is greater
than the observed relief. The observed 1.6 km depression could result from the loss of all porosity below 1.4
km depth. For the exponential porosity profiles, the
total elevation change resulting from the loss of all
porosity would be 2.4 or 7.1 km for the two scale
depths. The observed depression could be produced by
the loss of all porosity below 5.2 or 37.3 km depth.
Figure 4. Total elevation change associated with changes in
porosity, zoomed in on the Compton-Belkovich area.
Conclusions: The results from the inverse modeling show a diffuse broad positive density anomaly under Compton-Belkovich, which we interpret to be at
least in part a result of thermal annealing of the pore
space. The predicted density contrast is equivalent to
the loss of 6% porosity in the lower crust relative to
surroundings. The predicted density anomalies and the
observed topographic relief are consistent with
GRAIL-derived porosity models.
The predicted
changes in porosity are upper bounds, since we have
not included the effects of high density KREEP-rich
intrusions within the crust. Similar annealing of the
pore space has been suggested beneath the Marius Hills
[12]. The magnitude and diffuse nature of the density
anomaly are inconsistent with the mantle uplift beneath
an ancient impact basin. We cannot, however, exclude
the possibility that an ancient impact may have been
responsible for the Th-anomaly in the first place, and
that the basin itself relaxed away. These results may
also have implications for the gravity and topography
of the Procellarum KREEP terrane.
References: [1] Lawrence D. J. et al. (1999) GRL, 26,
2681-2684. [2] Elphic R. C. et al. (2000) JGR, 105, 2033320345. [3] Lawrence D. J. et al. (2003) JGR, 108, 5102. [4]
Jolliff B. L. et al. (2011) Nature Geosci., 1212. [5] Smith D.
E. et al. (2010), GRL, 37, L18204. [6] Zuber M. T. et al
(2013) Science, 339, 668-671 [7] Jansen J. C. (2014) LPS
XLV Abstract #2730. [8] Li Y. and Oldenburg D. (1996)
Geophys., 6, 394-408. [9] Li Y. and Oldenburg D. (1998)
Geophys., 63, 109-119. [10] Wieczorek M. A. (2013) Science, 339, 671-674. [11] Besserer J. (2014) GRL, 41, 57715777. [12] Kiefer W. S. (2013) JGR 118, doi:10.1029/
2012JE004111.

© Copyright 2026