
LINEATIONS ON PATERAE AND MOUNTAINS ON IO
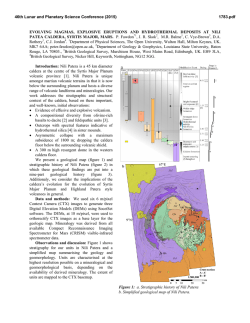
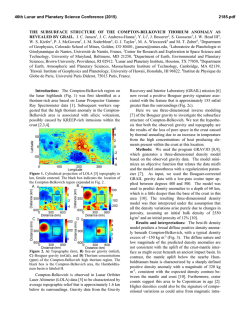
46th Lunar and Planetary Science Conference (2015)
2821.pdf
LINEATIONS ON PATERAE AND MOUNTAINS ON IO: IMPLICATIONS FOR INTERNAL STRESSES.
A. A. Ahern1, J. Radebaugh1, and E. H. Christiansen1, 1Brigham Young University, Department of Geological Sciences, Provo, UT 84602, [email protected].
Introduction: Io, the innermost of the Galilean
satellites, experiences great amounts of tidal stress,
which has enabled accumulation of vast stores of internal heat [1]. This has made Io the most volcanically
active object in the solar system [2] and has caused
differential heat dissipation that is likely the cause of
deformation in Io’s crust [3]. However, it is still unclear whether tectonics on Io are dominated by regional or global scale processes. Paterae and mountains are
widely distributed and among Io’s most important volcanic and tectonic features. Here we analyze lineations
on and dimensions of paterae and mountains to understand stress directions and the influences of regional
and global tectonics on the surface of Io.
Lineations on Mountains and Paterae: Paterae,
volcano-tectonic depressions, may form from a variety
of possible processes linked to volcanism and tectonism, similar to calderas on Earth [4]. One model
involves collapse due to the sublimation of abundant,
sulfur-rich frosts in the crust heated from the interior
[5]. Paterae are not always round or sub-round and
often have straight portions to their margins. In places,
these straight edges are adjacent to mountains or may
be associated with faults. This suggests some kind of
tectonic component involved in their formation and
evolution [4].
Mountains are isolated, uplifted, tilted blocks [6]
that seem to be associated with fractures and faults and
also contain lineations. The formation of mountains
may include deep thrust faulting and rotation of crustal
blocks due to compression from crustal recycling and
loading [7]. Some mountains appear to be influenced
by mass wasting, yet this does not apply to all features
of positive relief.
Lineations in this study refer to all straight patera
margins and other linear features, likely structural features such as faults and fractures formed by internal
crustal stresses, on the surface of Io. All lineations
have been traced in ArcGIS, using the Io global mosaic
image as a basemap, between 60°S and 60°N, mostly
at 1-2 km/pixel, after the map created by [8]. Some
paterae and mountains have multiple lineations
mapped on or around them while others have a single
lineation associated with them. We measured 252
patera edge lineations and 230 structural lineations.
This builds on the study by Radebaugh et al. [9], and
some lineations have been reclassified or reevaluated.
Patera edge lengths average 43 km, while the average
patera diameter (diameter of a circle having the same
area as a patera) is 41 km [4]. Structural lineations
average 123 km long, while the average mountain
length is 157 km [6].
Patera edge lineations
Structural lineations
Figure 1: Galileo image of Tvashtar Catena, a region with
adjacent mountains and paterae that display linear features
like those labeled as lineations in this study (traced in green).
Image is 300 km in width. From NASA Galileo.
The lineations are found at all azimuths, or orientations from north, however there are some trends. Most
lineations mapped in this study are oriented between 0°
and 90° (out of possible values up to 180°). Importantly, the orientations of patera edges and structural lineations differ from each other. In general, patera edges
have a mean azimuth of 38° (with a standard deviation,
SD of 22.4°). Structural lineations have an azimuth of
81° (with a SD of 38.9°) (Fig. 2a). The greater SD on
structural lineations reveals a larger spread in azimuth,
and thus the smaller values of individually binned data
seen in Fig. 2, than patera edge lineations. Azimuths
for both features are similar by type when divided into
sub and anti-Jovian hemispheres (Fig. 2b).
Discussion: These results suggest that stress patterns for paterae are different than those for mountains.
It has been suggested that mountains form along deep
thrust faults from horizontal compressional forces exerted on the crust as it is loaded by layer upon layer of
volcanic material [6]. This essentially shortens the effective radius of Io as a whole and causes horizontal
compression globally [4]. Paterae, however, may form
from vertical collapse or horizontal extension [3] rather
than shortening. Perhaps differences in local stress
fields result from magmatic upwellings and downwellings, enabling contraction and extension to occur
in Io’s crust [3,4,6].
46th Lunar and Planetary Science Conference (2015)
2821.pdf
A study by Bart et al. [10] reveals principal stress
directions NS near the equator transitioning from
oblique to EW at higher latitudes in some regions on
Io. Our results suggest that both classes of features
may be influenced by both north-south and east-west
stresses caused by tidal forces. Additionally, [10] suggest that non-synchronous rotation may cause additional stretching and relaxing of the lithosphere that
may play a part in the evolution and orientation of these features.
These studies can help us understand the forces required for the formation of paterae and mountains and
other structural features. Perhaps it will be possible to
determine a sequence of events that enables the formation of paterae and mountains adjacent to one another even if they have different formation mechanisms.
Conclusions: Azimuths of patera edges and structural lineations reveal the influence of regional tectonism on their formation. In addition, differences in
paterae edge azimuths and structural lineation azimuths reveal different forces, perhaps extensional vs
contractional, are responsible for the formation of the
different features. Further analyses of these features by
individual locations across Io, and comparison with
predicted tidal forces by [10], will help constrain the
forces required to form each feature.
References: [1] Peale, S.J., Cassen, P., and Reynolds, R.T. (1979) Science, 203, 892-894. [2] Davies,
A. et al. (2001) Astronomy and Geophysics, 42, 2.10.
[3] Tackley, P. (2001) Geochemistry, Geophysics, Geosystems, 3, 1-22. [4] Radebaugh, J. et al. (2001) JGR,
106, 33005. [5] Keszthelyi, L. et al. (2004) Icarus,
169, 271-286. [6]Schenk, P.M. et al (2001) JGR, 106,
33201. [7] Schenk, P.M. and Bulmer, M.H. (1998)
Science, 279, 1514-1517. [8] Williams et al. (2012).
[9] Radebaugh et al. (2011) LPS XLII, Abstract #2755.
[10]Bart, G.D. et al. (2004) Icarus 169, 111-126.
Figure 2a (top): Orientation diagram of lineations mapped in
this study. Blue petals indicate lineations associated with
patera edges (n=252) and green petals indicate structural
lineations (n=230). Figure 2b (bottom): Orientation diagram
of lineations grouped in sub and anti-Jovian hemispheres.
Green petals indicate patera edge lineations in the sub-Jovian
hemisphere (n=94) and orange indicate patera edge lineations
in the anti-Jovian hemisphere (n=158). Pink petals indicate
structural lineations in the sub-Jovian hemisphere (n=102)
and blue indicate structural lineations in the anti-Jovian hemisphere (n=128). Each bin represents 10°. Arrows of corresponding colors indicate mean azimuths.
© Copyright 2026