
The Heterogeneous Mantle Under South Pole
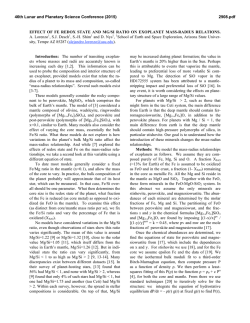
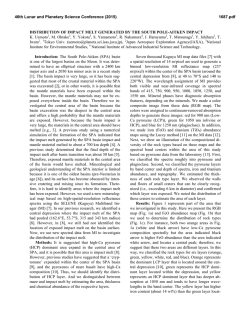
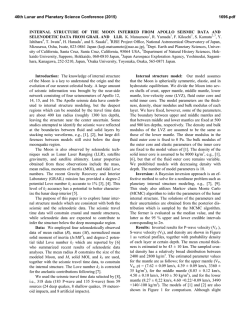
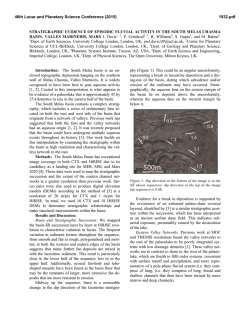
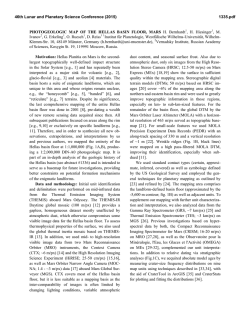
46th Lunar and Planetary Science Conference (2015)
1953.pdf
THE HETEROGENEOUS MANTLE UNDER SOUTH POLE-AITKEN BASIN AS CONSTRAINED BY
GRAIL AND LOLA OBSERVATIONS. Peter B. James1, David E. Smith2, Jordan D. Kendall3, Maria T. Zuber2,
Sean C. Solomon1, 1Lamont-Doherty Earth Observatory, Columbia University, Palisades, NY 10901
([email protected]). 2Department of Earth, Atmospheric and Planetary Sciences, Massachusetts Institute of
Technology, Cambridge, MA 02139. 3Department of Physics, Purdue University, West Lafayette, IN 47907.
Background: The South Pole-Aitken (SP-A) basin
is by far the largest preserved impact structure on the
Moon, with a major axis of 2400 km and a minor axis
of 2050 km [1]. Constraints on the structure of the
mantle under SP-A provide important information for
modeling the basin-forming impact event as well as the
subsequent chemical evolution of the lunar interior. In
particular, it has been suggested that a large oblique
impact may have produced up-range/down-range
asymmetry in the structure of mantle rebound [2].
Data from the Gravity Recovery and Interior Laboratory (GRAIL) mission [3] along with topographic
measurements from the Lunar Orbiter Laser Altimeter
(LOLA) [4] allow us to probe the mantle under SP-A.
Interpretation of the Moon’s deep structure is complicated by the inherent ambiguity associated with gravity/topography analyses; the gravity signal associated
with deep anomalies can be obscured by shallow
anomalies even at the longest wavelengths. A previous
forward modeling study yielded some mantle anomalies that approximately reproduce the Bouguer gravity
anomaly at SP-A [5], but at least some of the gravity
signal likely arises from crust-mantle interface relief.
In this analysis, we isolate the mantle gravity signature through a combination of spectral filtering and
best-fit determination. We perform an analysis of topography/geoid power and cross-power spectra to calculate the best-fit geoid-to-topography ratio (GTR)
associated with sub-crustal mass anomalies. We use
the GTRs to infer the characteristic depth of mass
anomalies in the mantle. We then determine the lateral
variations in the mantle under most of the SP-A basin
interior with a two-layered inversion.
Constraining the Mantle Anomaly Depth: Observed topography may be expressed as superpositions
of two or more components. In this study, we define Hc
to be the portion of topography corresponding to shallow compensation and Hd to be the remaining portion
broadly associated with deep-seated compensation
and/or elastic support. The power and cross-power
spectra of these topographic components may then be
related to the observed spectra:
! SHH
#
# SNN
# S
" HN
$ !
1
& #
2
GTR
c
&=#
& # GTR
c
% "
1
GTRd 2
GTRd
$ ! SHcHc
2
&#
2GTRcGTRd & # SHdHd
#
GTRc + GTRd & # SH H
c d
%"
$
& (1)
&
&
&%
where N is the geoid, and S denotes power, i.e., the
expected amplitude of the product in the subscript. If
GTRc (the GTR associated with Hc) is known a priori,
the system of equations has four unknowns: GTRd (the
GTR associated with Hd) and the three terms on the
right-hand side of equation (1).
If deep topography and crustal topography are uncorrelated (i.e., their cross-power spectrum SHcHd is
zero), GTRd may then be determined from the observed
power and cross-power spectra of topography and
gravity:
S − GTRc SHN
(2)
GTRd = NN
SHN − GTRc SHH
Coincidentally, this is the value of GTRd that minimizes the power of shallowly compensated topography, SHcHc. More generally, we can define a correlation
factor r = SH H SH H SH H and solve for the value of
c
d
c
c
d
d
GTRd associated with an arbitrary r. A negative value
of r indicates that thin crust is correlated with a deficit
of mass in the mantle, and vice versa.
Compensation Depth: The GTR associated with
dynamic compensation of topography as a function of
loading depth dm may be calculated as a spectrally
weighted sum of the dynamic admittance kernel Zl,
which is a function of spherical harmonic degree l:
lmax
lmax
l=3
l=3
GTRd = ∑ (Vl Zl ) / ∑ Vl
(3)
where Vl denotes the topographic power spectrum
[6,7]. We use the global lunar topographic power as an
approximation for the spectrum Vl within SP-A. GTRd
is an injective and non-surjective function of the compensation depth dm, so a limited range of GTRd values
inferred via equation (1) may be used to determine dm.
Results: In order to calculate power and crosspower spectra, we sampled topography and the geoid
on an icosahedral grid. Data points within a tapered
SP-A boundary were retained, and data inside Apollo
basin were excluded.
GTRs associated with deep compensation of topography are given in Table 1 along with the inferred
anomaly depth dm. A plot of geoid versus topography
is shown in Figure 1 along with the slopes for GTRc,
GTRd (for r = 0), and the observed GTR. We assumed
GTRc = 5 m/km, as this value provided a good fit to the
short-wavelength slopes in geoid/topography. The
value of GTRd can be larger or smaller than the ob-
46th Lunar and Planetary Science Conference (2015)
served GTR depending on the value of r. The assumption of zero correlation between Hc and Hd corresponds
to a depth dm ≅ 500 km. The anomaly depth varies
considerably for non-zero values of r, but a lower
bound on dm is better constrained than an upper bound.
1953.pdf
mantle anomaly (masked out in Figure 2). However,
the remaining mass anomalies do not appear to correlate strongly with impact basins. If it exists, any significant elastic support of topography likely results
from volcanic loading rather than impact processes.
Table 1 – Observed GTR and gravity/topography correlation
γ in SP-A, along with GTRd and dm inferred for several values of r.
r
Obs. GTR
GTRd
dm
γ
(m/km)
(m/km)
(km)
0.2
61.2
>1500
0.1
59.1
858
0
57.3
537
-0.1
55.6
435
-0.2
51.8
0.956
53.9
372
-0.3
52.3
325
-0.4
50.6
287
-0.5
48.7
254
Figure 2 – Mantle mass anomaly, tapered to the interior of
the SP-A basin (black ellipse with semi-major and semiminor axes) and spectrally filtered with a critical degree
lc=20. The Apollo basin is masked out.
Figure 1. Geoid height versus topography inside SP-A (excluding Apollo basin). The value of GTRc, observed best-fit
slope, and GTRd are represented by the slopes of the straight
lines. Colors indicate location within SP-A (see inset).
We use this anomaly depth dm to perform a twolayered inversion of gravity and topography. We tapered gravity and topography to the interior of the basin and applied a low-pass filter to the mantle anomaly
such that the power spectrum is proportional to l-2
above l=8. The mantle anomaly is plotted in Figure 2.
Whenever gravity and topography are used to infer
mantle anomalies, one must carefully consider the possibility of elastic support. Since certain configurations
of elastic loading produce GTRs comparable to those
of deep-seated dynamic topography, it can be easy for
one to masquerade as the other. In particular, the mascon at the Apollo basin is associated with an apparent
Conclusions: A considerable portion of the SPA basin interior appears to be associated with a positive mass anomaly in the mantle. The anomaly amplitudes shown in Figure 2 could be reproduced by ±50
km of relief on an interface with a 200 kg m-3 density
contrast, or alternatively by ±1% density variations
distributed over ~300 km depth. These amplitudes decrease if the inferred anomaly depth dm is shallower.
The mantle anomaly pattern is somewhat symmetric about the major axis of the basin and asymmetric
about the minor axis. The best-fit depth of the mantle
anomaly is ~500 km for r=0, but for a parameter range
of -0.5 < r < 0.2, the inferred value of GTRd may be
compatible with any depth dm greater than ~250 km.
This anomaly depth should be understood as a single
representative depth which, in reality, likely corresponds to the superposition of a variety of anomalies at
depths throughout the lunar mantle.
References: [1] Garrick-Bethell I. and Zuber M. T.
(2009) Icarus 204, 399-408. [2] Elbeshausen D. et al.
(2009) Icarus 204, 716-731. [3] Zuber M. T. et al.
(2013) Science 339, 668-671. [4] Smith D. E. et al.
(2010) Geophys. Res. Lett. 37, L18204. [5] Smith D. E.
et al. (2014) LPS 45, abstract 1956. [6] Hager B. H. et
al. (1985) Nature 313, 541-545. [7] Wieczorek M. A.
and Phillips R. J. (1997) J. Geophys. Res. 102, 10,93310,943.

© Copyright 2026