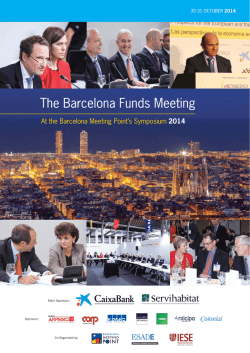
aquí DIGITAL STARTUP ECOSYSTEM OVERVIEW 2015
DIGITAL
STARTUP
ECOSYSTEM
OVERVIEW 2015
aquí
1 DIGITAL STARTUP ECOSYSTEM OVERVIEW 2015
Spanish Startup Ecosystem
Barcelona Digital Hub
Opportunity to foster the ecosystem
2 Spanish Startup Ecosystem
3 STARTUPS IN SPAIN
More than 20 years creating tech companies
NASDAQ index & founding date of Spanish startups
6.000
4.500
3.000
1.500
0
1996 1997 1998 1999 2000 2001 2002 2003 2004 2005 2006 2007 2008 2009 2010 2011 2012 2013 2014
.com crisis
Source: Novobrief, Vitamina K
economic crisis vs
growth mobile companies
4 STARTUPS IN SPAIN
Spain: The digital sector continues to grow
Digital sector to account for 3.1% of
Spain’s GDP in 2016, €34.9 billion
Telco-driven sector
2,638 startups +26%Year-on-Year (YoY)
3 main hubs:
Barcelona: 26% of all startups,+16% (YoY)
Madrid:
27%, +25% (YoY)
Valencia: 14%, +32% (YoY)
Source: Boston Consulting Group, McKinsey, Startupxplore
5 STARTUPS IN SPAIN
Talent in Spain: competitive workforce, hard to find
Number of developers
Average tech salary
San Francisco
San Francisco
New York
London
UK
Paris
Europe
Moscow
Ireland
Adam Sedó, PR
Manager Amazon
Spain: “Tech talent in
Spain is abundant,
but most
importantly
available”
Less expensive to build
companies
MADRID
Sweden
Istanbul
Germany
Berlin
France
Stockholm
Italy
Lisbon
Healthy developer density
BUT
Technical talent at big firms
Hard for startups to attract
that talent
Oslo
SPAIN
USD0
USD30000
USD60000
USD90000
USD120000
Source: AngelList
0 22.500
45.000
67.500
90.000
Source: Atomico, Stackoverflow
Lack of big nation-wide
success
6 STARTUPS IN SPAIN
Spain: attracting talent from abroad
Barcelona and Spain’s climate, lifestyle, talent pool, low cost structure and other
factures have helped it attract significant foreign talent (founders, employees
and investors)
Alex Puregger
(Fon)
Conor O’Connor
(Hot Hotels)
Marek Fodor
(Atrapalo, Kantox)
Sacha Michaud
(Glovo)
Philippe Gelis
(Kantox)
Mauricio Prieto
(eDreams)
Dominique Leca
(Stuart)
David Okuniev
(Typeform)
Ben Askew-Renaut
(Packlink)
Gustavo
GBrusilovsky
(BuyVIP)
7 2015, RECORD YEAR
€500m + raised by Spanish startups for the 1st time ever
Investment received by Spanish startups
600
Investment (m
€)
Steady growth in startups, exponential
growth in fundraising
2014 535
450
2015 Capital
raised
+29% (YoY)
+87% (YoY)
Deals
+10% (YoY)
+10% (YoY)
300
286
More quality and mature startups
222
150
122
135
149
Growth capital mostly provided by
international VC firms
More local talent available
0
2013
Source: Novobrief
2014
2015
8 MEGA ROUNDS
13 rounds bigger than €10m
2015 2014 2013 2X €10m+ rounds in 2015
vs. 2013 and 2014 combined
9 HEALTHY MIX OF INVESTOR TYPES
VCs and business angels as key ecosystem drivers
125%
Distribution of deals by investor type
(Q1-3 2015 vs. 2014)
100%
75%
15%
(17)
27%
(37)
50%
59%
(69)
25%
43%
(69)
0%
2014
Venture Capital
Corporation
Source: Venture Watch
Business Angel
Corporate VC
2015
BA Network
Crowdfunding
Public funding
Accelerator
10 WHERE DOES THE MONEY GO?
An ecommerce (or mobile classifieds) country
Top investment sectors 2013-15
(number of deals)
Sectors that have received most
investment volume 2013-15 (M€)
Ecommerce
Ecommerce
Marketing
Fintech
Lifestyle
eGovernance
Fintech
Security
Travel
Marketing
Communications
Communications
Education
Employment
Gaming
Gaming
Data
Data
Food
Lifestyle
0
Source: Venture Watch
17,5
35
52,5
70
€0
€100
€200
€300
€400
11 FOREIGN INVESTORS NOT ONLY COME FOR THE SUN
Growth capital mostly provided by international investors
In what type of rounds did foreign VCs participate in in 2015?
Most ever: 44 VCs
17% 35% 13% 19% Source: Novobrief
€1 to €5m €6 to €10m €11 to €15m €16 to €20m €20+m Fueling growth: 73% of all
capital invested in 2015
Only one round of €10m+
(Jobandtalent) with no
participation of foreign VCs
15% 12 FOREIGN CAPITAL: 3 MAIN SECTORS
International investors mostly invested in these
sectors
MOBILE MARKETPLACES
Wallapop, Letgo, Fever
Accel Partners
Fidelity Growth Partners
Europe
Northzone VC
14W
Insight VP
Naspers Limited
FINTECH
Kantox, Novicap,
peerTransfer, Digital Origin
Bain Capital
Spark Capital
Partech Ventures
IdInvest Partners
Techstars Ventures
Tekton Ventures
QED
Devonshire Investors
Accel Partners
‘PURE SOFTWARE’
CartoDB, Typeform,
Userzoom
Earlybird VC
Accel Partners
Index Ventures
Salesforce
PNC
RTA Ventures
TC Growth
Partners
StepStone Group
13 Barcelona Digital Hub
14 A DIGITAL HUB
Barcelona drives digital economy
10,700 ICT companies
73,000 employees
€14.5b in turnover (1/5 of Spain)
€214m in R&D
Barcelona startups:
Revenue: €6b
Workforce: 9,500
International activity: 60%
are active abroad
15 Source: Barcelona Activa (early 2015) & BCN Tech City survey
A DIGITAL HUB
Barcelona startup ecosystem
YOUNG:
4.8 years
MARKET:
41% B2B
26% B2C
33% B2B2C
SECTORS:
13% media
12% mobile
11% enterprise
6% marketing
INTERNATIONAL:
60% active outside
of Spain, in more
than 50 countries
FUNDING:
52% have received investment from
business angels
33% went through an accelerator
16 Source: BCN Tech City / Startupxplore
A DIGITAL HUB
Education + entrepreneurs + funding + public institutions/coworkings =
success
Education
Entrepreneurs
Funding
Accelerators
* Non representative
17 A DIGITAL HUB
Barcelona’s ecommerce & mobile economy
Most common type of startup in
Barcelona (as % of total market)
Ecommerce
Ecommerce
Marketing
Mobile
Enterprise
13.4%
6.2%
Marketing
Other
Travel
Travel
5.9%
Mobile
12.8%
Communications
Health
Consumer web
Media
Comms
5.7%
Education
Sports
Gaming
Enterprise
Health
10.8%
5.2%
Software
0,0%
3,5%
7,0%
10,5% 14,0% 17,5%
18 Source: Startupxplore
BARCELONA DOMINATES STARTUP INVESTMENTS
60% of all euros invested in 2015 went to Barcelona-based
startups*
€700
2015
2014
2013
2011
€525
324
€350
165
€175
20
€0
Barcelona*
Madrid
Valencia
19 Source: Webcapitalriesgo, Novobrief
* Barcelona and rest of Catalonia
BIGGEST ROUNDS IN BARCELONA
Explosive growth
Largest investment rounds in 2015 (€m)
€92
Letgo
€40
Wallapop
€264m invested in Barcelona
startups
€30
UserZoom
€15
Digital Origin
Hypergrowth: +96% (YoY)
€13
Typeform
92% of all capital invested inall of
Spain in 2014 (€285m)
Kantox €10
Softonic
€6
Deporvillage
€4
Loanbook
€3
Marfeel
€3
0
25
Source: Webcapitalriesgo, Novobrief
50
75
100
20 BARCELONA’S TOP SECTORS
Mobile classifieds, ecommerce & fintech
Startup sectors that attracted more investment in 2015
Wallapop, Letgo & other
ecommerce/classifieds startups
lead the way
13%
Enterprise technology represented
by UserZoom, Typeform, comes in
second
3%
10%
13%
61%
Fintech (payments - Digital Origin,
FX - Kantox) third
5 investment rounds of €1m+ for
health startups
Ecommerce
‘Pure software’
Source: Webcapitalriesgo, Novobrief
Fintech
Health
Other
21 INCREASING M&A ACTIVITY
Creating wealth through exits
Trovit!
Akamon!
La Nevera Roja*!
Founded in…!
2006!
2011!
2011!
Number of years
to exit!
8!
4!
3!
Selling price!
€80m!
€25!
€80m!
Rounds of funding!
1
(€150,000)!
3+
(€2.8m)!
3+
(€10m)!
€15m (2014)!
€2m
(€40m in reported
restaurant sales)!
Revenue in last
full fiscal year
before exit!
€17.5m (2013)!
EBITDA in same
period!
€6.2m!
€800K (profit)!
Undisclosed
(not profitable)!
Revenue multiple
paid by acquirer!
4.5X!
1.6X!
40X!
Employees!
92!
~ 100!
~ 40!
Stake (%) of
founders at time of
exit!
~ 90%!
~ 78%!
~ 30%!
Founder earnings!
€72m!
€19.5m!
€24m!
Investor earnings!
€8m (57X)!
€5.2m!
€48m!
SIGNIFICANT EXITS IN RECENT YEARS
Key to spark entrepreneurship, new
startups and redistribution of wealth
More than $155 million in exits in past
two years
Recent exits:
Trovit (Next Co): €80m
bodas.net (Weddingwire)
Akamon (Imperus): €25m
Icebergs (Pinterest)
Ducksboard (New Relic)
Nubera (Gartner)
22 Source: Novobrief
*Madrid-based
Room
Opportunity
for improvement
to foster the ecosystem
23 EUROPEAN CONTEXT
Low density of business angels
Density of business angels in Europe
Business angels per ,000 people
London
Helsinki
Paris
Zurich
Berlin
Brussels
Helsinki
London
Moscow
Amsterdam
Istanbul
Dublin
Amsterdam
Paris
BARCELONA
MADRID
Stockholm
168
Stockholm
161
Copenhagen
Berlin
Munich
Munich
Zurich
0.1
BARCELONA
Dublin
Oslo
Copenhagen
0.05
MADRID
Vienna
Vienna
Hamburg
Hamburg
Brussels
Moscow
Oslo
Istanbul
0
Source: Atomico / AngelList
625
1.250
1.875
2.500
0
0
0
0
1
24 EUROPEAN CONTEXT
Spain accounts for small fraction of EU exits & M&A value
M&A deals in Europe (Q1-3 2015)
7% of all EU deals
446 in EU:
Germany: 88
UK: 62
Israel: 50
Spain: 29
France: 28
7%
93%
6% of all M&A value (€8b)
Telco-driven
Rest of Europe
Spain
25 Source: tech.eu
EUROPEAN CONTEXT
Limited impact of Spain’s ‘Ley de emprendedores’
Spanish government approved in 2013 ‘Ley de emprendedores’, an entrepreneur-friendly
law to promote startups and the creation of new companies
Its impact has been very limited
Spanish entrepreneurs and investors continue to face significant challenges:
High taxes at the early stage for founders
Exit tax when expanding and changing residency to a non-EU country
Lack of stock option schemes due to high taxes
High taxes for business angels
26 Source: tech.eu
CONCLUSIONS
2015: A YEAR TO REMEMBER
Record investment numbers & notable exits
2015 was a record year for Spain and Barcelona on various fronts: for the first time
ever, Spanish technology companies received investment of more than €500 million,
fueled by the participation of a record number of international investors (44 VC firms)
and producing notable exits such as Trovit, La Nevera Roja or Akamon.
Worldwide category leaders
Startups such as Wallapop and Letgo -both based in Barcelona- have become category
leaders in the mobile classifieds sector, becoming the two most well funded startups
in the world to try to conquer the US market.
Scytl, born in 2002 and the most successful spin-off in the technology history of Spain,
has also consolidated its position as the leading eGovernment company in the world
and plans to IPO on the Nasdaq in 2017.
Things can, and should, get better
Investment per capita in Spain represents a small fraction compared to other European
countries, and so do the number of startup exits or business angels. This, coupled with
unfriendly laws for entrepreneurs and investors (exit tax, no stock options and high
taxation of business angels’ activity), pose a strong challenge for the development of
the country’s technology ecosystem.
27 THANK YOU
28 METHODOLOGY
All of the charts, tables and figures that are included in this report come from
publicly available sources.
Special thanks to:
29 30
© Copyright 2026
