
Passenger Transport Statistics. PTPT. January 2015. The number of
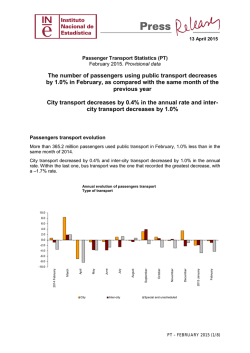
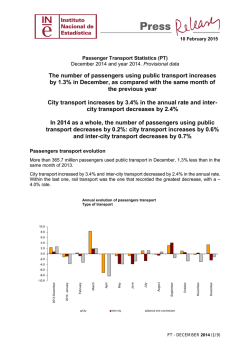
13 March 2015
Passenger Transport Statistics (PT)
January 2015. Provisional data
The number of passengers using public transport decreases
by 2.3% in January, as compared with the same month of the
previous year
City transport decreases by 2.0% in the annual rate and intercity transport decreases by 1.9%
Passengers transport evolution
More than 363.2 million passengers used public transport in January, 2.3% less than in the
same month of 2014.
City transport decreased by 2.0% and inter-city transport decreased by 1.9% in the annual
rate. Within the last one, bus transport was the one that recorded the greatest decrease, with
a –2.5% rate.
Annual evolution of passengers transport
Type of transport
10.0
8.0
6.0
4.0
2.0
0.0
-2.0
-4.0
-6.0
-8.0
City
Inter-city
2015 January
December
November
October
September
August
July
June
May
April
March
February
2014 January
-10.0
Special and unscheduled
PT – JANUARY 2015 (1/ 8)
Passengers transport annual evolution, by type of transport
City
Inter-city
2014 January
February
March
April
May
June
July
August
Septem ber
October
-1.1
0.4
8.4
-7.0
-0.8
-0.7
1.1
-0.2
3.1
1.1
-0.3
3.4
-2.0
November
December
2015 January
-1.3
-0.9
1.9
0.0
-3.7
-3.8
-2.6
-0.7
3.9
0.6
0.3
-2.3
-1.9
Special and
unschedule
-4.9
-3.2
2.0
-8.3
-3.8
-2.7
1.3
0.7
-1.5
-2.7
-3.0
-1.1
-4.8
Monthly rate evolution
The variation rate for the number of passengers on public transport in January 2015, as
compared with December, was –0.7%. In order to contribute to the analysis and interpretation
of data, the evolution of the monthly rate of public transport passengers in the last years has
been included in this rubric.
Evolution of the monthly rate
(month-on-month variation for January as compared with
December)
8.0
6.7
6.0
3.0
4.0
1.0
2.0
0.0
-2.0
-0.7
-1.2
-4.0
-6.0
2011
2012
2013
2014
2015
PT - JANUARY 2015 (2/8)
City transport
City transport was used by more than 225.7 million passengers in January, 2.0% more than in
the same month of 2014.
Metropolitan transport registered a decrease of 1.0% and bus transport did so by 2.7%.
Bus transport decreased in all cities except for Sevilla (2.0%). In turn, metropolitan transport
registered the greatest decrease in Valencia (–2.5%) and the greatest increase in Sevilla
(3.8%).
Annual rate of city transport passengers in cities with a Metropotitan
5.0
3.8
4.0
3.0
2.0
2.0
1.0
0.9
0.4
0.0
-1.0
-2.0
-1.7
-1.9
-2.1
-2.5
-3.0
-3.1
-4.0
-3.5
-4.1
-5.0
Barcelona
Bilbao
Madrid
Palma
Metropolitan
(1)
Sevilla
Valencia (1)
City bus
The publication of the city transport by bus in Valencia is not allowed
PT - JANUARY 2015 (3/8)
The number of passengers of bus transport decreased in all Autonomous Communities, except
for Andalucía (1.3%).
Extremadura (–8.3%), Principado de Asturias (–7.5%) and Castilla-La Mancha (–6.1%) were
those that registered the greatest decreases.
Annual rates of the number of passangers
City transport by bus
Extremadura
Asturias, Principado de
Castilla - La Mancha
Castilla y León
Madrid, Comunidad de
País Vasco
Murcia, Región de
-8.3
-7.5
-6.1
-5.3
-4.4
-4.3
-3.4
Galicia
-3.2
Cataluña
-3.1
Canarias
-2.8
NACIONAL
-2.7
Comunitat Valenciana
Aragón
Andalucía
-2.4
-1.3
1.3
(1)
In order to protect statistical secrecy, the passengers of the Autonomous Communities of Illes Balears, Cantabria, Comunidad
Foral de Navarra and La Rioja and of the Autonomous Cities of Ceuta and Melilla have been grouped
PT - JANUARY 2015 (4/8)
Inter-city transport
More than 99.2 million passengers used inter-city transport in January, indicating a 1.9%
decrease as compared with the same month of 2014.
Both bus transport (–2.5%) and rail transport (–1.4%) decreased, while air transport (2.8%)
increased.
Local distance passengers dropped by 2.7% for bus transport and 2.0% for rail transport.
Regional distance passengers decreased 2.1% for bus transport and 0.9% for rail transport.
Finally, long distance passengers decreased 0.8% for bus transport and increased 10.7% for
rail transport.
Annual rate of the number of passengers
Inter-city transport by type of transport and distance
10.7
12.0
10.0
8.0
6.0
4.0
2.0
0.0
-2.0
-4.0
-2.7
-0.8
-0.9
-2.0
-2.1
LOCAL
REGIONAL
Road
LONG-DISTANCE
Rail
Special and unscheduled transport
More than 38.2 million passengers used special and unscheduled transport in January,
indicating a decrease of 4.8% in the annual rate.
The number of special transport passengers decreased 5.9%, reaching more than 29.6 million
users. Within this, school transport decreased 6.3%, and work transport did so by 4.6%.
In turn, unscheduled transport decreased 0.8%, as compared with the same month of the
previous year, reaching more than 8.5 million passengers.
PT - JANUARY 2015 (5/8)
Passenger Transport Statistics
January 2015
Provisional data
1. Passenger transport
Passengers
transported
(thousands)
BY TYPE OF TRANSPORT
City transport
Inter-city transport
Special and unscheduled transport
363,263
225,737
99,249
38,277
% variation
Annual
Year-to-date
average
-2.3
-2.0
-1.9
-4.8
-2.3
-2.0
-1.9
-4.8
2. City transport
Passengers
transported
(thousands)
CITY TRANSPORT
Metropolitan
Bus(1)
(1)
225,737
92,120
133,617
% variation
Annual
-2.0
-1.0
-2.7
Year-to-date
average
-2.0
-1.0
-2.7
This includes trams and funiculars
PT - JANUARY 2015 (6/8)
2.1 City transport in cities with a Metropolitan
% variation
Annual
Passengers
transported
(thousands)
Barcelona
Bilbao
Madrid
Palma
Sevilla
Valencia
City bus
Metropolitan
City bus
Metropolitan
City bus
Metropolitan
City bus
Metropolitan
City bus
Metropolitan
City bus
Metropolitan
15,358
30,788
3,179
7,575
33,526
47,600
2,662
132
6,723
1,240
Year-to-date
average
-3.5
0.9
-3.1
-1.9
-4.1
-2.1
-1.7
0.4
2.0
3.8
-3.5
0.9
-3.1
-1.9
-4.1
-2.1
-1.7
0.4
2.0
3.8
(1)
(1)
(1)
4,785
-2.5
-2.5
(1) Publication thereof is not allowed
2.2 Urban transport by bus by Autonomous City and
Communiy
% variation
Annual
Passengers
transported
(thousands)
NATIONAL
Andalucía
Aragón
Asturias, Principado de
Balears, Illes
Canarias
Cantabria
Castilla y León
Castilla - La Mancha
Cataluña
Comunitat Valenciana
Extremadura
Galicia
Madrid, Comunidad de
Murcia, Región de
Navarra, Comunidad Foral de
País Vasco
Rioja, La
Ceuta
Melilla
133,617
18,230
9,934
2,639
Year-to-date
average
-2.7
1.3
-1.3
-7.5
-2.7
1.3
-1.3
-7.5
(1)
(1)
(1)
4,447
-2.8
-2.8
(1)
(1)
(1)
5,413
1,494
21,249
10,030
799
4,838
37,519
1,460
-5.3
-6.1
-3.1
-2.4
-8.3
-3.2
-4.4
-3.4
-5.3
-6.1
-3.1
-2.4
-8.3
-3.2
-4.4
-3.4
(1)
(1)
(1)
7,041
-4.3
-4.3
(1)
(1)
(1)
(1)
(1)
(1)
(1)
(1)
(1)
PT - JANUARY 2015 (7/8)
3. Inter-city transport
% variation
Passengers
transported
Annual
Year-to-date
(thousands)
average
99,249
-1.9
-1.9
50,864
-2.5
-2.5
34,749
-2.7
-2.7
15,005
-2.1
-2.1
1,110
-0.8
-0.8
45,958
-1.4
-1.4
41,685
-2.0
-2.0
2,153
-0.9
-0.9
2,121
10.7
10.7
1,918
2.8
2.8
510
1.6
1.6
INTER-CITY TRANSPORT
Road
Local
Regional
Long-distance
Rail(1)
Local rail
Regional rail
Long-distance rail
Air (domestic)
Sea (cabotage) (2)
(1)
(2)
Local and regional rail include all rail operators and Long-distance rail only includes RENFE
Estimated data
4. Special and unscheduled transport
SPECIAL AND UNSCHEDULED TRANSPORT
Special
School
Work
Unscheduled
For further information see INEbase - www.ine.es/en/
% variation
Passengers
transported
Annual
Year-to-date
(thousands)
average
38,277
-4.8
-4.8
29,690
-5.9
-5.9
22,291
-6.3
-6.3
7,399
-4.6
-4.6
8,587
-0.8
-0.8
All press releases at: www.ine.es/prensa/prensa_en.htm
Press Office: Telephone numbers: 91 583 93 63 / 94 08 – Fax: 91 583 90 87 - [email protected]
Information Area: Telephone number: 91 583 91 00 – Fax: 91 583 91 58 – www.ine.es/infoine
PT - JANUARY 2015 (8/8)


© Copyright 2026