
February 2015 - Consejo Nacional de la Industria Maquiladora
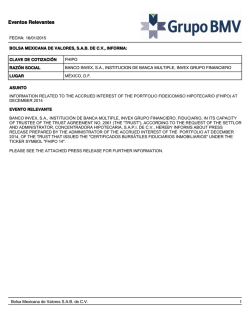
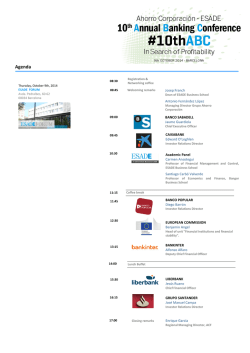
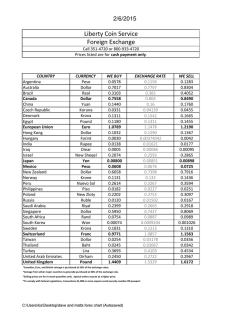
ECONOMIC REPORT
February 2015
Economic Analysis Banco BASE
2015 is not seen as a year of growth and recovery for most economies around the world. This is reaffirmed with the cutout to global economic growth
forecast by the IMF, placing it between 3.5% -3.7%. Eurozone is living political, economic and social issues that will determine the short and long
term future in the region. Japan, meanwhile, seems to be experiencing the first fruits of the fiscal and monetary policy implemented earlier, as Japan's
economy out of its recession phase. However, it is very rushed to assert that Japan's economy has recovered completely. With regard to China, the
economy continues to show signs of slowing, so the government tries to intervene through expansionary monetary policy tools in order to mobilize
and generate an impulse in the economy of the nation.
Meanwhile, the outlook for the US contrasts with the rest of the world, with data that demonstrate its economic recovery, although the most recent
data were not as positive as expected. And in the case of Mexico, external factors as the fall of oil prices and the global economic slowdown, have a
negative impact on the economic performance of the country, not just for this year but also for 2016. However, is necessary to wait to see how much
the growth in the United States will benefit the Mexican economy.
MACROECONOMIC ANALYSIS
The 2015 does not appear to be a promising year for most
economies around the world. The IMF cut its perspective for global
economic growth this year, placing it between 3.5% -3.7%, three
tenths lower than previously estimated. Only the growth prospects
for the US and Spain were improved, where the forecast for the first
increased by half a point to grow 3.6% in 2015, while Spain,
according to the IMF, will advance by 2.0%, three points more than
previously calculated. Therefore, this year will be characterized by
divergence in monetary policy for much of the world economies,
since, on the one hand, regions such as the Euro Zone and many
other countries have implemented expansionary monetary policy
measures, while the United States is heading towards a
normalization of monetary policy, causing changes in the direction
of capital flows in the world.
In the US, the last preliminary data of the growth of GDP for the
fourth quarter of 2014, showed an increase of 2.6% at an annualized
quarterly rate, pointing to a slight slowdown, but continues to
show further growth to much of the world economies. On the other
hand, January retail sales fell 0.8% from the previous month,
declining optimism about the growth of the US economy.
Regarding the labor sector, for the month of January, the
unemployment rate stood slightly higher than expected (5.7%), but
the nonfarm payroll increased by 257,000 new jobs, much higher
than the predicted figure, reflecting some recovery in the labor
market in the country. The publication of unfavorable economic
data on the US economy reduce the probability and expectation
that the Federal Reserve decides to raise interest rates in a forward
way, although this increase is imminent.
According to official figures, China's GDP in 2014 grew by 7.4%,
the lowest figure for 24 years. That is why the government
continues to implement measures that allow greater economic
dynamism, such as the decision of the Popular Bank of China to
lower the requirements in the level of reserves of commercial
banks, leading to greater liquidity in the market. However, the
country faces major economic and structural challenges such as a
declining industrial sector, a large debt that threatens its financial
system, a real estate sector that is becoming less dynamic, among
other challenges, which if not addressed directly will continue
undermining the recovery and development of the Chinese
economy.
Meanwhile, the Eurozone presents a complicated political and
economic landscape, which certainly impact the future
performance of the economy of the region. The economic down-
HIGHLIGHTS
2015 does not seem to be a promising year for most economies
around the world. With the exception of the United States, which
continues its path of economic recovery.
The imminent rise in the benchmark rate by the Fed will change the
direction of capital flows around the world, mainly affecting
emerging economies.
turn being experienced by the Euro Zone, reflected in the phase
of deflation experienced in the area (the figure for the month of
January was -0.60%), revealed the need for intervention by the
ECB. On January 22 the ECB approved the implementation of a
program to purchase bonds of sovereign debt, amounting to 60
billion euros monthly, the start date will be in March, ending,
tentatively, in September 2016, with the possibility of
continuation if necessary. This seeks to reinvigorate the stagnant
economy of the area, through greater liquidity. In addition, it will
cause adjustments in capital flows favoring emerging economies.
Within the political arena in Europe, after the victory of the leftist
Syriza in elections in Greece, who maintains a position against
austerity measures imposed by the ECB, has generated a serious
conflict between Greece and the rest of the nations of the
European Union. On the one hand, the ECB has made clear it
will not allow any negotiation of the country's debt by
eliminating an exemption on Greek bonds that allowed private
banks of Greece use these bonds as collateral for liquidity
provided by the ECB. And on the other hand, Greece has been
reluctant to accept the conditions stipulated by the ECB on
austerity measures, becoming more and more complicated to
reach some kind of agreement between Greece and other
Eurozone nations. With all this, the Eurozone experienced key
situations that will define the course that will take the region in
the near future.
Meanwhile, in Japan the actions of Prime Minister Shinzo Abe,
seem to be paying off, allowing the economy get out of the
recession phase, as indicated by the increase in manufacturing
output in December, with an annual increase of 0.3% and 0.1%
monthly. In addition, the unemployment rate fell to 3.5% in
November to 3.4% in December, its lowest level since 1997.
However, problems such as low inflation and weak demand
from consumers persist in the economy, limiting their complete
recovery, and will continue to be a challenge for the Japanese
government.
HIGHLIGHTS
The global manufacturing PMI rose by 0.2 points
compared to December, reaching 51.7 points.
In January, China recorded a PMI of 49.7 points, although
increased by 0.1 points compared to December, remains
in the contraction zone. Japan, meanwhile, grew by 0.2
points to 52.2 points.
The Eurozone showed an improvement compared to
December, reaching 52.2 points.
Fig. 1 Manufacturing PMI November-December
January
GLOBAL MANUFACTURING
UK
Japan
The present low inflation in the Euro Zone are a clear reflection of
the economic downturn being experienced by the region. In
January, the Eurozone recorded a monthly inflation of -0.6%,
continuing with the deflationary trend that it has been showing.
Germany, meanwhile, showed a variation in prices for the month of
Eurozone
Italy
48.4
49.9
Global
51.7
51.5
Ireland
55.1
Spain
54.7
53.8
53.5
55.1
US
China
56.9
49.7
49.6
Mexico
50.9
50.1
France
47.5
49.2
Source: Banco BASE with Markit Economics data.
Fig 2. Monthly inflation
4.0%
3.0%
2.0%
1.0%
0.0%
-1.0%
Eurozone
Italy
Germany
Spain
Jan-15
Nov-14
Jul-14
May-14
Mar-14
Jan-14
Nov-13
Sep-13
Jul-13
-2.0%
May-13
In January, the Eurozone manufacturing sector showed an
improvement over the previous month, as the PMI rose from 50.6
points in December to 51.0 points in January. The previous
behavior was due to three of the four largest economies in the
region experienced significant gains in the first month of the year.
France, registered in January an index of 49.2 points, which meant
an increase of 1.7 points compared to December. Meanwhile, Italy
saw an increase of 1.5 points from the previous month, reaching
49.9 points, close to leave the area contraction in manufacturing.
Likewise, Spain has shown a steady recovery since it went from
53.8 points in December to 54.7 points in January, resulting in
increased 0.9 points and staying within the area of expansion of the
manufacturing sector. However, the manufacturing industry in
Germany, the most important economy in the region, did not show
a favorable trend, as it experienced a decline 0.3 points, registering
50.9 points in January, but still positioned within the expansion
area.
Germany
Mar-13
In China, manufacturing showed an increase of 0.1 points in the
PMI in January, compared to the previous month, reaching 49.7
points. However, it is still within the area of contraction, so the
industry still does not show signs of recovery. Unlike the growth
observed in the previous indicator, the index published by HSBC
shows a negative behavior because in January the index recorded
49.8 points, 0.3 points below the score achieved in December.
However, both indicators show that the manufacturing sector is
stagnant and with an unfavorable performance. For its part, Japan
showed an improvement compared to December, with an increase
of 0.2 points reaching 52.2 points.
52.2
52.0
50.9
51.2
51.0
50.6
Jan-13
The Purchasing Managers Index (PMI) is an indicator that tells
us, in general, the state of the manufacturing sector globally and
by country. In January 2015, the global PMI stood at 51.7 points, 0.2
points higher than that recorded in the month of December. This
reflects that the manufacturing sector globally, showed some
improvement over the previous month.
Nov-12
1,
December
53.0
52.7
Sep-14
In Mexico, due to the sharp fall in oil prices worldwide, the
government decided to cut government spending by 0.7% to GDP,
which mainly affect current expenditure and infrastructure spending.
Furthermore, with regard to monetary policy, speculation about the
possible anticipation of Banxico to the increase of the benchmark rate
by the Fed continued, to cushion the negative effects of such action.
Although external and internal factors will limit growth in Mexico this
year and the following, according to the IMF, within Latin America,
Mexico is the country with the highest growth perspective for 2015,
because is expected that the US growth will boost the Mexican
economy. And although there are differences in growth forecasts for
the country, Banco BASE expects a growth rate of the GDP between
1.8% and 2.3% for 2015.
France
Source: Banco BASE with Bloomberg data.
December of -0.4%. In the case of France, according to specialists
negative monthly inflation of -0.1% is estimated, but the official
data will be published on Thursday, February 19. Likewise, Italy
and Spain showed signs of being in a period of deflation, with
negative price changes from the previous month of -0.6% and 1.4% respectively. Is necessary to wait to see if the stimulus
generated by the program to buy bonds of sovereign debt by the
ECB, offset the fall in oil prices, pushing up the price indices in
the region.
1. Indicator for the manufacturing sector based on indicators of new orders, inventory levels, production, supplier deliveries and employment. Levels above 50 indicate expansion
and contraction below 50.
MANUFACTURING IN UNITED STATES
2. PMI indicator published by the Institute of Supply Management for the United States.
40
35
Sep-14
Apr-14
Nov-13
Jan-13
Jun-13
Aug-12
Oct-11
Mar-12
May-11
Jul-10
Dec-10
Feb-10
Sep-09
Apr-09
Jun-08
Nov-08
Jan-08
30
Source: Banco BASE with Institute for Supply Management data.
55
55.5
46
52
49.5
52.5
38.5
35
44.5
42.5
45.5
51
56
54.1
57.7
56.5
70
65
60
55
50
45
40
35
30
57.8
52.9
Fig. 4 Manufacturing ISM by component
December
January
Source: Banco BASE with Institute for Supply Management data.
Fig. 5 Industrial Activity (Seasonally adjusted)
120
115
110
105
100
95
90
85
Total
Mining
Source: Banco BASE with INEGI data.
Construction
Manufacture
Dec-14
Aug-14
Apr-14
Dec-13
Aug-13
Apr-13
Dec-12
Aug-12
Apr-12
Dec-11
Aug-11
Apr-11
Dec-10
80
Aug-10
Industrial activity is a good indicator that allows knowing in
a timely and wide way, the behavior of the industrial sector
in the country. However, the Global Indicator of Economic
Activity (IGAE for its initials in Spanish) provides a broader
view of the overall economy because it is an indicator of the
45
Apr-10
Within manufacturing, the subsectors that showed the best
performance were the manufacture of clothing, paper
industry, manufacture of transport equipment and
manufacture of machinery and equipment. These last two
exhibited variations with respect to November of 11.57% and
11.41% respectively. On the other hand, the subsectors which
contracted in a more significant way were: tanning and
finishing of leather and fur and manufacture of leather, fur
and substitute materials; the chemical industry; manufacture
of textiles, except clothing; and manufacture of computer
equipment, communication, measurement and other
equipment, electronic components and accessories.
50
Dec-09
Analyzing each of the sectors that make up the country's
industry, manufacturing did not show a good performance
from the previous month, but not in relation to the same
month last year. The manufacturing sector suffered a monthly
reduction of 1.64%, while it experienced an annual increase of
4.22%. Another industries that showed great dynamism was
the construction, which exhibited an advance compared to
November of 1.05% and an annual growth of 5.86%.
55
Apr-09
The industrial sector is a very important component for
growth and economic development. The indicator of
industrial activity, is a good reference to see more clearly the
behavior of the sector over time. In December, the index of
industrial activity shrank by 0.27% over the previous month.
However, in its annual comparison, industrial activity grew
by 1.97%.
53.5
60
Aug-09
MANUFACTURING IN MEXICO
65
55.1
53.5
By examining the interior of the ISM manufacturing, almost
all of the components that conform it had reductions
compared to the previous month. New orders fell 4.9 points in
January, with an index of 52.9 points. While prices stood at 35
points, 3.5 points below its previous record. The production
suffered a contraction of 1.2 points, reaching 56.5 points.
Employment presented an index of 54.1 points, declining by
1.9 points compared to December. The fact that inventories
increased by 5.5 points, with an index of 51 points, and order
backlog shrank by 6.5 points, reaching 46 points in January,
reflecting the lack of dynamism that still suffers little domestic
demand, but due to the success of other indicators, it is
expected that this situation is reversed in the coming months.
Fig. 3 US Manufacturing PMI
Dec-08
The manufacturing ISM2 of US showed a significant decrease,
which was much higher than the one previously predicted. In
January the ISM stood at 53.5 points, while in December it
registered 55.1 points, which meant a reduction of 1.6 points,
when what was expected was a decrease of 0.4 points. But
despite the previous contraction, the US manufacturing sector
continues in the expansion zone, and with a score that exceeds
that of most countries around the world.
Fig. 6 Global Indicator of Economic Activity
(Seasonally Adjusted Series)
trend that the economic activity will show in the short term.
Nov-12
Dec-12
Jan-13
Feb-13
Mar-13
Apr-13
May-13
Jun-13
Jul-13
Aug-13
Sep-13
Oct-13
Nov-13
Dec-13
Jan-14
Feb-14
Mar-14
Apr-14
May-14
Jun-14
Jul-14
Aug-14
Sep-14
Oct-14
Nov-14
117
116
115
114
113
112
111
110
109
108
107
106
105
104
103
102
101
100
Total
Secondary Activities
Manufacture Industries
Source: Banco BASE with INEGI data.
Table 1. Growth of the main components of
manufacturing exports
Main components
December 2013-December 2014
Total manufacturing
November-December 2014
15.8%
industries
Metal products, machinery
17.7%
and equipment
Transport and
18.9%
communications
Automotive
18.6%
products
Machinery and
equipment for
21.7%
14.5%
electronic equipment
Source: Banco BASE with INEGI data.
Fig. 7 Annual change of manufacturing exports
18.0%
15.8%
16.0%
14.0%
11.8%
12.0%
10.0%
8.0%
6.0%
5.6%
2.0%
4.0% 1.2%
-1.5%
2.0%
11.2%
7.6%
7.1%
6.2%
6.8%
5.0% 4.3%
3.1%
2.0%
6.7%
5.8%
3.2%
9.2%
7.5%
4.7%
4.4%
4.0%
1.5%
-4.0%
Jan-13
Feb-13
Mar-13
Apr-13
May-13
Jun-13
Jul-13
Aug-13
Sep-13
Oct-13
Nov-13
Dec-13
Jan-14
Feb-14
Mar-14
Apr-14
May-14
Jun-14
Jul-14
Aug-14
Sep-14
Oct-14
Nov-14
Dec-14
0.0%
-2.0%
Furthermore, manufacturing exports experienced a great
dynamism in both monthly and annual comparison. In the
month of December, over the previous month, manufacturing
exports grew by 8.85%, while in relation to December of the
previous year increased by 15.84%. The most important
subsector of manufacturing, the metal products, machinery and
equipment, showed a monthly increase 6.63% and an annual
growth of 17.65%. Also within this category, machinery and
special equipment for various industries experienced monthly
and annually advances, these being of 23.56% and 21.73%
respectively. Equipment and electrical and electronic
equipment, likewise, showed a positive trend, rising by 12.69%
monthly and 14.48% annually. Transport and communications,
which accounted for 41.36% of exports of metal products,
machinery and equipment in December, fell by 4.55%, but
compared to the same month last year, increased by 18.88%.
Within transport and communications, automotive products
(representing 94.59% of these exports) had a monthly negative
change of 4.99%, but increased by 18.6% annually.
In January, the Manufacturing IMEF3 indicator experienced an
increase of 0.9 points compared to December, reaching 50.9
points. This improvement was due to virtually all components
of the index showed gains from the previous month. The only
component that showed a decline compared to December was
the delivery of products which contracted by 2.9 points from
50.9 points in December to 48.0 points in January.
diverse industries
Electrical and
In November, the IGAE of the economic activity corresponding
to manufacturing industries showed a monthly increase of
0.71%, while in its annual comparison experienced an increase
of 5.31%. By making a comparison with the behavior shown by
secondary activities in general, and the economy as a whole, the
first had a monthly variation of 0.23% and an annual growth of
2.39%. Meanwhile, the overall economy, according to IGAE,
exhibited in November an increase of 0.49% over the previous
month and an annual growth of 2.46%. It can be seen that the
dynamism experienced in manufacturing is higher than its
corresponding sector (secondary activities) as well as the total
economy. This also reflected in the index numbers, because in
the month of November, the index for the total economy was
114.04 points, for the secondary activities was 106.69 points,
whereas for manufacturing the IGAE stood at 115.88 points.
Manufacture IMEF Indicator 2014
December
January
50.0
50.9
Total
50.4
52.4
New orders
50.9
54.8
Production
46.9
48.5
Employment
50.9
Product delivery
Inventories
Fuente:
Banco BASE con información del IMEF.49.4
48.0
50.5
Source: Banco BASE with IMEF data.
Source: Banco BASE with INEGI data.
3. Indicador basado en el entorno económico que ayuda a anticipar la dirección de la actividad manufacturera y no manufacturera. Niveles sobre 50 indican expansión e inferiores
contracción.
IMMEX ANALISYS
The manufacturing sector represented in the IMMEX program (Manufacturing, Maquiladora and Export Services),
continues to experience a great dynamism, as shown in the growth of manufacturing exports, which recorded an
annual growth of 15.8% in December. Moreover, the revenues of the establishments belonging to this program
reached a total of 288,763,085 million pesos, where 59.1% of these revenues is comprised of revenues from foreign
market, and 40.9% comes from the domestic market.
Labor positions and manufacturing orders are an indicator of the current business situation and give an idea of the
orientation of the decisions they are taking, as companies usually link an increase in employment to increases in the
required production.
In November 7,133 job positions in relation to October were added, which meant a monthly growth of 0.32% and an annual
increase of 6.49%. From the above, it follows that companies plan to continue expanding its production, so continued increasing
workforce. This was reflected in the indicator of manufacturing orders, which stood at 52.6 points in January, ranking above
the average of 52.3 points it has maintained since January 2014.
Fig. 9 New Manufacturing Orders Index
INEGI
Fig. 8 Total Ocuppied Personnel IMMEX
60.0
58.0
56.0
54.0
52.0
50.0
48.0
46.0
44.0
42.0
40.0
IMMEX INDICATORS
States
Number of Active
Establishments
Annual
Total
%Change
Total Compensation
Real Wages and Salaries
Total**
Annual
%Change
Total
Annual
%Change
Employed Personnel
Total**
Annual
%Change
Outsourced Personnel
Total**
Annual
%Change
Aguascalientes
83
5.06%
664,770
24.35%
9,105
-1.64%
48,639
10.04%
3,549
-40.89%
Baja California
893
-1.87%
3,132,177
12.47%
7,803
-1.72%
275,614
8.78%
15,729
4.60%
Coahuila
383
-3.04%
2,202,685
9.46%
8,964
-2.03%
230,089
6.74%
70,724
5.25%
Chihuahua
478
-1.65%
3,182,124
8.43%
6,950
-1.29%
315,343
6.59%
51,995
19.27%
Distrito Federal
108
-6.09%
629,754
15.17%
12,721
16.28%
43,121
-5.96%
11,195
-14.90%
Durango
61
-4.69%
252,951
36.10%
5,115
-7.57%
37,203
20.88%
7,841
-20.83%
Guanajuato
259
19.35%
728,351
25.89%
6,905
2.80%
109,506
15.98%
42,300
10.64%
Jalisco
284
-4.38%
1,103,140
22.72%
10,010
11.63%
109,942
2.25%
35,604
-11.06%
10,877
-1.50%
133,244
3.08%
44,538
2.34%
Mexico
297
-0.34%
1,482,005
6.00%
Nuevo Leon
644
-0.77%
2,519,632
8.43%
9,361
-0.92%
250,403
4.25%
81,177
-0.03%
Puebla
187
-2.60%
1,145,295
8.35%
10,414
-1.19%
76,651
6.27%
18,483
-2.22%
Queretaro
215
2.38%
789,752
19.85%
9,198
-3.52%
80,921
13.38%
26,913
3.01%
San Luis Potosi
148
7.25%
548,732
12.58%
7,980
-2.77%
65,542
10.73%
21,933
6.78%
Sonora
220
-3.93%
1,198,041
3.13%
7,714
-1.54%
115,643
1.63%
16,810
0.53%
Tamaulipas
355
-0.56%
2,129,761
15.06%
7,320
-0.11%
192,972
8.39%
16,303
-8.53%
Veracruz
4.52%
13,793
0.97%
20,611
5.28%
6,243
7.12%
61
5.17%
125,548
Yucatan
68
-4.23%
1,013,764
2.24%
4,303
-3.22%
20,310
-4.60%
1,194
-55.43%
Otras
262
-1.87%
275,129
10.24%
6,919
-2.70%
128,017
3.29%
34,349
1.44%
YoY Changes.
Data updated to November 2014.
Jan-15
Sep-14
May-14
Jan-14
Sep-13
May-13
Jan-13
Sep-12
May-12
Jan-12
Sep-11
May-11
Jan-11
Sep-10
May-10
52.6
Jan-10
Nov-14
Jul-14
Nov-13
Jul-13
Mar-13
Jul-12
Nov-12
Mar-12
Jul-11
Nov-11
Mar-11
Nov-10
Jul-10
Mar-10
Nov-09
Mar-14
2,253,771
2,300,000
2,200,000
2,100,000
2,000,000
1,900,000
1,800,000
1,700,000
1,600,000
1,500,000
INDUSTRIAL ACTIVITY BY STATE AND
SECTOR
Figure 1. States with higher share of manufacturing in total GDP in 2013
According to the more recent data, corresponding to the
third quarter of 2014, the national manufacturing output
was located at 2,304,292.31 million pesos, accounting for
16.70% of total national GDP.
On the other hand, analyzing the inside of gross domestic
product of each of the states of the Mexican Republic,
entities that occupied the top ten positions in relation to
the proportion which its industrial production
represented the state GDP in 2013 were the following:
Coahuila (40.04%), Aguascalientes (30.25%), Hidalgo
(30.07%), Tlaxcala (29.42%), Guanajuato (27.73%),
Querétaro (26.82%), San Luis Potosí (26.45%), Nuevo León
(24.30%), Estado de México (23.80%) and Puebla (22.27%)
(Table 2).
In the following sections will be analyzed in detail the
evolution and performance of industrial activity in
manufacturing, that for the first five entities according to
previous ranking. This will be done using the indicator of
industrial activity by state (available in INEGI), with the
latest information (until October 2014).
Table 2. Percentage share of manufacturing industries to the state GDP
in 2013
State
Contribution of manufacturing to the
state GDP
Coahuila
40.04%
Aguascalientes
30.25%
Hidalgo
30.07%
Tlaxcala
29.42%
Guanajuato
27.73%
Querétaro
26.82%
San Luis Potosí
26.45%
Nuevo León
24.30%
Estado de México
23.80%
Puebla
22.27%
Source: Banco BASE with INEGI data.
Table 3. Performance of industrial manufacturing activity in Coahuila
September-October 2014
October 2013-October 2014
31-33 Sector: Manufacturing Industries (original series)
Industrial Activity
11.97%
-1.79%
31-33 Sector: Manufacturing Industries (seasonally adjusted series)
-0.11%
-1.52%
Source: Banco BASE with INEGI data.
160
140
140
120
120
100
100
80
80
60
60
40
40
20
20
0
0
Oct-08
Feb-09
Jun-09
Oct-09
Feb-10
Jun-10
Oct-10
Feb-11
Jun-11
Oct-11
Feb-12
Jun-12
Oct-12
Feb-13
Jun-13
Oct-13
Feb-14
Jun-14
Oct-14
Coahuila
160
Seasonally adjusted series
Source: Banco BASE with INEGI data.
Trend-cycle
Industrial activity in the manufacturing sector in the state
had not an entirely favorable performance in October 2014,
which is below the average experienced in 2014 (with
available until October). Except for the monthly
comparison of original numbers, where it had an aboveaverage performance in the year.
Manufacturing grew 11.97% monthly, but decreased its
activity by 1.79% annually, according to the original
figures of the indicator of industrial activity in the state.
While the average change in industrial activity so far this
year was found in 2.89% monthly and 8.26% annual.
Furthermore, as regards the seasonally adjusted series,
manufacturing state showed a monthly reduction of 0.11%
(standing below average of 0.34%), and an annual
contraction of 1.52% (in this case, positioning well below
the average 8.22% so far this year).
State Industrial Activity
Figure 1. Industrial activity in the manufacturing industries to
October 2014
Table 4. Performance of industrial manufacturing activity in Aguascalientes
Industrial Activity
September-October 2014
October 2013-October 2014
31-33 Sector: Manufacturing Industries (original series)
14.43%
25.15%
31-33 Sector: Manufacturing Industries (seasonally adjusted series)
1.52%
23.99%
Oct-08
Feb-09
Jun-09
Oct-09
Feb-10
Jun-10
Oct-10
Feb-11
Jun-11
Oct-11
Feb-12
Jun-12
Oct-12
Feb-13
Jun-13
Oct-13
Feb-14
Jun-14
Oct-14
Figure 1. . Industrial activity in the manufacturing industries
The manufacturing sector in the state of Aguascalientes
to October 2014
showed positive figures in both monthly and annual
180
180
comparison, though most below average in 2014.
160
160
In original figures, industrial manufacturing activity in the 140
140
state, compared to the previous month grew by 14.43%,
120
120
showing an average of 6.29% so far this year. While in
100
relation to October of the previous year experienced an 100
80
increase of 25.15%, although positive, is below 28.43% 80
averaged from January to October of the same year. On the 60
60
other hand, analyzing the seasonally adjusted series, the 40
40
manufacturing sector also showed an increase of 1.52% in
20
20
the monthly comparison (in this case, the average so far
0
0
this year stands at 2.30%) and an increase of 23.99%
annually , which is also below the 27.92% averaged.in the
year
State Industrial Activity
Aguascalientes
Source: Banco BASE with INEGI data.
Seasonally adjusted series
Trend-cycle
Source: Banco BASE with INEGI data.
Table 5. Performance of industrial manufacturing activity in Hidalgo
Industrial Activity
September-October 2014
October 2013-October 2014
31-33 Sector: Manufacturing Industries (original series)
0.71%
6.85%
31-33 Sector: Manufacturing Industries (seasonally adjusted series)
-1.40%
7.67%
Source: Banco BASE with INEGI data.
120
100
100
80
80
60
60
40
40
20
20
0
0
Oct-08
Feb-09
Jun-09
Oct-09
Feb-10
Jun-10
Oct-10
Feb-11
Jun-11
Oct-11
Feb-12
Jun-12
Oct-12
Feb-13
Jun-13
Oct-13
Feb-14
Jun-14
Oct-14
Hidalgo
120
Seasonally adjusted series
Source: Banco BASE with INEGI data.
Trend-cycle
In the state of Hidalgo, the manufacturing sector had
generally performed above the average recorded during
2014, except for the monthly growth rate in seasonally
adjusted figures, which showed lower performance to that
experienced so far this year.
In original figures, in October the manufacturing sector
had an increase of 0.71% compared to September, ranking
above average experienced in the year (-0.54%). As
compared to the same month last year, reported a much
higher than average (1.16%) growth, this being 6.85%.
Moreover, in seasonally adjusted terms, manufacturing
improved its performance compared to September last
year, an increase of 7.67%, ranking above the 1.19%
averaged over the year. Meanwhile than monthly suffered
a contraction of 1.40% (with an average of -0.12% so far this
year).
State Industrial Activity
Figura 1. Industrial activity in the manufacturing industries to
October 2014
Table 6. Performance of industrial manufacturing activity in Tlaxcala
Industrial Activity
September-October 2014
October 2013-October 2014
31-33 Sector: Manufacturing Industries (original series)
8.50%
15.88%
31-33 Sector: Manufacturing Industries (seasonally adjusted series)
1.52%
15.95%
Figure 1. Industrial activity in the manufacturing industries to
October 2014
140
140
Considering the original figures provided by INEGI, in its
monthly comparison, industrial activity showed an
increase of 8.50%, reflecting an improvement over the
2.46% averaged over the year, while compared to
September last year grew by 15.88%, remains well above
average (-1.17%). Taking the analysis to the seasonally
adjusted series, the manufacturing sector expanded state
of Tlaxcala 1.52% per month, showing a slight advance
compared to 1.12% averaged over the year. However, in its
annual variation, the sector increased to 15.95%, much
higher variation than the -1.19% averaged so far this year.
120
120
100
100
80
80
60
60
40
40
20
20
0
0
Oct-08
Feb-09
Jun-09
Oct-09
Feb-10
Jun-10
Oct-10
Feb-11
Jun-11
Oct-11
Feb-12
Jun-12
Oct-12
Feb-13
Jun-13
Oct-13
Feb-14
Jun-14
Oct-14
Manufacturing in the state of Tlaxcala showed great
dynamism in both monthly and annual comparison, in
both series (original and seasonally adjusted).
State Industrial Activity
Tlaxcala
Source: Banco BASE with INEGI data.
Seasonally adjusted series
Trend-cycle
Source: Banco BASE with INEGI data.
Table 7. Performance of industrial manufacturing activity in Guanajuato
Industrial Activity
September-October 2014
October 2013-October 2014
31-33 Sector: Manufacturing Industries (original series)
10.54%
19.59%
31-33 Sector: Manufacturing Industries (seasonally adjusted series)
4.88%
19.45%
Source: Banco BASE with INEGI data.
160
140
140
120
120
100
100
80
80
60
60
40
40
20
20
0
0
Oct-08
Feb-09
Jun-09
Oct-09
Feb-10
Jun-10
Oct-10
Feb-11
Jun-11
Oct-11
Feb-12
Jun-12
Oct-12
Feb-13
Jun-13
Oct-13
Feb-14
Jun-14
Oct-14
Guanajuato
160
Source: Banco BASE with INEGI data.
Seasonally adjusted series
Trend-cycle
As in the state of Tlaxcala, the manufacturing sector in
Guanajuato showed a favorable performance both in its
annual comparison, as compared to October last year.
In original figures, industrial activity in this entity in
October showed a 10.54% increase compared to
September, ranking above the 3.91% averaged over the
year. Moreover, in its annual comparison the sector had a
breakthrough, as it recorded a growth rate of 19.59%,
which is above the average so far this year (13.12%). Also,
taking as a basis of the analysis the seasonally adjusted
series, the state’s manufacturing sector showed a monthly
increase of 4.88%, ranking above average performance in
the year (2.15%). While in its annual industry comparison
showed growth of 19.45%, also still above the 13.23%
averaged over the year.
State Industrial Activity
Tabla 1. Industrial activity in the manufacturing industries to
October 2014
Moreover, within the manufacturing industry sub-sectors
that contributed with the largest share of total
manufacturing production in the third quarter of 2014 were
(Table 8): food industry (20.37%), manufacture of transport
equipment (18.17%), chemical industry (11.56%), basic
metal industries (6.87%), beverages and snuff industries
(5.40%), manufacture of products based on nonmetallic
minerals (4.94%), manufacture of computer and
communications equipment, measurement and other
equipment, electronic components and accessories (4.47%),
manufacture of machinery and equipment (4.10%),
manufacture of products derived from petroleum and coal
(3.41%) and manufacture of metal products (3.41%).
Industrial activity in the above sectors showed varied
performances among themselves because, while some
experienced advances in November, others had setbacks in
this performance (Cuadro X). In the monthly comparison,
the subsector that had a higher growth rate in the group of
sub-sectors which contributed a larger share of the national
total manufacturing output in the third quarter of 2014 was
the manufacture of metal products, with a monthly
increase 2.54%.
The subsector that registered the worst performance was
manufacturing products based on nonmetallic minerals,
with a decrease of 1.32% in the same period. While metal
products manufacturing subsector was again with the
greatest advance in November from the same month last
year, the manufacture of products derived from petroleum
and coal was the category with the most significant
contraction of the group.
Figure 2. Subsectors with greater share of total national
manufacturing GDP in the third quarter of 2014
Subsector
332
3%
Subsector
324
4%
Subsector
311
20%
Otros
17%
Subsector
333
4%
Subsector
336
18%
Subsector
334
5%
Subsector
327
5%
Subsector
325
12%
Subsector
331
7%
Subsector
312
5%
Source: Banco BASE with INEGI data.
Table 8. Participation by subsector in the national total
manufacturing GDP in the third quarter of 2014
Proportion of the
national
manufacturing
output
Subsector
311 Food industry
20.37%
336 Manufacture of transport equipment
18.17%
325 Chemical industry
11.56%
331 Basic metal industries
6.87%
312 Beverages and snuff industries
5.40%
327 Manufacture of products based on
nonmetallic minerals
4.94%
334 Manufacture of computer,
communication, measurement and other
equipment, electronic components and
accessories
333 Manufacture of machinery and
equipment
4.47%
4.10%
324 Manufacture of products derived from
petroleum and coal
3.41%
332 Manufacture of metal products
3.41%
Source: Banco BASE with INEGI data.
Table 9. Monthly and annual performance of the main subsectors of the national manufacturing industry
Subsector
311 Food industry
336 Manufacture of transport equipment
325 Chemical industry
331 Basic metal industries
312 Beverages and snuff industries
327 Manufacture of products based on nonmetallic minerals
334 Manufacture of computer, communication, measurement and other
equipment, electronic components and accessories
333 Manufacture of machinery and equipment
324 Manufacture of products derived from petroleum and coal
332 Manufacture of metal products
Source: Banco BASE with INEGI data.
October-November 2014
November 2013-November 2014
-0.20%
0.78%
1.29%
0.53%
-1.12%
-1.32%
-0.53%
12.45%
3.48%
8.05%
2.59%
4.59%
0.67%
13.94%
2.14%
0.78%
2.54%
-2.06%
-2.13%
16.16%
FOREIGN EXCHANGE RATE
FX Forecast (Pesos per Dollar)
The first weeks of February were characterized by a
deterioration of the factors that have led to a depreciation of
the peso against the dollar to levels not seen since March
2009. The determinants remain the same since the second
half of 2014.
First Quarter 2015
$14.73
Second Quarter 2015
$15.00
Third Quarter 2015
$15.13
Fourth Quarter 2015
$14.40
First are the positions of divergent monetary policy from the
Federal Reserve and major central banks around the world,
which increases the risk of macroeconomic adjustments of
capital once the Fed starts to normalize interest rates,
exerting pressure on exchange rate parities against the
dollar. Also arose again the possibility that Greece fall into
debt default, to open negotiations with other countries of the
Eurozone to change the terms of its bailout. Although it is
unlikely,
a Greek exit from the Eurozone would
demonstrate the vulnerability of the monetary union,
raising risk aversion and positions in favor of the dollar
again.
FX Forecast (Pesos per Euro)
Finally, the Mexican peso was also affected by a breakdown
of sentiment about Mexico, derived from the drop in oil
prices in recent months that forced a cut in the budget of
expenditures of the Federal Government. In the short term
it is expected that the official growth forecasts for 2015 are
revised downward.
$16.87
Second Quarter 2015
$16.80
Third Quarter 2015
$17.10
Fourth Quarter 2015
$16.42
FX Forecast (Dollar per Euro)
First Quarter 2015
$1.1450
Second Quarter 2015
$1.1200
Third Quarter 2015
$1.1300
Fourth Quarter 2015
$1.1400
With data available at February 16, 2015.
Fig. 18 Performance of major currencies in the foreign
exchange market against the Mexican peso in February
New Zealand Dollar
Other factors have also enabled the exchange rate reaching
levels not seen since 2009 in the very short term. As seasonal
factor, liquidity in the foreign exchange market has
remained low, increasing the volatility of the peso-dollar
parity at levels of September 2013. Additionally the
positions in the foreign exchange market have shifted in
favor of the dollar to several currencies, including the
Mexican peso, according to CFTC data.
2.74%
Canadian Dollar
1.72%
Norwegian Krone
1.58%
British Pound
1.56%
Euro
0.03%
Danish Krone
0.01%
Taiwanese Dollar
So far in February, the exchange rate has accumulated a
depreciation of 0.34% or 5.09 cents, trading around 14.92
pesos per dollar, with an annualized volatility of 14.41%. For
the month, the exchange rate has traded between 14.6339
and 15.1560 pesos per dollar, a level not seen since March 12,
2009. At that time the quotation rose to 15.1947 pesos per
dollar, having reached a historical high of 15.5892 pesos per
dollar three days earlier. In the short term, it is expected that
the exchange rate will continue to show high volatility, with
the probability of placed back above 15.00 pesos per dollar.
15.30
15.20
15.10
15.00
14.90
14.80
14.70
14.60
14.50
14.40
14.30
14.20
First Quarter 2015
-0.07%
Australian Dollar
-0.34%
United States Dollar
-0.40%
South African Rand
-0.48%
Singapore Dollar
-0.61%
South Korean Won
-1.18%
Japanese Yen
-1.21%
Swiss Franc
-1.63%
Norwegian Krone
Brazilian Real
-2.02%
-5.73%
With data available at February 16, 2015.
1.26
PESOS PER DOLLAR
DOLLAR PER EURO
1.24
1.22
1.20
1.18
1.16
1.14
1.12
16-Feb
10-Feb
4-Feb
SMA 20 Days
29-Jan
23-Jan
17-Jan
11-Jan
SMA 10 Days
5-Jan
30-Dec
18-Dec
24-Dec
SMA 5 Days
1.10
12-Dec
16-Feb
10-Feb
4-Feb
29-Jan
SMA 20 Days
23-Jan
17-Jan
11-Jan
SMA 10 Days
5-Jan
30-Dec
24-Dec
18-Dec
12-Dec
SMA 5 Days
Macroeconomics Indicators Mexico
Quaterly GPD Growth Rate
Period
Actual (%)
Period
Actual (%)
30/09/2014
2.20
Annual Change Vehicle Production (%)
31/01/2015
6.83
Annual Inflation Rate
31/01/2015
3.07
Annual Change Vehicle Exports (%)
31/01/2015
15.16
Monthly Inflation Rate
31/01/2015
-0.09
IMEF Manuf. Index
31/01/2015
50.4
-0.03
Monthly Public Finances Balance (Bil. MXN)
30/09/2014
-58.63
2.0
Annual Change in Remittances (%)
31/12/2014
18.80
Core Inflation Rate
31/01/2015
Annual Change IGAE (Global Economic Indicators)
30/11/2014
Annual Change Industrial Production
30/11/2014
1.8
Export Oil Mix Price (dpb)
13/02/2015
49.97
Unemployment Rate (General)
31/12/2014
3.76
International Reserves Balance (Bil. USD)
06/02/2015
195,807
Unemployment Rate (Male)
31/12/2014
3.81
EMBI+ (bp)
15/12/2010
218
3.67
Monthly Trade Balance (Mill. USD)
31/12/2014
254
Unemployment Rate (Female)
31/12/2014
Monetary Policy (Banxico Overnight Rate)
16/02/2015
3.00
Annual Change Exports (%)
31/12/2014
6.39
Discount Rate Cetes 28 Days Primary Auction
10/02/2015
2.78
Annual Change Imports (%)
31/12/2014
11.23
Annual Change Gross Fixed Investment
30/11/2014
4.7
Quarterly Current Account Balance (Mill. USD)
30/09/2014
-2702.3
1.2
Consumer Confidence
31/01/2015
91.1
3.30
Quarterly Foreign Direct Investment
30/09/2014
3,110
Period
Actual (%)
Annual Change Retail Sales
30/11/2014
Equilibrium Interbank Interest Rate 28 Days (TIIE)
16/02/2015
Indicadores Macroeconómicos de EU
Period
Quarterly GDP Growth Rate
Annual Inflation Rate
Monthly Inflation Rate
Change in Producer Prices
30/12/2014
31/12/2014
31/12/2014
31/12/2014
Actual (%)
2.60
Public Finances Balance (Bill. USD)
31/01/2015
-17.54
0.80
ISM Manuf. Index
31/01/2015
53.50
1.60
Empire Manufacturing
31/01/2015
9.95
-1.10
Richmond Fed Manuf. Index
31/01/2014
6.00
Annual Change Industrial Production
31/12/2014
-0.11
Dallas Fed Manuf. Index
31/01/2015
-4.40
Unemployment Rate
31/01/2015
5.70
Philadelphia Fed Manuf. Index
31/01/2015
6.30
Fed's Monetary Policy (Benchmark Rate)
13/02/2015
0.25
Trade Balance (Bill. USD)
31/12/2014
-46.56
Annual Change Retail Sales
31/01/2015
-0.80
Annual Change Exports (%)
31/12/2014
1.08
Change in Durable Goods Orders
31/12/2014
-3.30
Annual Change Imports (%)
31/12/2014
4.89
Change in Leading Indicators
31/12/2014
0.50
Current Account Balance (Bill. USD)
30/09/2014
-100.26
Change in Factory Orders
31/12/2014
-3.40
Quarterly Foreign Direct Investment
31/01/2015
102.90
Change in Wholesale Inventories
31/12/2014
0.10
Chicago Purchasing Manager Index
31/01/2015
59.40
Gabriela Siller Pagaza, PhD
Directora de Análisis EconómicoFinanciero
Banco BASE, [email protected]
Lic. Paulina Núñez
Directora de Asuntos
Corporativos y Operaciones
INDEX
El presente documento ha sido elaborado por Banco Base para fines EXCLUSIVAMENTE
INFORMATIVOS y basado en información y datos de fuentes consideradas como fidedignas. Sin
embargo, Banco Base NO asume responsabilidad alguna por cualquier interpretación, decisión y/o uso
que cualquier tercero realice con base en la información aquí presentada. La presente información
pretende ser exclusivamente una herramienta de apoyo y en ningún momento deberá ser utilizada por
ningún tercero para fines políticos, partidistas y/o cualquier otro fin análogo.
El reporte refleja exclusivamente el punto de vista de los analistas responsables de su elaboración, los
cuales no percibieron compensación alguna de personas distintas a Banco Base.
© Copyright 2026