
Characterization of Lunar Crust Mineralogy with M
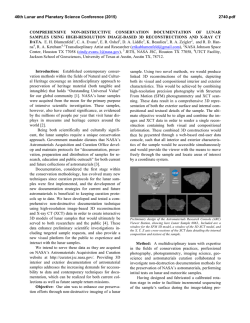
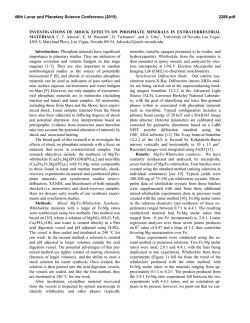
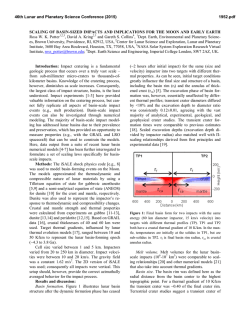
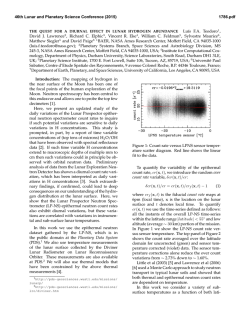
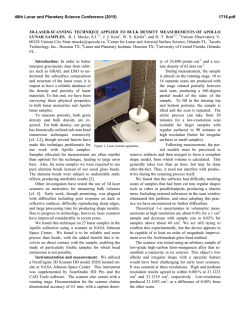
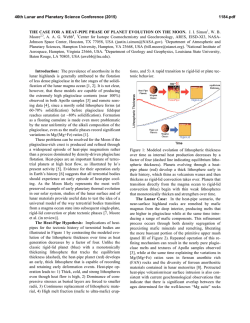
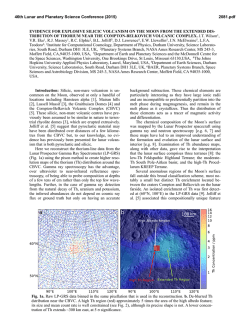
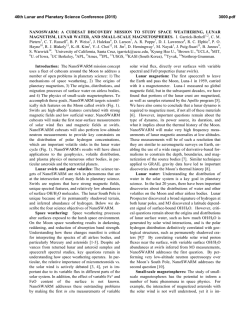
46th Lunar and Planetary Science Conference (2015)
2941.pdf
CHARACTERIZATION OF LUNAR CRUST MINERALOGY WITH M3 DATA. Y. Sun1 and L. Li1, 1Indiana
University- Purdue University at Indianapolis, Indiana, USA ([email protected]).
Introduction: Analysis of the lunar samples returned
by the Apollo and Luna missions (1969-1976) indicates the
presence of compositional heterogeneity in the lunar crust
[1]. However, the exact details of lunar crustal structure
and evolution remain contentious because of the limited
representativity of the returned lunar samples. Recently
aquired global, high-spatial resolution hyperspectral Moon
Mineralogy Mapper (M3) images provide a new
opportunity to examine compositional trends across the
entire Moon. Using M3 images, a systematic screening of
lunar crater central peaks was conducted to investigate the
mineral composition of the lunar crust with the ultimate
goal of addressing its evolution.
In this study, 166 lunar craters were selected from 1559
lunar craters listed in the USGS crater database. This
selection is based on crater diameter, DEM data and M3
data availability in order to assure that the examined craters
have the undisturbed central peaks and expose deep
pristine materials from the lunar crust or upper mantle. The
selected craters (Fig. 1) are ~35.1 km to ~199.5 km in
diameter (d), and have excavation depth (D) ranging from
~5.05 km to ~33.21 km based on D=0.109*d1.08[2].
Dataset and Method: M3 L2 images of 166 craters
were downloaded from the NASA PDS website. These
images at a spatial resolution of 140 m and spectral
resolutions of 20-40 nm were geometrically corrected and
smoothed for noise reduction. For the geometric
correction, the original reflectance images were warped
based on latitude and longitude values of each pixel. For
the noise reduction, pixels with negative reflectance values
or within shadow were eliminated, and the spectra were
smoothed using a moving window average method. After
spectral smoothing, 72 bands in the spectral range 5402537 nm were retained for further analysis.
Fig. 1 Location of examined central peaks overlaid on a LOLA
DEM of the Moon. Solid stars represent relative depth (D/T) and
filling fringe colors show identified minerals in this study. Black
dash lines describe three distinct lunar terranes.
Continuum removal was applied to each image
spectrum to isolate mineral diagnostic absorption features
from the spectral continuum. Based on the diagnostic
absorption feature of common lunar minerals (Mg-spinel
[Sp] ~ 2 µm, Olivine [Ol] ~ 1.05 µm, Crystalline
plagioclase [Pl] ~ 1.25 µm, Orthopyroxene [Opx] < 0.95
µm, ~2 µm, Clinopyroxene [Cpx] > 0.95 µm, ~ 2 µm), we
created a set of criteria for determining the presence of
these minerals. The presence of each mineral was
identified with absorption depth of 0.05 as a lower limit
and using 0.02 as upper limit to eliminate other minerals.
In order to reduce the uncertainties induced by the
imperfect thermal removal as well as illumination
differences due to local topography, multi-temporal M3
images were processed and analyzed for each crater to
ensure the reliability of the mineral detection. On the basis
of previous mineral spectral mixing experiments [e.g. 5, 6],
pyroxene (Py) is a spectrally dominating mineral in
mineral mixtures and delectable even at 10%, but other
minerals must have relatively high abundance to be
detectable. Therefore, the pixels showing debatable
minerals are expected to be relatively pure except those for
pyroxene (Py). A quantitative analysis was conducted to
assess the likelihood for the presence of each mineral in the
investigated central peaks. The minimum number of pixels
(NP) was used for Sp, Ol and Pl, and the number of craters
(NC) for Py. Note that the minimum NP is a conservative
and relative estimate for the presence of minerals
considering detection inconsistency among multi-temporal
images. While NC can be used to compare the importance
of Cpx relative to Opx, it is not applicable for comparison
between Py and other minerals.
The ratio of excavation depth (D) to crustal thickness
(T) was used to describe the vertical variation of
mineralogy in the lunar crust. Based on the crustal
thickness (T) derived from Gravity Recovery and Interior
Laboratory (GRAIL), all the investigated crater central
peaks were determined to originate from lunar crust except
for Petavius and Humboldt.
Results and Discussion: Among the 166 investigated
craters, 41 of them are Sp-bearing [7], 15 Ol-bearing [8],
20 Pl-bearing and 151 Py-bearing (Fig. 1). This
compositional variability is first compared among different
terranes without considering the origin depth of the peaks.
As shown in Fig. 2A, PKT shows higher likelihood for the
presence of each mineral considered here than both FHT
and SPAT; FHT has higher likelihood in the presence of
Ol, Pl and Cpx than SPAT, but the likelihood for Opx is
the same for FHT and SPAT. The high likelihood of PKT
46th Lunar and Planetary Science Conference (2015)
for the presence of mafic minerals was also shown in the
global iron map of [9]. More Cpx-bearing central peaks are
determined in FHT than SPAT, implying the FHT is Carich as compared with SPAT. It is worth to note that in
SPAT, no Ol-bearing central peaks were identified; more
Opx were detected than Cpx, indicating that the major
composition of the upper mantle might be Opx instead of
Ol. This is in agreement with results from cratering
simulation [10] and seismic studies of the lunar upper
mantle [11].
When the origin depth of crater central peak is factored
into the analysis of mineral composition in the lunar crust,
the global investigation reported here suggests a ‘new’
three-layer model (Fig. 2B, Fig. 3). The uppermost layer
(D/T<0.3) within a depth range less than 10 km, mainly
consists of ferroan anorthosite and Mg-spinel anorthosite
in addition to norite and gabbro. PKT has the highest
likelihood for the presence for Sp, Ol and Py. FHT contains
Pl, Sp, Py and sparse Ol (NP=0.25%). In SPAT, only Py
and sparse Sp could exist. While the content of Py is shown
to be higher, the crater peaks showing the detected Py most
likely represents the mixture of a large proportion of
plagioclase and a small proportion of Py because the way
for assessing Py differs from that for other minerals.
The middle layer (0.3<D/T<0.6) ranging from ~10 to
~20 km, is rich in most of the common minerals except Pl.
Within this layer, PKT exhibits high likelihood for the
presence of mafic materials and Sp. In contrast, FHT and
SPAT show a lower possibility of the presence for all the
minerals than PKT. In particular, SPAT doesn’t show the
presence of Ol and Sp. Pl is equally detected in all three
terranes within this depth range, but the likelihood of the
presence is relatively low compared to the deeper layer.
These observations indicate that the post-magma ocean
magmatisms were more frequent within in the middle layer
of the PKT lunar crust, which is consistent with the
observations made for lunar thorium [12].
The lowermost layer (D/T>0.6) including lower crust
and a part of crust-mantle interface, has been detected to
have the largest amount of Pl (nearly pure ferroan
anorthosite). Pl has been identified in both FHT and PKT
but not in SPA. The SPA basin was confirmed to excavate
the lunar upper mantle [10] and most of the lunar crust in
SPA may be removed in the basin formation process, thus
the observation to SPA may represent the compositions of
the upper mantle rather than the lower crust. Based on our
observation, we could speculate a global anorthositic layer
exist in the lowermost crust. This layer may retain the
original crustal composition produced by the Lunar
Magma Ocean. In contrast, the middle and uppermost
layers have been heavily modified by secondary
magmatisms and impact cratering.
Consdiering the mineral variation within the entire
lunar crust, Pl increases with depth and Ol and Sp are
2941.pdf
clustered in the middle layer. Py decreases with depth in
PKT; Cpx decreases with depth in FHT, but is more
abundant in the middle layer of SPAT; more Opx is
detected in the middle layer than the other two layes for
FHT and SPAT. These results lead to the following
conclusions. First, a global pristine anorthositic layer may
exist in the lower crust. Second, most of the secondary
magmatisms should occur in the middle crustal layer
underneath PKT. While Py also shows a compositional
trend with depth, the variation could be an artifact due to
the variation of crater population with depth. This should
be taken into account in the future study. To validate this
‘new’ three-layer model, additional regions (e.g. basins,
crater wall and ejecta) and datasets (e.g. LRO, Diviner)
need to be analyzed.
References: [1] Heiken G. et al. (1991) Lunar
Sourcebook, Cambridge Press. [2] Cintala M. J. and R.
Grieve (1998) Meteoritics & Planet. Sci., 33, 889-912. [3]
Clark R. N. et al. (2011) JGR, 116(E6). [4] Besse S. et al.
(2013) Icarus, 222(1), 229-242. [5] Crown, D. A. and
Pieters C. M. (1987) Icarus 72, 492-506. [6] Cloutis E. A.
et al. (1986) JGR, 91, 641-653. [7] Sun Y. et al. (2013) LPS
XLIV, Abstract #1393. [8] Sun Y. and Li L. (2014) LPS
XLV, Abstract #1653. [9] Lucey P. et al. (1995) Science
268, 1150. [10] Melosh H. J. et al. (2014) LPS XLV,
Abstract #2505. [11] Khan, A., et al. (2006) JGR, 111(E5).
[12] Warren P. H. et al. (2001) GRL, 28(13) 2565-2568.
Fig. 2 The likelihood for the presence of identified minerals in three
terranes with respect to horizontal (A) and vertical (B) dimension
of the lunar crust. NPSp+NPOl+NPPl= 1 for detected Sp, Ol and Pl
and NCCpx+NCOpx=1 for detected Cpx and Opx. The relative depth
measured by D/T of central peaks is shown in the vertical axis.
Fig. 3 Schematic cross section of the lunar crust
© Copyright 2026