
Chapter 8. Assessment Methodology
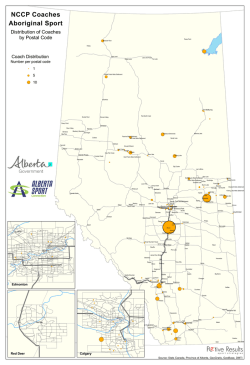
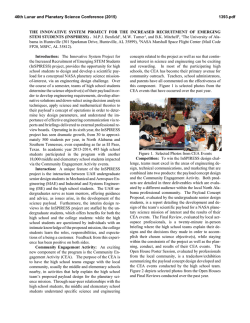
8.
EFFECTS ASSESSMENT METHODOLOGY
8.1
OBJECTIVES
The Harper Creek Project (the Project) is subject to both provincial and federal environmental
assessment (EA) requirements and is undergoing a coordinated review in accordance with the
regulatory process described in Chapter 2, Assessment Process. The coordinated EA process
facilitates an integrated assessment for the identification and evaluation of potential adverse
environmental, social, economic, heritage, and health effects that may result from the physical
components and activities of the Project.
This chapter of the Application for an Environmental Assessment Certificate/Environmental Impact
Statement (Application/EIS) describes the methodology used to identify and assess the potential effects
of the Project, including any cumulative effects. The content included in this chapter is intended to:
•
provide a general description of how baseline information was integrated into the
Application/EIS;
•
describe the methodology for the selection of valued components (VCs) to be assessed for
potential adverse effects;
•
describe the methodology used to evaluate the potential effects on VCs as a result of the
Project; and
•
describe the methodology used to evaluate the potential cumulative effects on VCs as a result of
the interaction between the Project and other projects and activities in the vicinity of the Project.
8.2
ASSESSMENT FRAMEWORK
The methodology outlined in this chapter provides a structured framework that is consistently
applied to all assessment topics. The methodology follows recommended federal and provincial
guidelines and legislated requirements, pursuant to the BC Environmental Assessment Act (2002) and
the Canadian Environmental Assessment Act (1992).1 The following guidance documents were
referenced when developing the assessment methodology:
•
Environmental Assessment Office User Guide (BC EAO 2011);
•
Reference Guide: Determining Whether a Project is Likely to Cause Significant Adverse
Environmental Effects (CEA Agency 1994b);
•
Assessing Environmental Effects on Physical and Cultural Heritage Resources (CEA Agency 1996);
1 In July 2012, the Canadian Environmental Assessment Act (1992) was repealed and replaced by the Canadian Environmental Assessment
Act, 2012 (2012). Under transitional provisions in the Canadian Environmental Assessment Act, 2012, comprehensive studies initiated
after the Canadian Environmental Assessment Act (1992) was amended in July 2010 are to be completed as if the former act had not
been repealed.
HARPER CREEK MINING CORPORATION
8-1
APPLICATION FOR AN ENVIRONMENTAL ASSESSMENT CERTIFICATE / ENVIRONMENTAL IMPACT STATEMENT
•
Cumulative Effects Assessment Practitioners Guide (Hegmann et al. 1999);
•
Reference Guide: Addressing Cumulative Environmental Effects (CEA Agency 1994a); and
•
Operational Policy Statement: Assessing Cumulative Environmental Effects under the Canadian
Environmental Assessment Act, 2012 (CEA Agency 2013).
The detailed methods for the assessment of effects on the selected VCs are provided in the relevant
chapters within the Application/EIS; Section 8.4.1 of this chapter describes the process for selecting
the VCs.
Each chapter of the effects assessment considers the following four steps of the assessment
methodology (Figure 8.2-1).
Step 1: Scoping
•
Ensuring the effects assessment satisfies regulatory requirements for each assessment subject
area.
•
Selecting VCs with the greatest potential to interact with the proposed Project.
•
Using consultation feedback to scope the effects assessment to issues and VCs of greatest
concern.
•
Identifying and describing appropriate components to assess each VC.
•
Selecting appropriate assessment boundaries (temporal, spatial, administrative and
technical) for each VC.
Step 2: Baseline Conditions
•
Describing the environmental setting or baseline conditions relevant to each VC, including
the regional and historical context of the Project Site and assessment subject area.
Step 3: Effects Assessment
•
Analyzing the key effects on each VC using a risk-based impact matrix approach.
•
Describing proposed mitigation measures for key effects, including management and
monitoring plans, and/or follow-up programs.
•
Characterizing residual effects.
•
Evaluating the probability or likelihood of residual effects occurring.
•
Determining the significance of residual effects.
•
Evaluating the uncertainty or confidence in the assessment conclusions.
Step 4: Cumulative Effects Assessment (CEA)
•
8-2
Identification of past, present and reasonably foreseeable future projects and activities that
have the potential to interact cumulatively with the Project.
ERM Rescan | PROJ #0230881 | REV E.1 | JANUARY 2015
Figure 8.2-1
Effects Assessment Methodology
Step 1: Scoping
• Ensuring the effects assessment satisfies regulatory requirements for each assessment subject area;
• Selecting valued components (VCs) with the greatest potential to interact with the proposed Project;
• Using consultation feedback to scope the effects assessment to issues and VCs of greatest concern;
• Identifying and describing appropriate components to assess each VC; and
• Selecting appropriate assessment boundaries (temporal, spatial, administrative and technical) for each VC.
Step 2: Baseline Conditions
• Describing the environmental setting or baseline conditions relevant to each VC, including the regional
and historical context of the Project area and assessment subject area.
Step 3: Effects Assessment
• Analyzing the key effects on each VC using a risk-based impact matrix approach;
• Describing proposed mitigation measures for key effects, including management and monitoring plans,
and/or follow-up programs;
• Characterizing residual effects;
• Evaluating the probability or likelihood of residual effects occurring;
• Determining the significance of residual effects; and
• Evaluating the uncertainty or confidence in the assessment conclusions.
Step 4: Cumulative Effects Assessment (CEA)
• Identification of past, present and reasonably foreseeable future projects and activities
that have the potential to interact cumulatively with the Project;
• Identification of key cumulative effects, including consultation feedback that was used to guide the CEA;
• Description of proposed mitigation measures for cumulative residual effects;
• Characterization of cumulative residual effects;
• Evaluation of the probability or likelihood of cumulative residual effects occurring;
• Determination of the significance of cumulative residual effects; and
• Evaluation of the uncertainty or confidence on the cumulative effects assessment conclusions.
HARPER CREEK MINING CORPORATION
Proj # 0230881-0002 | Graphics # HAR-0002-001
APPLICATION FOR AN ENVIRONMENTAL ASSESSMENT CERTIFICATE / ENVIRONMENTAL IMPACT STATEMENT
•
Identification of key cumulative effects, including consultation feedback that was used to
guide the CEA.
•
Description of proposed mitigation measures for cumulative residual effects.
•
Characterization of cumulative residual effects.
•
Evaluation of the probability or likelihood of cumulative residual effects occurring.
•
Determination of the significance of cumulative residual effects.
•
Evaluation of the uncertainty or confidence in the CEA conclusions.
8.3
REGULATORY CONTEXT
Each assessment chapter includes a separate description of the regulatory framework and regulatory
requirements for each assessment topic. This includes laws, regulations, decrees, treaties and other
instruments or declarations of relevance. In addition, the chapters discuss other plans and guidelines
of importance to the Project or regional area, including jurisdictional policies. These include:
•
Kamloops Land and Resource Management Plan (Kamloops Interagency Management
Committee 1995);
•
District of Clearwater Official Community Plan (District of Clearwater 2012); and
•
North Thompson Economic Development Strategic Plan 2005-2010 (Westcoast CED
Consulting Ltd. 2005).
8.4
SCOPING THE EFFECTS ASSESSMENT
Scoping is designed to ensure that the Application/EIS focuses on the issues with the greatest
potential to cause significant adverse effects on the selected VCs. Each effects assessment chapter
includes a description of the issues scoping process used to identify the VCs selected for assessment,
including the indicators used to evaluate the effects, and the rationale for their selection.
The chapters also describe the process used to select the assessment boundaries and the rationale for
selecting those boundaries.
8.4.1
Valued Components
The BC EAO and CEA Agency define VCs as components “that are considered important by the
proponent, public, First Nations, scientists and government agencies involved in the assessment
process” (BC EAO 2013). To be included in the EA, there must be a perceived likelihood that the VC
will be affected by the proposed Project.
8.4.1.1
Consultation Feedback on Valued Components
A preliminary list of proposed VCs was drafted early in project planning based on the expected
physical works and activities of the reviewable project, type of project being proposed, local area
and regions where the proposed project would be located, and consultation with federal, provincial,
and local agencies.
8-4
ERM Rescan | PROJ #0230881 | REV E.1 | JANUARY 2015
EFFECTS ASSESSMENT METHODOLOGY
Each assessment chapter includes a summary of how scoping feedback was incorporated into the
selection of assessment subject areas and VCs using the table format below (Table 8.4-1).
Table 8.4-1. Consultation Feedback on Proposed Valued Component(s)
Feedback by*
Subject Area
AG
G
P/S
O
Issues Raised
Proponent Response
VC1
VC2
VC3
*AG = Aboriginal Group; G = Government; P/S = Public/Stakeholder; O = Other.
8.4.1.2
Selecting Valued Components
VCs proposed for assessment were scoped into the EA and identified in the Application Information
Requirements (AIR; Yellowhead Mining Inc. 2011) and Background Information (CEA Agency 2011)
documents. Additional scoping was undertaken in 2014 to finalize the VCs selected for assessment.
Each effects assessment chapter includes a description of the issues scoping process used to identify
the VCs selected for assessment and the rationale for their selection or exclusion. The process for
selecting VCs considers the following three criteria.
1. Potential Interactions due to Spatial and Temporal Overlap of VCs with the Project
The Project components and activities associated with each phase of the Project are screened to
identify potential interactions with proposed VCs. The list of key Project components and activities
per phase has been developed from the Project’s Technical Report and Feasibility Study (Merit 2014).
The identification of potential interactions is based on issues or concerns raised to date during the
EA process and through consultation activities (refer to Chapter 3, Information Distribution and
Consultation), scientific knowledge, past experience on other mining projects (particularly in the
interior of BC) and professional judgment. The preliminary evaluation of interactions will allow the
assessment to scope in the VCs most likely to be affected. Appendix 8-A summarizes the VCs with
the potential to interact with the Project.
The proposed VCs are then reviewed to ensure the assessment focuses on the most important
components. Candidate VCs are screened for redundancy so that if multiple candidate VCs are
affected in similar ways, one VC that is considered appropriate, relevant, and adequate to act as a
proxy, is selected.
2. Legislative or Regulatory Requirement or Government Management Priority
In each effects assessment chapter, the candidate VCs are evaluated to identify if:
•
a legally binding government requirement exists to protect the component; and
•
the component reflects a government management priority.
HARPER CREEK MINING CORPORATION
8-5
APPLICATION FOR AN ENVIRONMENTAL ASSESSMENT CERTIFICATE / ENVIRONMENTAL IMPACT STATEMENT
3. Availability of Adequate Data and Analytical Tools to Measure a Project related Effect on the VC
The potential effects of the Project on the VC must be measurable so that change in the condition of a
VC can be detected.
Specific rationale for why each subject area and VC was selected is included in the relevant
assessment chapter of this Application/EIS.
8.4.1.3
Valued Components Selected for Assessment
The proposed VCs that were selected for assessment for the Project are summarized in Table 8.4-2.
The VCs are grouped into the five assessment pillars: environment, social, economic, heritage,
and health.
Each of the effects assessment chapters will describe the VCs which are assessed within that chapter.
Effects of the Project on VCs that have the potential to affect Aboriginal groups’ interests and rights
are addressed in Chapter 23.
8.4.2
Defining Assessment Boundaries
Assessment boundaries define the maximum limit within which the effects assessment and
supporting studies (e.g., predictive models) are conducted. Boundaries encompass the areas within,
and times during which the Project is expected to interact with the VCs, as well as any constraints
due to political, social, and economic realities, and limitations in predicting or measuring changes.
Each assessment chapter of the Application/EIS describes the spatial and temporal boundaries and
rationale for their selection, as well as any administrative and technical boundaries if applicable.
8.4.2.1
Temporal Boundaries
Temporal boundaries are the time periods considered in the assessment for various Project phases
and activities. Temporal boundaries should reflect those periods during which planned Project
activities are reasonably expected to potentially affect a VC. These boundaries are adjusted as
appropriate to reflect seasonal and annual variations, or biophysical constraints related to a VC.
Potential effects will be considered for each phase of the Project as described in Table 8.4-3. Note that the
Operations phase will comprise a first stage of 23 years (Operations 1) and a second stage of five years
(Operations 2).
8.4.2.2
Spatial Boundaries
Spatial boundaries are determined based on the anticipated magnitude and spatial extent of Project
related effects. They are determined by the location and distribution of VCs and can be defined as the
anticipated zone of influence between the Project component/activity and the VC being studied. There
are three zones of influence between the Project and the VC being studied: the Project Site, the local study
area (LSA), and the regional study area (RSA). The following spatial boundaries are considered in each of
the effects assessment chapters.
8-6
ERM Rescan | PROJ #0230881 | REV E.1 | JANUARY 2015
EFFECTS ASSESSMENT METHODOLOGY
Table 8.4-2. Valued Components Selected for Assessment
Assessment Category
Subject Area
Valued Components
Environment
Atmospherics
Air quality
Noise
Noise
Hydrogeology
Groundwater quality
Groundwater quantity
Surface water
Surface water quality
Hydrology
Surface water quantity
Aquatic environment
Fish
Fish habitat
Aquatic resources
Vegetation
Rare plants
Ecological communities at risk
Wetlands
Old-growth forest
Wildlife and wildlife habitat
Terrestrial invertebrates
Amphibians
Migratory birds
Raptors
Bats
Fur-bearers
Large mammals
Ungulates
Socio-economic
Economic
Community growth
Social
Visual quality
Community health and well-being
Land use
Commercial interests
Public use
Navigable waters
Private land
Current use of lands and resources
for traditional purposes
Current use of lands and resources for traditional
purposes
Heritage
Archaeology
Heritage
Paleontology
Cultural heritage
Health
HARPER CREEK MINING CORPORATION
Health
Human health
8-7
APPLICATION FOR AN ENVIRONMENTAL ASSESSMENT CERTIFICATE / ENVIRONMENTAL IMPACT STATEMENT
Table 8.4-3. Temporal Boundaries for the Effects Assessment
Phase
Project Year
Length of Phase
Description of Activities
Construction
-2 and -1
2 years
Pre-construction and construction activities.
Operations 1
1 to 23
23 years
Active mining in the open pit from year 1 through year 23.
Operations 2
24 to 28
5 years
Low-grade ore processing from the end of active mining
through to the end of year 28.
Closure
29 to 35
7 years
Active closure and reclamation activities while the open pit
and TMF are filling.
36 onwards
50 years
Steady-state long-term closure condition following active
reclamation, with ongoing discharge from the TMF and
monitoring.
Post-Closure
Project Site
The Project Site is bound by a 500 m buffer around the proposed Project infrastructure, including:
•
the open pit;
•
the open pit haul road, primary crusher, and ore conveyor;
•
mill plant site with ore processing facilities and intake/outtake pipelines;
•
tailings management facility (TMF) with submerged PAG waste rock;
•
overburden, topsoil, potentially acid generating (PAG) waste rock and non-PAG waste rock
stockpiles, including water management ponds; and
•
non-PAG and PAG low grade ore stockpiles.
The Project Site overlaps the boundary between the Headwaters Forest District and the Kamloops
Forest District (refer to Figure 8.4-1).
The footprint of the Project extends beyond the main Project Site and includes the new 2.5-km
portion of the access road, and the two power line route options.
Local Study Area
The LSA contains the Project Site and a buffer zone which varies for each VC; within the buffer zone
there is a reasonable potential for direct and indirect effects on a specific VC due to an interaction
with Project components or activities.
Regional Study Area
The RSA is defined as the spatial area within which there is a potential for direct and indirect effects
and/or cumulative effects to occur as a result of the Project. The RSA is typically based on a natural
transition (e.g., watershed boundary, biogeoclimatic zone) or an artificial delineation (e.g., political
or economic district or zone) that is relevant to the VC (BC EAO 2013). For the project effects
assessment, qualitative analysis is more common than quantitative analysis at the RSA scale.
8-8
ERM Rescan | PROJ #0230881 | REV E.1 | JANUARY 2015
Figure 8.4-1
Project Location and Infrastructure
300000
310000
Alaska,
US
60
0
5
£
¤
Nor th Thom
ps
315000
80 0
Vavenby
!
.
Rail Concentrate
Load-out Area
on River
±
0
80
Clay C reek
ek
rn Cr e
gho
Fo
Northwest Territories
Yukon
0
10 0
Alberta
1200
Av Mi
US
ck
Cr
ee
k
reek
0
16 0 0
0
180
00
16
1800
Overburden
Stockpile
.
!
Open Pit
Community
18 0 0
Non-PAG
Waste Rock
c cess R oad
yC
Headwaters
Forest
District
14
0
A
ne
er
!
.
Victoria
.
!
Power Line
Option 2
Power Line
Option 1
5715000
k
Vancouver
600
u
Ch
Lute Cree
. Kamloops
!
Pacific
Ocean
ek
`
^
s C re
Harper Creek Clearwater
.
!
Project Site
Baker Cree
Prince George
k
.
!
Jone
Smithers
.
!
5715000
305000
Railway
Transmission Line
Proposed Project Infrastructure
Project Footprint
10
00
2000
HARPER CREEK MINING CORPORATION
2000
120
0
1600
1400
300000
0
18 0
220 0
22
00
5705000
1200
Service Layer Credits: Source: Esri, DigitalGlobe, GeoEye, i-cubed, Earthstar
Geographics, CNES/Airbus DS, USDA,0USGS,
AEX, Getmapping, Aerogrid, IGN, IGP,
0
00
20
swisstopo, and the GIS User2Community
18
20 0
Contains information licensed under the Open Government Licence – British
Columbia and Canada
20
0
5710000
Resource Road
0
Project Site
1200
1:100,000
2
0
120
Kilometres
Date: June 24, 2014
Projection: NAD 1983 UTM Zone 11N
0
00
10
4
140
0
1600
305000
310000
315000
Proj # 0230881-0024 | GIS # HCP-15-021
5705000
Kamloops
Forest
District
180
0
r
Bar rièr e Ri
ve
Local Road
160
0
14
00
Tailings
Management
Facility (TMF)
1800
1800
PAG
Low Grade
Stockpile
Highway
120 0
00
Existing Infrastructure
1600
200
0
1800
16
0
1400
18
0
0
Har per Cr eek
22
0
Explosives
Facility
Plant
Site
14
00
2200
5710000
Forest District
APPLICATION FOR AN ENVIRONMENTAL ASSESSMENT CERTIFICATE / ENVIRONMENTAL IMPACT STATEMENT
8.4.2.3
Administrative and Technical Boundaries
Administrative boundaries arise when jurisdictional (i.e., political) issues, or time and financial
constraints influence the process of identifying Project effects. Examples of administrative boundaries
include confidentiality associated with sensitive cultural sites or archaeological remains, or newly
imposed policy requirements which were introduced after the studies for a VC were undertaken.
Technical boundaries limit the ability to sample the environment (e.g., a legal restriction prohibiting
the sampling of Species at Risk), thereby limiting the ability to predict or measure change. For
example, sampling may be compromised when dealing with large geographical settings, or sensitive
species which may only practically be sampled by proxy, rather than by actual measurement.
8.5
BASELINE CONDITIONS
8.5.1
Regional and Historical Setting
Each effects assessment chapter provides a regional overview and description of historical activities
relevant to the environmental, social, economic, heritage, and health conditions surrounding the
Project or to the specific VC being assessed. Regional data are used to inform the assessment
framework and to characterize Project-related and cumulative effects. The section also describes
processes relevant to the environmental, social, economic, heritage and health regional settings
including current conditions, trends and variability over time. Information described in each
assessment chapter includes:
•
available scientific studies to describe the regional conditions and processes, supplemented
by Aboriginal traditional knowledge and community knowledge; and
•
references to supporting documents, maps and technical reports, some of which are included
as appendices to the Application/EIS.
8.5.2
Baseline Studies
Each effects assessment chapter provides an overview of the baseline studies undertaken to support
the assessment. Key information on the baseline study area, data collection, analysis, limitations and
methodology are provided for each VC. The detailed baseline study results and relevant supporting
information are provided as appendices to the Application/EIS for each subject area.
A summary table of the Project-specific field baseline data collection programs undertaken for each
subject area is provided below (Table 8.5-1).
8.5.3
Existing Conditions
Each effects assessment chapter provides key information on the results of the baseline studies.
The existing conditions within both the LSA and RSA of the specific component, VC or discipline
being assessed are presented, and a discussion on the results is included. The discussion details the
significance of the baseline results and covers any unusual results or uncertainties encountered.
8-10
ERM Rescan | PROJ #0230881 | REV E.1 | JANUARY 2015
EFFECTS ASSESSMENT METHODOLOGY
Table 8.5-1. Summary of Field Baseline Studies for the Harper Creek Project
Assessment Pillar
Subject Area
Baseline Data
Years of Available Data
Environment
Atmospherics
Dustfall
2011 to 2014
Meteorological
2007 to 2014
Noise
Noise
September 2012
Hydrogeology
Groundwater quality
2010 to 2014
Groundwater quantity
2010 to 2014
Surface water
Surface water quality
2007 to 2014
Hydrology
Surface water quantity
2011 to 2014
Aquatic
environment
Fisheries and aquatic studies
2011 to 2014
Terrestrial
environment
Soil
Data from 2008 fieldwork,
and 2011; 2012
Geohazards
Bioterrain mapping 2009;
2011
Rare plants
Data from 2005 to 2011,
and 2011 to 2012 fieldwork
Terrestrial Ecosystem Mapping
2000; 2011
Vegetation
Wildlife and
Wildlife Habitat
Socio-economic
Socio- economic
Butterflies, dragonflies, and damselflies
2011
Western toad
2008; 2011
Barn swallow
2008;2011
Common nighthawk
2012
Great blue heron
2012
Harlequin duck
2008
Olive-sided flycatcher
2008; 2011
Bald eagle
2012
Northern goshawk
2011; 2012
Western screech-owl
2011
Bats
2011;2012
Fisher
2008;2011
Grizzly bear
2008; 2011; 2012
Moose
2008; 2011
Mountain caribou
2008; 2011
Mountain goat
2008; 2011
Mule deer
2008; 2011
Wolverine
2008; 2011
Socio-economic
2006; 2009 - 2013;
(continued)
HARPER CREEK MINING CORPORATION
8-11
APPLICATION FOR AN ENVIRONMENTAL ASSESSMENT CERTIFICATE / ENVIRONMENTAL IMPACT STATEMENT
Table 8.5-1. Summary of Field Baseline Studies for the Harper Creek Project (completed)
Assessment Pillar
Heritage
Health
8.6
8.6.1
Subject Area
Baseline Data
Years of Available Data
Heritage
Archeological impact assessment
2011, 2012
Archaeological overview assessment
2014
Health – Country
Foods Baseline
Paleontological potential
2014
Historic information on LSA
Up to 2014
Traditional land use and ecological
knowledge study
2012
Soil data
2012
Surface water quality data
2007 to 2014
Vegetation data (huckleberry leaves and
berries, Sitka valerian, willow, fireweed,
and sorbus)
2012
Fish data (Rainbow Trout and Bull Trout)
2011 to 2012
Small terrestrial mammal data
2012
EFFECTS ASSESSMENT AND MITIGATION
Screening and Analyzing Project Effects
The relationship between Project components and activities and potential Project effects is
established using an impact matrix. The impact matrix applies a risk-based approach to filter
potential effects into low, moderate, or high risk ratings as a result of Project-VC interactions.
This process serves to focus the effects assessment on the project components and activities which
are likely to have the most influential effects on each VC, in accordance with the methodology
described by the BC EAO (2013).
The impact matrix results are then supported by a range of qualitative and quantitative studies and
analytical techniques (e.g., predictive modelling results) to evaluate the risk of effects on each VC
being assessed. When data are lacking, professional judgement is used to inform this evaluation.
An impact matrix is provided in each effects assessment chapter using the example layout shown in
Table 8.6-1; supporting rationale for the assigned risk ratings is also provided.
8.6.2
Mitigation Measures
Each effects assessment chapter of the Application/EIS discusses the availability and
implementation of mitigation measures to avoid, minimize, control, restore on-site, or offset effects
to VCs, in particular for those effects rated as moderate or high risk.
8-12
ERM Rescan | PROJ #0230881 | REV E.1 | JANUARY 2015
EFFECTS ASSESSMENT METHODOLOGY
Table 8.6-1. Example of Risk Ratings of Project Effects on <Subject Area> Valued Components
Project Component/Activity and
Potential Effects
VC 1
VC 2
VC 3
VC 4
VC 5
Construction
Project Component/Activity 1
Project Component/Activity 2
Operations*
Project Component/Activity 3
Project Component/Activity 4
Closure
Project Component/Activity 5
Project Component/Activity 6
Post-Closure
Project Component/Activity 7
Project Component/Activity 8
= Low risk interaction: a negligible to minor adverse effect could occur; no further consideration warranted.
= Moderate risk interaction: a potential moderate adverse effect could occur; warrants further consideration.
= High risk interaction: a key interaction resulting in potential significant major adverse effect or significant concern;
warrants further consideration.
Key approaches considered to mitigate potential effects include the following.
•
Optimizing Alternatives: Preventing or reducing adverse effects by changing an aspect of
the Project (e.g., choosing a new access route).
•
Design Changes: Preventing or reducing adverse effects by redesigning aspects of the
Project (e.g., changing the routing of the transmission line), or changing the timing of an
activity (e.g., minimizing or prohibiting road usage during key migration periods).
•
Best Achievable Control Technology (BACT): Eliminating, minimizing, controlling, or
reducing adverse effects through the use of technological applications (e.g., high density
sludge water treatment plants).
•
Management Practices: Eliminating, minimizing, controlling, or reducing adverse effects on
intermediate components or VCs through management practices (e.g., watering unpaved
roads to control dust).
•
Restoration: Restoration focuses on establishing appropriate composition, structure, pattern,
and ecological processes necessary to make systems sustainable, resilient, and healthy under
current and future conditions. Restoration is different from avoiding and minimizing
residual effects because it can be implemented at a later date.
•
Offsetting: Offsetting remaining effects that cannot be prevented or reduced through
remedial actions, so that the net effect on the community or ecosystem is neutral or beneficial
HARPER CREEK MINING CORPORATION
8-13
APPLICATION FOR AN ENVIRONMENTAL ASSESSMENT CERTIFICATE / ENVIRONMENTAL IMPACT STATEMENT
(e.g., enhancement of similar habitat in another area, enhancement of other social/
economic/cultural benefits).
The anticipated effectiveness of each mitigation measure to reduce the risk of adverse effects will be
classified as low, moderate, high, or unknown. These criteria are defined as:
•
Low effectiveness: After implementation of the mitigation measure, there is still a major
change in the VC or indicator from the baseline condition.
•
Moderate effectiveness: After implementation of the mitigation measure, there is a moderate
change in the VC or indicator from the baseline condition.
•
High effectiveness: After implementation of the mitigation measure, there is no change in
the VC or indicator from the baseline, or an environmental enhancement is evident.
•
Unknown effectiveness: The mitigation measure has not been tried elsewhere in similar
circumstances and the response of the VC or indicator compared to the baseline is unknown.
8.6.2.1
Environmental Management Plans and Reporting
Proposed frameworks for Environmental Management Plans and reporting for key subject areas are
provided in Chapter 24 of the Application/EIS. Each plan applies a systematic approach for
integrating Project-specific mitigation and monitoring activities throughout the life cycle of the
Project (i.e., into each Project phase), as well as any proposed monitoring and reporting.
Plans included in Chapter 24 of the Application/EIS are:
8-14
•
Air Quality Management Plan;
•
Archaeology and Heritage Monitoring Plan;
•
Emergency Response Plan;
•
Explosives Handling Plan;
•
Fish and Aquatic Effects Monitoring and Management Plan;
•
Fuel and Hazardous Materials Management Plan;
•
Groundwater Management Plan;
•
Mine Waste and ML/ARD Management Plan;
•
Noise Management Plan;
•
Sediment and Erosion Control Plan;
•
Selenium Management Plan;
•
Site Water Management Plan;
•
Soil Salvage and Storage Plan;
•
Spill Prevention and Response Plan;
•
Traffic and Access Management Plan;
ERM Rescan | PROJ #0230881 | REV E.1 | JANUARY 2015
EFFECTS ASSESSMENT METHODOLOGY
•
Vegetation Management Plan;
•
Waste Management Plan; and
•
Wildlife Management Plan.
If the implementation of mitigation measures will eliminate a potential effect (i.e., considered highly
effective) and no residual effect is identified on that VC, the effect is eliminated from further
analyses. If the proposed implementation controls and mitigation measure(s) are not sufficient to
eliminate an effect, a residual effect is identified. Residual effects with moderate to high risk (or for
which mitigation effectiveness is low, moderate, or unknown) are carried forward for additional
characterization and a significance determination.
A summary of potential effects and proposed mitigation measures for each subject area and/or VC
is provided in each assessment chapter.
8.6.3
Characterization of Residual Effects
Key residual effects are those effects of greater importance (i.e., moderate to high risk) that remain
after mitigation has been applied. If results have not already been presented in the preceding
analysis, the analysis of residual effects after mitigation is applied will be presented in this section.
Best practice methods to predict the nature and extent of effects that could result from the Project will
be used. These methods are described in each assessment chapter, including any relevant references,
analyses, and explanations from scientific, engineering, community, and Aboriginal knowledge.
To determine whether a residual effect is adverse, a characterization of the residual effect is
undertaken using the attributes defined below. Any modifications to these characterization criteria
are discussed in the relevant Application/EIS chapter. Each assessment chapter describes individual
ranking criteria pertaining to a particular effect, and where possible, assigns and rationalizes
quantitative levels or values (e.g., threshold values). Table 8.6-2 presents the different attributes to
characterize the residual effects; these include magnitude, geographic extent, duration, frequency,
reversibility, and resiliency. These attributes are used to support the determination of significance.
8.6.4
Likelihood of Effects
Likelihood refers to the probability of the predicted residual effect occurring and is determined
according to the attributes identified in Table 8.6-3. Narrative descriptions and justifications for the
likelihood (probability) assessment are provided along with the valuation of these attributes in each
of the chapters within the Application/EIS.
8.6.5
Significance of Residual Effects
The CEA Agency’s (1994b) Determining Whether a Project is Likely to Cause Significant Adverse
Environmental Effects was used as guidance in evaluating the significance of the adverse residual
effects for the Project. The significance of residual effects of the Project is founded on a comparison
of the current VC if the Project does not proceed, with the predicted state of the VC if the Project
proceeds, after mitigation measures described in Section 8.6.2 are applied.
HARPER CREEK MINING CORPORATION
8-15
Table 8.6-2. Attributes for Characterization of Residual Effects
Geographic Extent
Timing*
Magnitude
Biophysical
Socio-economic
How far will the effect reach?
Duration
Frequency
Reversibility
Resiliency
How long will the
effect last?
How often
will the effect
occur?
To what degree
is the effect
reversible?
How resilient is the receiving
environment or population?
Will it be able to adapt to or
absorb the change?
When will the
effect begin?
How severe will the effect be?
Construction
Phase
Negligible: no detectable
change from baseline
conditions.
Discrete:
effect is
limited to the
Project Site.
Individual/
household: effect is
limited to individuals,
families and/or
households.
Short term: effect
lasts less than
2 years (e.g., during
the Construction
Phase of the
Project).
One time:
effect is
confined to
one discrete
event.
Reversible:
effect can be
reversed.
High: the receiving
environment or
population has a high
natural resilience to
imposed stresses, and can
respond and adapt to the
effect.
Operations
Phases
(Stages 1
and 2)
Low: differs from the
average value for baseline
conditions but remains
within the range of natural
variation and below a
guideline or threshold value.
Local: effect
is limited to
the Local
Study Area.
Community: effect
extends to the
community level.
Medium term:
effect lasts from
2 to 30 years (i.e.,
encompassing both
stages of the
Operations phase).
Sporadic:
effect occurs
rarely and at
sporadic
intervals.
Partially
reversible:
effect can be
partially
reversed.
Neutral: the receiving
environment or
population has a neutral
resilience to imposed
stresses and may be able
to respond and adapt to
the effect.
Closure
Phase
Medium: differs
substantially from the
average value for baseline
conditions and approaches
the limits of natural
variation, but equal to or
slightly above a guideline or
threshold value.
Regional:
effect occurs
throughout
the Regional
Study Area.
Regional/Aboriginal
peoples: effect
extends across the
broader regional
community/
economy, or across
one or more First
Nations group(s)
territories.
Long term: effect
lasts from 30 to
37 years (i.e., effects
last into the closure
phase)
Regular:
effect occurs
on a regular
basis.
Irreversible:
effect cannot
be reversed,
is of
permanent
duration.
Low: the receiving
environment or
population has a low
resilience to imposed
stresses, and will not
easily adapt to the effect.
Post-closure
Phase
High: differs substantially
from baseline conditions and
is significantly beyond a
guideline or threshold value,
resulting in a detectable
change beyond the range of
natural variation.
Beyond
regional:
effect extends
beyond the
Regional
Study Area.
Beyond regional:
effect extends beyond
the regional scale, and
may extend across or
beyond the province.
Far future: effect
lasts more than
37 years (i.e., effects
last into the Postclosure Phase and
beyond).
Continuous:
effect occurs
constantly.
*Timing has been included for information purposes but is not an attribute of the residual effects characterization criteria.
EFFECTS ASSESSMENT METHODOLOGY
Table 8.6-3. Attributes of Likelihood of Effects
Probability Rating
High
> P80 (effect has > 80% chance of effect occurring)
Moderate
Low
Quantitative Threshold
P40 - P80 (effect has 40-80% chance of effect occurring)
< P40 (effect has < 40% chance of effect occurring)
To assess the significance of a residual effect, the Application/EIS relies on detailed information
including statistical analysis or mathematical modelling, including predictive model results
previously presented in the effects assessment. When defining and evaluating the significance of a
moderate to high risk residual effect, characterization criteria thresholds (e.g., aquatic life receiving
environment criteria, ambient air criteria, or land and resource management planning objectives) are
considered and applied. Each assessment chapter defines these thresholds and provides the source
literature for those thresholds as described above in Section 8.6.3.
The significance determination follows a two-step process; first the severity of residual effects is
ranked according to a minor, moderate and major scale. Each assessment chapter clearly defines how
the scale was determined, based on the specifics of the VC being assessed. Then, a consideration of
whether minor, moderate, or major effects are significant is made, following the definitions below.
•
Not significant (minor or moderate scale): Residual effects have low or moderate
magnitude; local to regional geographic extent; short- or medium-term duration; could occur
at any frequency, and are reversible or partially reversible in either the short or long-term.
The effects on the VC (e.g., at a species or local population level) are either indistinguishable
from background conditions (i.e., occur within the range of natural variation as influenced
by physical, chemical, and biological processes), or distinguishable at the individual level.
Land and resource management plan objectives will likely be met, but some management
objectives may be impaired.
•
Significant (major scale): Residual effects have high magnitude; regional or beyond regional
geographic extent; duration is long-term or far future; and occur at all frequencies. Residual
effects on VCs are consequential (i.e., structural and functional changes in populations,
communities, and ecosystems are predicted) and are irreversible. The ability to meet land
and resource management plan objectives is impaired.
Each assessment chapter clearly defines how the terms “significant” and “not significant” were
considered in relation to each VC, and provides a detailed rationale for the significance
determination as illustrated in Plate 8.6-1.
8.6.6
Confidence and Uncertainty in Determination of Significance
Confidence, which can also be understood as the level of uncertainty associated with the assessment, is a
measure of how well residual effects are understood. The reliability of data inputs and analytical
methods used to predict Project effects, confidence regarding the effectiveness of mitigation measures,
and certainty of the predicted outcome may all be considered. Confidence allows the decision-maker to
evaluate risk associated with the Project. Confidence attributes are provided in Table 8.6-4 below.
HARPER CREEK MINING CORPORATION
8-17
APPLICATION FOR AN ENVIRONMENTAL ASSESSMENT CERTIFICATE / ENVIRONMENTAL IMPACT STATEMENT
Plate 8.6-1. Determination of significance.
Table 8.6-4. Attributes of the Confidence in the Significance or Likelihood of the Effects
Confidence Rating
Qualitative Threshold
High
There is a good understanding of the cause-effect relationship and all necessary data are
available for the Project Site. The effectiveness of the mitigation measures is well known.
There is a low degree of uncertainty, and variation from the predicted effect is expected to
be low.
Moderate
The cause-effect relationships are not fully understood, there are a number of unknown
external variables, or data for the Project Site are incomplete. The effectiveness of mitigation
measures is moderately well understood. There is a moderate degree of uncertainty; while
results may vary, predictions are relatively confident.
Low
The cause-effect relationships are poorly understood, there are a number of unknown
external variables, and data for the Project Site are incomplete. The effectiveness of the
mitigation measures may not yet be proven. High degree of uncertainty and final results
may vary considerably.
Each assessment chapter includes a discussion on how the identified uncertainties affect the
confidence rating.
8.6.7
Summary of Project Effects Assessment
Residual effects on VCs, the characterization criteria, significance determination, likelihood, and
confidence evaluations will be summarized for each assessment chapter using the format shown in
Table 8.6-5.
8-18
ERM Rescan | PROJ #0230881 | REV E.1 | JANUARY 2015
Table 8.6-5. Summary of Key Effects, Mitigation, Residual Effects, Likelihood, Significance, and Confidence
Key Effect
Mitigation Measures
Summary of Residual Effects
Characterization Criteria
(Magnitude, Geographic Extent,
Duration, Frequency, Reversibility,
Resiliency)
Significance of Adverse Residual Effects
Likelihood
(High,
Moderate,
Low)
Scale
(Minor, Moderate,
Major)
Rating
(Not significant;
Significant)
Confidence
(High,
Moderate,
Low)
APPLICATION FOR AN ENVIRONMENTAL ASSESSMENT CERTIFICATE / ENVIRONMENTAL IMPACT STATEMENT
8.7
CUMULATIVE EFFECTS ASSESSMENT
Cumulative effects are the result of Project related residual effects interacting with the residual
effects of other human actions (i.e., anthropogenic developments, projects, or activities) to produce a
combined effect.
The approach to assessing cumulative effects generally follows the same steps as the Project-specific
effects assessment, as described in Section 8.6, namely scoping, identification and analysis of
potential cumulative effects, identification and description of mitigation measures, with subsequent
identification of residual cumulative effects, and characterization of residual cumulative effects to
determine significance.
The methodology, which is used throughout all assessment chapters, considers the following
guidance documents specific to cumulative effects:
•
Operational Policy Statement: Assessing Cumulative Environmental Effects under the Canadian
Environmental Assessment Act, 2012 (CEA Agency 2013);
•
Operational Policy Statement: Addressing Cumulative Environmental Effects under the Canadian
Environmental Assessment Act (CEA Agency 2007);
•
Cumulative Effects Practitioners Guide (Hegmann et al. 1999);
•
A Reference Guide for the Canadian Environmental Assessment Act: Determining Whether a
Project is Likely to Cause Significant Adverse Environmental Effects (Federal Environmental
Assessment Review Office 1994); and
•
Reference Guide: Addressing Cumulative Environmental Effects (CEA Agency 1994a).
8.7.1
Scoping Cumulative Effects
8.7.1.1
Valued Components and Residual Effects
The CEA considers the VCs for which residual effects are predicted. Each assessment chapter will
clearly indicate the VCs and effects that are considered for assessment in this section.
8.7.1.2
Defining Assessment Boundaries
Similar to the Project related effects, the assessment boundaries define the maximum limit within
which the CEA is conducted. Each assessment chapter will include a description and identification
of the temporal and spatial boundaries considered. These boundaries take into account the potential
environmental effects that may combine or overlap with other physical projects and activities.
The temporal boundaries for the identification of physical projects and activities have been
categorized into past, present and reasonably foreseeable projects and are defined as follows:
8-20
ERM Rescan | PROJ #0230881 | REV E.1 | JANUARY 2015
EFFECTS ASSESSMENT METHODOLOGY
•
past: no longer operational projects and activities that were implemented in the past
50 years. This temporal boundary enables to take into account any far-future effects from
past projects and activities;2
•
present: active and inactive projects and activities; and
•
future: certain projects and activities that will proceed, and reasonably foreseeable projects
and activities that are likely to occur. These projects are restricted to those that 1) have been
publicly announced with a defined project execution period and with sufficient project
details for assessment, and/or 2) are currently undergoing an environmental assessment,
and/or 3) are in a permitting process.
The spatial boundaries for the identification of other physical projects and activities for the
assessment of cumulative effects have been identified in the AIR as the Kamloops Land and
Resource Management Plan boundary, and are illustrated in Figure 8.7-1.
These boundaries are referred to as the CEA area.3
8.7.1.3
Projects and Activities Considered
Past, present, and reasonably foreseeable future projects and activities within the CEA boundary
described above were considered in the CEA. The project list was developed from a wide variety of
information sources, including municipal, regional, provincial and federal government agencies,
other stakeholders, and companies’ and businesses’ websites.
Details of projects included for consideration in the CEA are presented in Table 8.7-1 and details of
land use activities are summarized in Table 8.7-2. Figure 8.7-1 shows the location of past, present,
and reasonably foreseeable future projects, and the location of land-use activities are presented in
Figures 8.7-2 to 8.7-5.
8.7.2
Screening and Analyzing Cumulative Effects
The relationship between past, present, and reasonably foreseeable future projects and activities, and
the Project, is established using an impact matrix. The impact matrix applies a risk-based approach to
filter potential effects into low, moderate, or high risk ratings as a result of past, present, and future
project/activities-VC interactions. This process serves to focus the CEA on the project and activities
which are likely to have the most influential effects on each VC.
The impact matrix uses a range of characterization and prediction methods, including qualitative
and quantitative techniques to predict the nature of the effects. When data are lacking, professional
judgement is used to determine the extent of potential cumulative effects. Screening criteria were
2 Far-future effects are defined as effects that last more than 37 years, as per Table 8.6-2: Attributes for Characterization of Residual
Effects.
3 Note that the CEA area only refers to the spatial boundaries for the identification of other physical projects and activities, i.e., the
Kamloops LRMP boundary. Each assessment chapter will define its own spatial and temporal boundaries for the CEA.
HARPER CREEK MINING CORPORATION
8-21
APPLICATION FOR AN ENVIRONMENTAL ASSESSMENT CERTIFICATE / ENVIRONMENTAL IMPACT STATEMENT
applied to determine whether projects and activities should be included or excluded from the CEA,
including some or all of the following considerations:
•
a project/activity is within the regional study area of a VC;
•
a project/activity is within zone of influence of Project effects;
•
a project/activity is within or effects overlap with socio-economic influenced areas;
•
a project/activity has an effect on migratory species; and
•
a high degree of confidence exists that the other project or activity would not interact with
the residual effects of the Project.
An impact matrix is provided in each effects assessment chapter using the example layout shown in
Table 8.7-3; supporting rationale for the assigned risk ratings is also provided.
8.7.3
Mitigation Measures
Mitigation measures for cumulative effects involves taking further action, where possible, to avoid
or minimize cumulative effects on VCs. Because cumulative effects typically result from the
combined effects of multiple developments, responsibility for their prevention and management is
shared among the various contributing developments. It is usually beyond the responsibility or
capability of any one party to implement all of the measures needed to reduce or eliminate
cumulative effects; therefore, collaborative efforts are needed. The mitigation measures that can be
implemented by Harper Creek Mining Corporation are described for each effect in the relevant
chapters of the Application/EIS.
Mitigation measures are considered only for those effects identified in Section 8.7.2 as potential key
cumulative interactions (moderate to major risk). If the proposed implementation controls and
mitigation measure(s) eliminate or reduce the risk of a potential cumulative effect to a minor or
negligible ranking, then the effect is eliminated from further analyses (as there is minimal risk of the
cumulative effect being residual). If the proposed implementation controls and mitigation
measure(s) are deemed insufficient to eliminate a key cumulative effect for a VC, a moderate or
major risk of a cumulative residual effect is identified and carried through to the significance
determination exercise.
A summary of the proposed mitigation measures and their effectiveness on the VC is provided for
each assessment category using the format shown in Table 8.7-4. The table uses the same definitions
outlined in Section 8.6.3.
8.7.4
Cumulative Residual Effects, Characterization, Likelihood, and Significance
Cumulative residual effects are characterized and evaluated using the same criteria and definition
thresholds established for the project-specific effects assessment (see Table 8.6-2). Each assessment
chapter describes individual ranking criteria pertaining to a particular effect, and where possible,
assigns and rationalizes quantitative levels or values (e.g., threshold values).
8-22
ERM Rescan | PROJ #0230881 | REV E.1 | JANUARY 2015
Figure 8.7-1
Location of Past, Present and Reasonably Foreseeable
Future Projects in the Cumulative Effects Assessment Area
121°20'0"W
120°40'0"W
120°0'0"W
119°20'0"W
118°40'0"W
±
Northwest Territories
Yukon
Alberta
Alaska,
US
Smithers
.
!
.
!
Prince George
Harper Creek Clearwater
.
!
Project Site
`
^
16
£
¤
. Kamloops
!
Pacific
Ocean
Vancouver
.
!
!
.
US
Kinbasket
Lake
Quesnel
Lake
52°40'0"N
52°40'0"N
Victoria
53°20'0"N
122°0'0"W
Trans Mountain
Pipeline ULC
Bone Creek
Hydroelectric
Clearwater
Lake
(
!
52°0'0"N
52°0'0"N
Murtle
Lake
Westcoast
Energy Inc.
Shannon Creek
Hydroelectric Project
Canim
Lake
North Thompson
Transmission Project
Trans Mountain
Pipeline
Green
Lake
Bonaparte
Lake
Westcoast
Energy Inc.
Barriere
Foghorn
Polymetallic
Project
Adams
Lake
Barriere Sawmill
50°40'0"N
(
!
Tranquille on the
Lake Sustainable
Community Project
£
¤
1
#
*
#
*
Samatosum
Mine
Trans Mountain
Pipeline ULC
Fortis BC
Energy Inc.
Cache Creek
Landfill
Extension
Louis Creek
Sawmill
Kamloops
_#
^
*
Fortis BC
Energy Inc.
Salmon Arm
!
.
(
!
(
!
_
^
Fortis BC
Energy Inc. New
Afton
Mine
Ajax
Mine
Westcoast Project
Energy Inc.
(
!
Shuswap
Lake
Kamloops
Airport
Expansion
Western Pacific
Products & Crude Oil
Highland Valley
Copper Mine
Vavenby
Vavenby
Sawmill
.
!
!
(
Fortis BC
Energy Inc.
#
*!(!.
.
!
Fortis BC
Energy Inc.
Kamloops
Groundwater
Well
.
!
Transmission Line
Highway
Fortis BC
Energy Inc.
Railway
8
£
¤
Westcoast
Energy Inc.
Merritt
.
!
Fortis BC
Energy Inc.
50°0'0"N
Trans Mountain
Pipeline ULC
Westcoast
Energy Inc.
121°20'0"W
Fortis BC
Energy Inc.
120°40'0"W
97
£
¤
Okanagan
Lake
Harper Creek Project
Project Status
#
*
Past Project
(
!
Present Project
_
^
Future Project
Natural Gas/Oil Pipeline
(Present Project)
Kelowna
Fortis BC
Energy Inc.
Contains information licensed under the Open
Government Licence – British Columbia and Canada
Source: Esri, DigitalGlobe, GeoEye, i-cubed, Earthstar Geographics,
CNES/Airbus DS, USDA, USGS, AEX, Getmapping, Aerogrid, IGN, IGP,
swisstopo, and the GIS User Community
Cumulative Effects
Assessment Area
Vernon
Trans Mountain
Pipeline ULC
.
!
HARPER CREEK MINING CORPORATION
Community
50°0'0"N
Fortis BC
Energy Inc.
Ruddock Creek
Mine Project
51°20'0"N
97
£
¤
51°20'0"N
^!.
_
_
^
(
!
5
£
¤
_
^
Trans Mountain
Pipeline Extension
Project
_
^
50°40'0"N
.
!
_
^
Weyerhaeuser
Sawmill
North Thom pson River
100 Mile House
Clearwater
.
!
Fortis BC
Energy Inc.
120°0'0"W
0
Fortis BC
Energy Inc.
119°20'0"W
1:1,100,000
10
20
Kilometres
Date: September 29, 2014
Projection: NAD 1983 UTM Zone 11N
118°40'0"W
Proj # 0230881-0024 | GIS # HCP-05-001
Table 8.7-1. Details of Past, Present, and Reasonably Foreseeable Future Projects
Project Name
Company/Organization
Project Type
Start Date
End Date
Footprint Size
Project Description
Current Regulatory Status
Throughput
Weyerhaeuser
Sawmill
Yellowhead Mining Inc.
Sawmill
1965
2003
79.3 ha
A sawmill operation, currently closed with no plans for resuming construction.
The property is proposed for use for concentrate storage, rail access, and
staging grounds for the Harper Creek Project.
Closed
25 million tonnes (Mt) per
year
Inmet Mining
Mining
1989
1992
Unknown
A mine that produced gold, silver, copper, and base metals. Remaining
infrastructure includes a small open pit, 32 ha waste rock dump, flooded
tailings impoundment, several borrow pits, and plant site area.
Closed
465 t of ore per day
The Kamloops Airport
Authority Society
Transportation
2007
2009
2,000-foot runway
extension, improved
navigation aids, and an
expanded airport
terminal.
Kamloops Airport Expansion. The Kamloops Airport Authority Society
expanded the Kamloops Airport to accommodate larger jet aircraft. The project
included expansion of the main runway and airport terminal building, as well
as improvements to navigational aids.
Projects that do not require
an EA certificate
n/a
Louis Creek
Sawmill
Tolko Industries
Sawmill
Unknown
2003
Unknown
Sawmill closed following destruction by forest fire.
Closed
Unknown
Trans Mountain
Pipeline
Kinder Morgan
Petroleum
pipeline
1952
Unknown
1,150 km length
A pipeline system used to transport petroleum products from Strathcona
County, AB to Burnaby, BC.
Active
300,000 barrels per day
Canfor
Sawmill
Unknown
Unknown
Unknown
A sawmill operation processing approximately 13% of the annual cut in the
Kamloops Timber Supply Area.
Active
480 million board feet of
SPF lumber per year
Trans Alta
Clean Energy
2011
2031
Unknown
Run-of-river hydroelectric project. It is expected to have a long-term average
generation of 72 GWh per year.
Active
19 megawatts (MW)
Barriere Sawmill
Gilbert Smith Forest
Products
Sawmill
1968
Unknown
28 acres
An operating cedar sawmill.
Active
Unknown
New Afton Mine
New Gold Inc.
Mining
2012
2024
12,450 ha
A mine that produced gold, silver and copper. The mine occupies the site of the
historic Afton Mine, a previous operation of Teck Resources Limited, and
includes an open pit, underground workings, historic support facilities, a new
concentrator and recently constructed tailings facility.
Active
85,000 ounces of gold and
75 million pounds of
copper annually
Cache Creek
Landfill
Extension
Village of Cache Creek
and Wastech
Waste
Disposal
2009
Unknown
7 ha annex
(part of the 56 ha area)
Cache Creek Landfill Extension. An extension of the existing Cache Creek
Landfill by 40 ha to provide an additional 15 Mt of disposal capacity. The filling
rate is expected to range between 500,000 and 750,000 t per year and it has an
expected lifespan of 20 to 30 years.
Certificate issued
Permitted to receive up to
500,000 t of municipal
solid waste per year
Kamloops
Groundwater
Well
City of Kamloops
Water
Management
2001
Unknown
Unknown
Kamloops groundwater collector well project.
Certificate issued
The new well is designed
to withdraw 40,000 to
48,000 m³/day of
groundwater from the
aquifer
Teck
Mining
1963
2027
34,000 ha
An open-pit copper and molybdenum mine near Logan Lake, approximately
130 km southwest of the Project. The mine includes several open pits, a
processing plant, and a tailings pond.
Active
45 Mt milled per year
International Ranger
Corp.
Mining
Unknown
Unknown
3,129 ha
A mineral claim and proposed uranium mine, with the potential for future
work mining other commodities including fluorite, celestite, rare earth metals,
and molybdenum.
No registration reserve
under the Mineral Tenure
Act [RSBC 1996] Charter 292
for uranium and thorium
Unknown
BC Hydro
Transmission
line
2015/2016
Unknown
85 - 100 km length
An upgrade to the existing and active transmission line.
On hold
High voltage overhead
230 kV transmission line
Past
Samatosum Mine
Kamloops
Airport
Expansion
Vavenby
Sawmill
Present
Bone Creek
Hydroelectric
Future
Highland Valley
Copper Mine
Foghorn
Polymetallic
Project
North Thompson
Transmission
Project
(continued)
Table 8.7-1. Details of Past, Present, and Reasonably Foreseeable Future Projects (completed)
Future (cont’d)
Project Name
Company/Organization
Project Type
Start Date
End Date
Footprint Size
Project Description
Current Regulatory Status
Throughput
Ruddock Creek
Mine Project
Selkirk Metals Corp.
Mining
Unknown
Construction
start date + 10
years
Mine site
approximately 644 ha
with a surface facilities
footprint of 33 ha
A proposed lead-zinc underground mine.
Pre-application phase
Proposed production of
3,000 t per day
Ajax Mine
Project
KGHM International
Mining
2016
~2036
Unknown
A copper-gold mine located partially within the city limits of Kamloops.
Pre-application phase
Mill throughput of
60,000 t of ore per day
Kinder Morgan
Petroleum
pipeline
~ 2017
Unknown
900 km length
A proposed pipeline expansion of additional stations and increased storage
capacity added to three of the existing storage terminals.
Application in review
Expected capacity of
890,000 barrels per day
Soler Logging Ltd.
Clean Energy
Unknown
Unknown
Water (run-of-river
hydro project)
Run-of-river hydroelectric project.
EA Certificate not required
7.6 GWh per year
BC Wilderness Tours
Inc.
Community
Unknown
Unknown
190 ha
Sustainable agri-community that combines an urban farm and working
waterfront with a mixed use village community.
EA Certificate not required
1,000 to 2,000 dwelling
units (not including
accessory uses, seasonal,
or student housing), and
approximately 9,300 to
40,000 m2 of commercial
space
Trans Mountain
Pipeline
Extension Project
Shannon Creek
Hydroelectric
Project
Tranquille on the
Lake Sustainable
Community
Project
Figure 8.7-2
Forestry in the Cumulative Effects Assessment Area
121°
20'
0"
W
1
19°
20'
0"
W
1
18°
40'
0"
W
±
Alberta
.
!
S m it
he rs
.
!
Pacif
ic
Oc
e an
120°
0'
0"
W
Northwest Territories
Yukon
Alaska,
US
120°
40'
0"
W
Princ
e Ge org e
er
Harper Creek Cle arwat
.
!
Project Site
`
^
16
£
¤
. Kam loops
!
Vancouve r
US
Kinb as ke t
Lake
Q ue s ne l
Lake
52°
40'
0"
N
52°
40'
0"
N
.
!
Vict
oria
.
!
53°
20'
0"
N
122°
0'
0"
W
Cle arwat
er
Lake
52°
0'
0"
N
52°
0'
0"
N
Murt
le
Lake
Canim
Lake
Cle arwat
er
.
!
.
!
97
£
¤
Vav
e nb y
.
!
h Thom ps onRive r
Nort
51°
20'
0"
N
Gre e n
Lake
5
£
¤
Bonapart
e
Lake
Barrie re
51°
20'
0"
N
100Mile Hous e
Ad am s
Lake
.
!
S hus wap
Lake
Kam loops
S alm onArm
.
!
Ac
t
ive CutBloc
k*
£
¤
.
!
Me rrit
t
97
£
¤
50°
0'
0"
N
.
!
Okanag an
Lake
Com m unit
y
Hig hway
Cum ulat
iv
e Ef
f
ec
t
s
As s e s s m e nt
Are a
Harpe r Cre e k Proje ct
0
.
!
Cont
ains inf
orm at
ionlice ns e d und e r t
he Ope n
Gove rnm e ntLic
e nce – Brit
is h Colum b iaand Canad a
S ourc
e :Es ri,Dig it
alGlob e ,Ge oEy
e ,icub e d ,Eart
hs t
ar Ge og raphic
s,
CNES /
Airb us DS ,US DA,US GS ,AEX ,Ge t
m apping ,Ae rog rid ,I
GN,I
GP,
s wis s t
opo,and t
he GI
S Us e r Com m unit
y
120°
40'
0"
W
Com m unit
yFore s t
*
.
!
*
Te nure d at
aac
curat
e t
oMay20,2014
Ke lowna
121°
20'
0"
W
Kam loops Tim b e r
S upplyAre a
Ve rnon
8
HARPER CREEK MINING CORPORATION
50°
40'
0"
N
.
!
50°
0'
0"
N
50°
40'
0"
N
1
£
¤
1:
1,
100,
000
10
20
Kilom e t
re s
Dat
e :Oc
t
ob e r 14,2014
Proje c
t
ion:NAD1983UTM Zone 1
1N
120°
0'
0"
W
1
19°
20'
0"
W
1
18°
40'
0"
W
Proj # 0230881-0024 | GIS # HCP-05-003
Figure 8.7-3
Commercial Recreation Tenures in the Cumulative Effects Assessment Area
121°20'0"W
120°40'0"W
120°0'0"W
119°20'0"W
118°40'0"W
±
Northwest Territories
Yukon
Alberta
Alaska,
US
Smithers
.
!
.
!
Prince George
Harper Creek Clearwater
.
!
Project Site
`
^
16
£
¤
. Kamloops
!
Pacific
Ocean
53°20'0"N
122°0'0"W
Vancouver
!
.
.
!
US
52°40'0"N
52°40'0"N
Victoria
Kinbasket
Lake
Quesnel
Lake
Clearwater
Lake
52°0'0"N
52°0'0"N
Murtle
Lake
Canim
Lake
Clearwater
100 Mile House
.
!
.
!
5
£
¤
97
£
¤
Vavenby
.
!
Bonaparte
Lake
51°20'0"N
51°20'0"N
Green
Lake
Adams
Lake
Barriere
.
!
North
Thompson
River
Shuswap
Lake
.
!
Kamloops
Salmon Arm
.
!
50°40'0"N
50°40'0"N
1
£
¤
Tenure Purpose*
Alpine Skiing (Controlled
Recreation Area, General,
Independant Recreation Facility,
Lifts, Miscellaneous, Runs/Trails)
Vernon
.
!
Commercial (Commercial
Recreation Dock, Hunting/
Fishing Camp, Marina, Golf
Course, Commercial Warf)
Merritt
97
£
¤
50°0'0"N
.
!
.
!
Okanagan
Lake
Kelowna
*Tenure data accurate to April 30, 2014.
.
!
0
Contains information licensed under the Open
Government Licence – British Columbia and Canada
Source: Esri, DigitalGlobe, GeoEye, i-cubed, Earthstar Geographics,
CNES/Airbus DS, USDA, USGS, AEX, Getmapping, Aerogrid, IGN, IGP,
swisstopo, and the GIS User Community
121°20'0"W
HARPER CREEK MINING CORPORATION
120°40'0"W
Community
Highway
Cumulative Effects
Assessment Area
Harper Creek Project
50°0'0"N
8
£
¤
Commercial Recreation
(Community Outdoor Recreation,
Guided Freshwater Recreation,
Guided Nature Viewing, Heli
Hiking, Heli Ski, Miscellaneous,
Multiple Use, Private Camps,
Smowmobiling, Trail Riding)
1:1,100,000
20
40
Kilometres
Date: October 10, 2014
Projection: NAD 1983 UTM Zone 11N
120°0'0"W
119°20'0"W
118°40'0"W
Proj # 0230881-0024 | GIS # HCP-05-012
Figure 8.7-4
Water Licences and Range Tenures in the Cumulative Effects Assessment Area
121°20'0"W
120°40'0"W
120°0'0"W
119°20'0"W
118°40'0"W
±
Northwest Territories
Yukon
Alberta
Alaska,
US
Smithers
.
!
.
!
Prince George
Harper Creek Clearwater
.
!
Project Site
`
^
16
£
¤
. Kamloops
!
Pacific
Ocean
Vancouver
.
!
!
.
US
52°40'0"N
52°40'0"N
Victoria
53°20'0"N
122°0'0"W
Kinbasket
Lake
Quesnel
Lake
Clearwater
Lake
52°0'0"N
52°0'0"N
Murtle
Lake
Canim
Lake
Clearwater
.
!
.
!
Vavenby
North T h ompson Rive
r
97
£
¤
Green
Lake
51°20'0"N
5
£
¤
.
!
Bonaparte
Lake
Barriere
51°20'0"N
100 Mile House
Adams
Lake
.
!
Shuswap
Lake
Salmon Arm
Kamloops
.
!
.
!
50°40'0"N
50°40'0"N
1
£
¤
Water Licence*
Ground Water
Licence (BCHA)
Horseback Riding
Range Tenure**
Crown Tenure - Agriculture***
Extensive
Grazing
Intensive
Vernon
.
!
Merritt
.
!
£
¤
50°0'0"N
.
!
Cumulative Effects
Assessment Area
Okanagan
Lake
.
!
0
Contains information licensed under the Open
Government Licence – British Columbia and Canada
Source: Esri, DigitalGlobe, GeoEye, i-cubed, Earthstar Geographics,
CNES/Airbus DS, USDA, USGS, AEX, Getmapping, Aerogrid, IGN, IGP,
swisstopo, and the GIS User Community
121°20'0"W
120°40'0"W
Harper Creek Project
* Data accurate to August 21, 2014
** Data accurate to April 23, 2014
*** Data accurate to April 30, 2014
Kelowna
HARPER CREEK MINING CORPORATION
Community
Highway
97
50°0'0"N
8
£
¤
1:1,100,000
20
40
Kilometres
Date: October 10, 2014
Projection: NAD 1983 UTM Zone 11N
120°0'0"W
119°20'0"W
118°40'0"W
Proj # 0230881-0024 | GIS # HCP-05-004
Figure 8.7-5
BC Recreation Sites, Trails, and Private Campgrounds in the Cumulative Effects Assessment Area
D
*
D
*
D
*
±
Alberta
.
!
&9 5?
41=
>
.
!
#- / 525/
" / 1- :
D
*
Northwest Territories
Yukon
Alaska,
US
D
*
#=
5: / 1
1;=
31
B- ?
1=
Harper Creek 81- =
.
!
Project Site
16
£
¤
`
^
. - 9 8;;<>
!
) 5/ ?
;=
5-
!
.
.
!
) - : / ;@A1=
US
@=
?
81
- 71
.
!
97
£
¤
p
n
81- =
B- ?
1=
.
!
p
n
n
p
p
n
D
!
=
11:
- 71
p
n
p
n
Louis Creek
Sawmill
p
n
8
£
¤
p
n
p
n
n
p
p
n
- =
=
51=
1
n!.
p
p
n
p
n
p
n
p
n
D
!
p
n
&4@>
B- <
- 71
p
n
p
n
p
n
- 9 8;;<>
.
!
p
n
&- 89 ;: =
9
nn
p
p
p
n
p
n
p
n
p
n
BC Recreation Site Activity*
.
!
5>45: 3
- 9 <5: 3
575: 3
p
n
;=
>1.- / 7
%505: 3
@: ?
5: 3
p
n
'=
- 58
571
%505: 3
&755: 3
&: ;B9 ;.585: 3
.
!
&B59 9 5: 3
p
n
97
£
¤
- 9 <3=
;@: 0
#=
5A- ?
1
%1/ =
1- ?
5;: '=
- 58
%1/ =
1- ?
5;: &5?
1
.
!
" 7- : - 3- :
- 71
;9 9 @: 5?
C
534B- C
@9 @8- ?
5A1
221/ ?
>
>
>1>
>9 1: ?
=
1-
- =
<1=
=
117
#=
;61/ ?
18;B: -
- ?
-
5>
- / / @=
-?
1
- >
;2
&1<?
19 .1=
.
!
;: ?
- 5: >
5: 2;=
9-?
5;: 85/ 1: >
10
@: 01=
?
41
" <1:
;A1=
: 9 1: ?
5/ 1: / 1
E
=
5?
5>4
;8@9 .5- - : 0
- : - 0&;@=
/ 1
>=
5
535?
- 88;.1
1;C1
5
/ @.10
- =
?
4>?
-=
1;3=
- <45/ >
!&
5=
.@>
&
( &
( &&
+
1?
9 - <<5: 3
1=
;3=
50
!
#
>
B5>
>?
;<;
- : 0
?
41
&
(>
1=
;9 9 @: 5?
C
D
*
&: ;B>
4;15: 3
) 1=
: ;:
p
n
.
!
D
*
0- 9 >
- 71
1=
=
5?
?
HARPER CREEK MINING CORPORATION
D
!
.
!
p
n
1
£
¤
p
n
) - A1: .C
5
£
¤
p
n
p
n
;: - <- =
?
1
- 71
D
!
p
n
;: %5A1=
4 ' 4;9 <>
?
!;=
581
;@>
1
Vavenby
Sawmill
p
n
n
p
p
n
D
!
D
!
- : 59
- 71
p
n
D
!
%
:
5A1=
;
;
>
%
9
4
:
<
'
5
A
;
;
4
?
9
>
=
4
;
<
'
!
1
4
?
=
=
!;
81- =
B- ?
1=
- 71
D
!
5: .- >
71?
- 71
D
!
D
!
USA
$@1>: 18
- 71
in
D
!
D
*
58;9 1?
=
1>
- ?
1
" /?
;.1=
#=
;61/ ?
5;: !
( '
D
*
D
*
, ;: 1
!
D
*
Proj # 0230881-0024 | GIS # HCP-05-013
Table 8.7-2. Past, Present, and Reasonably Foreseeable Future Human Activities
Activity
Past
Present
Future
Land Use Description
Forestry
X
X
X
The Project is located within the Kamloops Timber Supply Area and forestry is a prominent
economic activity in the region. There are 4,389 active cut block tenures located within the CEA area
and eight community forests.
Commercial recreation
X
X
X
There are 81 commercial recreation tenures within the CEA area including alpine skiing resorts,
holiday resorts, guided freshwater recreation, fishing, hunting, camping and snowmobiling.
Water Use
X
X
X
Water use includes water licences and registered extraction points. There are 5,852 surface water
licences and 2,401 registered water intake extraction points within the CEA area.
Agriculture
X
X
X
Dedicated Agricultural Land Reserve areas and range tenures are located within the CEA area. There
are 196 range tenures within the CEA area.
Non-commercial
recreation
X
X
X
Non-commercial recreation includes, for example, parks, backcountry tourism (ATV and quad use),
snowmobiling, and recreation clubs (e.g., skiing, hiking). Within the CEA area there are 59 provincial
parks, two ecological reserves, four protected areas, and 151 recreation sites, including a number of
sites used by local recreational clubs. There are also several lakes commonly used for noncommercial recreational purposes (e.g., fishing, camping) within the CEA area.
Aboriginal harvesting
X
X
X
Aboriginal hunting, trapping, fishing, and gathering.
Hunting
X
X
X
Several hundred resident hunters access the CEA area for the purpose of hunting on an annual basis.
The CEA area overlaps with 25 Wildlife Management Units.
Trapping
X
X
X
There are 83 trapline tenures and 13 trapline cabin tenures overlapping the CEA area.
Fishing
X
X
X
The Nicola-Thompson region is an important area for freshwater sport fishing, particularly of
rainbow trout. Fishing occurs at lakes, rivers and streams in parks and recreation sites in the CEA
area. Commercial fishing activities are described as part of commercial recreational licences
including guided freshwater recreation, and recreational fishing is described as part of noncommercial recreation activities.
Mining and mineral
exploration
X
X
X
Mining and mineral exploration has occurred in the past and present and is expected to continue in
the foreseeable future. In total there are 2,795 mineral claims, 127 mineral leases and 70 placer claims
in the CEA area.
Transportation
X
X
X
The Canadian National Railway passes through the North Thompson Valley; Highway 5 is located
approximately 6 km north of the Project Site.
Notes: Table accurate to October 2014.
Table 8.7-3. Example Impact Matrix for Screening and Ranking Potential Cumulative Effects
VC1
Residual Effect 1
Residual Effect 2
VC 2
Residual Effect 1
Residual Effect 2
Notes: Table for example purposes only.
Blank cells indicate no potential for interaction and will not be carried forward in the assessment.
= Negligible to minor risk of adverse cumulative effect, will not be carried forward in the assessment.
= Moderate risk of adverse cumulative effect, will be carried forward in the assessment.
= Major risk of adverse cumulative effect or significant concern; will be carried forward in the assessment.
Water Use
Forestry
Agriculture
Transportation
Mining and Mineral
Exploration
Commercial Recreation
Non-commercial Recreation
Fishing
Trapping
Hunting
Activities
(Past, present, and reasonably foreseeable)
Aboriginal Harvesting
Ruddock Creek Project
North Thompson
Transmission Project
Vavenby Sawmill
Trans Mountain Pipeline
Present Projects
Highland Valley Copper
Louis Creek Sawmill
Weyerhaeuser Sawmill
Residual Effects
of the Harper
Creek Project
on VCs
Samatosum Project
Past Projects
Reasonably
Foreseeable
Future
Projects
EFFECTS ASSESSMENT METHODOLOGY
Table 8.7-4. Proposed Mitigation Measures for Potential Cumulative Effects and their
Effectiveness
Potential
Cumulative Effect
Proposed Mitigation
Measure
Mitigation Effectiveness
(Low/Moderate/High/Unknown)
Cumulative Residual Effect
(Y/N)
The effects assessment chapters include a determination of the significance of cumulative residual
effects using the same standards or thresholds established for the effects on individual VCs. As with
Project residual effects, determination of significance for cumulative residual effects includes a
discussion of how the likelihood has contributed to the determination, where appropriate.
8.7.5
Confidence
Once a significance determination is made, a discussion of the confidence in the CEA is provided,
based on:
•
scientific certainty relative to quantifying or estimating the effect, including the quality
and/or quantity of data and the understanding of the effect mechanisms;
•
scientific certainty relative to the effectiveness of the proposed mitigation measures; and
•
professional judgement from prior experience including proven mitigation measures.
8.7.6
Follow-up Program
If applicable, the Application/EIS will identify any proposed follow-up programs required to verify
the accuracy of the environmental assessment predictions and/or determine the effectiveness of any
mitigation measures.
8.8
CONCLUSIONS
Each effects assessment chapter provides a summary of the residual effects and the cumulative
residual effects and presents the results using Table 8.8-1 below.
Table 8.8-1. Summary of Key Project and Cumulative Residual Effects, Mitigation, and
Significance for <Assessment Topic>
Residual Effects
Project
Phase
Significance of Residual Effects
Mitigation Measures
Project
Cumulative
Valued Component 1
Residual Effect 1
Residual Effect 2
Valued Component 2
Residual Effect 1
Residual Effect 2
HARPER CREEK MINING CORPORATION
8-39
APPLICATION FOR AN ENVIRONMENTAL ASSESSMENT CERTIFICATE / ENVIRONMENTAL IMPACT STATEMENT
REFERENCES
Definitions of the acronyms and abbreviations used in this reference list can be found in the
Glossary and Abbreviations section.
1992. Canadian Environmental Assessment Act, SC. C. 37.
2002. Environmental Assessment Act, SBC. C. 43.
2012. Canadian Environmental Assessment Act, 2012, SC. C. 19. s. 52.
BC EAO. 2011. Environmental Assessment Office User Guide. Prepared by the British Columbia
Environmental Assessment Office: Victoria, BC.
CEA Agency. 1994a. Reference Guide: Addressing Cumulative Environmental Effects. Prepared by the
Federal Environmental Assessment Review Office: Ottawa, ON.
CEA Agency. 1994b. Reference Guide: Determining Whether a Project is Likely to Cause Significant
Adverse Environmental Effects. Prepared by the Federal Environmental Assessment Review
Office: Ottawa, ON.
CEA Agency. 1996. Assessing Environmental Effects on Physical and Cultural Heritage Resources.
Prepared by the Canadian Environmental Assessment Agency: Hull, QC.
CEA Agency. 2007. Operational Policy Statement: Addressing Cumulative Environmental Effects under the
Canadian Environmental Assessment Act. Prepared by the Canadian Environmental
Assessment Agency: Ottawa, ON.
CEA Agency. 2011. Background Information for the Initial Federal Public Comment Period on the
Comprehensive Study pursuant to the Canadian Environmental Assessment Act of the Harper
Creek Mine Project near Kamloops, British Columbia. Prepared by the Canadian Environmental
Assessment Agency: Ottawa, ON.
CEA Agency 2013. Operational Policy Statement: Assessing Cumulative Environmental Effects under the
Canadian Environmental Assessment Act, 2012. https://www.ceaaacee.gc.ca/default.asp?lang=En&n=1DA9E048-1 (accessed September 2014).
District of Barriere. 2011. District of Barriere Official Community Plan. https://barriere.civicweb.net/
Documents/DocumentDisplay.aspx?Id=1232 (accessed May 2014).
District of Clearwater. 2012. District of Clearwater Official Community Plan.
http://www.districtofclearwater.com/development-services/official-community-plan
(accessed May 2014).
Federal Environmental Assessment Review Office. 1994. A Reference Guide for the Canadian
Environmental Assessment Act: Determining Whether a Project is Likely to Cause Significant
Adverse Environmental Effects. Prepared by the Federal Environmental Assessment Review
Office: Ottawa, ON.
Hegmann, G., C. Cocklin, R. Creasey, S. Dupuis, A. Kennedy, L. Kingsley, W. Ross, H. Spaling,
D. Stalker, and AXYS Environmental Consulting Ltd. 1999. Cumulative Effects Assessment
Practitioners Guide. Prepared for the Canadian Environmental Assessment Agency by The
8-40
ERM Rescan | PROJ #0230881 | REV E.1 | JANUARY 2015
EFFECTS ASSESSMENT METHODOLOGY
Cumulative Effects Assessment Working Group and AXYS Environmental Consulting Ltd.:
Ottawa, ON.
Kamloops Interagency Management Committee. 1995. Kamloops Land and Resource Management Plan.
http://www.for.gov.bc.ca/tasb/slrp/lrmp/kamloops/kamloops/plan/files/klrmp_full.pdf
(accessed May 2014).
Merit. 2014. Technical Report and Feasibility Study for the Harper Creek Project. Prepared for Yellowhead
Mining Inc. by Merit Consultants International Inc.: Vancouver, BC.
Westcoast CED Consulting Ltd. 2005. North Thompson Economic Development Strategic Plan 2005-2010.
Prepared for Community Futures Development Corporation of Thompson Country by
Westcoast CED Consulting Ltd.: Vernon, BC.
Yellowhead Mining Inc. 2011. Application Information Requirements for Harper Creek Project. Prepared
by Yellowhead Mining Inc.: Vancouver, BC.
HARPER CREEK MINING CORPORATION
8-41


© Copyright 2026