
Norovirus: weekly national report for week 5 (29 January
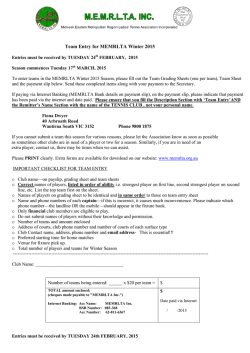
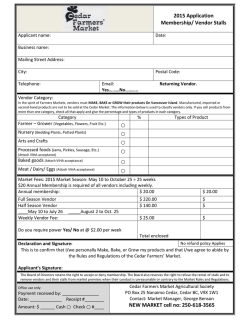
PHE Weekly National Norovirus and Rotavirus Report http:// Summary of surveillance of norovirus and rotavirus 29 January 2015 This report is published weekly on the website. For further information on the surveillance system mentioned in this report, please visit the Hospital Norovirus Reporting System website. Contents: | Summary | Hospital norovirus outbreak reporting system | Laboratory reporting | Laboratory surveillance update | Activity in prisons | Rotavirus | Acknowledgements | Summary th The next report will be available on the 5 February 2015 Norovirus The number of laboratory reports of norovirus in the current season is 10 percent lower overall compared to the five year seasonal average (from season 2009 and 2010 to season 2013 and 2014). Laboratory reports are currently at lower levels than the same weeks in previous years. Reports of outbreaks of diarrhoea and vomiting in hospitals continue to be reported at similar levels to previous years. Rotavirus Rotavirus activity is low; laboratory reports are thirty seven per cent lower than the ten season average (from season 2003 to 2004 to season 2012 to 2013). The decreased rotavirus activity is likely to be associated with the introduction of the oral vaccine in July 2013. Page 1 of 8 Hospital Norovirus Outbreak Reporting System (HNORS) In the two weeks between 12/01/2015 and 25/01/2015 the hospital norovirus outbreak reporting scheme (HNORS) recorded 17 suspected or confirmed outbreaks of norovirus, all of which led to ward/bay closures or restrictions to admissions. Only five (30 per cent) were reported as laboratory confirmed norovirus outbreaks. Since the start of this season (week 27 2014) there have been 367 reported outbreaks of suspected or confirmed norovirus, of which 347 (94 per cent) led to ward/bay closures or restrictions to admissions and 240 (65 per cent) were laboratory confirmed as norovirus outbreaks. In the last season (week 27 2013 to week 26 2014) 610 outbreaks were reported, 571 (94 per cent) of which reported ward/bay closures or restrictions to admissions and 383 (63 per cent) were reported as laboratory confirmed norovirus outbreaks. Table 1: The number of suspected and confirmed norovirus outbreaks in hospitals Public Health England Centre Avon, Gloucestershire and Wiltshire Bedfordshire, Hertfordshire and Northamptonshire Cheshire and Merseyside Cumbria and Lancashire Devon, Cornwall and Somerset Greater Manchester Hampshire, Isle of Wight and Dorset Lincolnshire, Leicestershire, Nottinghamshire and Derbyshire London Norfolk, Suffolk, Cambridgeshire and Essex North East Sussex, Surrey and Kent Thames Valley West Midlands Outbreaks 12/01/2015 to 25/01/2015 Outbreaks Ward/bay Lab confirmed Ŧ closure 5 5 1 3 1 1 1 3 1 1 1 1 6 6 3 17 17 5 Yorkshire and the Humber Total Ŧ Note: not all outbreaks result in whole ward closure, some closures are restricted to bays only Page 2 of 8 Outbreaks reported in the last season 2013/2014 (week 27 2013 - week 26 2014) Outbreaks Ward/bay Lab confirmed Ŧ closure 81 1 4 29 71 18 50 46 9 81 1 3 29 69 15 50 44 9 54 1 4 10 29 6 36 32 8 60 31 22 76 112 610 50 31 22 73 94 571 39 23 8 39 94 383 Norovirus Laboratory Reporting The number of laboratory reports of norovirus in this season* (since week 27 2014) is 3260. This is ten per cent lower than the average number for the same period in the seasons 2009/2010 to 2013/2014 (3656). Data from laboratory reporting are subject to a reporting delay and the number reported in the most recent weeks is likely to increase as further laboratory reports are received. Norovirus is predominantly a winter pathogen; however, norovirus infections do occur in the summer months. Figure 1: Seasonal comparison of laboratory reports of norovirus (England and Wales) Figure 2: Laboratory and hospital outbreak reports by month of occurrence Page 3 of 8 Figure 3: Cumulative number of laboratory reports of norovirus by season 2007/8-2013/14 Figure 4: Laboratory reports of norovirus 2007-2014 (England and Wales) *In order to capture the winter peak of norovirus activity in one season, for reporting purposes, the norovirus season runs from week 27 in year 1 to week 26 in year2, i.e. week 27 2009 to week 26 2010, July to June. From 1 December 2014 we moved to a new laboratory reporting system so direct comparisons between the previous system (LabBase2) and the new system (SGSS) may not be valid. Page 4 of 8 Laboratory Surveillance Update – Virus Reference Department (VRD) Total number of outbreaks referred to VRD (27-2014 to 04-2015): 195 Total number of outbreaks confirmed as norovirus positive: 216 Total number of outbreaks from healthcare settings, referred to VRD (27-2014 to 04-2015): 65 Total number of outbreaks from healthcare settings, confirmed as norovirus positive: 43 81.8% of norovirus-confirmed outbreaks were associated with GII-4 strains since July 2011. 10 different norovirus genotypes have been detected in the current season (27-2014 to date). The majority of norovirus-confirmed outbreaks in the current season (27-2014 to date) were associated with GII-4 (115/176, 65.3%). The most commonly detected GII-4 strain between periods 04-2014 to 04-2015 is Sydney2012 and is associated with 100% of GII-4 norovirus-confirmed outbreaks. The most commonly detected GII-4 strain in the previous season (2013-2014) was Sydney2012. Figure 5: Season-to-season comparison of norovirus-confirmed outbreaks (all settings) referred to VRD Page 5 of 8 Figure 6: Norovirus-confirmed outbreaks (all settings, by month) referred to VRD Figure 7: GII-4 norovirus strains detected (by week) among norovirus confirmed outbreaks (all settings) (04-2014 to 04-2015) Page 6 of 8 Norovirus Activity in Prisons No outbreaks of diarrhoea and vomiting have been reported in prisons between 19 January and 25 January 2015. Table 2: The number of suspected and confirmed norovirus outbreaks in prisons Outbreaks reported 19/01/2015 to 25/01/2015 Region Public Health England Centre North Greater Manchester Cumbria and Lancashire Cheshire and Merseyside Yorkshire and Humber North East Anglia and Essex South Midlands and Hertfordshire Nottinghamshire, Derbyshire, Lincolnshire and Leicestershire West Midlands London Thames Valley Wessex (Hampshire, Isle of Wight and Dorset) Avon, Gloucestershire and Wiltshire Devon, Cornwall and Somerset Surrey, Sussex and Kent Midlands and East of England London South Outbreaks reported this season week 27 2014 – week 04 2015 1 1 1 2 2 1 1 1 10 Total NB. Not all suspected cases are tested for norovirus. Where there is an outbreak, a sample of individuals will be tested. For guidance on the management of outbreaks in prisons see: https://www.gov.uk/government/publications/multi-agency-contingency-plan-for-disease-outbreaks-in-prisons Page 7 of 8 Rotavirus Laboratory Reporting The number of laboratory reports of rotavirus in this season* (since week 27 2014) is 1108. This is thirty seven per cent lower the ten season average for the same period in the seasons 2004/2005 to 2013/2014 (1751). The observed decrease in rotavirus activity in the previous season is likely to be associated with the introduction of the oral vaccine in July 2013. Rotavirus will particularly contribute to reported diarrhoea and vomiting illness in children aged under five and is often associated with outbreaks of diarrhoea and vomiting in nurseries and schools. Note that laboratory reports for the latest weeks are likely to increase as further reports are received. Figure 8: Seasonal comparison of laboratory reports of rotavirus (England and Wales) Figure 9: Weekly rotavirus laboratory reports compared to weekly mean reports 2002-2011 *In order to capture the winter peak of norovirus activity in one season, for reporting purposes, the rotavirus season runs from week 27 in year 1 to week 26 in year2, i.e. week 27 2009 to week 26 2010, July to June Acknowledgements We would like to thank infection control staff in hospitals for contributing data to HNORS. Any queries can be directed to [email protected] Page 8 of 8


© Copyright 2026