P E R F O R M A N C E U P D A T E - ING
PERFORMANCE
UPDATE
VOYA 401(K) SAVINGS PLAN
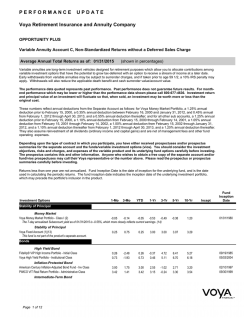
Average Annual Total Returns as of: 01/31/2015
(shown in percentages)
Mutual funds offered through a retirement plan are investments designed for retirement purposes. Early withdrawals will reduce your
account value and if taken prior to age 59 1/2, a 10% IRS penalty may apply.
The performance data quoted represents past performance. Past performance does not guarantee future results. For monthend performance which may be lower or higher than the performance data shown please call 800-555-1899. Investment return
and principal value of an investment will fluctuate so that, when sold, an investment may be worth more or less than the
original cost.
The returns assume reinvestment of all dividends (ordinary income and capital gains) and are net of management fees and other fund
operating expenses.
You should consider the investment objectives, risks and charges, and expenses of the funds carefully before investing. The
prospectus contains this and other information. Anyone who wishes to obtain a free copy of the fund prospectuses may call
their Voya representative or the number above. Please read the prospectus carefully before investing.
Returns less than one year are not annualized. Fund Inception Date is the date of inception for the underlying fund, and is the date
used in calculating the periodic returns. This date may also precede the portfolio's inclusion in the product.
Investment Options
Incept
Fund
Gross
Inception Fund
Date
Exp %*
Net
Fund
Exp %*
1-Mo
3-Mo
YTD
1-Yr
3-Yr
5-Yr
10-Yr
0.24
0.67
0.24
2.54
2.86
3.19
3.70
1.88
2.65
1.88
6.49
6.00
6.78
6.83
03/31/2000
0.45
0.45
2.33
3.11
2.33
6.71
3.08
4.55
4.90
09/18/1995
0.07
0.07
0.91
1.00
0.91
6.78
8.11
11/15/2012
0.08
0.08
0.43
0.33
0.43
4.76
03/21/2014
0.08
0.08
0.04
-0.20
0.04
11.08
11/15/2012
0.08
0.08
-0.33
-0.69
-0.33
4.05
03/21/2014
0.08
0.08
-0.59
-1.07
-0.59
13.33
11/15/2012
0.08
0.08
-0.85
-1.42
-0.85
3.48
03/21/2014
0.08
0.08
-1.04
-1.71
-1.04
14.54
11/15/2012
0.08
0.08
-1.05
-1.72
-1.05
3.30
03/21/2014
0.08
0.08
-1.04
-1.71
-1.04
6.54
14.55
11/15/2012
0.08
0.08
1.06
1.18
1.06
6.50
6.55
11/15/2012
0.08
0.08
Stability of Principal
Stable Value
Stable Value Option - 2785 (1)
Bonds
Intermediate-Term Bond
Metropolitan West Total Return Bond Fund - Class I
Shares - 5329
Vanguard® Total Bond Market Index Fund - Institutional
- 799
Asset Allocation
Lifecycle
Voya Target Index Solution Trust 2015 - Class 3 CIT 3673 (2)
Voya Target Index Solution Trust 2020 - Class 3 CIT 6524 (2)
Voya Target Index Solution Trust 2025 - Class 3 CIT 3674 (2)
Voya Target Index Solution Trust 2030 - Class 3 CIT 6525 (2)
Voya Target Index Solution Trust 2035 - Class 3 CIT 3675 (2)
Voya Target Index Solution Trust 2040 - Class 3 CIT 6526 (2)
Voya Target Index Solution Trust 2045 - Class 3 CIT 3676 (2)
Voya Target Index Solution Trust 2050 - Class 3 CIT 6527 (2)
Voya Target Index Solution Trust 2055 - Class 3 CIT 3677 (2)
Voya Target Index Solution Trust Income - Class 3 CIT
- 3678 (2)
Large Cap Value
Page 1 of 5
6.73
6.66
6.53
See Performance Introduction Page for Important Information
Investment Options
1-Mo
3-Mo
YTD
1-Yr
Company Stock
Voya Company Stock Fund - 6386
-7.68
-0.54
-7.68
14.93
Large Blend
Equity Index Non-Lendable Fund M - 3403
-3.00
-0.65
-3.00
14.19
17.42
-4.96
-2.14
-4.96
9.07
18.12
-0.51
0.36
-0.51
9.21
19.75
17.42
-4.51
-2.53
-4.51
-2.53
10.37
15.00
-1.91
0.23
-1.91
7.49
16.98
16.79
Small Growth
Voya SmallCap Opportunities Portfolio - Class I - 5007
-2.40
0.04
-2.40
6.75
15.88
Specialty - Real Estate
Voya Real Estate Fund - Class I - 5034
6.31
10.60
6.31
32.90
-4.00
-4.03
-12.85
-12.90
-4.00
-4.03
0.74
-2.07
0.22
0.49
Large Value
Robeco Boston Partners Large Cap Value Equity Fund
CIT - 3348
3-Yr
5-Yr
10-Yr
Incept
Fund
Gross
Inception Fund
Date
Exp %*
Net
Fund
Exp %*
20.47
10/01/2013
18.98
02/23/2009
0.03
0.03
17.78
07/01/2010
0.51
0.51
10/31/2001
0.56
0.56
12/15/2006
1.09
1.07
9.26
07/31/2002
0.06
0.06
17.98
10.27
05/06/1994
0.89
0.89
15.34
19.48
10.59
12/31/1996
0.91
0.91
-5.94
-5.97
10.46
10.52
5.55
5.60
-3.42
-5.08
06/30/1997
06/30/1997
0.74
-1.31
11.08
8.58
5.25
10/26/2001
0.95
0.95
-3.04
0.22
0.35
8.99
8.12
6.60
08/13/2001
0.35
0.35
-1.70
0.49
-0.26
9.50
09/30/2010
0.14
0.14
15.58
Large Cap Growth
Large Growth
T. Rowe Price Institutional Large-Cap Growth Fund 2467
9.42
Small/Mid/Specialty
Small Blend
Nuveen NWQ Small/Mid-Cap Value Fund - Class I 5014 (3)
SSgA Russell Small/Mid Cap Index Fund - Class C CIT
- 2945
4.22
Global / International
Company Stock
ING Group Company Stock Fund - 2884 (4)
ING Leveraged Company Stock Fund - 2885
Foreign Large Blend
Causeway International Value Fund - Institutional Class
- 5171
Foreign Large Growth
Vanguard® International Growth Fund - Admiral Shares
- 2190
Small Blend
NT Collective EAFE Index Fund DC Non Lending - Tier
One CIT - 2944
6.17
The risks of investing in small company stocks may include relatively low trading volumes, a greater degree of change in earnings and
greater short-term volatility.
Foreign investing involves special risks such as currency fluctuation and public disclosure, as well as economic and political risks.
Some of the Funds invest in securities guaranteed by the U.S. Government as to the timely payment of principal and interest; however,
shares of the Funds are not insured nor guaranteed.
High yielding fixed-income securities generally are subject to greater market fluctuations and risks of loss of income and principal than
are investments in lower yielding fixed-income securities.
Sector funds may involve greater-than average risk and are often more volatile than funds holding a diversified portfolio of stocks in
many industries. Examples include: banking, biotechnology, chemicals, energy, environmental services, natural resources, precious
metals, technology, telecommunications, and utilities.
*The Gross Expense Ratios shown do not reflect any temporary fee or expense waivers that may be in effect for a fund. The
performance of a fund with a temporary fee or expense waiver would have been lower if the gross fund fees / expenses listed had been
reflected.
Page 2 of 5
PERFORMANCE
UPDATE
VOYA 401(K) SAVINGS PLAN
Average Annual Total Returns as of: 12/31/2014
(shown in percentages)
Mutual funds offered through a retirement plan are investments designed for retirement purposes. Early withdrawals will reduce your
account value and if taken prior to age 59 1/2, a 10% IRS penalty may apply.
The performance data quoted represents past performance. Past performance does not guarantee future results. For monthend performance which may be lower or higher than the performance data shown please call 800-555-1899. Investment return
and principal value of an investment will fluctuate so that, when sold, an investment may be worth more or less than the
original cost.
The returns assume reinvestment of all dividends (ordinary income and capital gains) and are net of management fees and other fund
operating expenses.
Returns less than one year are not annualized. Fund Inception Date is the date of inception for the underlying fund, and is the date
used in calculating the periodic returns. This date may also precede the portfolio's inclusion in the product.
Investment Options
Incept
Fund
Gross
Inception Fund
Date
Exp %*
Net
Fund
Exp %*
1-Mo
3-Mo
YTD
1-Yr
3-Yr
5-Yr
10-Yr
0.22
0.65
2.50
2.50
2.87
3.20
3.71
0.13
1.57
5.99
5.99
5.91
6.96
6.69
03/31/2000
0.45
0.45
0.10
1.73
5.91
5.91
2.60
4.40
4.73
09/18/1995
0.07
0.07
-0.77
1.08
5.13
5.13
7.98
11/15/2012
0.08
0.08
-1.04
0.91
4.32
03/21/2014
0.08
0.08
-1.24
0.80
11.53
11/15/2012
0.08
0.08
-1.42
0.69
4.39
03/21/2014
0.08
0.08
-1.57
0.59
14.21
11/15/2012
0.08
0.08
-1.70
0.51
4.36
03/21/2014
0.08
0.08
-1.83
0.41
15.73
11/15/2012
0.08
0.08
-1.83
0.42
4.40
03/21/2014
0.08
0.08
-1.83
0.41
3.93
3.93
15.74
11/15/2012
0.08
0.08
-0.72
1.10
5.08
5.08
6.29
11/15/2012
0.08
0.08
1.15
8.12
19.78
19.78
30.06
10/01/2013
Stability of Principal
Stable Value
Stable Value Option - 2785 (1)
Bonds
Intermediate-Term Bond
Metropolitan West Total Return Bond Fund - Class I
Shares - 5329
Vanguard® Total Bond Market Index Fund - Institutional
- 799
Asset Allocation
Lifecycle
Voya Target Index Solution Trust 2015 - Class 3 CIT 3673 (2)
Voya Target Index Solution Trust 2020 - Class 3 CIT 6524 (2)
Voya Target Index Solution Trust 2025 - Class 3 CIT 3674 (2)
Voya Target Index Solution Trust 2030 - Class 3 CIT 6525 (2)
Voya Target Index Solution Trust 2035 - Class 3 CIT 3675 (2)
Voya Target Index Solution Trust 2040 - Class 3 CIT 6526 (2)
Voya Target Index Solution Trust 2045 - Class 3 CIT 3676 (2)
Voya Target Index Solution Trust 2050 - Class 3 CIT 6527 (2)
Voya Target Index Solution Trust 2055 - Class 3 CIT 3677 (2)
Voya Target Index Solution Trust Income - Class 3 CIT
- 3678 (2)
4.64
4.26
3.93
4.64
4.26
3.93
Large Cap Value
Company Stock
Voya Company Stock Fund - 6386
Large Blend
Page 3 of 5
See Performance Introduction Page for Important Information
Investment Options
1-Mo
3-Mo
YTD
1-Yr
3-Yr
5-Yr
Equity Index Non-Lendable Fund M - 3403
-0.26
4.93
13.65
13.65
20.37
15.43
0.12
5.54
11.30
11.30
22.22
-1.08
4.58
8.72
8.72
22.67
16.18
2.25
2.94
-0.38
-0.38
14.70
15.52
0.93
6.43
7.41
7.41
20.61
16.40
Small Growth
Voya SmallCap Opportunities Portfolio - Class I - 5007
1.82
8.41
5.62
5.62
19.16
Specialty - Real Estate
Voya Real Estate Fund - Class I - 5034
2.16
13.98
29.77
29.77
-10.90
-10.92
-8.45
-8.48
-7.41
-7.51
-3.84
-4.92
-4.65
-3.47
Large Value
Robeco Boston Partners Large Cap Value Equity Fund
CIT - 3348
10-Yr
Incept
Fund
Gross
Inception Fund
Date
Exp %*
Net
Fund
Exp %*
19.90
02/23/2009
0.03
0.03
19.48
07/01/2010
0.51
0.51
10/31/2001
0.56
0.56
12/15/2006
1.09
1.07
9.06
07/31/2002
0.06
0.06
17.69
10.11
05/06/1994
0.89
0.89
15.27
16.53
8.86
12/31/1996
0.91
0.91
-7.41
-7.51
21.03
21.20
5.54
5.63
-3.47
-5.12
06/30/1997
06/30/1997
-6.22
-6.22
13.18
7.80
5.10
10/26/2001
0.95
0.95
-2.93
-5.51
-5.51
11.82
6.95
6.35
08/13/2001
0.35
0.35
-3.62
-4.77
-4.77
11.22
09/30/2010
0.14
0.14
Large Cap Growth
Large Growth
T. Rowe Price Institutional Large-Cap Growth Fund 2467
9.10
Small/Mid/Specialty
Small Blend
Nuveen NWQ Small/Mid-Cap Value Fund - Class I 5014 (3)
SSgA Russell Small/Mid Cap Index Fund - Class C CIT
- 2945
4.87
Global / International
Company Stock
ING Group Company Stock Fund - 2884 (4)
ING Leveraged Company Stock Fund - 2885
Foreign Large Blend
Causeway International Value Fund - Institutional Class
- 5171
Foreign Large Growth
Vanguard® International Growth Fund - Admiral Shares
- 2190
Small Blend
NT Collective EAFE Index Fund DC Non Lending - Tier
One CIT - 2944
6.17
The risks of investing in small company stocks may include relatively low trading volumes, a greater degree of change in earnings and
greater short-term volatility.
Foreign investing involves special risks such as currency fluctuation and public disclosure, as well as economic and political risks.
Some of the Funds invest in securities guaranteed by the U.S. Government as to the timely payment of principal and interest; however,
shares of the Funds are not insured nor guaranteed.
High yielding fixed-income securities generally are subject to greater market fluctuations and risks of loss of income and principal than
are investments in lower yielding fixed-income securities.
Sector funds may involve greater-than average risk and are often more volatile than funds holding a diversified portfolio of stocks in
many industries. Examples include: banking, biotechnology, chemicals, energy, environmental services, natural resources, precious
metals, technology, telecommunications, and utilities.
*The Gross Expense Ratios shown do not reflect any temporary fee or expense waivers that may be in effect for a fund. The
performance of a fund with a temporary fee or expense waiver would have been lower if the gross fund fees / expenses listed had been
reflected.
Additional Notes
(1)The Stable Value Option for the Voya 401(k) Savings Plan expects to credit a net effective interest rate 2.89% for the period
beginning 01/01/2015 and ending 06/30/2015. The rate is subject to change periodically.
(2)Voya Collective Trust Funds: There is no guarantee that any investment option will achieve its stated objective. Principal value
fluctuates and there is no guarantee of value at any time, including the target date. The "target date" is the approximate date when an
investor plans to start withdrawing their money. When their target date is reached, they may have more or less than the original Voya
Target Solution Trust (the "Trust") amount invested. For each target date Trust, until the day prior to its target date, the Trust will seek to
provide total returns consistent with an asset allocation targeted for an investor who is retiring in approximately each Trust's designation
Page 4 of 5
See Performance Introduction Page for Important Information
Additional Notes
target year. The target year is specified in the Trust's name. For example, the Voya Target Solution 2045 Trust bears an asset allocation
that the investment adviser believes balances the risk and return objectives of the "average" investor who will be retiring in the year
2045. Prior to choosing a Target Solution Trust, investors are strongly encouraged to review and understand the Trust's objectives and
its composition of stocks and bonds, and how the asset allocation will change over time as the target date nears. No two investors are
alike and one should not assume that just because they intend to retire in the year corresponding to the target date that a specific Trust
is appropriate and suitable to their risk tolerance. It is recommended that an investor consider carefully the possibility of capital loss in
each of the target date Trusts, the likelihood and magnitude of which will be dependent upon the Trust's asset allocation. On the Target
Date the Trust's investment objective will be to seek to provide a combination of total return and stability of principal consistent with a
low to moderate risk asset allocation which is targeted to the "average" retiree.
(3)Nuveen NWQ Small/Mid-Cap Value Fund - Class I: The Fund's investment adviser has agreed to waive fees and/or reimburse
expenses through October 31, 2014 so that Total Annual Fund Operating Expenses (excluding 12b-1 distribution and/or service fees,
interest expenses, taxes, acquired fund fees and expenses, fees incurred in acquiring and disposing of portfolio securities and
extraordinary expenses) do not exceed 1.10% (1.45% after October 31, 2014) of the average daily net assets of any class of Fund
shares.
(4)The ING Group Company Stock Fund is invested in American Depositary Shares (ADSs) of ING Groep, N.V. It also holds a small
"cash" component that is used to accelerate and simplify daily transaction processing. The cash component is invested in short-term
interest-bearing instruments. In general, the risk associated with an investment in the stock of a single company is more concentrated
than the risk associated with an investment in a diversified portfolio of stocks. The market price for the ING ADRs may be volatile and
may be affected by, among other things, the depth and liquidity of the market for the ING ADRs, investors' perceptions of ING Groep,
N.V. and general economic and market conditions.
Insurance products, annuities and funding agreements issued by Voya Retirement Insurance and Annuity Company One Orange Way
Windsor, CT 06095, (VRIAC), which is solely responsible for meeting its obligations. Plan administrative services provided by VRIAC or
Voya Institutional Plan Services, LLC. All companies are members of the Voya family of companies. Securities are distributed by or
offered through Voya Financial Partners, LLC (member SIPC) or other broker-dealers with which it has a selling agreement.
The chart shows the performance for each investment option for the time periods shown.
Investment Options are listed in asset class order, each of which has unique risk characteristics.
Creation Date: Saturday, January 31, 2015
Page 5 of 5
© Copyright 2026
