
The globalization of technological innovation
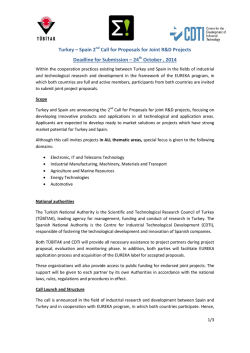
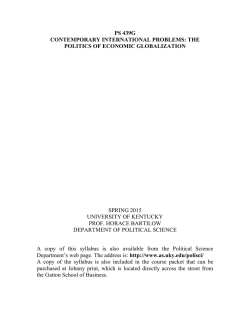
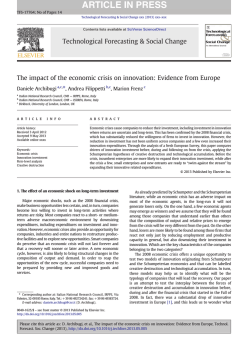
1 2 3 4 5 6 7 8 9 10 11 12 13 14 15 16 17 18 19 20 21 22 23 24 25 26 27 28 29 30 31 32 33 3411 35 36 37 38 39 40 41 42 43 44 olio Review of International Political Economy 9:1 March 2002: 98–122 The globalization of technological innovation: denition and evidence Daniele Archibugi* and Simona Iammarino** *Italian National Research Council and **University of Rome ‘La Sapienza’ A B ST R A C T The concept of globalization of innovation is the zip between two fundamental phenomena of modern economies: the increased international integration of economic activities and the raising importance of knowledge in economic processes. The paper singles out three different components of the globalization of innovation: (1) the international exploitation of nationally generated innovations; (2) the global generation of innovations by MNEs; and (3) global techno-scientic collaborations. Empirical evidence on these three categories is here presented, suggesting that the relevance of global forces in innovation is rapidly increasing, although at a different pace for each of the three ongoing processes. K E Y W OR D S Technological change; multinational corporations; strategic technology agreements. G LO B A L IZ A T IO N A N D IN N O V A TI ON The notion of globalization of innovation, similarly to that of nance, production, culture and information, is now diffuse. Scholars, governments and international organizations have attempted to assess the changes that have occurred in innovative activities due to an ever increasingly globalized society. Globalization is not a single phenomenon, but a catch-all concept to describe a wide range of forces. It has been dened very differently according to the social science within which it is applied. Paul Streeten (1996) has, half in jest, collected the various denitions in the literature. Here, we have applied a rather wide denition of globalization, which conforms to that provided by Giddens (1990: 64): ‘the intensication of world-wide social relations which link distant localities in such a way that local happenings are shaped by events occurring many miles away Review of International Political Economy ISSN 0969-2290 print/ISSN 1466-4526 online © 2002 Taylor & Francis Ltd http://www.tandf.co.uk DOI: 10.1080/09692290110101126 AR CHIBUGI A ND IAMMAR INO: TECHNOLOGICAL INNOVATION 1111 2 3 4 5 6 7 8 9 11110 11 12 13 14 15 16 17 18 19 11120 21 22 23 24 25 26 27 28 29 11130 31 32 33 34 35 36 37 38 39 11140 41 42 43 11144 and vice versa’. Thus, by ‘globalization’ we mainly refer to a high (and increasing) degree of interdependency and interrelatedness among different and geographically dispersed actors. In principle, therefore, there might be a higher globalization even with the same level of internationalization (Archibugi and Iammarino, 1998; Cantwell and Iammarino, 1998). The term is used to describe the phenomenon of ‘globalization’ experienced by the world of invention and innovation. Strictly speaking, the economic application of new ideas and knowledge is not only ‘technical’, insofar as it can also be organizational, managerial, institutional. The new ‘general purpose’ technologies such as ICTs, biotechnology, new materials, etc., have been shown to intensify the science–technology interface and to be inextricably associated with the complex processes of organizational, institutional and infrastructural change (Freeman, 1994). In its most modest use – which is also the easiest to be recorded and thus quantied – the expression ‘globalization of innovation’ is short hand for the increasing international scope of the generation and diffusion of technologies. That technology, in the sense of knowledge directed towards the solution of specic human problems, is transmitted from one culture to another or from one society to another, is certainly not a novelty. Even though learning processes are long and cumbersome, technological knowledge transmission among peoples has met less resistance than occurred in the cases of cultural, religious, social or political habits. Technology has always constituted a fertile meeting place for different societies. If the assimilation and transfer of technology required lengthy time spans in the past, today it takes place with a much higher intensity and speed. New technologies play a fundamental part in making globalization possible. Without aeroplanes, telephones, satellites, computers and televisions it would not be possible to transfer information from one place to another, thus allowing for the speed and the intensity which characterize the modern world. These give rise to a rate of diffusion and transfer of knowledge which is greatly superior to that of the past. In other words, it was the new technologies that allowed the emergence of the ‘global village’. The coming of a society based on knowledge has proceeded hand in hand with the enlargement of markets and the intensication of exchange. International trade and direct investments abroad have substantially increased, thus rendering the national economic systems increasingly integrated with each other. The pace of globalization and that of technological change have in fact been strictly interrelated and, from a long-term perspective, it appears less important to establish which one should be considered responsible for triggering the other rather than to establish that they mutually enforced each other. However, to what Folio 99 REVIEW OF INTERNA TIONAL POLITICAL ECONOMY 1111 2 3 4 5 6 7 8 9 11110 11 12 13 14 15 16 17 18 19 11120 21 22 23 24 25 26 27 28 29 11130 31 32 33 34 35 36 37 38 39 11140 41 42 43 11144 extent is the generation, transfer and diffusion of innovations transformed by the globalization which they themselves facilitate? The presumption here is that for many years there has been a circular process in which new technologies act as a ‘lubricant’ for economic and social globalization. In turn, globalization, while facilitating the circulation of people, goods, capital and above all, ideas and knowledge, allows for the sustenance of a historically unprecedented rate of technological change. The concept of globalization of innovation thus comes to be the zip between the two fundamental phenomena of modern economies: the increased international integration of economic activities and the raising importance of knowledge in economic processes. In this paper we present some indicators on the empirical relevance of the globalization of innovation among the most developed countries. Ultimately, the question we ask is: does the globalization of innovative activities exist and to what extent? We thought it appropriate to refer to a previously outlined taxonomy of the globalization of innovation (Archibugi and Michie, 1995) since we are convinced that this taxonomy is a useful lter through which to interpret the phenomenon considered here. Folio 100 A T A X ON O MY O F T HE G L OB A LI ZA T IO N O F IN NO V A T IO N Three main categories of the globalization of innovation were identied (Archibugi and Michie, 1995; 1997a): (1) the international exploitation of technology produced on a national basis; (2) the global generation of innovations; and (3) global technological collaborations. The three categories are complementary and not mutually exclusive, both at rm and country level. Firms, especially large ones, generate innovations in all different ways described here. From a historical point of view, these categories emerged in three successive stages, even though the second and the third added to, rather than substituted for the oldest one. The categories of this taxonomy are contained in Figure 1. The international exploitation of technology produced on a national basis The rst category includes innovators’ attempts to obtain economic advantages through the exploitation of their own technological competence in markets other than the domestic one. We have preferred to label this category as ‘international’ rather than ‘global’ as the actors introducing the innovations preserve in the main their national identity, even when the innovations are diffused and sold in multiple countries or the necessary knowledge has been sourced elsewhere. Clearly, the distinction AR CHIBUGI A ND IAMMAR INO: TECHNOLOGICAL INNOVATION 1111 2 3 4 5 6 7 8 9 Categories Actors Forms International exploitation of nationally produced innovations Profitseeking firms and individuals Exports of innovative goods Cession of licenses and patents Foreign production of innovative goods internally designed and developed Global generation of innovations Multinational firms R&D and innovative activities both in the home and the host countries Acquisitions of existing R&D laboratories or green-field R&D investment in host countries Global techno-scientific collaborations Universities and public research centres Joint scientific projects Scientific exchanges, sabbatical years International flows of students National and multinational firms Joint-ventures for specific innovative projects Productive agreements with exchange of technical information and/or equipment Figure 1 A taxonomy of the globalization of innovation 11110 11 Source: Elaboration on Archibugi and Michie (1995) 12 13 14 15 16 101 17 REVIEW OF INTERNA TIONAL POLITICAL ECONOMY 1111 2 3 4 5 6 7 8 9 11110 11 12 13 14 15 16 17 18 19 11120 21 22 23 24 25 26 27 28 29 11130 31 32 33 34 35 36 37 38 39 11140 41 42 43 11144 between ‘international’ and ‘global’ becomes rather blurred when taking into account the huge intra-rm share of international trade and the increasing relevance of Global Production Networks. However, this conrms once more the differentiation between ‘internationalized’ activities (carried out in more than one country) and ‘globalized’ processes (interdependent and integrated across space). Firms have incentives to expand their market range but their products might be unwelcome in host countries. Innovative products are often admitted into importing countries in the temporary absence of satisfactory internal surrogates when they represent radical advances; for example, at the beginning of the 1960s, many countries did their best to import the rst computers. Such innovative products do not compete with those of local rms in the short run. A non-hostile receipt of innovative products is all the more likely the more similar the income level and the closer the commercial integration between the innovating country and the importing country. Both the exporting economy and the importing one have an interest in the exchange of products (starting from those with a higher innovative content), if such an exchange occurs within a framework of comparative advantages and for products with similar technological intensity. However, as soon as the rms of two countries are able to produce similar products, competition tends to be far ercer than that typically encountered for traditional products, as innovative goods are deemed to be of strategic importance (cf. Pianta, 1988; Tyson, 1992; Scherer, 1992). Competitive struggles today involve semiconductors and aeroplanes much more than corn, wine and potatoes. Besides, it is easily predictable that international rivalry will involve more and more technology-intensive elds. International trade is not the only way through which an innovative rm can benet from its technological competence: it is possible that the innovator nds it more advantageous to sell the innovation disembodied, i.e. to licence it to foreign rms. This strategy is all the more convenient when there are various types of obstacles to international trade as for example in the case of: (1) high transportation costs; (2) barriers to imports; (3) high wage differentials between the innovating country and the importing country, which would render the cost of the new product too high for the income level of the imitating country. However, it is not always possible to licence technology to third countries. In order for a market for disembodied technology to exist, such a technology should be of a codied nature and the acquiring country should have an adequate capacity to absorb it (Bell and Pavill, 1997). To be effective, the transfer of technology, especially from North to South, needs more stringent co-operation forms such as those described in the third category of the taxonomy (technological collaborations). Folio 102 AR CHIBUGI A ND IAMMAR INO: TECHNOLOGICAL INNOVATION 1111 2 3 4 5 6 7 8 9 11110 11 12 13 14 15 16 17 18 19 11120 21 22 23 24 25 26 27 28 29 11130 31 32 33 34 35 36 37 38 39 11140 41 42 43 11144 Another signicant way of exploiting innovations in foreign markets is through foreign direct investment (FDI). The conditions allowing international production are known: availability of capital, a willingness to geographically exploit ownership, technological and organizational advantages are required on behalf of the investing rm (Dunning, 1993). Economic and institutional stability and a sufcient level of economic development, or, in other words, location advantages, are required on behalf of the host country. It should be remembered that this rst category only includes the productive activity operated in host countries which does not entail the creation of additional local technological capacity; if this were to be the case, we would be moving from the rst to the second category of this taxonomy. Folio 103 The global generation of innovations The second category is the global generation of innovations, which includes innovations conceived on a global scale from the moment they are generated. Only innovations created by multinational enterprises (MNEs) are contained in this category. With very few exceptions (such as Shell and Unilever), it is easy to identify the country of origin of such companies, so much that to some they appear as national enterprises with multinational operations (Hu, 1992). MNEs have often their own internal innovative network with units based in different countries. An efcient management of these geographically dispersed R&D and technical centres would imply that these centres do not simply provide inputs to the local production units, but that they are integrated into the overall innovative strategy of the MNEs. A substantial body of theoretical and empirical research has investigated how companies organize their internal innovative centres (Howells, 1997; Pearce and Singh, 1992; Florida, 1997; Grandstrand et al., 1992; Zander, 1999). Bartlett and Ghoshal (1990) have singled out three main strategies which can be implemented by MNEs, whose signicance varies across countries, industries and companies: Centre-for-global This is the traditional ‘octopus’ view of the multinational corporation: a single ‘brain’ located within the company headquarters concentrates the strategic resources (top management, planning and technological expertise) and distributes impulses to the ‘tentacles’ (that is, the subsidiaries) scattered across host countries. Even when some R&D is undertaken abroad, this is basically concerned with adapting products to the needs of the local users. REVIEW OF INTERNA TIONAL POLITICAL ECONOMY 1111 2 3 4 5 6 7 8 9 11110 11 12 13 14 15 16 17 18 19 11120 21 22 23 24 25 26 27 28 29 11130 31 32 33 34 35 36 37 38 39 11140 41 42 43 11144 Local-for-local Each subsidiary of the rm develops its own technological know-how to serve local needs. The interactions among subsidiaries are, at least from the viewpoint of developing technological innovations, rather weak. One the contrary, subsidiaries are integrated into the local fabric. This may occur with conglomerate rms, but also in the case of MNEs which follow a strategy of technological diversication through tapping into the competence of indigenous rms. Folio 104 Local-for-global This is the case of multinational corporations which, rather than concentrating their technological activities in the home country, distribute R&D and technological expertise in a variety of host locations. This allows the company to develop each part of the innovative process in the most suitable environment: semiconductors in Silicon Valley, automobile components in Turin, software in India. The effectiveness of such a strategy relies on the intensity of intra-rm information ows. In general, it has been increasingly observed the emergence of the trend for MNEs to establish internal (intra-rm) and external (inter-rm) networks for the generation of technological innovation. Indeed, it has been the development of such cross-border corporate integration and intra-border inter-rm relationships – as new forms of technological governance – to make consider the MNE as the key-ring between the ‘local’ and the ‘global’ (Cantwell and Iammarino, 2001). The global technological collaborations In recent times, a third type of globalization of innovative activities has made a forceful entry on the scene. This, in some ways, is intermediate to the two preceding categories. Technological collaborations occur when two (or more) different rms decide to establish a joint venture with the aim of developing technical knowledge and/or products. Three conditions need to be respected: (1) the joint venture should be something more than an occasional and informal collaboration; (2) rms preserve their ownership; and (3) the bulk of the collaboration is related to sharing know-how and/or the generation of new products and processes (Mowery, 1992). We have witnessed an increasing number of agreements between rms for the communal development of specic technological discoveries (Hagedoorn and Schakenraad, 1993). Such collaborations often take place among rms of the same country, but in many cases they involve rms located in two or more countries, thus emerging as authentically global. These forms of collaboration for technological advances have promoted a variety of mechanisms for AR CHIBUGI A ND IAMMAR INO: TECHNOLOGICAL INNOVATION 1111 2 3 4 5 6 7 8 9 11110 11 12 13 14 15 16 17 18 19 11120 21 22 23 24 25 26 27 28 29 11130 31 32 33 34 35 36 37 38 39 11140 41 42 43 11144 the division of costs and the exploitation of results. In a way, the necessity to reduce the costs of innovation – and to cope with its increasing complexity – has created new industrial organization forms and new ownership structures, which today are expanding beyond the simple technological sphere (Dodgson, 1993). However, it was not the private sector that discovered this form of knowledge transmission. The academic world has always had a transnational radius of action: knowledge is traditionally transmitted from one scholar to another and thus disseminated without always requiring pecuniary compensation. Folio 105 EM PI R IC A L R E LE V A N C E OF T H E T H R EE D IM E NS IO N S O F T HE G L OB A LI ZA T IO N O F IN N OV A T IO N How important are the three aspects of the globalization of innovation identied above? And, more importantly, what are the tendencies currently predominating? In order to answer these questions it is necessary to nd appropriate measuring devices. None of the available indicators entirely represents the three aforementioned categories. Some indicators do not represent them totally (in the sense that they exclude signicant parts of the phenomenon), others do not represent them exclusively (in the sense that they include phenomena that are not part of the object treated). There are further indicators that represent the phenomenon neither totally nor exclusively. In spite of these limitations, this section reviews the available empirical evidence. The evidence on the international exploitation of technology The rst indicator of international exploitation of technology is represented by international trade ows. Although this is a heterogeneous indicator, which includes both innovative and non-innovative products, it is clear that trade is a fundamental means for the international diffusion of innovations, especially embodied innovations. During the post-war period, trade has been growing constantly: the export ratio of goods and services to GDP in advanced countries went from 9.4 percent in 1970 to 20.9 percent in 1995 (OECD, 1996a). While all categories of commodities embody knowledge, this is greater in sectors with the highest technological content. Indeed, as shown by Guerrieri and Milana (1995), the sectors in which trade has grown most rapidly are those with the highest technological content. Among these, the electronics industry is outstanding, as its growth rate has been double with respect to that of total manufacturing. As a whole, high tech products, which constituted 9.5 percent of world trade in 1970, represented more than 29 percent in 1995 (Guerrieri, 1999). The technology–trade causal relationship is REVIEW OF INTERNA TIONAL POLITICAL ECONOMY 1111 2 3 4 5 6 7 8 9 11110 11 12 13 14 15 16 17 18 19 11120 21 22 23 24 25 26 27 28 29 11130 31 32 33 34 35 36 37 38 39 11140 41 42 43 11144 often a two-way one (Pietrobelli and Samper, 1997). On the one hand, technological competence has a positive impact on exports and competitiveness; on the other, international trade boosts the generation and the transfer of innovations, thus giving rise to cumulative causation mechanisms. Figures 2 and 3 show that the correlation between the R&D intensity (measured by the ratio R&D/value added) and the degree of internationalization (measured by the ratio exports/value added) for the six most industrialized countries was remarkably higher in 1996 than in 1975, conrming that the link between technological intensity and internationalization has been considerably strengthened over time. Science-based sectors – such as Aircraft (ISIC 3845), Professional Goods (ISIC 385) and especially Ofce and Computing Machinery (ISIC 3825) – show a remarkable increase in the degree of internalization, endorsing also the fact that the technology–trade relationship holds particularly for technology-intensive areas of production (see also Daniels, 1997). The notable exception is Drugs and Medicines (ISIC 3522). In this sector, a stronger technological intensity does not correspond to an increase in internationalization: the position of the sector with respect to the X-axis remained basically unchanged over the two decades. This is likely to be due to the fact that the international exploitation of technological capabilities in this sector takes place mainly through foreign direct investment. The number of patents registered abroad can be considered an indicator of the will to exploit in foreign markets innovations both embodied in products (a product is patented in order to prevent others from producing a similar good and thus to cover all the existing market) and disembodied (an innovation is patented in order to licence it). Table 1 reports the annual rates of growth of selected technological indicators for the main OECD countries in two different periods. It shows that industrial R&D and resident patents (i.e. the patent applications of the inventors in their home country) have grown at a moderate pace, and sometimes have even experienced a negative rate of change. On the contrary, non-resident patents (i.e. the patent applications of foreign inventors in the country, which show to what extent a country has been ‘invaded’ by foreigners) and external patents (i.e. national inventors patenting abroad, which show to what extent a country is ‘invading’ other countries) have registered remarkable rates of growth, particularly during the most recent decade (1987–97). Table 2 reports further elaboration on the same data. The rst two columns show the average number of external patents for each resident patent in 1987 and 1997. Each patent application can in fact be extended in several countries. While a patent application was extended, on average, in 1.3 countries in 1987, it was extended in as many as 6.2 countries in 1997 (OECD, 2000a). This is not necessarily due to the increase of resources devoted to science and technology. As shown in columns 5 Folio 106 AR CHIBUGI A ND IAMMAR INO: TECHNOLOGICAL INNOVATION Folio 1975 0.4 RSq = 0.3280 through origin 3845 0.3 R&D/value added 1111 2 3 4 5 6 7 8 9 11110 11 12 13 14 15 16 17 18 19 11120 21 22 23 24 25 26 27 28 29 11130 31 32 33 34 35 36 37 38 39 11140 41 42 43 11144 3825 3832 0.2 3522 0.1 383–3832 351+352 385 353+354 355+356 0.0 0.0 36 381 361 0.2 3842 3 32 0.4 372 0.6 371 382+3825 0.8 3842+384 3841 1.0 1.2 1.4 1.6 1.8 Exports/value added Figure 2 R&D intensity and internationalization. Note: All variables calculated at constant US$ and PPP. Source: OECD STAN Database, 1999; OECD R&D Expenditure in Industry; OECD Basic Science and Technology Statistics, 2000. Key: Sectors 3000 Total manufacturing 3825 Ofce & computing machinery 31 Food, beverages & tobacco 383–3832 Electrical machinery – 32 Textiles, apparel & leather radio, TV & communication 352+351–3522 Industrial chemicals + equipment (other chemicals – drugs & 3832 Radio, TV & communication medicines) equipment 3522 Drugs & medicines 3841 Shipbuilding & repairing 353+354 Petroleum reneries + 3843 Motor vehicles petroleum & coal products 3845 Aircraft 355+356 Rubber products + 3842+3844+3849 Railroad equipment plastic products + motorcycles & bicycles + 36 Non-metallic mineral products transport equipment nec 371 Iron & steel 385 Professional goods 372 Non-ferrous metals Countries 381 Metal products France, Germany, Italy, Japan, UK, US 382–3825 Non-electrical machinery – ofce & computing machinery 107 REVIEW OF INTERNA TIONAL POLITICAL ECONOMY Folio 1996 0.4 3845 RSq = 0.6674 through origin 0.3 R&D/value added 1111 2 3 4 5 6 7 8 9 11110 11 12 13 14 15 16 17 18 19 11120 21 22 23 24 25 26 27 28 29 11130 31 32 33 34 35 36 37 38 39 11140 41 42 43 11144 3522 3832 3825 385 0.2 3843 3842+384 0.1 351+352 3 0.0 0.0 365 31 0.2 353+354 355+356 381 372 382–3825 32 371 0.4 3841 383–3832 0.6 0.8 1.0 1.2 1.4 1.6 Exports/value added Figure 3 R&D intensity and internationalization Note: All variables calculated at constant US$ and PPP. Source: OECD STAN Database, 1999; OFCD R&D Expenditure in Industry; OECD Basic Science and Technology Statistics, 2000. Key: Sectors 3000 Total manufacturing 31 Food, beverages & tobacco 32 Textiles, apparel & leather 352+351–3522 Industrial chemicals + (other chemicals – drugs & medicines) 3522 Drugs & medicines 353+354 Petroleum reneries + petroleum & coal products 355+356 Rubber products + plastic products 36 Non-metallic mineral products 371 Iron & steel 372 Non-ferrous metals 381 Metal products 382–3825 Non-electrical machinery – ofce & computing machinery 3825 Ofce & computing machinery 383–3832 Electrical machinery – radio, TV & communication equipment 3832 Radio, TV & communication equipment 3841 Shipbuilding & repairing 3843 Motor vehicles 3845 Aircraft 3842+3844+3849 Railroad equipment + motorcycles & bicycles + transport equipment nec 385 Professional goods Countries France, Germany, Italy, Japan, UK, US 108 2.0 6.1 9.8a 6.7c 3.8 6.8c 3.7 4.9a n.a. 5.2c 3.6 1.4 4.6d 12.7 5.9c 3.0b 7.3 0.8a n.a. 5.5 1970–80 2.4 3.8 4.6e 2.9 5.8 6.8 2.0 0.4 6.1f 13.7 –0.7 1.2 6.2f 4.1 4.5 –0.1 1.7 –0.1g 7.4 4.1 1987–97 Industrial R&D (1) d 1985–93 e 5.2 1.1 –1.9 1.5 2.6 2.3 0.4 3.1 –12.4j 1.1 –1.7k 0.7 1.5 2.4 1.5 –1.0 2.9 –3.4 1.4 2.7 1987–97 1971–80 –2.0 5.1 0.3 –3.0 1.7 4.7 –2.4 –0.7 –0.8 6.8 n.a. –2.1 –6.4 –4.5 –0.5 –2.4 –2.7 –3.1 5.2 –1.1 1970–80 Resident patents (2) Notes: b c n.a. = not available a1970–81 1972–81 1971–81 m 1992–97 (1) Million US$ at 1995 PPP (2) Resident patents: inventors in their home country (3) Non-resident patents: foreign inventors in the country (4) External patents: national inventors patenting abroad Source: Calculations on OECD, MSTI (2000). US Japan Austria Belgium Denmark Finland France Germany Greece Ireland Italy Netherlands Portugal Spain Sweden UK Norway Switzerland Australia Canada Countries f 1986–97 5.0 –0.8 3.4 –0.1 –0.3 0.7 0.2 0.8 2.4 4.9 n.a. 1.5 –0.5 0.2 2.5 0.8 –0.1 2.2 –2.0 –2.1 1970–80 g 1986–96 5.0 6.6 11.6 10.5 24.2 25.9 6.3 6.1 19.8 35.8 8.2m 9.1 38.7 13.5 9.9 6.0 13.2 10.2 9.8 6.0 1987–97 Non-resident patents (3) Annual average growth rates (percent) Table 1 Rates of growth of industrial R&D and patenting in the OECD countries. j 1987–96 k 22.1 14.1 13.6 17.0 24.4 27.3 13.6 13.0 24.2 22.9 12.8 18.5 17.6 23.1 21.9 18.6 34.8 13.4 18.6 25.2 1987–97 1992–96 –0.6 5.5 1.4 0.5 1.0 5.7 3.0 1.7 n.a. 6.7 1.8 0.1 –24.2 1.3 3.0 –1.7 0.8 –1.3 6.7 –0.5 1970–80 External patents (4) AR CHIBUGI A ND IAMMAR INO: TECHNOLOGICAL INNOVATION REVIEW OF INTERNA TIONAL POLITICAL ECONOMY 1111 2 3 4 5 6 7 8 9 11110 11 12 13 14 15 16 17 18 19 11120 21 22 23 24 25 26 27 28 29 11130 31 32 33 34 35 36 37 38 39 11140 41 42 43 11144 Folio Table 2 Relation between industrial R&D, resident, non-resident and external patents. OECD countries, 1987, 1997. Countries External patents (4) ÷ Non-resident patents (3) ÷ Resident patents (2) ÷ External Patents (4) ÷ Resident patents (2) Resident patents (2) Industrial R&D (1) Industrial R&D (1)* 1987 US Japan Austria Belgium Denmark Finland France Germany Greece Ireland Italy Netherlands Portugal Spain Sweden UK Norway Switzerland Australia Canada 2.7 0.3 2.8 5.8 5.8 3.1 3.7 3.5 0.2 1.3 n.a. 7.7 1.6 1.4 4.9 2.4 2.7 7.1 2.0 3.6 1997 1987 1997 14.8 1.1 13.9 35.3 46.4 34.5 14.0 10.1 5.4 11.9 12.1 43.5 8.5 9.7 38.6 17.6 50.0 37.9 9.2 35.4 0.95 0.93 0.11 0.19 10.95 45.07 36.92 93.26 7.62 61.98 3.49 34.12 3.74 6.99 1.46 1.99 7.32 127.73a 3.96 102.08 n.a. 10.14a 14.02 34.01 37.02 1148.22 12.43 38.31 8.31 20.12 2.62 5.52 8.37 23.93 7.54 31.87 2.07 4.97 10.53 14.81 1987 0.6 7.4 2.5b 0.3 1.2 2.0 1.0 1.2 17.0c 3.7 n.a. 0.7 0.6c 1.1 1.2 1.4 1.0 1.1c 4.7 0.6 1997 0.8 5.5 1.4d 0.3 0.9 1.3 0.8 1.6 2.2 1.0 1.1e 0.6 0.4 0.9 0.8 1.3 1.1 0.7f 2.5 0.5 1987 1997 1.5 2.2 7.0b 2.6 7.4 6.3 3.5 4.5 2.2 5.5 3.6 5.2 1.2 1.5 6.3b 3.5 2.9b 7.3 8.7 1.8 11.2 6.3 n.a. 11.0 44.4 45.3 10.7 16.5 13.2 13.4 13.7 29.9 4.5g 9.1 35.6g 22.8 66.4g 29.3 23.9 14.3 Notes: c d n.a. = not available a1996 b1985 for R&D 1986 for R&D 1993 for R&D e g 1993 for patents f1996 for R&D 1995 for R&D (1) Million US$ at 1995 PPP (2) Resident Patents: inventors in their home country (3) Non Resident Patents: foreign inventors in the country (4) External Patents: national inventors patenting abroad * External Patent Applications in year t divided by industrial R&D in year t-1 Source: Calculations on OECD, MSTI (2000). and 6, the ratio of resident patents per unit of industrial R&D declined from 1987 to 1997 in almost all countries (with the notable exceptions of the US, Germany and Norway, where the increase was anyway negligible). On the contrary, the ratio of external patents per unit of industrial R&D grew dramatically in the same period (see columns 7 and 8 of Table 2). Columns 3 and 4 report the ratio between non-resident and resident patents. A ratio equal to 1 shows that the number of patented 110 AR CHIBUGI A ND IAMMAR INO: TECHNOLOGICAL INNOVATION 1111 2 3 4 5 6 7 8 9 11110 11 12 13 14 15 16 17 18 19 11120 21 22 23 24 25 26 27 28 29 11130 31 32 33 34 35 36 37 38 39 11140 41 42 43 11144 inventions generated in the country is equal to the number of foreign inventions for which patent protection is sought in the country. In small countries foreign patents strongly outnumber the domestic ones; only Japan and the US have a number of domestic patents which is greater than the foreign one. With the exception of the latter country, all economies increased their dependency from abroad in the period 1987–97. US inventors and rms have considerably increased their penetration in external markets, as shown by the doubling of the ratio of external to resident patents. The same ratio is particularly high for technologically dynamic small and medium sized countries, such as the Netherlands, Denmark, Belgium, Switzerland and all the Scandinavian economies. The case of Japan is not particularly signicant: the country has a large number of domestic inventions, since its patent system is not comparable to that of other countries. The Technology Balance of Payments (TBP) – which reports data on nancial ows connected to the use of patents, licences, trademarks, inventions, etc. – is another indicator of the increased internationalization of innovative activities, especially of disembodied technical know-how. The nancial transactions measured by the TBP include those occurring both between different rms and between different subsidiaries of the same multinational corporation. International exchanges of technological know-how and services have increased with respect to the internal business R&D expenditure (cf. OECD, 1999a). With the notable exception of Japan and France, both payments and receipts for technology recorded substantial annual rates of growth in the period 1987–97 – 10.8 percent and 13.8 percent respectively on average for the G6 (OECD, 2000a). This suggests a growing interdependence between the national-based innovative activities and the transfer/acquisition of technology to and from abroad. What are the reasons underlying the substantial increase of the need for innovative rms to extend the geographical dimension of their market? This seems to be directly linked to the increasing costs of innovation on the one hand, and to the reduction in the life cycle of products on the other. Given that innovations are becoming increasingly costly and rapidly obsolete, innovators must be in the position to commercialize them in increasingly large markets. From a geographical point of view, as we have seen, the countries which are most involved in this form of globalization are the smallest and the most technologically dynamic – in other words, those showing a higher degree of international integration. The limited dimension of their domestic market, in fact, has always induced rms to search abroad for a market for their products, in particular for products requiring higher investment. Small and medium sized countries have greater difculties in promoting innovative programmes on a large scale, unless they have Folio 111 REVIEW OF INTERNA TIONAL POLITICAL ECONOMY 1111 2 3 4 5 6 7 8 9 11110 11 12 13 14 15 16 17 18 19 11120 21 22 23 24 25 26 27 28 29 11130 31 32 33 34 35 36 37 38 39 11140 41 42 43 11144 access (guaranteed, whereas possible, by intergovernmental agreements or by the existence of customs unions) to foreign markets (Molero, 1995). Folio 112 The evidence on the global generation of innovations This category only includes multinational enterprises and, depending on the strategy they follow, their efforts to generate innovations combining the expertise of their afliates in more than one foreign location. A rst indicator of this category is represented by the distribution of MNEs’ R&D between the home and the host country: the data for selected countries are reported in Table 3. Columns 1 and 2 report the distribution of R&D in manufacturing performed within each country by type of ownership of the rm (foreign or national). This shows to what extent countries have been ‘attractive’ for R&D-related foreign direct investment. The data show that the R&D performed by foreign subsidiaries accounts for more than 20 percent of total R&D in manufacturing in Canada, the Netherlands and the UK. The role of foreign rms is equally signicant in the majority of advanced economies. The only country with a very low share of R&D performed by foreign rms is Japan; in this country as much as 99 percent of R&D in manufacturing is nanced by Japanese-owned companies. Table 3 Distribution and intensity of R&D in manufacturing industries by National Firms and Foreign Afliates. Main OECD countries, 1996 and 1994. % of National total 1996 Countries US Japan Germany France UK Netherlands Sweden Finland Canada Foreign afliates National rms 12.0 0.9 16.4(1) 18.6 39.5 24.0 18.7 11.5(4) 40.3 88.0 99.1 83.6(1) 81.4 60.5 76.0 81.3 88.5(4) 59.7 Notes: (1) 1995 (2) 1991 (3) 1993 (4) 1997 * Ratio between R&D expenditure and turnover Source: OECD, 1999b. R&D intensities* 1994 Foreign afliates 2.5 1.2 3.2 1.8(2) 1.5 0.8(3) 2.4 2.6 0.9 National rms 2.5 2.5 6.3 2.7(2) 1.9 2.7(3) 3.8 2.5 1.7 AR CHIBUGI A ND IAMMAR INO: TECHNOLOGICAL INNOVATION 1111 2 3 4 5 6 7 8 9 11110 11 12 13 14 15 16 17 18 19 11120 21 22 23 24 25 26 27 28 29 11130 31 32 33 34 35 36 37 38 39 11140 41 42 43 11144 To a large extent, there is a link between R&D and the production of MNEs’ foreign afliates, although this is far from being uniform across countries. Columns 3 and 4 of Table 3 report the R&D intensities (i.e. the ratio of R&D expenditure to turnover) of foreign afliates and national rms. While in the US national and foreign afliated have the same propensity to invest in R&D, in all other countries, with the exception of Finland, the propensity of foreign afliates to nance R&D is much lower than for national rms. National governments are particularly interested to acquire such information, since this allows them to know if inward foreign direct investment contributes on a par with domestic capital to the creation of the national technological competence (for the policy implications of the globalisation of innovation see Archibugi and Iammarino, 1999). Overall, the data conrm the widespread belief that, in the 1990s, MNEs were still more prone to locate their R&D facilities in the home country, rather than in foreign locations. So far, we have looked at the inward ows of investment in R&D. A specular perspective is represented by the outward ows of R&D investment. Unfortunately, these data are not available for all countries. However, the US government, since the 1960s, has collected data on the R&D performed abroad by its MNEs, because of the general concern that skill-intensive jobs could be displaced abroad. These data show that, on average, over the 1990s slightly more than 10 percent of the R&D of US rms is executed abroad and that the share has slightly increased over time (NSF, 2000; Dalton and Serapio, 1995). Outward ows of investment related to the generation of innovation can also be identied by looking at the patents owned by multinational corporations but generated in host countries. This allows us to take into account a larger number of countries. Each patent record provides information on the address of the inventor and the name of the owner (which in most cases is a corporate group), thus allowing the identication of the geographical location of both of them. On the basis of a signicant sample of large innovative rms during the period 1992–96, Patel and Vega (1997) showed that 87.4 percent of their patented inventions was generated in the rm’s country of origin and only 12.6 percent in subsidiaries located abroad (see Table 4). Although there is an increase between 1979–84 and 1992–96 (see also Patel, 1995), this is not sufcient to state a radical intensication of the phenomenon. However, as already shown by R&D data, there are signicant crosscountry differences. Large Japanese rms generate 97.4 percent of their patented inventions in their country, whereas American rms concentrate in the US a relatively smaller share (92 percent). European rms show a greater tendency towards decentralization: considering Europe as a ‘single market’, the share of patents generated outside the continent Folio 113 REVIEW OF INTERNA TIONAL POLITICAL ECONOMY 1111 2 3 4 5 6 7 8 9 11110 11 12 13 14 15 16 17 18 19 11120 21 22 23 24 25 26 27 28 29 11130 31 32 33 34 35 36 37 38 39 11140 41 42 43 11144 Folio Table 4 Geographic location of the US patenting activity of large rms according to their country of origin, 1992–96 (percentage shares). Of which, hosted in Nationality Home Abroad US Japan Europe US Japan Europe Germany, F.R. France UK Italy Netherlands Belgium Sweden Austria Finland Switzerland Norway All Companies 92.0 97.4 77.3 78.2 65.4 47.6 77.9 40.1 33.2 64.0 90.6 71.2 42.0 63.0 87.4 8.0 2.6 22.7 21.8 34.6 52.4 22.1 59.9 66.8 36.0 9.4 28.8 58.0 37.0 12.6 – 1.9 21.1 14.1 18.9 38.1 12.0 30.9 14.0 19.4 2.2 5.2 31.2 1.5 5.5 1.1 – 0.6 0.7 0.4 0.5 0.0 0.9 0.0 0.2 0.0 0.0 0.9 0.0 0.6 5.3 0.6 – 6.5 14.2 12.0 9.5 27.4 52.6 14.2 7.2 23.5 25.0 33.3 5.5 Source: Patel and Vega (1997) is equal to 22.7 percent. Looking at individual countries, the propensity of rms to generate innovations abroad is even greater: large rms based in Belgium, the Netherlands, Switzerland and the UK have more than a half of their patents in their subsidiaries abroad. German, Italian, French, Swedish and Norwegian multinationals, on the contrary, have a larger share of their innovations produced at home. Using the same data, Cantwell (1995) and Cantwell and Kosmopoulou (2000) also considered long-term trends. They showed that the innovative activities carried out in the subsidiaries located abroad of a sample of North American and European rms more than quadrupled, going from 4 percent in the period 1920–24 to 16.5 percent in the period 1991–95. The analyses of Cantwell and Patel and Vega also allow the identication of the countries in which such rms tend to decentralize their innovative activities. At an aggregate level, more than 90 percent of such activities is hosted by the US, Western Europe and Japan, conrming that the globalization of innovation by multinational rms has rather to be seen as a process of ‘triadisation’. Not even the East Asian dynamic economies have managed to absorb a substantial share of multinationals’ R&D. As far as the sectoral dimension if concerned, rms operating in industries with higher technological opportunities (Computers, Scientic 114 AR CHIBUGI A ND IAMMAR INO: TECHNOLOGICAL INNOVATION 1111 2 3 4 5 6 7 8 9 11110 11 12 13 14 15 16 17 18 19 11120 21 22 23 24 25 26 27 28 29 11130 31 32 33 34 35 36 37 38 39 11140 41 42 43 11144 Instruments, Aeronautics, Motor Vehicles) show a strong propensity to concentrate their technological activities in their country of origin. The rms with the greatest innovative activity in host countries are those belonging to traditional sectors: drink and tobacco, food, building materials, other transport, mining and petroleum industries (cf. Patel, 1995, tab. 6: 150; Pavitt and Patel, 1998). In the case of natural resources, this tendency can be explained by the necessity to situate technological activities locally. But also many industries producing consumer goods need technological competence in the country of production, in order to satisfy both consumer tastes and national legislative standards. An intermediate case is represented by pharmaceutical and chemical rms, in which the propensity towards the global generation of innovations is above the average. This might be related to institutional factors rather than strictly technological ones: it is convenient for rms which are constrained by governmental regulations, such as the pharmaceutical producers, to perform their R&D activities locally, so that their products can conform to national standards and satisfy the needs of special ‘clients’ such as the governments (Håkanson, 1992). The empirical evidence considered up to this point has concentrated on two indicators, R&D and patents, which capture the most important and codied technological activities. However, a question emerges as to whether the globalization of multinational enterprises is greater for technological activities which are less formal but equally important for the rms’ competitive strategy. Multinational corporations, in fact, transfer knowledge to subsidiaries at more than one level. These activities include technical assistance, the often informal exchange of techno–scientic information, the transmission of organizational and managerial methods, etc. They are connected to production, and it is thus reasonable to assume that they should be directly related to direct investment abroad both in production and innovation. It is worth noting, moreover, that the reported indicators capture only a small part of innovations in a sector which is becoming both increasingly important in technological change and globalized: software. As it is transferred at very low cost, some rms have a tendency to subcontract it to centres in countries with much lower labour costs than their own (Antonelli, 1991) and to satisfy their own software needs by tight interactions between headquarters, subsidiaries and specialized suppliers. However, there is still no empirical research quantifying the importance of such a phenomenon. We may conclude that each member of the triad is differently affected by this form of globalization of innovation. Japan does not participate substantially to the global generation of innovation: on the one hand, foreign rms are still reluctant to locate R&D facilities in Japan, on the other hand, Japanese rms are reluctant to decentralize R&D facilities Folio 115 REVIEW OF INTERNA TIONAL POLITICAL ECONOMY 1111 2 3 4 5 6 7 8 9 11110 11 12 13 14 15 16 17 18 19 11120 21 22 23 24 25 26 27 28 29 11130 31 32 33 34 35 36 37 38 39 11140 41 42 43 11144 abroad. Both inward and outward R&D and knowledge-related foreign direct investment largely contaminate the US. The most dynamic situation is to be found in the European countries, where a substantial part of national technological competencies is performed by foreign-owned afliates and where national rms are more and more locating their R&D facilities both in other European countries and in North America. The most signicant data, however, are probably the sectoral ones. They show that, contrary to what occurs in the rst category, traditional industries are still more globalized than high-tech ones. Folio 116 The empirical evidence on the global technological collaborations The available information on global technological collaborations is more fragmented. This is partly attributable to the nature of the phenomenon, which is less easily quantiable than the other two categories. First, every collaboration has a different economic and technological signicance, and it is difcult to merge them into a homogeneous unit of measurement. Second, the nature of the collaborations, precisely because of their intermediate form, is not easily identiable. A precious source of information is the Merit database on strategic technological alliances (cf. Hagedoorn and Schakenraad, 1990, 1993; Hagedoorn, 1996). This shows that the new strategic alliances for technological purposes have substantially increased since 1970 to this day and they are particularly relevant in crucial technological areas such as biotechnology, new materials and, especially, information technologies. Although it is not possible to estimate the total expenditure on innovation associated with these collaborations, they turn out to be a relatively new phenomenon, which is particularly signicant for those industries in which technological change has been more intense and where the risks connected to innovation are higher. Agreements crossing national boundaries constitute by now almost 60 percent of the registered ones. Among these, around 40 percent involves the North America–Europe–Japan triad, whereas those involving countries outside the triad (mainly Southeast Asian countries) have exceeded 20 percent during the 1990s. In spite of this, as emerges from an in depth reading of a review of the literature promoted by UNCTAD (Pietrobelli, 1996), rms in developing countries are only marginally involved in such collaborations. As far as the total international strategic agreements are concerned, there has been a considerable increase in the second half of the 1980s, which was apparently stabilized during the 1990s (see Table 5). The fastest growth has been registered by the collaborations between Europe and the US, especially in the biotechnology sector. The number of collaborations established by Japanese rms still remains rather limited, even though it is increasing especially in the information technologies sector. AR CHIBUGI A ND IAMMAR INO: TECHNOLOGICAL INNOVATION 1111 2 3 4 5 6 7 8 9 11110 11 12 13 14 15 16 17 18 19 11120 21 22 23 24 25 26 27 28 29 11130 31 32 33 34 35 36 37 38 39 11140 41 42 43 11144 Table 5 Number of international strategic technology alliances by technological eld, 1980–98. Folio 117 Total Information technology Biotechnology All other Across regions Information technology Biotechnology All other Within regions Information technology Biotechnology All other 1980–84 1985–89 1990–94 1995–98 1286 469 230 587 709 258 99 352 577 211 131 235 2540 927 499 1114 1306 438 216 652 1234 489 283 462 2477 1132 490 855 1191 490 261 440 1286 642 229 415 2655 1135 633 887 1193 463 322 408 1462 672 311 479 Source: National Science Foundation (2000), from J. Hagedoorn, MERIT, Co-operative Agreements and Technology Indicators data-base. The increase registered by the intra-European agreements is instead attributable mainly to the biotechnology sector; the latter has recorded the most signicant growth in the number of international alliances both across and within geographical macro-regions. Strategic agreements among rms do not cover entirely the phenomenon of global collaborations. As stated above, the academic world established these collaborations well before the business world. The academic world has also an inuence over industry and its globalization acts as a vehicle for the transfer of knowledge. Among the forms contributing to the dissemination of knowledge we can refer to the increasing number of students attending specialization courses in foreign countries. They represent an uninterrupted channel for the transfer of scientic and technical knowledge, both for developed and for developing countries. In the most advanced countries the number of foreign students enrolled in higher education (university level) had a surprising growth rate over the 1980s and the rst part of the 1990s. Apart from the strong inows registered especially in the small Scandinavian economies, the highest growth rates have occurred in the Asian–Pacic area, where the number of foreign students registered in higher education increased at an average annual rate of around 15 percent in Japan and 12 percent in Australia. The area of origin, for this latter case, is the Asian continent itself, a proof of the fact that learning and knowledge processes are characterized by cultural elements whose similarities are more likely to manifest within the same macro-area (cf. Iammarino and Michie, 1998). Furthermore, the inward ows of foreign REVIEW OF INTERNA TIONAL POLITICAL ECONOMY 1111 2 3 4 5 6 7 8 9 11110 11 12 13 14 15 16 17 18 19 11120 21 22 23 24 25 26 27 28 29 11130 31 32 33 34 35 36 37 38 39 11140 41 42 43 11144 students are even more consistent at the postgraduate level. In the US, for example, 24 percent of students attending postgraduate courses in 1994 came from other countries, a percentage that has grown constantly over time (UNESCO, 1996). Thus, it is not surprising that universities and other public research centres have now even started to operate direct investments abroad, establishing branches in other countries (Malerba et al., 1991). We can note the paradox that, while rms are imitating universities and developing their know-how through technological collaborations, some universities are imitating rms by becoming multinationals. The intensity of international scientic collaborations can also be measured through the number of articles written in collaboration by academics of different countries; in just a decade the share of internationally co-authored papers in the world has almost doubled (NSF, 2000). Even though the majority of scientists continues to work in strict collaboration with fellow countrymen, direct international collaborations are acquiring an increasing weight, also facilitated by the diffusion of Internet. This is evident to a substantial extent in the European countries, where the share of internationally co-authored scientic articles, as a percentage of total co-authored articles, was much higher than in the US or Japan in both 1986–88 and 1995–97 (see Table 6). The importance of a global academia would be certainly greater if reference were to be made to the acquisition of information from abroad through scientic literature, congresses, conferences or personal contacts. Does the empirical evidence on the techno-scientic collaborations provide a conclusive answer as to the relevance of global technological collaborations? They started to appear systematically among rms not more than a quarter of a century ago, but they are rmly established today repeating, it would seem, what occurred in the academic world in the remote past. They mainly concern the technological areas with highest opportunities and which are closest to basic research, whereas they are less common in traditional sectors. Even though the bulk of them involves essentially the Triad countries, a certain vitality has emerged in the new industrialised countries of East Asia since the beginning of the 1990s. Folio 118 C O N C LU SI ON S In this paper we have shown that the globalization of innovation is not a single phenomenon, but a catch-all concept to describe a wide range of forces. The attempt to estimate their weight according to geographical location and industrial sectors shows that the importance of global forces in innovation is rapidly increasing, although at a different pace for each of the three ongoing processes. The dimensions of globalization summarized in the taxonomy have not affected the various world regions at the same time and with the AR CHIBUGI A ND IAMMAR INO: TECHNOLOGICAL INNOVATION 1111 2 3 4 5 6 7 8 9 11110 11 12 13 14 15 16 17 18 19 11120 21 22 23 24 25 26 27 28 29 11130 31 32 33 34 35 36 37 38 39 11140 41 42 43 11144 Table 6 Percentage of internationally co-authored papers published in selected countries in all papers. Folio 119 Country US Japan European Union UK Germany France Italy Netherlands Sweden Denmark Finland Belgium Austria Ireland Spain Greece Portugal World 1986–88 1995–97 Absolute growth 9.8 8.1 18.0 15.2 84% 88% 16.7 20.7 22.2 24.0 21.3 24.0 25.9 20.9 31.2 27.1 28.9 18.8 27.6 37.6 7.8 29.3 33.7 35.6 35.3 36.0 39.4 44.3 36.1 46.6 43.6 41.9 32.2 38.3 50.8 14.8 75% 63% 60% 47% 69% 64% 71% 73% 49% 61% 45% 71% 39% 35% 90% Note: The world totals appear lower than those of individual countries because for world totals each internationally co-authored paper is counted only once, while each collaborating country is assigned one paper. In 1997 each internationally co-authored paper involved an average of 2,22 countries. Source: National Science Foundation (2000). same intensity. The expansion of global forces has instead remained circumscribed to the most developed part of the world up to now, so much so as to have been dened a process of ‘triadisation’, in other words, of increasing polarization of economic and innovative activities in the Triad economies. A C K NO W LE DG E ME N TS We wish to thank Leo Nascia and Lorenzo De Julio for computing assistance. We gratefully acknowledge the nancial support of the European Commission, Daniele Archibugi under the STRATA project ‘The Relationships between Strategies of Multinational Companies and the National Systems of Innovation’ (Contract No. HPV1–CT–1999–0003) and Simona Iammarino under the TMR Marie Curie Research Training Programme (Contract No. ERBFMBICT961062). REVIEW OF INTERNA TIONAL POLITICAL ECONOMY 1111 2 3 4 5 6 7 8 9 11110 11 12 13 14 15 16 17 18 19 11120 21 22 23 24 25 26 27 28 29 11130 31 32 33 34 35 36 37 38 39 11140 41 42 43 11144 Antonelli, C. (1991) The Diffusion of Advanced Telecommunications in Developing Countries, Paris: OECD Development Centre. Archibugi, D., Howells, J. and Michie J. (eds) (1999) Innovation Systems in the Global Economy, Cambridge: Cambridge University Press. Archibugi, D. and Iammarino, S. (1999) ‘The policy implications of the globalisation of innovation’, Research Policy 28: 317–36. Archibugi, D. and Michie, J. (1995) ‘The globalisation of technology: a new taxonomy’, Cambridge Journal of Economics 19, 1: 121–40. Archibugi, D. and Michie, J. (1997a) ‘Technological Globalisation or National Systems of Innovation?’, in D. Archibugi, J. Michie (eds) (1997b). Archibugi, D. and Michie, J. (eds) (1997b) Technology, Globalisation, and Economic Performance, Cambridge: Cambridge University Press. Bartlett C.A. and Ghoshal, S. (1990) ‘Innovation processes in multinational corporations’, Strategic Management Journal 11: 499–518. Bell, M. and Pavitt, K. (1997) ‘Technological Accumulation and Industrial Growth: Contrasts between Developed and Developing Countries’, in D. Archibugi and J. Michie (eds) (1997b). Cantwell, J.A. (1995) ‘The Globalisation of Technology: What Remains of the Product Cycle Model?’, Cambridge Journal of Economics 19, 1: 155–74. Cantwell, J.A. and Iammarino, S. (1998) ‘MNCs, Technological Innovation and Regional Systems in the EU: Some Evidence in the Italian Case’, International Journal of the Economics of Business, Special Issue 5 (3): 383–408. Cantwell, J.A. and Iammarino, S. (2002) Multinational Enterprises and Regional Systems of Innovation in Europe, London: Routledge. Cantwell, J.A. and Kosmopoulou, E. (2000) ‘What determines the internationalisation of corporate technology?’, University of Reading, mimeo. Dalton, D.H. and Serapio, M.G. (1995) Globalising Industrial Research and Development, Springeld, VA: National Technical Information Service, U.S. Department of Commerce. Daniels, P.L. (1997) National technology gaps and trade – An empirical study of the inuence of globalisation’, Research Policy 25: 1189–1207. Dodgson, M. (1993) Technological Collaboration in Industry, London: Routledge. Dunning, J.H. (1993) Multinational Enterprises and the Global Economy, Wokingham: Addison-Wesley. Florida, R. (1997) ‘The globalisation of R&D: results of a survey of foreignafliates R&D laboratories in the USA’, Research Policy 26: 1, 85–103. Freeman, C. (1994) ‘The economics of technical change’, Cambridge Journal of Economics 18: 463–514. Giddens, A. (1990) Consequences of Modernity, Cambridge: Polity Press. Granstrand O., Håkanson, L. and Sjölander, S. (eds) (1992) Technology Management and International Business. Internationalisation of R&D and Technology, Chichester: Wiley. Guerrieri, P. and Milana, C. (1995) ‘Changes and Trends in the World Trade in High-Technology Products’, Cambridge Journal of Economics 19, 1: 225–42. Guerrieri, P. (1999) ‘La competitività tecnologica dei paesi europei’, in S. Ferrari et al. (eds), L’Italia nella competizione tecnologica internazionale, Milan: Franco Angeli. Hagedoorn, J. (1996) ‘Trends and Patterns in Strategic Technology Partnering Since the early Seventies’, Review of Industrial Organisation 11: 601–16. Folio 120 R E F E R EN C E S AR CHIBUGI A ND IAMMAR INO: TECHNOLOGICAL INNOVATION 1111 2 3 4 5 6 7 8 9 11110 11 12 13 14 15 16 17 18 19 11120 21 22 23 24 25 26 27 28 29 11130 31 32 33 34 35 36 37 38 39 11140 41 42 43 11144 Hagedoorn, J. and Schakenraad, J. (1990) ‘Inter-rm Partnerships and Cooperative Strategies in Core Technologies’, in C. Freeman and L. Soete (eds) New Explorations in the Economics of Technical Change, London: Pinter Publisher. Hagedoorn, J. and Schakenraad, J. (1993) ‘Strategic Technology Partnering and International Corporate Strategies’, in K. Hughes (ed.) European Competitiveness, Cambridge: Cambridge University Press. Håkanson, L. (1992) ‘Locational Determinants of Foreign R&D in Swedish Multinationals’, in O. Granstrand, L. Håkanson, and S. Sjölander, (eds) Technology Management and International Business. Internationalisation of R & D and Technology, Chichester: Wiley. Howells, J. (1997) ‘The Globalisation of Research and Technological Innovation: A New Agenda?’, in J. Howells and J. Michie (eds). Howells, J. and Michie, J. (eds) (1997) Technology, Innovation and Competitiveness, Aldershot: Edward Elgar. Hu, Y.S. (1992) ‘Global or Stateless Corporations are National Firms with International Operations’, California Management Review 34: 107–26. Iammarino, S. and Michie, J. (1998) ‘The Scope of Technological Globalisation’, International Journal of the Economics of Business, Special Issue 5, 3: 335–53. Malerba, F., Morawets, A. and Pasqui, G. (1991) The Nascent Globalisation of Universities and Public and Quasi-Public Research Organisations, Brussels: European Commission, FAST. Molero, J. (1995) Technological Innovation, Multinational Corporations and New International Competitiveness. The Case of Intermediate Countries, London: Harwood Academic Publishers. Mowery, D. (1992) ‘International Collaborative Ventures and US Firms’ Technology Strategy’, in O. Granstrand, L. Håkanson and S. Sjölander (eds) Technology Management and International Business. Internationalisation of R & D and Technology, Chichester: Wiley. Narula, R. and Hagedoorn, J. (1999) ‘Innovating through strategic alliances: moving towards international partnerships and contractual agreements’, Technovation 19: 283–94. National Science Foundation (1996 and 2000) Science and Engineering Indicators, Washington D.C.: U.S. Government Printing Ofce. OECD (1996a) STAN Database 1975–1994, Paris: OECD. OECD (1996b) Research and Development Expenditure in Industry 1973–1993, Paris: OECD. OECD (1997) Internationalisation of Industrial R&D: Patterns and Trends, Groups of National Experts on Science and Technology Indicators, Paris: OECD. OECD (1999a) STAN Database, Paris: OECD. OECD (1999b) Measuring Globalisation. The Role of Multinationals in the OECD Economies, Paris: OECD. OECD (2000a) Main Science and Technology Indicators, Paris: OECD. OECD (2000b) Basic Science and Technology Statistics, Paris: OECD. Patel, P. (1995) ‘Localised Production of Technology for Global Markets’, Cambridge Journal of Economics 191: 141–53. Patel, P. and Vega M. (1997) ‘Technological Strategies of Large European Firms, Report for “Strategic Analysis for European S&T Policy Intelligence”’, Targeted Socio-Economic Research, European Commission. Pavitt, K. and Patel, P. (1998) ‘Global Corporations and National Systems of Innovation: Who Dominates Whom?’, in D. Archibugi, J. Howells and J. Michie (eds). Pearce, R.D. and Singh, S. (1992) Globalizing Research and Development, London: Macmillan. Folio 121 REVIEW OF INTERNA TIONAL POLITICAL ECONOMY 1111 2 3 4 5 6 7 8 9 11110 11 12 13 14 15 16 17 18 19 11120 21 22 23 24 25 26 27 28 29 11130 31 32 33 34 35 36 37 38 39 11140 41 42 43 11144 Pianta, M. (1988) New Technologies Across the Atlantic, Hemel Hempstead: Harvester & Wheatsheaf. Pietrobelli, C. (1996) Emerging Forms of Technological Cooperation: The Case for Technology Partnership, New York and Geneva: United Nations Conference on Trade and Development. Pietrobelli, C. and Samper, J. (1997) ‘Measurement of Europe–Asia Technology Exchanges. Asymmetry and Distance’, Science and Public Policy, XXIV (4), August. Scherer, F.M. (1992) International High-Technology Competition, London: Harvard University Press. Streeten, P. (1996) ‘Governance of the Global Economy, paper presented at the International Conference on “Globalisation and Citizenship” ‘, Geneva, United Nations Research Institute for Social Development, December. Tyson, L.D. (1992) Who’s Bashing Whom? Trade Conict in High-Technology Industries, Washington D.C., Institute for International Economics. UNESCO (1996) Statistical Yearbook, Geneva. Zander, I. (1999) ‘How do you mean “global”? A taxonomy of innovation networks in the multinational corporation’, Research Policy 28, 2–3: 195–214. Folio 122
© Copyright 2026