
Download PDF
Biases in Macroeconomic Forecasts: Irrationality or
Asymmetric Loss?∗
Graham Elliott
Ivana Komunjer
University of California San Diego
Caltech
Allan Timmermann
University of California San Diego
Abstract
Survey data on expectations frequently find evidence that forecasts are biased,
rejecting the joint hypothesis of rational expectations and symmetric loss. While the
literature has attempted to explain this bias through forecasters’ strategic behavior,
we propose a simpler explanation based on asymmetric loss. We establish that existing
rationality tests are not robust to even small deviations from symmetry and hence
have little ability to tell whether the forecaster is irrational or the loss function is
asymmetric. We propose new and more general methods for testing forecast rationality
jointly with flexible families of loss functions that embed quadratic loss as a special
case. An empirical application to survey data on forecasts of nominal output growth
shows strong evidence against rationality and symmetric loss. There is considerably
weaker evidence against rationality once asymmetric loss is permitted.
∗
Graham Elliott and Allan Timmermann are grateful to the NSF for financial assistance under grant
SES 0111238. Carlos Capistran provided excellent research assistance. We thank Dean Croushore, Clive
Granger, Adrian Pagan, Hal White and seminar participants at UTS and UNSW for insightful comments.
1
1
Introduction
How agents form expectations and, in particular, whether they are rational and efficiently
incorporate all available information into their forecasts, is a question of fundamental importance in macroeconomic analysis. Ultimately this question can best be resolved through
empirical analysis of expectations data. It is therefore not surprising that a large literature
has been devoted to empirically testing forecast rationality based on survey data such as
the Livingston data or the Survey of Professional Forecasters (SPF).1 Unfortunately, the
empirical evidence is inconclusive and seems to depend on the level of aggregation of data,
sample period, forecast horizon and type of variable under consideration.2
The vast majority of studies have tested forecast rationality in conjunction with an assumption of quadratic loss. This loss function has largely been maintained out of convenience:
under quadratic loss and rationality, the observed forecast errors should have zero mean and
be uncorrelated with all variables in the current information set.
A reading of the literature reveals little discussion of why forecast errors of different signs
should lead to the same loss. On economic grounds one would, if anything, typically expect
asymmetric losses. For example, overpredictions of sales lead to inventory holding costs while
underpredictions lead to stockout costs, loss of reputation and revenues when demand cannot
be met. Most often there is no reason why these costs should be identical. Concerns such
as these led Granger and Newbold (1986, page 125) to write: “An assumption of symmetry
for the cost function is much less acceptable [than an assumption of a symmetric forecast
error density]”.3 Relaxing the assumption of symmetric loss has important consequences.
If the loss function under which predictions were derived is not restricted to be symmetric,
1
See, e.g., Bonham and Cohen (1995), Fama (1975), Keane and Runkle (1990), Mankiw, Reis and Wolfers
(2003), Mishkin (1981) and Zarnowitz (1979).
2
The recent survey by Stekler (2002) summarizes empirical studies of rationality for inflation and output
forecasts as follows: “Although there have been many evaluations of U.S. and U.K. forecasts, there is no
definitive conclusion about their rationality and efficiency. The results are in conflict, with some forecasts
displaying these characteristics in some periods, and not in others, and/or some forecasters able to generate
unbiased and efficient forecasts while others were unable to do so” (p. 235).
3
The literature makes a clear distinction between inventory and backordering costs, c.f. Arrow, Karlin
and Scarf (1958), Krane (1994) and Benjaafar, Kim and Vishwanadhan (2002).
2
rationality no longer requires that the forecast errors are unbiased, as demonstrated by
Zellner (1986) and Christoffersen and Diebold (1997).
While many studies on forecast rationality testing are aware of the limitations of symmetric loss and indicate that rejections of rationality may be driven by asymmetries, little is
known about the magnitude of the problem - i.e. how much this really matters in practice.
In this paper we therefore examine the theoretical and practical importance of the joint
nature of tests for forecast rationality. We show that the coefficients in standard forecast
efficiency tests are biased if the loss function is not symmetric and characterize this bias.
Under asymmetric loss, standard rationality tests thus do not control size and may lead to
false rejections of rationality. Conversely, we also find that even very large inefficiencies in
forecasters’ use of information may not be detectable by standard tests when the true loss
is asymmetric.
In realistic applications the shape of an individual’s loss function is unobserved and so
rationality cannot be tested directly without placing additional structure on the problem.
Building on the work of Elliott, Komunjer and Timmermann (2002), we present a more
general framework for rationality testing that allows the loss function to belong to flexible
families and tests rationality by means of moment conditions. The families of loss functions
can be chosen such that they embed symmetric loss as special cases, thus ensuring that our
framework directly generalizes the methods traditionally used in the literature.
To demonstrate these points, we revisit the Survey of Professional Forecasters (SPF) data
on US output growth and examine whether the apparently high rejection rate for rationality
found in this data set can be explained by asymmetric loss. We find strong evidence of bias
in the forecast errors of many individual survey participants. In fact, close to 30% of the
individual predictions lead to rejections of the joint hypothesis of rationality and symmetric
loss at the 5% critical level. Allowing for asymmetric loss, the rejection rate is very close
to 5% which is consistent with rationality. Output forecasts thus tend to be consistent with
the more general loss functions, although inconsistent with symmetric loss. Furthermore,
our estimates of the direction of asymmetries in loss overwhelmingly suggest that the cost
of overpredicting exceeds the cost of underpredicting output growth. Using data from the
3
Livingston survey, we also find that these estimates vary considerably across forecasters with
academics adhering closest to symmetric loss and banking and industry economists’ forecasts
suggesting larger degrees of asymmetry.
Asymmetric loss is by no means the only explanation of biases in forecasts. Recent
work has attempted to explain biases by means of strategic behavior arising in situations
where the forecaster’s remuneration depends on factors other than the mean squared forecast
error, c.f. Scharfstein and Stein (1990), Truman (1994), Lamont (1995) and Ehrbeck and
Waldmann (1996). Common features of the models used by these authors is that forecasters
differ by their ability to forecast, reflected by differences in the precision of their private
signals, and that their main goal is to influence clients’ assessment of their ability. Such
objectives are common to business analysts or analysts employed by financial services firms
such as investment banks, whose fees are directly related to their clients’ assessment of
analysts’ forecasting ability. The main finding of these models is that the forecasts need not
reflect analysts’ private information in an unbiased manner. Biases in individual forecasters’
predictions are related to the consensus forecast and can induce herding among forecasters.
Strategic behavior can only be analyzed in the context of a specified loss function and
by no means precludes asymmetric loss, so the two explanations for biases may well be
complements.
The plan of the paper is as follows. Section 2 reviews the evidence against symmetric loss
and rationality in forecasts of output growth from the Survey of Professional Forecasters.
Section 3 contains an illustrative example which explains why forecasters may depart from
symmetric loss functions. This section also introduces a new family of loss functions that
contains quadratic loss as a special case and allows for asymmetries. In Section 4, we examine
standard tests for forecast rationality based on quadratic loss and show how they can lead
to biased estimates and wrong inference when loss is genuinely asymmetric. Construction of
rationality tests under asymmetric losses is undertaken in Section 5, while Section 6 presents
empirical results and Section 7 concludes with a discussion of the results. Technical proofs
and details of the data set are provided in appendices at the end of the paper.
4
2
Bias in Forecasts of Output Growth
In this paper we will focus on forecasts of US nominal output growth - a series in which
virtually all macroeconomic forecasters should have some interest. Overpredictions of output
growth are likely to be associated with sales forecasts that are too large, which will lead to
larger inventory costs for firms. Conversely, underpredictions of output growth will plausibly
lead to shortfalls in production and larger-than-expected stock-out costs. A discussion of
asymmetric loss can thus be related to asymmetries between inventory and stock-out costs,
which the literature clearly distinguishes between, c.f. Arrow, Karlin and Scarf (1958), Krane
(1994) and Benjaafar, Kim and Vishwanadhan (2002).
Forecasts of output growth have been the subject of many previous studies. Brown
and Maital (1981) studied average GNP forecasts and rejected unbiasedness and efficiency
in six-month predictions of growth in GNP measured in current prices. Zarnowitz (1985)
found only weak evidence against efficiency for the average forecast, but stronger evidence
against efficiency for individual forecasters. Batchelor and Dua (1991) found little evidence
that forecast errors were correlated with their own past values. In contrast, Davies and
Lahiri (1995) conducted a panel analysis and found evidence that informational efficiency
was rejected for up to half of the survey participants.
2.1
Data
The main data used in this paper is from the Survey of Professional Forecasters (SPF) which
has become a primary source for studying macroeconomic forecasts.4 Survey participants
provide point forecasts of these variables in quarterly surveys. Surveys such as the SPF do
not specify the objective of the forecasting exercise. This leaves open the question what the
objective of the forecaster is. It is by no means clear that the forecaster simply minimizes a
quadratic loss function and reports the conditional mean.5
4
For an academic bibliography, see the extensive list of references to papers that have used this data source
maintained by the Federal Reserve Bank of Philadelphia at http://www.phil.frb.org/econ/spf/spfbib.html.
5
For example, in a study of predictions of interest rates, Leitch and Tanner (1991) found that commercial
forecasts performed very poorly according to an MSE criterion but did very well according to a sign prediction
5
Survey participants are anonymous; their identity is only known to the data collectors
and not made publicly available. It is plausible to expect that participants report the same
forecasts that they use either for themselves or with their clients. Forecasts should therefore
closely reflect the underlying loss function. Although strategic behavior may also play a role,
we will abstract from this in our analysis.
Most macroeconomic time series are subject to revisions. Indeed, the nominal output
series changed from GNP to GDP in the first quarter of 1992. We shall refer to the combined
series as GDP. Since the data set contains both the forecasters’ expectations about currentquarter and next quarter’s GDP, we use both data points to compute the predicted rate of
change in GDP.
The SPF data set is an unbalanced panel. Although the sample begins in 1968, no
forecaster participated throughout the entire sample. Each quarter some forecasters leave
the sample and new ones are included. We therefore have very few observations on most
individual forecasters. We deal with this problem by requiring each forecaster to have participated for a minimum of 20 quarters. Imposing this requirement leaves us with 98 individual
forecast series. The data appendix provides more details of the construction of the data.
Figure 1 shows a histogram of the average forecast errors across the 98 forecasters in
the data set. The average forecast error, defined as the difference between the realized and
predicted value, has a positive mean (0.16% per quarter). Out of 98 forecast errors, 80 had
a positive mean, suggesting systematic underpredictions of output growth.
2.2
Rationality Tests under Quadratic Loss
Under quadratic loss - often referred to as mean squared error (MSE) loss - forecast rationality has traditionally been studied by testing one of two conditions: (1) that the forecast
under consideration is unbiased and (2) that it is efficient with respect to the information
set available to the forecaster at the time the forecast was made. The requirement of zero
bias is a special case of the more general condition of informational efficiency. Its rejection,
criterion linked more closely to profits from simple trading strategies based on these forecasts. Clearly, these
forecasters did not use a quadratic loss function.
6
however, automatically leads to a rejection of forecast rationality under quadratic loss, which
is why biasedness of macroeconomic forecasts is so often tested in practice.
Statistical tests of forecast unbiasedness are typically undertaken by means of the MincerZarnowitz (1969) regression:
yt+1 = β c + βft+1 + ut+1 ,
(1)
where yt+1 is the time t + 1 realization of the target variable - US nominal output growth
in our data - which we denote by Yt+1 , ft+1 is its one-step-ahead forecast and ut+1 is a
realization of a scalar error random variable, Ut+1 , satisfying E[Ut+1 ] = 0. Under the null
hypothesis of zero bias we should have β c = 0 and β = 1. This test is commonly referred to
as a test of weak rationality.
Table 1 shows the outcome of tests for bias in the forecast errors. Under quadratic loss,
the null of no bias is rejected at the 1% critical level for 16 participants and gets rejected
in 29 cases at the 5% level.6 If MSE loss is accepted, this strongly questions rationality for
a large proportion of the survey participants. On the other hand, in a situation where the
forecasters incur different losses from over- and underprediction, it would be rational for them
to produce biased forecasts. Before developing rationality tests which allow for asymmetry,
we illustrate with a simple example why forecasters’ losses might indeed be asymmetric.
3
Sources of Asymmetry: An Illustrative Example
Forecasts are of interest to economic agents only in so far as they can improve their decisions.
It is common to assume that an agent’s utility, U(yt+1 , δ(ft+1 )), depends on the realization
of some target variable(s), yt+1 , in addition to a set of decisions or actions, δ(ft+1 ) which are
functions of the forecasts, ft+1 . Optimal forecasts are determined so as to maximize expected
utility (or profits) and must reflect both the form of the action rule mapping forecasts to
decisions and the shape of the utility or (in the case of a firm) cost function. In general it
is difficult to characterize the optimal forecast in closed form, so this section provides an
illustrative example which motivates a broad class of loss functions.
6
These numbers are a little higher than those reported by Zarnowitz (1985). This is likely to reflect our
longer sample and our requirement of at least 20 observations which gives more power to the test.
7
Consider a forecaster - e.g., policy maker, firm, government, Central Bank or international organization - whose utility function at time t + 1 depends on some variable, wt+1 ,
representing wealth, power, reputation or publicity (see, e.g., Chadha and Schellekens 1998,
Peel and Nobay 1998, Bray and Goodhart 2002, Pons-Novell 2003). For professional forecasters such as those considered here, it is reasonable to assume that the level of wt+1 depends
on some target variable yt+1 - e.g., inflation rate, GDP growth, budget deficit - and on its
forecast ft+1 . For example, the reputation (or reward) of professional forecasters is likely
to depend on the accuracy with which they forecast the variable of interest. Further, suppose that the forecaster’s utility only depends on wt+1 , and belongs to the CARA family,
u(wt+1 ) = − exp(−pwt+1 ), where p > 0 measures the coefficient of absolute risk aversion.
We now turn to the specification of the response function, w(yt+1 , ft+1 ). It is natural to
assume that the value of wt+1 decreases in the magnitude of the forecast error et+1 ≡ yt+1 −
ft+1 . This guarantees that the level of wt+1 is at its maximum when the forecaster has perfect
foresight, in which case the forecast error is zero. For imperfect forecasts, |et+1 | > 0 and
wt+1 is decreasing in the absolute forecast error. The embarrassment costs to the forecaster
resulting from positive as compared to negative forecast errors of the same magnitude are
likely to differ. Hence, we allow wt+1 to be an asymmetric function of the forecast error, which
we parametrize as: wt+1 = w(et+1 ) ≡ − ln [b|et+1 |1(et+1 ≥ 0) + c|et+1 |1(et+1 < 0)], where b
and c are positive constants. This form captures that: (1) the level of the forecaster’s wt+1
decreases concavely with the magnitude of the forecast error; (2) the rate of decay of wt+1
differs depending on the direction in which the error is made: it equals b if the forecaster’s
error is positive and c if it is negative. Symmetry arises when b = c.
This specification of the response function implies that at any time t + 1,
u0 (et+1 )
α sgn(et+1 )
,
=(
)
0
u (−et+1 )
1−α
(2)
where α ≡ bp /(bp + cp ), so that 0 < α < 1. For a given magnitude of the forecast error, the
ratio of marginal utilities corresponding to a positive deviation from the target (underprediction of yt+1 ) and a negative deviation (overprediction of yt+1 ) is given by α/(1 − α), and
is hence uniquely determined by the value of α. α thus describes the degree of asymmetry
in the forecaster’s loss function - values less than one half indicate that the forecaster put
8
higher weights on negative forecast errors than on positive ones of the same magnitude. Values of α greater than one half suggest a greater cost associated with positive forecast errors.
In the symmetric case (b = c), α equals one half, so α/(1 − α) = 1 and the forecaster’s
embarrassment costs due to positive and negative forecast errors are the same.
Combining the utility and response functions, expected utility maximization requires
minimizing the expected value of a loss L(e; α, p)
L(e; α, p) ≡ [α + (1 − 2α)1(e < 0)]ep .
(3)
The optimal decision problem in equation (3) is not specific to the choice of CARA
utility and logarithmic response function. Indeed, the same result can be derived for an
1−ρ
agent with constant relative risk aversion utility function u(wt+1 ) = wt+1
, where ρ >
0 measures relative risk aversion. For this case, if the response function is w(et+1 ) ≡
[b|et+1 |1(et+1 ≥ 0) + c|et+1 |1(et+1 < 0)]−1 , we obtain the same result as in equation (3) with
p = ρ + 1 and α ≡ bρ /(bρ + cρ ).
4
Caveats in Rationality Tests under Quadratic Loss
In this section we study the behavior of standard tests for forecast rationality when the
forecaster’s loss function takes the form (3) and thus allows for asymmetries. An attractive
feature of (3) is that it generalizes loss functions commonly used in the rationality testing
literature. When (α, p) = (1/2, 2), loss is quadratic and (3) reduces to MSE loss. More
generally, when p = 2 and 0 < α < 1, the family of losses L is piecewise quadratic and we
call it ‘Quad-Quad’. Similarly, when p = 1 and 0 < α < 1 we get the piecewise linear family
of losses L, known as ‘Lin-Lin’, a special case of which is the absolute deviation or mean
absolute error (MAE) loss which is obtained for (α, p) = (1/2, 1).
4.1
Misspecification Bias
Suppose that p = 2 in (3) so the forecaster’s loss function
L(e; α) ≡ [α + (1 − 2α)1(e < 0)]e2 , 0 < α < 1
9
(4)
is parameterized by a single shape or asymmetry parameter, α, whose true value, α0 , may be
known or unknown to the forecast evaluator. This loss function offers an ideal framework to
discuss how standard tests of rationality - derived under MSE loss (α0 = 1/2) - are affected
if (4) is the true loss function and α0 6= 1/2.
As we saw earlier, forecast errors should be unpredictable under MSE loss so it is common
to test forecast rationality by means of the efficiency regression,
et+1 = β 0 vt + εt+1 ,
(5)
where et+1 is the forecast error and vt are the observations of a d × 1 vector of variables
(including a constant), denoted Vt , that are known to the forecaster at time t. Assuming
that a sample of forecasts running from t = τ to t = T + τ − 1 is available, this regression
P +τ −1
tests the orthogonality condition E[ Tt=τ
Vt εt+1 ] = 0. In reality, if the true loss function
is (4), the correct moment condition is E[Vt εt+1 ] = (1 − 2α0 )E[Vt |et+1 |]. By misspecifying
the forecaster’s loss function, we omit the variable (1 − 2α0 )|et+1 | from the linear regression
and introduce correlation between the error term and the vector of explanatory variables.
P +τ −1 0 −1 PT +τ −1
Hence, the standard OLS estimator βˆ ≡ [ Tt=τ
vt vt ] [ t=τ vt et+1 ] will be biased away
from β by a quantity which we derive in Proposition 1:
Proposition 1 Under assumptions (A1)-(A4) given in Appendix A and under Quad-Quad
ˆ in the efficiency regression (5) has a bias that equals
loss (4), the standard OLS estimator, β,
plim βˆ − β = (1 − 2α0 )Σ−1
V hV ,
where ΣV ≡ T −1
PT +τ −1
t=τ
E[Vt Vt0 ] and hV ≡ T −1
PT +τ −1
t=τ
(6)
E[Vt |et+1 |]. Hence the misspecifi-
cation bias depends on (i) the extent of the departure from symmetry in the loss function L,
quantified by (1 − 2α0 ); (ii) the covariance of the instruments used in the test, Vt , with the
absolute value of the forecast error, |et+1 |, hV ; (iii) the covariance matrix of the instruments,
ΣV .7
7
ˆ V ≡ T −1 PT +τ −1 vt |et+1 |,
ˆ V ≡ T −1 PT +τ −1 vt vt0 and h
ΣV and hV can be consistently estimated by Σ
t=τ
t=τ
respectively.
10
A number of positive implications can be drawn from Proposition 1, improving our
understanding of standard efficiency tests when the forecaster’s loss is asymmetric (α0 6=
1/2). In the usual implementation of orthogonality regressions, a constant is included in Vt
and we can write Vt = (1, V˜t0 )0 . The first element of the covariance vector hV then equals
P +τ −1
T −1 Tt=τ
E[|et+1 |]. Thus, when α0 6= 1/2, there will always be bias in at least the constant
term, unless the absolute forecast error is zero in expectation. But this can only happen in
the highly unlikely situation where the forecasts are perfect so in general standard tests of
forecast rationality will be biased under asymmetric loss.
A further consequence of Proposition 1 is that the bias decreases with the variability of
the regressors. Indeed, if the covariance matrix ΣV is sufficiently large, it can ‘drown out’
the bias. Moreover, whenever the matrix ΣV is nonsingular, the bias that arises through
the constant term will extend directly to biases in the other coefficients for each regressor
whose mean is nonzero. This follows from the interaction of Σ−1
V and the first term of hV .
Hence, even when regressors have no additional information for improving the forecasts, they
may still have nonzero coefficients when the loss function is misspecified, giving rise to false
rejections.
In practice, we can easily evaluate the relative biases for each coefficient in the efficiency
regression (5) by simply computing the term Σ−1
V hV . For any degree of asymmetry, the
latter can be estimated consistently by regressing the absolute forecast errors on Vt . Such
regressions should accompany results that assume quadratic loss, especially when there are
rejections. They allow us to understand how sensitive the results are to misspecifications of
the loss function, at least of the form examined here.
4.2
Power Loss
Misspecification of the loss function will affect not only the probability limit of the standard
OLS estimator βˆ but also its asymptotic distribution. Hence, rationality tests implemented
by traditional MSE regression based on the null hypothesis β = 0 might well lead to incorrect
inference. To study the magnitude of this problem, we first characterize the (asymptotic)
distribution of βˆ :
11
Proposition 2 Under Assumptions (A1)-(A4) listed in Appendix A, the asymptotic distribution of βˆ in the efficiency regression (5) is
√
d
T (βˆ − β ∗ ) → N(0, Ω∗ ),
(7)
∗
−1
−1
∗
where β ∗ ≡ β + (1 − 2α0 )Σ−1
V hV , Ω ≡ ΣV ∆(β )ΣV and
∆(β ∗ ) ≡ T −1
TX
+τ −1
t=τ
E[u2t+1 Vt Vt0 ] + 2(1 − 2α0 )E[ut+1 |et+1 |Vt Vt0 ] + (1 − 2α0 )2 E[|et+1 |2 Vt Vt0 ].
Spurious rejections of the rationality hypothesis follow whenever the absolute value of the
forecast error is correlated with Vt and the standard error of βˆ is not too large.8 Proposition
2 allows us to construct standard errors for βˆ and hence to study the power of a misspecified
MSE test. We use this for the following result:
Corollary 3 Suppose the assumptions from Proposition 2 hold. For local deviations from
symmetric loss, α0 = 1/2, given by α0 = 12 (1−aT −1/2 ), and local deviations from rationality,
0
ˆ −1 βˆ based on the
β = 0, given by β = bT −1/2 , with a and b fixed, the Wald test statistic T βˆ Ω
0 −1
d
ˆ βˆ →
efficiency regression (5) is asymptotically distributed as T βˆ Ω
χ2d (m), a non-central
chi-square with d degrees of freedom and non-centrality parameter m given by
m = a2 h0V ∆(β ∗ )−1 hV + b0 ΣV ∆(β ∗ )−1 ΣV b + 2ab0 ΣV ∆(β ∗ )−1 hV .
(8)
This implies the following: (i) for a wide range of combinations of the asymmetry parameter,
α0 6= 1/2, and the regression coefficient β, efficiency tests may fail to reject even for large
degrees of inefficiency (β 6= 0); (ii) when the forecaster genuinely uses information efficiently
(β = 0) the efficiency test will tend to reject the null provided loss is asymmetric (α0 6= 1/2).
Recall that d is the number of instruments used in the test, i.e. d = 1 if only a constant
is used. Since the power of the Wald test for β = 0 is driven entirely by the noncentrality
ˆ Σ
ˆ ≡
ˆ β)
ˆ −1 with ∆(
ˆ =Σ
ˆ −1 ∆(
ˆ β)
The asymptotic covariance matrix Ω∗ can be consistently estimated by Ω
V
V
P
0
+τ −1
ˆ vt ) 2 vt v 0 .
T −1 Tt=τ
(et+1 − β
t
8
12
parameter m, it suffices to consider this parameter to study the power of the standard
rationality test in the directions of nonzero a and b.
Non-zero values of a and b have very different interpretations: b 6= 0 implies that the
forecasting model is misspecified, while a 6= 0 reflects asymmetric loss. Only the former
can be interpreted as forecast inefficiency or irrationality. Yet, for given values of ΣV , ∆(β)
and hV we can construct pairs of values (a, b) that lead to identical power (same m). In
principle, standard efficiency tests based on (5) can therefore not tell whether a rejection is
due to irrationality or asymmetric loss - i.e., lack of robustness with respect to the shape
of the loss function. A large value of m can arise even when the forecaster is fully rational
(b = 0) provided that |a| is large.9
Conversely, suppose that the test does not reject, which would happen at the right size
provided m = 0. This does not imply that the forecast is rational (b = 0) because we
can construct pairs of non-zero values (a, b) such that m = 0. This will happen when the
misspecification in the forecasts cancel out against the asymmetry in the loss function. The
test will not have any power to identify this problem.
To demonstrate the importance of this point, Figure 2 uses Corollary 3 to plot iso-m or, equivalently, iso-power - curves for different values of a and b, assuming a size of 5% and
Vt = 1. For this case ΣV = 1, ∆ can be estimated by σ
ˆ 2u (the variance of the residuals of
ˆ V = T −1 Pt=T +τ |et+1 |. Values for σ
ˆV
the regression) and hV can be estimated by h
ˆ u and h
t=τ
were chosen to match the SPF data. When a = b = 0, we have the case with MSE loss and
informational efficiency. Positive values of a correspond to a value of α below one-half, while
negative values of a represent α > 1/2.
For any value of m we can solve the quadratic relationship (8) to obtain a trade-off
ˆ V ± √mˆ
between a and b : b = −ah
σ u . When m = 0 (the thick line in the center), the test
ˆ V . The
rejects with power equal to size and the trade-off between a and b is simply b = −ah
two m = 0.65 lines correspond to power of 10%, the m = 1.96 lines give 50% power, while
9
When a 6= 0, the constant term in (5) is particularly likely to lead to a rejection even when the forecasts
are truly rational. This bias will be larger the less of the variation in the outcome variable is explained (since
E[|et+1 |] is increasing in the variation of the forecast error).
13
the m = 3.24 lines furthest towards the corners of the figure represent a power of 90%.10
The lines slope downward since a larger value of a corresponds to a smaller value of α and
a stronger tendency to underpredict (yielding a positive mean of the forecast error) which
will cancel out against a larger negative bias in b.
Pairs of values a, b on the m = 0 line are such that biases in the forecasts (non-zero b)
exactly cancel out against asymmetry in loss (non-zero a) in such a way that the standard
test cannot detect the bias (in the sense that power = size) even though forecasters are
irrational. For nonzero values for m, we see the converse. The point where these contours
cross the b = 0 boundary (in the centre of the graphs) gives the asymmetry parameter that
if true for the forecaster would result in rejections with greater frequency than size even
though the forecaster is rational for that asymmetric loss function.11
5
Rationality Tests under Asymmetric Losses
Our finding that standard rationality tests are not robust to asymmetric loss suggests that
a new set of tests is required. In this section we describe two such approaches. The first
approach is applicable when the shape and parameters of the loss function are known. This
set-up does not pose any new problems and least-squares estimation can still be adopted,
albeit on a transformation of the original forecast error. The second case arises when the
parameters of the loss function are unknown and have to be estimated as part of the test.
This framework requires different estimation methods which we describe below.
We start by briefly discussing forecast rationality more generally. Under a loss function
L(e; η), characterized by some shape parameter η, the sequence of forecasts {ft+1 } is said to
be optimal under loss L if at any point in time t, the forecast ft+1 minimizes E[L(et+1 ; η)|Ωt ]
- the expected value of L conditional on the information set available to the forecaster, Ωt . If
10
The range of values for a in the figure (-10, 10) ensures that α ∈ (0, 1) when T = 100. This range
becomes more narrow (wider) for smaller (larger) sample sizes.
11
ˆ V = 0 would asymmetric loss not cause problems to the standard test. In this case the absolute
Only if h
value of the forecast error is not correlated with the instrument, Vt , there is no omitted variable bias and
the iso-power curves would be vertical lines, so size would only be controlled when b = 0.
14
the forecaster’s loss function L is once differentiable, this implies that, at any point in time,
the optimal forecast errors {et+1 } satisfy the first order condition E[L0e (et+1 ; η)|Ωt ] = 0,
where L0e denotes the derivative of L with respect to the error et+1 .
Conditional moment conditions such as these are difficult to check in practice. Instead,
they are replaced by unconditional moment conditions based on the d × 1 vector of instruments, Vt , that are known to the forecaster, i.e. Vt ∈ Ωt . We can then say that, under L, the
forecasts {ft+1 } are rational with respect to the variables Vt if the forecast errors satisfy the
P +τ −1 0
orthogonality conditions: E[ Tt=τ
Le (et+1 ; η) · Vt ] = 0. In other words, the transformed
(or ‘generalized’) forecast error L0e (et+1 ; η) has to be orthogonal to the vector of variables Vt .
5.1
Known Loss
When both L and η are known we can transform the observed forecast error et+1 and test
the orthogonality conditions by means of the generalized efficiency regression
L0e (et+1 ; η) = β 0 vt + ut+1 ,
(9)
P +τ −1
Vt Ut+1 ] =
where ut+1 is a realization of a scalar error random variable Ut+1 such that E[ Tt=τ
0. Assuming that standard regularity conditions hold, the linear regression parameter β
can be consistently estimated by using the ordinary least squares (OLS) estimator β˜ ≡
P +τ −1 0 −1 PT +τ −1
[ Tt=τ
vt vt ] [ t=τ vt L0e (et+1 ; η)]. Forecast rationality is equivalent to having β = 0.
Hence, under general loss a test for rationality can be performed by first transforming the
observed forecast error et+1 into L0e (et+1 ; η), then regressing the latter on Vt by means of
the regression (9) and finally testing the null hypothesis that all the regression coefficients
are zero, i.e. β = 0. Under quadratic loss, such tests of orthogonality of the forecast error
with respect to all variables observed by the forecaster are commonly referred to as strong
rationality tests.
To demonstrate this type of test, suppose that it is known that the forecaster has a
‘Quad-Quad’ loss function with known asymmetry parameter α0 6= 1/2. For this case the
generalized efficiency regression takes the form
et+1 − (1 − 2α0 )|et+1 | = β 0 vt + ut+1 .
15
(10)
When α0 equals one half, the previous regression collapses to the one traditionally used in
tests for strong rationality. Assuming that the forecaster’s loss is quadratic, i.e. α0 = 1/2,
amounts to omitting the term (1 − 2α0 )|et+1 | from the regression above. Whenever the true
value of α0 is different from one half, the estimates of the slope coefficient β are biased, as
already shown in Section 4. This finding is as we would expect from the standard omitted
variable bias result with the difference that we now have constructed the omitted regressor.
5.2
Unknown Loss Parameters
For many applications, however, both L and η are unknown to the forecast evaluator. One
way to proceed in this case is to relax the assumption that the true loss is known by assuming
that L belongs to some flexible and known family of loss functions but with unknown shape
parameter, η. This enlarges the null space and reduces the power of the test, yet has the
advantage that problems of rejection due to the form of the loss function rather than the
hypothesis of interest - that forecasters are rational - are lessened. Tests will still have power
to detect violations of rationality.
Forecast rationality tests merely verify whether, under the loss, L, the forecasts are optimal with respect to a set of variables, Vt , known to the forecaster. They can therefore be
viewed as tests of moment conditions, which arise from first order conditions of the forecaster’s optimization problem. Traditional rationality tests, such as the one proposed by
Mincer and Zarnowitz (1969), adopt a regression based approach to testing these orthogonality conditions. A natural alternative, which we propose here, is to use a Generalized
Method of Moments (GMM) framework as in Hansen (1982). The benefits of the latter are
easily illustrated in the ‘Quad-Quad’ case. If the asymmetry parameter, α0 , is unknown it
is impossible to compute the term (1 − 2α0 )|et+1 | and hence not feasible to estimate the
regression coefficient, β, in (9). However, it is still possible to test whether the moment
P +τ −1
conditions E[ Tt=τ
Vt ((α0 − 1(et+1 < 0))|et+1 | − β 0 Vt )] = 0 hold, with β = 0 and α0 left
unspecified.
The statistic suggested by Elliott, Komunjer and Timmermann (2002) for testing the
null hypothesis that the forecasts are rational takes the form of a test for overidentification
16
in a GMM framework:
JT ≡ T
−1
TX
+τ −1
[
t=τ
vt (ˆ
αT − 1(et+1
< 0))|et+1 |] Sˆ−1 [
0
TX
+τ −1
t=τ
vt (ˆ
αT − 1(et+1 < 0))|et+1 |].
(11)
P +τ −1
E[Vt Vt0 · (1(et+1 < 0) − α0 )2 · |et+1 |2 ],
Here Sˆ is a consistent estimator of S ≡ T −1 Tt=τ
and α
ˆ T is a linear Instrumental Variable (IV) estimator of α0 ,
[
α
ˆT ≡
T +τ
P−1
t=τ
T +τ
P−1
vt |et+1 |]0 · Sˆ−1 · [
vt (1(et+1 < 0)|et+1 |]
t=τ
T +τ
P−1
[
t=τ
vt |et+1
|]0
T +τ
P−1
· Sˆ−1 · [
vt |et+1 |]
.
(12)
t=τ
In other words, the GMM overidentification test (J-test) is a consistent test of the null
hypothesis that the forecasts are rational, i.e. β = 0, even if the true value of the asymmetry
parameter α0 is unknown, and the forecast errors depend on previously estimated parameters.
The test is asymptotically distributed as a χ2d−1 random variable and rejects for large values.
Effectively, we exploit the first order conditions under forecast rationality, E[Vt (α0 −1(et+1 <
0))|et+1 |] = 0, for each observation with α0 left unspecified. As a by-product, an estimate of
the asymmetry parameter, α
ˆ T , is generated from equation (12).12
Intuitively, the power of our test arises from the existence of overidentifying restrictions.
In practice, for each element of Vt we could obtain an estimate for the asymmetry parameter,
α0 , that would rationalize the observed sequence of forecasts. However, when the number of
instruments, d, is greater than one, our method tests that the implied asymmetry parameter
is the same for each moment condition. If no common value for α0 satisfies all of the moment
conditions, the test statistic JT in equation (11) becomes large. This explains why the test
still has power against the alternative that the forecasts were not constructed rationally and
why it is not possible to justify arbitrary degrees of inefficiency in the forecasts by means of
12
The covariance matrix S can be consistently estimated by replacing the population moment by a sample
ˆ αT ) = T −1 P vt vt0 (1(et+1 < 0)−¯
average and the true parameter by its estimated value, so that S(¯
αT )2 |et+1 |2 ,
where α
¯ T is a consistent initial estimate of α0 (obtained by setting S = I, for example), or by using some
heteroskedasticity and autocorrelation robust estimator, such as Newey and West’s (1987) estimator. Formal
proofs of these results as well as a more precise statement of the underlying assumptions are provided in
Elliott, Komunjer and Timmermann (2002).
17
asymmetric loss: if the forecasts did not efficiently use the information in Vt , then α
ˆ T would
be very different for each of the moment conditions and the test would reject.13
Although this approach does not impose a fixed value of α0 , it still assumes that the loss
function belongs to the family (3) or (4) and the test (11) provides a joint test of rationality
and this assumption. The advantage of this approach is that it loses little power since only
one or two parameters have to be estimated. It is possible to take an even less restrictive
approach and estimate the moment conditions non-parametrically. However, this is unlikely
to be a useful strategy in view of the very short data samples typically available on individual
forecasters.14
6
Empirical Results
To see how asymmetric loss affects the empirical results from Section 2, derived under MSE
loss, we proceed to test rationality of the output forecasts under ‘Quad-Quad’ loss. Results
under four different sets of instruments, Vt , are considered, namely: (1) a constant and the
lagged forecast error, (2) a constant and lagged actual GDP growth, (3) a constant, the
lagged forecast error and the lagged value of GDP growth, and (4) a constant and the lagged
absolute forecast error. These instruments are similar to those adopted in the literature and
have power to detect predictability in forecast errors such as serial correlation.
6.1
Rationality Tests
Table 2 shows the outcomes of two separate tests for rationality. The first test is for the joint
hypothesis of rationality and symmetric loss (α0 = 1/2). The second test is for rationality
but allows for asymmetry within the context of the more general family of ‘Quad-Quad’ loss
functions (4).
13
If we were to impose a value for α in the JT statistic (11), the resulting test would be identical to the
test of β = 0 in the efficiency regression (9).
14
Alternatively, one could compare results for different values of p. Our empirical results suggested that
the exact functional form of the asymmetry (e.g., lin-lin with p = 1 versus quad-quad with p = 2) is less
important than allowing for asymmetric loss in the first instance.
18
The joint hypothesis of rationality and symmetric loss is strongly rejected for many
forecasters. For instance, when three instruments are used, the null is rejected at the 1%
level for 20 forecasters and it gets rejected for 34 forecasters at the 5% level and 42 forecasters
at the 10% level. The results are very different when we no longer impose symmetry on the
loss function. For this case no rejection is found at the 1% level, while four forecasts produce
a rejection at the 5% level and 11 do so at the 10% level.
Standard tests of forecast rationality thus have strong power towards detecting asymmetry in the loss function. In fact, rejections of the joint hypothesis of rationality and symmetry
appear mostly to be driven by the symmetry assumption. Our rejection frequencies under
asymmetric loss are almost exactly equal to the size of the test and hence suggest little
evidence against the joint null of asymmetric loss and efficient forecasts.
6.2
Estimates of Loss Parameters
So far we have not discussed the α−estimates although clearly there is considerable economic
information in these values which should reflect the shape of the forecasters’ loss function.
Figure 3 shows a histogram of the 98 α−estimates computed using (12) for Vt = 1. The
evidence is clearly indicative of asymmetric loss. Irrespective of which set of instruments is
used, the proportion of α−estimates above one-half never exceeds 20%.
Since the target variable is output growth, asymmetric loss must be related to differential
inventory holding and stockout costs. Estimates of α below one-half are consistent with loss
functions that penalize negative forecast errors more heavily than positive ones. Our results
suggest that many individuals in the survey prefer to underpredict output growth, thereby
creating the positive bias in the forecast error reported earlier. This is consistent with
stockout costs being lower than inventory holding costs.
Importantly, the α−estimates suggested by our data do not appear to be ‘extreme’ and
are clustered with a mode around 0.38. This corresponds to putting around twice as large a
weight on positive forecast errors as on negative ones, consistent with inventory costs being
twice as large as stockout costs. Such values do not appear to be implausible. We might
have found α−values much closer to zero in which case the degree of asymmetry required to
19
explain biases in the forecasts would have to be implausibly large.
The small portion of α−estimates exceeding one-half may in part reflect sampling error.
However, the direction of the bias could also differ across industries if holding and stockout
costs are industry specific. For example, some industries have storage capacity constraints
which can be regarded as increased inventory holding costs. In broad terms, however, we
would expect similarity in the direction of the bias across industries, as indeed we find.
6.3
Bias and Type of Forecaster
The SPF data does not identify the affiliation of the forecaster. It is natural, however, to
expect the extent of loss asymmetry to be different for forecasters associated with academia,
banking and industry. It seems more plausible that academics have less of a reason to
produce biased forecasts than, say, industry economists whose forecasts are produced for a
specific firm or industry and thus - at least in theory - should put more weight on positive
forecast errors if, e.g., inventory costs exceed stockout costs. It is more difficult to conjecture
the size and direction of the bias for the banking forecasters. If these were produced for
clients that were fully hedged with regard to unanticipated shocks to economic growth, one
would expect α−estimates closer to one-half. However, if bank losses arising from overpredictions of economic growth exceed those from underpredictions, again we would expect
more α−estimates below one-half than above it.
To consider this issue, we used data from the Livingston survey which lists the forecaster’s affiliation. Unfortunately this data set tends to be much shorter as forecasts are
only generated every six months. We therefore only required a minimum of 10 observations.
This leaves us with 12 industry, five academic and 12 forecasters from the banking sector admittedly a very small sample.
The α−estimates for these forecasters are shown in Figure 4. Academic forecasters tend
to produce α−estimates closer to one-half than the forecasters from industry and banking.
In fact, the joint null of rationality and α = 1/2 is not rejected for any of the academic
forecasters, while this hypothesis was rejected at the 5% level for two of the 12 industry
forecasters and for five of the 12 banking forecasters. While this evidence is by no means
20
conclusive given the very small sample available here, it is indicative that differential costs
associated with positive and negative forecast errors play a role in explaining forecast biases
in macroeconomic data.
7
Summary and Discussion
Many empirical studies have found forecasts to be biased. Does this mean that forecasters
genuinely use information inefficiently and hence are irrational or simply that they have
asymmetric loss? We have shown in this paper that standard forecast efficiency tests often
cannot distinguish between these two possible explanations. The importance of this point
was validated empirically: we found that previous rejections of rationality may well have been
driven by the assumption of symmetric loss since rejections occur far less frequently under
asymmetric loss. Our results suggest that rejections of forecast rationality and symmetric loss
reported in the existing literature are not robust to relaxing the symmetry assumption and
that the power of standard tests is very much derived from their ability to reject symmetric
loss. This is an important point which many previous papers have expressed concern about.15
To deal with this problem, we proposed a more general framework for rationality testing
that applies to a flexible family of loss functions that allow for asymmetries and nests MSE
loss as a special case. While more general loss functions than those proposed here can
certainly be thought of, the advantage of our framework is that it links asymmetry to a
single parameter, thus keeping the loss in the power of the test to a minimum. This is
crucial in empirical analysis where only relatively short time series of individual forecasts
typically is available and low power is an important concern. Furthermore, our results appear
to be robust to the specific functional form maintained for the loss function, the key being
to allow positive and negative forecast errors to be weighted differently.
Our generalized tests do not imply that any sequence of forecasts - even inefficient ones
15
Keane and Runkle (1990, page 719) write “If forecasters have differential costs of over- and underpredic-
tion, it could be rational for them to produce biased forecasts. If we were to find that forecasts are biased,
it could still be claimed that forecasters were rational if it could be shown that they had such differential
costs.”
21
- can be rationalized by asymmetric loss. Quite on the contrary: each moment condition
leads to a different value of the loss asymmetry parameter if the forecasts do not efficiently
incorporate the information in each instrument and hence to a rejection of rationality. Only
when forecasts are computed efficiently should each instrument lead to the same value of the
asymmetry parameter.
Our empirical findings raise the question whether the degree of asymmetry in the loss
function required for forecasts to be efficient is excessive given what is known about firms’
cost function. There is, of course, a precursor for this type of question. In finance, the
equity premium puzzle consists of the finding that the value of the risk aversion parameter
required for mean (excess) stock returns to be consistent with a representative investor model
appears to be implausibly high, c.f. Mehra and Prescott (1985). In our context, the empirical
findings do not suggest that the degree of loss asymmetry required to overturn rejections of
rationality needs to be very severe although, ultimately, this implication is best addressed
by considering empirical (micro) data on costs.
Asymmetric loss offers an obvious explanation for the very diverse results reported in the
empirical literature on rationality testing and the large dispersion in individuals’ forecasts
documented by Mankiw, Reis and Wolfers (2003). Loss functions reflect individuals’ preferences so there are no reasons why they should be identical across individuals or even across
different variables since the consequences of forecast errors may well be different for, say,
inflation and output forecasts. Since the vast majority of empirical studies has maintained
quadratic loss, the very mixed empirical results reported in the literature could well be
consistent with varying degrees of loss asymmetry. Our findings emphasize the importance
of allowing for heterogeneity in loss functions, as indicated by the differences in the estimated asymmetry parameters observed for economists with academic, banking and industry
affiliations.
Heterogeneity in loss function parameters also help to explain findings in the empirical
literature that would otherwise be very puzzling. Zarnowitz (1985) reports that composite
group forecasts are rejected less frequently than individual forecasts. Suppose the degree of
asymmetry differ across individual forecasters’ loss functions. As we have shown, this may
22
lead to rejections of standard rationality tests for forecasters with α 6= 1/2. However, if some
α-values are below one-half while others are above, then the simple average of forecasts will
be less biased than many of the individual forecasts and is less likely to lead to a rejection
of rationality tests.
For sure, there are alternative explanations of forecast biases such as forecasters’ strategic
behavior. It is less clear whether such explanations are supported empirically. Ehrbeck and
Waldmann (1996) use data on forecasts of interest rates to test both cross-sectional and
time-series implications of an agency model and find that their model is rejected empirically.
This leads them to question the rational expectations hypothesis. Our results indicate that
such a conclusion may be premature when asymmetries in the loss function are considered.
References
[1] Arrow, K.J., S. Karlin, and H. Scarf, 1958, Studies in the Mathematical Theory of
Inventory and Production. Stanford: Stanford University Press.
[2] Batchelor, R. and D.A. Peel, 1998, Rationality Testing under Asymmetric Loss. Economics Letters 61, 49-54.
[3] Benjaafar, S., J-S Kim and N. Vishwanadhan, 2002, On the effect of product variety in
production. University of Minnesota.
[4] Bonham, C. and R. Cohen, 1995, Testing the rationality of price forecasts: Comment.
American Economic Review 85, 284-289.
[5] Bray, M. and Goodhart, C. , 2002, ‘You Might as Well be Hung for a Sheep as a Lamb’:
The Loss Function of an Agent, LSE - FMG Discussion Paper 418.
[6] Brown, B.Y. and S. Maital, 1981, What do economists know? An empirical study of
experts’ expectations. Econometrica 49, 491-504.
[7] Chadha, J. and Schellekens, P., 1998, Utility Functions for Central Bankers: The Not
So Drastic Quadratic, LSE - FMG Discussion Paper 308.
23
[8] Christoffersen, P.F. and F.X. Diebold, 1997, Optimal prediction under asymmetric loss.
Econometric Theory 13, 808-817.
[9] Davies, A. and K. Lahiri, 1995, A New Framework for Analyzing three-dimensional
Panel Data. Journal of Econometrics 68, 205-227.
[10] Ehrbeck, T. and Waldmann, R., 1996, Why are professional forecasts biased? Agency
versus behavioral explanations, Quarterly Journal of Economics, 111, 21-40.
[11] Elliott, G., I. Komunjer and A. Timmermann, 2002, Estimating Loss Function Parameters. Mimeo University of California San Diego and Caltech.
[12] Fama, E.F., 1975, Short-Term Interest Rates as Predictors of Inflation. American Economic Review 65, 269-82.
[13] Granger, C.W.J., and P. Newbold, 1986, Forecasting Economic Time Series, Second
Edition. Academic Press.
[14] Hansen, L.P., 1982, Large Sample Properties of Generalized Method of Moments Estimators. Econometrica 50, 1029-1054.
[15] Keane, M.P. and D.E. Runkle, 1990, Testing the Rationality of Price Forecasts: New
Evidence from Panel Data. American Economic Review 80, 714-735.
[16] Krane, S.D., 1994, The Distinction between Inventory Holding and Stockout Costs:
Implications for Target Inventories, Asymmetric Adjustment, and the Effect of Aggregation on Production Smoothing. International Economic Review 35, 117-136.
[17] Lamont, O., 1995, Macroeconomic Forecasts and Microeconomic Forecasters. NBER
working paper 5284.
[18] Leitch, G. and J.E. Tanner, 1991, Economic forecast evaluation: profits versus the
conventional error measures, American Economic Review 81, 580-90.
[19] Mankiw, N.G., R. Reis and J. Wolfers, 2003, Disagreement about Inflation Expectations.
NBER Macroeconomics Annual, 2003.
24
[20] McCracken, M.W., 2000, Robust Out-of-Sample Inference, Journal of Econometrics, 99,
195-223.
[21] Mehra, R. and E. Prescott, 1985, The Equity Premium: A Puzzle, Journal of Monetary
Economics 15, 145-161.
[22] Mincer, J. and V. Zarnowitz, 1969, The Evaluation of Economic Forecasts. In J. Mincer,
ed., Economic Forecasts and Expectations. National Bureau of Economic Research, New
York.
[23] Mishkin, F.S., 1981, Are Markets Forecasts Rational? American Economic Review 71,
295-306.
[24] Newey, W., and K.D. West, 1987, A Simple, Positive Semi-Definite, Heteroskedasticity
and Autocorrelation Consistent Covariance Matrix. Econometrica 55, 703-708..
[25] Peel, D.A. and A.R. Nobay, 1998, Optimal Monetary Policy in a Model of Asymmetric
Central Bank Preferences, LSE - FMG discussion paper 0306.
[26] Pons-Novell, J., 2003, Strategic Bias, Herding Behaviour and Economic Forecasts, Journal of Forecasting, 22, 67-77.
[27] Scharfstein, D. and J. Stein, 1990, Herd Behavior and Investment. American Economic
Review 80, 464-479.
[28] Stekler, H.O., 2002, The Rationality and Efficiency of Individuals’ Forecasts. Chapter
10 in M.P. Clements and D.F. Hendry (eds.) A Companion to Economic Forecasting.
Blackwell Publishers.
[29] Truman, B., 1994, Analyst Forecasts and Herding Behavior, Review of Financial Studies, 7, 97-124.
[30] West, K.D., 1996, Asymptotic Inference about Predictive Ability. Econometrica 64,
1067-84
25
[31] West, K.D. and M.W. McCracken, 1998, Regression-Based Tests of Predictive Ability,
International Economic Review 39, 817-840.
[32] Zarnowitz, V., 1979, An Analysis of Annual and Multiperiod Quarterly Forecasts of
Aggregate Income, Output, and the Price Level. Journal of Business 52, 1-33.
[33] Zarnowitz, V., 1985, Rational Expectations and Macroeconomic Forecasts. Journal of
Business and Economic Statistics 3, 293-311.
[34] Zellner, A., 1986, Biased Predictors, Rationality and the Evaluation of Forecasts. Economics Letters 21, 45-48.
26
Data Appendix
Our empirical application uses the growth in quarterly seasonally adjusted nominal US
GDP in billions of dollars before 1992 and nominal GNP after 1992. The growth rate
is calculated as the difference in natural logs. Data for the actual values come from two
sources. The official (revised) data is from the BEA. To avoid using revised data that was
not historically available to the forecasters we also use real-time data from the Philadelphia
Fed. This provides the vintages of data available in real time and takes the following form:
68.IV
69.I
68.IV
NA
69.I
NA
NA
69.II
NA
69.III
69.IV
69.II 69.III 69.IV
887.8 887.4
892.5
892.5
903.4
908.7
908.7
NA
NA
925.1
924.8
NA
NA
NA
NA
942.3
NA
NA
NA
NA
NA
Rows represent the dates corresponding to the index while columns track the vintage. So,
in 1969.IV, a forecaster looked at a value of 942.3 for 69.III, 924.8 for 69.II and so on. This
real-time data is used to construct real time instruments used in the rationality tests. Both
the lagged forecast error and the lagged value of output growth are based on the historical
vintages available in real time.
Data on the forecasts come from the Survey of Professional Forecasters, also maintained
by the Philadelphia Fed. This data runs from the fourth quarter of 1968 to the first quarter
of 2002. It provides the quarter, the number of the forecaster, the most recent value known
to the forecaster (preceding), the value (most of the times forecasted) for the current quarter
(current) and then forecasts for the next four quarters. We use the values corresponding to
the current and the first forecast to calculate the one-step-ahead growth rate.16
Some forecasters report missing values while others decide to leave for a while, but then
return and continue to produce forecasts. To deal with these problems we followed three
steps. We eliminate individuals with less than 20 forecasts (so, from a total of 512 individuals
16
A few forecasts were omitted from the data base. There were clear typos for forecaster number 12
(1989.II), forecasters 20 and 62 (1992.IV) and forecaster 471 (1997.II).
27
we keep 107 forecasters).17 We then eliminate forecasters with missing values. This reduces
the number of individual forecasters to 98.
The Livingston data considered in Section 6.3 uses the difference in the logs of the sixmonth forecast (two quarters ahead) over the forecast of the current quarter and starts in
the second semester of 1992 which is the time when current quarter figures start to get
included. Data runs through the second semester of 2002. This data contains information
on the affiliation of the forecasters. Most affiliations have very few observations, so only
those corresponding to Industry, Academic and Banking were considered. Individuals with
implausibly large forecast errors (greater than 5 percentage points over a six-month period)
and too few observations (less than ten) were excluded from the analysis. This leaves us
with five Academic forecasters, 12 Banking forecasters and 12 Industry forecasters.
17
103 out of these 107 individuals have a gap of at least one quarter in their reported forecasts. Most
forecasters skip one or more quarters.
28
Appendix A
This appendix describes the forecasting setup and lists the assumptions used to establish
Propositions 1 and 2 and Corollary 3. We use the following notations: if v is a real d-vector,
P
v = (v1 , . . . , vd )0 , then |v| denotes the standard L2 -norm of v, i.e. |v|2 = v0 v = di=1 vi2 .
If M is a real d × d-matrix, M = (mij )16i,j6d , then |M| denotes the L∞ -norm of M, i.e.
|M| = max16i,j6d |mij |.
Forecasting scheme:
As a preamble to our proofs, it is worth pointing out that the estimation uncertainty of the
observed forecasts, which we hereafter denote fˆt+1 , gives rise to complications when testing
rationality. The models used by the forecasters to produce fˆt+1 are typically unknown to the
econometrician or forecast user. Indeed, there are a number of different forecasting methods
which can be used by the forecasters at the time they make their forecasts, most of which
involve estimating (or calibrating) some forecasting model.
realizations of Yt+1
yτ +1
τ
forecasts of Yt+1
τ+1
Ωτ
Ωτ +1
fˆτ +1
fˆτ + 2
yτ + 2
...
yt
...
τ+2 . . . t . . . n
ΩT +τ −1
...
fˆt
...
yT +τ
n+1=T+τ
time
forecasters’
information
fˆT +τ
In addition to different models employed, forecasts may also differ according to the forecasting scheme used to produce them. For example, a fixed forecasting scheme constructs
the in-sample forecasting model only once, then uses it to produce all the forecasts for the
out-of-sample period. A rolling window forecasting scheme re-estimates the parameters of
the forecasting model at each out-of-sample point. In order to fix ideas, we assume that all
29
the observed forecasts are made recursively from some date τ to τ + T as depicted in the
figure above, so that the sequence {fˆt+1 } depends on recursive estimates of the forecasting
model. The sampling error caused by this must be taken into account (see, e.g., West (1996),
West and McCracken (1998), McCracken (2000)). Throughout the proofs we assume that
the forecasters’ objective is to solve the problem
τ +T
X−1
min E[
{ft+1 }
t=τ
α|et+1 |p 1(et+1 ≥ 0) + (1 − α)|et+1 |p 1(et+1 < 0)],
(13)
∗
and thus define a sequence of forecasts {ft+1
} and corresponding forecast errors {e∗t+1 }. It
∗
} which minimizes the above expectation is unobservable in
is important to note that {ft+1
practice. Instead we assume the econometrician observes {fˆt+1 } thus taking into account
that the observed sequence of forecasts embodies a certain number of recursively estimated
parameters of the forecasting model.
Assumptions:
˚
(A1) β ∈ B where the parameter space B ⊆ Rd and B is compact. Moreover β ∗ ∈ B;
(A2) for every t, τ 6 t < T + τ , the forecast of Yt+1 is a measurable function of an Ωt -
measurable h-vector Wt , i.e. ft+1 = ft+1 (Wt ), where the function ft+1 is unknown but
∗
bounded, i.e. supθ∈Θ |ft+1 (Wt )| 6 C < ∞ with probability one, and fˆt+1 = ft+1
+ op (1);
(A3) the d-vector Vt is a sub-vector of the h-vector Wt (d 6 h) with the first component 1
and for every t, τ 6 t < T + τ , the matrix E[Vt Vt0 ] is positive definite;
(A4) {(Yt , Wt0 )} is an α-mixing sequence with mixing coefficient α of size −r/(r − 2), r > 2,
and there exist some ∆Y > 0, ∆V > 0 and δ > 0 such that for every t, τ 6 t < T + τ ,
E[|Yt+1 |2r+δ ] 6 ∆Y < ∞ and E[|Vt |2r+δ ] 6 ∆V < ∞;
30
Appendix B
p
Proof of Proposition 1. In the first part of this proof we show that βˆ → β ∗ , where
P +τ −1
P +τ −1
β ∗ ≡ ( Tt=τ
E[Vt Vt0 ])−1 · ( Tt=τ
E[Vt e∗t+1 ]). We then use this convergence result in the
ˆ
second part of the proof to derive the expression for the misspecification bias of β.
P +τ −1 0 −1 PT +τ −1
Recall from Section 4 that the standard OLS estimator is βˆ ≡ [ Tt=τ
vt vt ] [ t=τ vt eˆt+1 ].
p
In order to show that βˆ → β ∗ , it suffices to show that the following conditions hold:
(i) β ∗ is the unique minimum on B (compact in Rd ) of the quadratic form S0 (β) with
P +τ −1
P +τ −1 0 p −1 PT +τ −1
S0 (β) ≡ T −1 Tt=τ
E[(e∗t+1 − β 0 Vt )2 ]; (ii) T −1 Tt=τ
vt vt → T
E[Vt Vt0 ]; (iii)
t=τ
P +τ −1
P +τ −1
p
vt eˆt+1 → T −1 Tt=τ
E[Vt e∗t+1 ]. From the positive definiteness of E[Vt Vt0 ], for
T −1 Tt=τ
all t (assumption A3) and the continuity of the inverse function (away from zero), it then
p
follows that βˆ → β ∗ .
P +τ −1
P +τ −1
We start by showing (i): note that S0 (β) = T −1 Tt=τ
E[(e∗t+1 )2 ]−2β 0 T −1 Tt=τ
E[Vt e∗t+1 ]+
P +τ −1
β 0 T −1 Tt=τ
E[Vt Vt0 ]β, so S0 (β) admits a unique minimum at β ∗ if for every t, τ 6 t < T +τ ,
the matrix E[Vt Vt0 ] is positive definite, which is satisfied by assumption (A3). This verifies
the uniqueness condition (i).
In order to show (ii) and (iii), we use a law of large numbers (LLN) for α-mixing sequences
(e.g., Corollary 3.48 in White, 2001). By assumptions (A2) and (A3) we know that for every
t, τ 6 t < T + τ , fˆt+1 and Vt are measurable functions of Wt which by (A4) is an α-mixing
sequence with mixing coefficient α of size −r/(r − 2), r > 2. Hence, by Theorem 3.49 in
White (2001, p 50) we know that {(ˆ
et+1 Vt0 , vec(Vt Vt0 )0 )0 }, where eˆt+1 = Yt+1 − fˆt+1 , is an
α-mixing sequence with mixing coefficient α of the same size −r/(r − 2), r > 2. For δ > 0,
we have r + δ/2 > 2 and r/2 + δ/4 > 1 so by assumption (A4)
E[|Vt Vt0 |r/2+δ/4 ] 6 E[|Vt |r+δ/2 ]
6 max{1, ∆V } < ∞,
1/2
for all t, τ 6 t < T + τ . Hence, by applying the results from Corollary 3.48 in White (2001)
P +τ −1 0
vt vt converges in probability to
to the sequence {vec(Vt Vt0 )0 }, we conclude that T −1 Tt=τ
P
+τ −1
E[Vt Vt0 ], which shows that (ii) holds.
its expected value T −1 Tt=τ
31
Similarly, we know by the Cauchy-Schwartz inequality that, for all t, τ 6 t < T + τ ,
E[|Vt eˆt+1 |r/2+δ/4 ] 6 (E[|Vt |r+δ/2 ])1/2 · (E[|ˆ
et+1 |r+δ/2 ])1/2 .
Hence there exists some nr,δ ∈ R+
∗ , nr,δ < ∞, such that
1/2
E[|Vt eˆt+1 |r/2+δ/4 ] 6 max{1, ∆V } · (nr,δ · (E[|Yt+1 |r+δ/2 ] + E[|fˆt+1 |r+δ/2 ]))1/2
6 max{1, ∆V } · nr,δ · (max{1, ∆Y } + max{1, C r+δ/2 })1/2
1/2
1/2
1/2
< ∞,
for all t, τ 6 t < T +τ , where we have used assumptions (A2) and (A4). Hence, our previous
P +τ −1
argument applies to the sequence {ˆ
et+1 Vt0 } as well, and we conclude that T −1 Tt=τ
vt eˆt+1
P
+τ −1
converges in probability to its expected value T −1 Tt=τ
E[Vt eˆt+1 ]. Note, however, that
this does not ensure that (iii) holds, as we moreover need to show that substituting e∗t+1 for
P +τ −1
p
E[Vt eˆt+1 ] − E[Vt e∗t+1 ] → 0. For every t,
eˆt+1 does not affect the result, i.e. that T −1 Tt=τ
τ 6 t < T + τ , we have
∗
|E[Vt · (ˆ
et+1 − e∗t+1 )]| = |E[Vt · (ft+1
− fˆt+1 )]|
∗
− fˆt+1 )2 ])1/2
6 (E[|Vt |2 ])1/2 · (E[(ft+1
∗
ˆ 2 1/2 .
6 max{1, ∆1.2
V } · (E[(ft+1 − ft+1 ) ])
P +τ −1
∗
Since by (A2) we know that ft+1
− fˆt+1 = op (1), for all t, we get T −1 Tt=τ
E[Vt eˆt+1 ] −
p
E[Vt e∗t+1 ] → 0. Combined with our previous result this shows that (iii) holds. Hence, we
p
conclude that βˆ → β ∗ .
ˆ We know from Section 4 that
We now use this convergence result to derive the bias in β.
the parameter β in the generalized regression (9) satisfies the set of identifying constraints
T −1
TX
+τ −1
t=τ
so that T −1
PT +τ −1
E[Vt · (2(α0 − 1(e∗t+1 < 0))|e∗t+1 | − β 0 Vt )] = 0,
2E[(α0 − 1(e∗t+1 < 0))Vt |e∗t+1 |] = T −1
PT +τ −1
E[Vt Vt0 ]β. Using that
P +τ −1
E[Vt e∗t+1 ] −
2 · 1(e∗t+1 < 0)|e∗t+1 | = |e∗t+1 | − e∗t+1 , this last equality can be written T −1 Tt=τ
P +τ −1
P +τ −1
T −1 Tt=τ
E[(1−2α0 )Vt |e∗t+1 |] = T −1 Tt=τ
E[Vt Vt0 ]β so by positive definiteness of E[Vt Vt0 ]
P +τ −1
P +τ −1
(assumption A2) we have β = (T −1 Tt=τ
E[Vt Vt0 ])−1 · {T −1 Tt=τ
E[Vt e∗t+1 ] − E[(1 −
t=τ
32
t=τ
2α0 )Vt |e∗t+1 |]}. In other words, β = β ∗ −(1−2α0 )·(T −1
PT +τ −1
P +τ −1
E[Vt Vt0 ])−1 ·(T −1 Tt=τ
E[Vt |e∗t+1 |]).
P +τ −1
≡ T −1 Tt=τ
E[Vt Vt0 ] and hV ≡
t=τ
p
This shows that βˆ → β + (1 − 2α0 )Σ−1
V hV with ΣV
P
+τ −1
T −1 Tt=τ
E[Vt |e∗t+1 |], which completes the proof of Proposition 1.18
Proof of Proposition 2. We now show that T 1/2 (βˆ − β ∗ ) is asymptotically normal by
expanding the first order condition for βˆ around β ∗ :
TX
+τ −1
[
t=τ
0
vt (ˆ
et+1 − βˆ vt )] = 0 = [
TX
+τ −1
t=τ
∗0
TX
+τ −1
vt (ˆ
et+1 − β vt )] − (
t=τ
vt vt0 )(βˆ − β ∗ ).
(14)
P +τ −1
P +τ −1
vt (ˆ
et+1 − β ∗0 vt )] = [ Tt=τ
vt (e∗t+1 − β ∗0 vt )] + op (1), toThe idea then is to use (i) [ Tt=τ
P
P
d
gether with (ii) T −1/2 Tt=1 vt (e∗t+1 −β ∗0 vt ) → N(0, ∆(β ∗ )), where ∆(β ∗ ) ≡ T −1 Tt=1 E[(e∗t+1 −
β ∗0 Vt )2 · Vt Vt0 ], to show by Slutsky’s theorem that
T
−1/2
TX
+τ −1
t=τ
d
vt (ˆ
et+1 − β ∗0 vt )] → N (0, ∆(β ∗ )).
(15)
The remainder of the asymptotic normality proof is then similar to the standard case: the
PT +τ −1 0 ˆ p
−1
ˆ
positive definiteness of Σ−1
vt vt , ΣV → ΣV , ensure
V , and the consistency of ΣV = T
t=τ
P
ˆ −1 T −1/2 T +τ −1 vt (ˆ
that the expansion (14) is equivalent to T 1/2 (βˆ − β ∗ ) = Σ
et+1 − β ∗0 vt ).
V
t=τ
We then use the limit result in (15) and Slutsky’s theorem to show that
d
∗
−1
T 1/2 (βˆ − β ∗ ) → N (0, Σ−1
V · ∆(β ) · ΣV ),
which is what Proposition 2 states.
Hence, we need to show that conditions (i) and (ii) hold: For (i) it is sufficient to show that
PT +τ −1
P +τ −1 ∗ p
vt eˆt+1 − Tt=τ
vt et+1 → 0. By the triangular inequality
t=τ
|
TX
+τ −1
t=τ
TX
+τ −1
vt eˆt+1 −
t=τ
vt e∗t+1 |
6|
TX
+τ −1
t=τ
TX
+τ −1
vt eˆt+1 −
t=τ
E[Vt e∗t+1 ]|+|
TX
+τ −1
t=τ
TX
+τ −1
∗
vt et+1 −
E[Vt e∗t+1 ]|.
t=τ
p
p
ˆ V − hV →
ˆ V ≡ T −1 PT +τ −1 vt |ˆ
ˆ V − ΣV →
Moreover, these results ensure that h
0 and Σ
0 where h
et+1 |
t=τ
P
T
+τ
−1
−1
0
ˆV ≡ T
and Σ
vt vt , which makes the estimation of the bias components straightforward.
t=τ
18
33
Recall from the proof of Proposition 1 that T −1
PT +τ −1
t=τ
p
vt eˆt+1 → T −1
PT +τ −1
t=τ
E[Vt e∗t+1 ]
so the first term of the right-hand side of the previous inequality converges in probability to zero. Moreover, the LLN applied to the α-mixing sequence {e∗t+1 Vt0 } ensures that
P +τ −1 ∗ p −1 PT +τ −1
vt et+1 → T
E[Vt e∗t+1 ], given assumptions (A2) and (A4). Therefore,
T −1 Tt=τ
t=τ
P +τ −1
P +τ −1 ∗
p
we conclude that | Tt=τ
vt eˆt+1 − Tt=τ
vt et+1 | → 0, which implies that (i) holds.
P
d
We now show that (ii) holds as well, i.e. that T −1/2 Tt=1 vt (e∗t+1 −β ∗0 vt ) → N(0, ∆(β ∗ )) with
P
∆(β ∗ ) = T −1 Tt=1 E[(e∗t+1 − β ∗0 Vt )2 · Vt Vt0 ]. For that, we use a central limit theorem (CLT)
for α-mixing sequences (e.g. Theorem 5.20 in White, 2001): first, note that, by construction,
E[Vt (e∗t+1 − β ∗0 Vt )] = 0. For r > 2, the Cauchy-Schwartz inequality and assumption (A4)
imply that
E[|Vt (e∗t+1 − β ∗0 Vt )|r ] 6 (E[|Vt |2r ])1/2 · (E[(e∗t+1 − β ∗0 Vt )2r ])1/2
6 max{1, ∆V } · (E[nr (|e∗t+1 |2r + |β ∗ |2r |Vt |2r )])1/2
1/2
∗ 2r
∗
2r
2r 1/2
6 max{1, ∆V } · max{1, n1/2
},
r (E[|et+1 | ] + |β | E[|Vt | ])
1/2
et+1 −β ∗0 Vt )2r ] 6 E[nr (|e∗t+1 |2r +|β ∗0 Vt |2r )].
where nr ∈ R+
∗ is a constant, nr < ∞, such that E[(ˆ
∗
∗
)2r ] 6 nr (E[|Yt+1 |2r ] + E[|ft+1
|2r ]) 6 nr (∆Y + C 2r ),
Knowing that E[|e∗t+1 |2r ] = E[(Yt+1 − ft+1
we get
∗ 2r
2r
1/2
} < ∞,
E[|Vt (e∗t+1 − β ∗0 Vt )|r ] 6 max{1, ∆V } · max{1, n1/2
r (nr (∆Y + C ) + |β | ∆V )
1/2
by assumptions (A1) (β ∗ is an element of a compact set) and (A2) (boundedness of |ft+1 |).
Assumption (A3) moreover ensures that the matrix ∆(β ∗ ) is positive definite, so that the
P
d
CLT implies T −1/2 Tt=1 vt (e∗t+1 − β ∗0 vt ) → N(0, ∆(β ∗ )). This shows that (ii) holds.
√
d
The reasoning we described at the beginning of the proof then gives T (βˆ − β ∗ ) → N(0, Ω∗ )
∗
−1
with Ω∗ ≡ Σ−1
V ∆(β )ΣV . Now note that
∆(β ∗ ) = E[(e∗t+1 − β ∗0 Vt )2 · Vt Vt0 ]
= E[ε2t+1 · Vt Vt0 ],
where εt+1 ≡ ut+1 + (1 − 2α0 )|e∗t+1 | and ut+1 is the realization of the error term Ut+1 in the
generalized Mincer-Zarnowitz (1969) regression (9). Hence,
∆(β ∗ ) = E[u2t+1 · Vt Vt0 ] + 2(1 − 2α0 )E[ut+1 · |e∗t+1 | · Vt Vt0 ] + (1 − 2α0 )2 E[|e∗t+1 |2 · Vt Vt0 ].
34
ˆ ≡
ˆ β)
Moreover, the results above ensure that ∆(β ∗ ) can be consistently estimated by ∆(
P +τ −1
0
T −1 Tt=τ
(ˆ
et+1 − βˆ vt )2 vt vt0 . Using that Σ−1
V is positive definite, we can then show that
ˆ Σ
ˆ β)
ˆ −1 is a consistent estimator of the asymptotic covariance matrix of the
ˆ ≡ Σ
ˆ −1 ∆(
Ω
V
V
p
∗
−1
ˆ Σ
ˆ i.e. Σ
ˆ β)
ˆ −1 = Ω
ˆ→
ˆ −1 ∆(
Ω∗ = Σ−1
standard OLS estimator β,
V
V
V ∆(β )ΣV .
Proof of Corollary 3. Let β = bT −1/2 and 1 − 2α0 = aT −1/2 where a and b are fixed.
We can write
0
ˆ −1 · βˆ = T 1/2 (βˆ − β ∗ )0 · Ω
ˆ −1 · T 1/2 (βˆ − β ∗ )
T βˆ · Ω
ˆ −1 · T 1/2 β ∗
+T 1/2 β ∗0 · Ω
ˆ −1 · T 1/2 (βˆ − β ∗ ).
+2T 1/2 β ∗0 · Ω
>From Proposition 2 it follows that the first term is asymptotically χ2d distributed. For
1/2 ∗
β =
the second term, recall from Proposition 1 that β ∗ = β + (1 − 2α0 )Σ−1
V hV so T
∗
−1
−1
∗
ˆ p ∗
(b + aΣ−1
V hV ) and, moreover, Ω → Ω = ΣV ∆(β )ΣV with Ω nonsingular. We then have
p
ˆ −1 β ∗ → m with
T β ∗0 Ω
∗
0
−1
−1 −1
−1
m = (b + aΣ−1
V hV ) (ΣV ∆(β )ΣV ) (b + aΣV hV )
= b0 ΣV ∆(β ∗ )−1 ΣV + 2ab0 ΣV ∆(β ∗ )−1 hV + a2 h0V ∆(β ∗ )−1 hV .
ˆ −1/2 ·T 1/2 (βˆ −
For the third term, application of Proposition 2 and Slutsky’s theorem gives, Ω
d
d
ˆ −1 (βˆ − β ∗ ) →
β ∗ ) → N(0, I). Hence, T β ∗0 Ω
N(0, s) where
0 ∗−1
(b + aΣ−1
s = (b + aΣ−1
V hV ) Ω
V hV )
= m.
0 −1
d
ˆ βˆ →
Therefore, T βˆ Ω
χ2d + m + N(0, m). Points (i) and (ii) follow from the discussion after
the Corollary.
35
Figure 1
Histogram of mean forecast errors
(bins in percentage points)
30
Frequency
25
20
15
10
5
0
-0.3
-0.2
-0.1
0.0
0.1
0.3
0.4
0.5
0.6
>0.7
Bin
Figure 2
b
0.00
0.65
1.96
3.24
0.10
0.09
0.08
0.07
0.06
0.05
0.04
0.03
0.02
0.01
0.00
-0.01
-0.02
-0.03
-0.04
-0.05
-0.06
-0.07
-0.08
-0.09
10
8
6
4
2
0
-2
-4
-6
-8
-10
-0.10
a
Iso-m (equi-power) lines
Figure 3
Histogram of alpha-estimates
30
Frequency
25
20
15
10
5
0
0.1
0.2
0.3
0.4
0.5
0.6
0.7
0.8
0.9
1
0.9
1
Bin
Figure 4
Frequency
Histogram of alpha-estimates by affiliation
9
8
7
6
5
4
3
2
1
0
0.1
0.2
0.3
0.4
0.5
0.6
0.7
0.8
Bin
Industry
Academic
Banking
Table 1: Tests for bias under MSE loss
P-value
Quad-quad
<1%
16
<5%
29
<10%
33
Note: this table reports the
number of forecasters (out of
a total of 98) for whom the null
of symmetric loss (α = ½) could be
rejected at the specified critical values.
Table 2: J-tests of rationality and symmetry of the loss function (quad-quad)
Rationality and
Rationality and
α=½
α unconstrained
Range
<1%
<5%
<10%
<1%
<5%
<10%
Inst=1
13
34
39
1
8
19
Inst=2
15
30
33
0
4
12
Inst=3
20
34
42
0
4
11
Inst=4
12
30
35
0
5
10
Note: this table reports the range for p-values up to 0.10 in J-tests of rationality and
symmetry and of rationality only. The instruments are as follows:
Inst =1: constant plus lagged errors
Inst =2: constant plus lagged actual values
Inst =3: constant plus lagged errors and actual values
Inst =4: constant plus absolute lagged errors

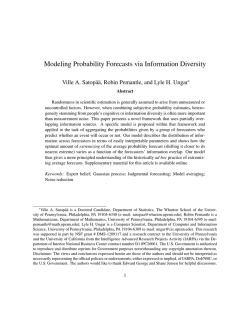
![View announcement [PDF 708.48 kB]](http://s2.esdocs.com/store/data/000465700_1-0b7c69c680e3fa00ddd1676cc9494343-250x500.png)


© Copyright 2026