
The European Union summary report on trends and - EFSA
EFSA Journal 2015;13(1):3991
SCIENTIFIC REPORT OF EFSA AND ECDC
The European Union summary report on trends and sources of zoonoses,
zoonotic agents and food-borne outbreaks in 2013 1
European Food Safety Authority 2,3
European Centre for Disease Prevention and Control2,3
European Food Safety Authority (EFSA), Parma, Italy
European Centre for Disease Prevention and Control (ECDC), Stockholm, Sweden
ABSTRACT
This report of the European Food Safety Authority and the European Centre for Disease Prevention and Control
presents the results of the zoonoses monitoring activities carried out in 2013 in 32 European countries
(28 Member States and four non-Member States). Campylobacteriosis was the most commonly reported
zoonosis. After several years of an increasing European Union (EU) trend, the human campylobacteriosis
notification rate has stabilised. In food and animals no EU trends were observed and the occurrence of
Campylobacter continued to be high in broiler meat at EU level. The decreasing EU trend in confirmed human
salmonellosis cases observed in recent years continued. Most Member States met their Salmonella reduction
targets for poultry. In foodstuffs, the reported EU-level Salmonella non-compliance in fresh poultry meat
decreased. Human listeriosis increased further, showing an increasing EU trend in 2009-2013. In ready-to-eat
foods Listeria was seldom detected above the legal safety limit. Also during 2009-2013, a decreasing EU trend
was observed in confirmed yersiniosis cases. Positive findings for Yersinia were mainly reported in pig meat and
products thereof. The number of confirmed verocytotoxigenic Escherichia coli (VTEC) infections in humans
increased. VTEC was reported from food and animals. A total of 5,196 food-borne outbreaks, including waterborne outbreaks, were reported in the EU. Most food-borne outbreaks were caused by Salmonella, followed by
viruses, bacterial toxins and Campylobacter, whereas in 28.9 % of all outbreaks the causative agent was
unknown. Important food vehicles in strong-evidence food-borne outbreaks were eggs and egg products,
followed by mixed food, and fish and fish products. The report further summarises trends and sources along the
food chain of tuberculosis due to Mycobacterium bovis, Brucella, Trichinella, Echinococcus, Toxoplasma,
rabies, Coxiella burnetii (Q fever), West Nile Virus and tularaemia.
© European Food Safety Authority, European Centre for Disease Prevention and Control, 2015
KEY WORDS
zoonoses, monitoring, Salmonella, Campylobacter, Listeria, parasites, food-borne outbreaks
1
2
3
On request of EFSA, Question No EFSA-Q-2014-00116, approved on 18 December 2014.
Correspondence: in EFSA [email protected], in ECDC [email protected]
Acknowledgement: EFSA and ECDC wish to thank the members of the Scientific Network for Zoonoses Monitoring Data
and the Food and Waterborne Diseases and Zoonoses Network who provided the data and reviewed the report; the
members of the Scientific Network for Zoonoses Monitoring Data for their endorsement of this scientific output; the EFSA
staff: Frank Boelaert, Valentina Rizzi, Giusi Amore, Anca Stoicescu, Francesca Riolo, Krisztina Nagy, Cristina Rodriguez
Pinacho, Johanna Kleine and ECDC staff: Therese Westrell, Eva Warns-Petit, Joana Gomes Dias, Csaba Ködmön and
Johanna Takkinen and the EFSA contractor, the National Food Institute, Technical University of Denmark, and staff:
Birgitte Helwigh, Helle Korsgaard, Anna Irene Vedel Sørensen and Lone Jannok Porsbo, for the support provided to this
scientific output.
Suggested citation: EFSA and ECDC (European Food Safety Authority and European Centre for Disease Prevention and
Control), 2015. The European Union Summary Report on Trends and Sources of Zoonoses, Zoonotic Agents and Food-borne
Outbreaks in 2013. EFSA Journal 2015;13(1):3991, 162 pp. doi:10.2903/j.efsa.2015.3991
Available online: www.efsa.europa.eu/efsajournal
© European Food Safety Authority, 2015
EU summary report on zoonoses, zoonotic agents and food-borne outbreaks 2013
THE EUROPEAN UNION
SUMMARY REPORT
Trends and sources of zoonoses,
zoonotic agents and food-borne
outbreaks in 2013
Approved on 18 December 2014
Published on 28 January 2015
EFSA Journal 2015;13(1):3991
2
EU summary report on zoonoses, zoonotic agents and food-borne outbreaks 2013
Summary
The report presents the results of the zoonoses monitoring activities carried out in 2013 in 32 European
countries:eg 28 Member States (MS) and four non-Member States (non-MS) European Free Trade
Association (EFTA) countries. The European Food Safety Authority (EFSA) and the European Centre for
Disease Prevention and Control (ECDC) summarised all submitted data on the occurrence of zoonoses and
food-borne outbreaks.
Campylobacter
Humans
In 2013, Campylobacter continued to be the most commonly reported gastrointestinal bacterial pathogen in
humans in the European Union (EU) and has been so since 2005. The number of reported confirmed cases
of human campylobacteriosis was 214,779 (Figure 1) with an EU notification rate of 64.8 per
100,000 population which was at the same level as in 2012. The twelve-month moving average was fairly
stable over the five-year period 2009-2013 when analysed by month. Considering the high number of human
campylobacteriosis cases, the severity in terms of reported case fatality was low (0.05 %) (Table 1).
Campylobacteriosis
(N = 214,779)
Salmonellosis
(N = 82,694)
Yersiniosis
(N = 6,471
VTEC infections
(N = 6,043)
Listeriosis
(N = 794)
Q fever
(N = 648)
Brucellosis
(N = 357)
West Nile fever(a)
(N = 250)
Tularaemia
(N = 279)
Trichinellosis
(N = 217)
TB caused by M. bovis
(N = 6,043)
Listeriosis
(N = 1,763)
Echinococcosis
(N = 794)
Q fever
(N = 648)
Brucellosis
(N = 357)
West Nile fever(a)
(N = 250)
Tularaemia
(N = 279)
Trichinellosis
(N = 217)
TB caused by M. bovis
(N = 134)
Rabies
(N = 1)
0
1
2
3
Notification rate per 100,000 population
(N = 134)
Rabies
(N = 6,471
VTEC infections
(N = 1,763)
Echinococcosis
Zoonoses
Yersiniosis
(N = 1)
0
5
10
15
20
25
30
35
40
45
50
55
60
65
70
Notification rate per 100,000 population
(a): For West Nile fever, the total number of cases was used.
(b): The ordering of the diseases is according to the notification rate.
(c): Total number of confirmed cases is indicated in parenthesis at the end of each bar.
Figure 1. Reported notification rates of zoonoses in confirmed human cases
(b),(c)
in the EU, 2013
Foodstuffs
Overall, 31.4 % of the samples (single or batch) of fresh broiler meat were found to be positive for
Campylobacter in the reporting MS, with important variations between MS. The apparent increase in the
proportion of Campylobacter-positive broiler meat samples from 2012 to 2013 is mainly due to the inclusion
EFSA Journal 2015;13(1):3991
3
EU summary report on zoonoses, zoonotic agents and food-borne outbreaks 2013
of findings from Croatia, who reported data for the first time in 2013. Campylobacter was also detected in
turkey meat at moderate level and in other foods at low to very low levels.
Animals
The majority of the tested broilers were reported by the Nordic countries, where the Campylobacter
prevalence in broilers is generally at a low to moderate level due to control programmes. Overall,
Campylobacter was found in 29.6 % of the tested slaughter batches, 15.1 % of the tested flocks and 30.4 %
of the tested animals. The prevalence in the investigations varied greatly between MS.
Campylobacter food-borne outbreaks
In 2013, 414 Campylobacter outbreaks were reported, of which 32 were strong-evidence outbreaks. The
sources of these strong-evidence outbreaks were, in decreasing order of importance, broiler meat and
products thereof; other, mixed or unspecified poultry meat and products thereof, and milk and mixed food.
Table 1. Reported hospitalisation and case-fatality rates due to zoonoses in confirmed human cases
in the EU, 2013
Disease
Campylobacteriosis
Salmonellosis
Yersiniosis
VTEC infections
Listeriosis
Echinococcosis
Q fever
Brucellosis
Tularaemia
West Nile fever(a)
Trichinellosis
Rabies
Number of
confirmed(a)
human cases
Deaths
Hospitalisation
Confirmed
cases
(a),(b)
214,779
82,694
6,471
6,043
1,763
794
648
357
279
covered
(%)
12.7
26.4
15.3
41.1
42.1
22.7
NA
55.2
26.9
250
217
1
20.8
74.7
100
Reported
Number of
Hospitalisation
hospitalised
rate (%)
reporting MS(c)
cases
Confirmed
cases
13
12
12
16
15
12
NA
9
8
11,922
7,841
481
922
735
127
NA
139
39
43.6
36.0
48.4
37.1
99.1
70.6
NA
70.6
52.0
covered(a),(b)
(%)
52.9
49.6
62.4
59.3
69.7
28.5
51.2
28.3
46.2
3
7
1
52
106
1
91.7
65.4
100
90.8
82.5
100
Number of
Reported Case-fatality
rate (%)
reporting MS(c) deaths
NA: not applicable as the information is not collected for this disease.
(a): For West Nile fever the total number of cases were included.
(b): The proportion (%) of confirmed cases for which the information on hospitalisation or death was available.
(c): Not all countries observed cases for all diseases.
14
14
14
18
19
13
11
11
9
56
59
2
13
191
2
2
1
0
0.05
0.14
0.05
0.36
15.6
0.88
0.61
0.99
0
6
8
1
16
1
1
3.4
0.56
100
Salmonella
Humans
In 2013, a total of 82,694 confirmed salmonellosis cases were reported by 27 EU MS, resulting in an EU
notification rate of 20.4 cases per 100,000 population. This represented a 7.9 % decrease in the EU
notification rate compared with 2012, and there was a declining trend of salmonellosis in the EU/European
Economic Area (EEA) in the five-year period of 2009-2013, although this was not statistically significant
when analysed by month. Fifty-nine fatal cases were reported by 9 MS among the 14 MS that provided data
on the outcome of their cases. This gives an EU case-fatality rate of 0.14 % among the 40,976 confirmed
cases for which this information was available (Table 1).
As in previous years, the two most commonly reported Salmonella serovars in 2013 were S. Enteritidis and
S. Typhimurium, representing 39.5 % and 20.2 %, respectively, of all reported serovars in confirmed human
cases. S. Enteritidis continued to decrease, with 4,720 fewer cases (14.1 % less) reported in the EU in 2013
than in 2012. In the two-year period from 2011 to 2013, cases of S. Typhimurium, including the variant
monophasic S. Typhimurium 1,4,[5],12:i:-, decreased by 11.1 %. Cases of S. Infantis, the fourth most
common serovar, increased by 26.5 %. The increase observed in S. Derby, the fifth most common serovar in
2013, could be partly explained by a local outbreak in one MS.
Foodstuffs
Generally there was no major change as regards Salmonella-contaminated foodstuffs compared with
previous years. Salmonella was most frequently detected in poultry meat, and less often in pig or bovine
meat. The highest proportions of Salmonella-positive single samples were reported for fresh turkey meat at
an average level of 5.4 %, followed by fresh broiler, pig and bovine meat. Salmonella was rarely found in
table eggs, at levels of 0.03 % (single samples) or 0.5 % (batch samples). The most important source of
EFSA Journal 2015;13(1):3991
4
EU summary report on zoonoses, zoonotic agents and food-borne outbreaks 2013
food-borne Salmonella outbreaks was, however, still eggs and egg products. Salmonella was also detected
in other foods at low to very low levels. The highest levels of non-compliance with Salmonella criteria
generally occurred in foods of meat origin, which are intended to be cooked before consumption, and the
overall level of non-compliance was low (< 10 %).
Since December 2011, a Salmonella criterion for S. Enteritidis and S. Typhimurium (including monophasic
S. Typhimurium strains with the antigenic formula 1,4,[5],12:i:-) in fresh poultry meat (including fresh meat
from breeding flocks of Gallus gallus, laying hens, broilers and breeding and fattening flocks of turkeys) has
been in force. Compared with 2012, the reported non-compliance decreased from 0.5 % to 0.2 % in single
samples and from 0.7 % to 0.2 % in batches, which is a very encouraging trend, indicating that the continued
investment of MS in Salmonella control is yielding noticeable results.
Animals
There was a further reduction of the prevalence of target Salmonella serovars in all poultry populations.
Moreover, the number of countries meeting the specific 2013 reduction target increased compared with
2012; in particular, all countries achieved the target for laying hen flocks and breeding turkey flocks.
Twenty-two MS met the Salmonella reduction target of ≤ 1 % set for breeding flocks of Gallus gallus (fowl)
and, at the EU-level, 0.4 % of these flocks were positive during their production period for the target
serovars, as in 2012. In the case of flocks of laying hens, all MS met their relative Salmonella reduction
targets and the EU prevalence for the two target serovars (S. Enteritidis and S. Typhimurium) was further
reduced from 1.3 % in 2012 to 1.0 % in 2013. In broiler flocks, 26 MS met the reduction target set at ≤ 1 %
for the two serovars (S. Enteritidis and S. Typhimurium) and the EU prevalence for the target serovars was
0.2 %, compared with 0.3 % in 2012. In turkeys, the same reduction target is in force as for broilers, and all
14 MS which reported data on turkey breeding flocks met the target, with an overall prevalence of 0.3 % for
the two target serovars (0.5 % in 2012). A further 21 MS met the target for fattening turkey flocks before
slaughter. At the EU level, 0.2 % of the fattening turkey flocks were infected with the two target serovars
(0.4 % in 2012).
Salmonella findings were also reported in other animal species, including ducks, geese, pigs, cattle, sheep
and goats.
Feedingstuffs
The overall level of Salmonella contamination in animal- and vegetable-derived feed material in 2013 was
low (1.4 %). The highest proportion of positive samples in individual investigations was reported for the feed
category ‘Feed material of oil seed or fruit origin’, mainly rape seed-derived, soya (bean)-derived, sunflower
seed-derived and cotton seed-derived feed.
In compound feedingstuffs, i.e. the finished feed for animals, the overall EU proportion of Salmonella-positive
findings in 2013 was low for all animal populations: 1.8 % of 1,091 tested samples for cattle, 1.6 % of
1,590 tested samples for pigs, and 1.9 % of 2,551 tested samples for poultry.
Serovars
From fowl (Gallus gallus) S. Infantis was the most commonly reported isolated serovar in 2013; in broiler
meat the most common serovars were S. Infantis and S. Enteritidis, while from feed for Gallus gallus,
S. Senftenberg was most commonly reported, followed by S. Typhimurium.
In turkeys it was S. Saintpaul that was most frequently reported in 2013, while in turkey meat the three most
common reported serovars were S. Derby, S. Typhimurium and S. Stanley.
S. Typhimurium was the most frequently reported serovar in pigs and pig meat followed by S. Derby and
monophasic variants of S. Typhimurium. S. Senftenberg was the serovar most often reported from pig feed,
followed by S. Typhimurium.
In cattle, it was S. Typhimurium that was most commonly reported, followed by S. Dublin. Also in bovine
meat, S. Typhimurium was the most frequently reported serovar but followed by S. Enteritidis and S. Derby.
S. Infantis was the serovar most often reported from feed for cattle, in 2013.
Salmonella food-borne outbreaks
Salmonella remained the most frequently detected causative agent in the food-borne outbreaks reported
(22.5 % of total outbreaks). From 2008 to 2013, the annual total number of Salmonella outbreaks within the
EU decreased markedly by 38.1 %, from 1,888 to 1,168 outbreaks.
EFSA Journal 2015;13(1):3991
5
EU summary report on zoonoses, zoonotic agents and food-borne outbreaks 2013
As in previous years, eggs and egg products were the most common identified food vehicles, associated
with 44.9 % of these outbreaks. The next most commonly implicated single food vehicle category in the
Salmonella outbreaks was sweets and chocolates (10.5 % of strong-evidence outbreaks), followed by pig
meat and products thereof.
Listeria
Humans
In 2013, 27 MS reported 1,763 confirmed human cases of listeriosis. The EU notification rate was 0.44 cases
per 100,000 population which represented an 8.6 % increase compared with 2012. There was a statistically
significant increasing trend of listeriosis in the EU/EEA over the period 2009-2013.
A total of 191 deaths due to listeriosis were reported in 2013 with France reporting the highest number,
64 cases. The EU case-fatality rate was 15.6 % among the 1,228 confirmed cases with known outcome
(Table 1).
Foodstuffs
In 2013, the non-compliance for different ready-to-eat (RTE) food categories was generally at a level
comparable to previous years, with the level of non-compliance highest in fishery products at processing
plant (mainly smoked fish). Consistent with the results of the EU baseline study on the prevalence of
L. monocytogenes in certain RTE foods at retail, the proportion of positive samples at retail were highest in
fish products (mainly smoked fish), followed by soft and semi-soft cheeses, RTE meat products and hard
cheeses.
Listeria food-borne outbreaks
In 2013, a total of 13 Listeria outbreaks were reported by seven MS and one non-MS. This was slightly
higher than in the previous years. Eight of the outbreaks reported in 2013 were supported by strong
evidence, where crustaceans, shellfish and molluscs and products thereof, were implicated in three
outbreaks.
Verocytotoxigenic E. coli
Humans
In 2013, 6,043 confirmed cases of verocytotoxigenic Escherichia coli (VTEC) infections were reported in the
EU. The EU notification rate was 1.59 cases per 100,000 population, which was 5.9 % higher than in 2012.
The EU notification rate in the two consecutive years following the large outbreak in 2011 was higher than
before the outbreak, possibly an effect of increased awareness and of more laboratories testing also for
other serogroups than O157. In 2013, 13 deaths due to VTEC infection were reported in the EU which
resulted in an EU case-fatality rate of 0.36 % among the 3,582 confirmed cases for which this information
was provided (Table 1).
The most commonly reported VTEC serogroup in 2013 was, as in previous years, O157 (48.9 % of cases
with known serogroup). Serogroup O26, the second most common in 2013, increased by 65.1 % between
2011 and 2013. The proportion of non-typable VTEC strains doubled in the same period. The serogroup
which increased the most between 2011 and 2013 was O182 which was reported by five countries in 2013
compared to only one in 2011 and 2012.
Foodstuffs and animals
No trends were observed in the presence of VTEC in food and animals. VTEC serogroup O157 was primarily
detected in ruminants (cattle, sheep and goats) and meat thereof. The proportion of VTEC found in sheep
and goats, and ovine meat reported by the MS was higher than the proportion found in cattle and in bovine
meat, although only few MS provided data.
The main reported VTEC serogroups in food were O157, O26, O103, O121 and O55. The human
pathogenic VTEC serogroups isolated from the bovine meat and cattle samples included VTEC O157, O26,
O87, O103 and O113, whereas O145 and O111 were also detected from milk samples.
In 2013, more than twenty different serogroups were reported from cattle, and the most frequently reported
were; O157, O26, O174, O103, O91, O185 and O22. Besides serogroup O157, a range of serogroups were
detected in sheep: O76, O146, O113, O103: O112, O121, O149 and others.
EFSA Journal 2015;13(1):3991
6
EU summary report on zoonoses, zoonotic agents and food-borne outbreaks 2013
VTEC food-borne outbreaks
In 2013, a total of 73 outbreaks caused by VTEC were reported, whereof 12 were supported by strong
evidence. The main food vehicle was bovine meat and products thereof, followed by ‘Vegetables and juices
and other products thereof’ and cheese.
Yersinia
Humans
A total of 6,471 confirmed cases of yersiniosis were reported in 2013, making it the third most commonly
reported zoonosis in the EU. The EU notification rate was 1.92 cases per 100,000 population which was a
decrease of 2.8 % compared to 2012. There was a statistically significant decreasing five-year trend in the
EU in 2009–2013. The highest country-specific notification rates were observed in MS in north eastern
Europe. Yersinia enterocolitica was the dominating species among human cases.
The EU case-fatality rate was 0.05 %; two fatal cases due to infections with Y. pseudotuberculosis were
reported in 2013 among the 4,036 confirmed yersiniosis cases for which this information was reported (Table
1).
Food and animals
Five MS reported positive findings for Yersinia (mostly Y. enterocolitica) in pig meat and products thereof.
Positive findings were also reported in bovine meat and unpasteurized (raw) cow milk intended for direct
human consumption. Yersinia was reported in pigs at low levels. Positive findings were also reported in other
animal species, including wildlife animals, cattle, sheep, goats, dogs, cats, solipeds etc.
Tuberculosis due to Mycobacterium bovis
Humans
Tuberculosis due to M. bovis is a rare infection in humans in the EU, with 134 confirmed human cases
reported in 2013. The case numbers in the EU have been stable in the last two years. There was no clear
association between a country’s status as officially free of bovine tuberculosis (OTF) and notification rates in
humans. The EU notification rate in 2013 was 0.03 cases per 100,000 population.
Animals
At the EU-level, the proportion of cattle herds infected with or positive for M. bovis remained very low (0.68 %
of the existing herds). The distribution of M. bovis across EU is, however, heterogeneous with a prevalence
ranging from absence of infected/positive animals in many OTF regions to a prevalence of 12.1 % in the
non-OTF regions of the United Kingdom (England, Northern-Ireland and Wales). In the non-OTF regions, the
number of herds infected with, or positive for, M. bovis was similar to in 2012 and no major changes were
observed within the non-OTF MS or parts thereof.
Brucella
Humans
Brucellosis is a rare infection in humans in the EU with 357 confirmed cases reported in 2013. The highest
notification rates and the majority of the autochthonous cases were reported from Mediterranean countries
that are not officially brucellosis-free in cattle, sheep or goats. No significant increasing or decreasing trend
of human brucellosis could be observed at the EU level in the last five years. Seventy percent of the human
brucellosis cases had been hospitalised, but only one fatal case was reported in 2013 (Table 1).
Foodstuffs
There were no Brucella-positive findings in the surveillance samples of cheeses, other dairy products and
raw milk from cows and other animal species, reported by two Mediterranean MS.
Animals
A further decreasing tendency was observed in the prevalence of both bovine and small ruminant brucellosis
within the EU. In 2013 brucellosis remained a rare (bovine brucellosis) or very low frequency (ovine and
EFSA Journal 2015;13(1):3991
7
EU summary report on zoonoses, zoonotic agents and food-borne outbreaks 2013
caprine brucellosis) event at the EU level. Both bovine and small ruminant brucellosis cases of infected or
positive herds are mostly reported by four Mediterranean MS Italy, Portugal, Greece and Spain. Bovine
brucellosis was also reported by Northern Ireland in the United Kingdom in 28 cattle herds. Almost all nonofficially brucellosis-free (non-OBF) MS and non-officially Brucella melitensis free (non-ObmF) MS reported
fewer positive and/or infected herds than in 2012.
Brucella food-borne outbreaks
In 2013, four weak-evidence Brucella outbreaks (involving seven hospitalised cases) were reported by two
MS. No strong-evidence outbreaks were reported. The occurrence of these outbreaks illustrates the health
risk related to consumption of food contaminated with Brucella.
Trichinella
Humans
In 2013, 217 confirmed trichinellosis cases were reported in the EU. The EU notification rate decreased by
17.7 % compared with 2012 and was 0.05 cases per 100,000 population in 2013. The highest notification
rates were reported in Romania, Latvia and Bulgaria. The temporal trend of trichinellosis in the EU in 20092013 was greatly influenced by a number of smaller and larger outbreaks with peaks often occurring in
January. One death due to trichinellosis was reported in 2013 (Table 1).
Animals
Ten MS reported positive findings in farm animals. In pigs, a total of 357 positive findings were reported out
of 154,397,532 animals tested (0.0002 %) and the vast majority originated from pigs not raised under
controlled housing conditions. Positive findings were mainly reported by eastern EU MS. From a total of
7,908 farmed wild boars tested, two Mediterranean MS reported one positive finding each. No positive
findings were reported from 176,497 horses tested in EU.
The overall EU proportion of Trichinella positive samples of hunted wild boars was 0.1 % and originated
mostly from eastern EU MS. Most of the Trichinella-positive reporting in wildlife other than wild boar was
done by eastern and north eastern EU MS, in 11 different animal species. Throughout the past years, the
highest proportions of positive samples were from raccoon dogs followed by bears. Trichinella is found in
large parts of Europe as overall 19 MS and two non-MS reported positive findings.
Trichinella food-borne outbreaks
In 2013, a total of 22 outbreaks caused by Trichinella were reported, whereof 20 supported by strong
evidence. As in the previous years, pig meat was the most commonly reported food vehicle.
Echinococcus
Humans
In 2013, a total of 811 echinococcosis cases, of which 794 were laboratory confirmed, were reported in the
EU. The EU notification rate was 0.18 cases per 100,000 population which was a decrease of 5.7 %
compared with 2012. An increasing number of cases were reported to be infected with E. multilocularis
(alveolar echinococcosis) throughout the five-year period 2009-2013. In contrast, the number of cases
reported to be infected with E. granulosus (cystic echinococcosis) decreased in the same period. Two deaths
due to E. multilocularis were reported in 2013.
Animals
E. multilocularis was reported at low level in foxes by four MS. Czech Republic reported an increase in
prevalence of E. multilocularis during 2005-2011, as well as Slovakia during 2010-2013. Four MS reported
almost all the positive findings of E. granulosus; mainly from domestic animals.
EFSA Journal 2015;13(1):3991
8
EU summary report on zoonoses, zoonotic agents and food-borne outbreaks 2013
Toxoplasma
Animals
In 2013, 14 MS and two non-MS provided data on Toxoplasma in animals. Positive findings were detected in
pigs, cattle, sheep, goats, dogs, cats, wild boars, deer, water buffaloes, and some other wildlife animal
species.
Rabies
Humans
In 2013, one travel-associated case of rabies was reported from the Netherlands. The patient was a 51-yearold male and died after exposure to an unknown source in Haiti.
Animals
In 2013, 783 animals other than bats tested positive for either classical rabies virus or unspecified
Lyssavirus, in reporting countries. The number of cases reported in 2013 increased compared with 2012,
when 712 cases where detected in animals other than bats. In addition, six MS reported rabies cases from
bats.
Q-fever
Humans
In 2013, a total of 648 confirmed cases of Q fever in humans were reported in the EU. The EU notification
rate was 0.17 per 100,000 population. The highest notification rate was observed in Hungary (1.37 cases per
100,000 population) where an outbreak occurred in 2013.
There was a decreasing EU trend of confirmed Q fever cases in 2009–2013. Two deaths due to Q fever
were reported by Germany and Latvia in 2013. This resulted in an EU case-fatality rate of 0.61 % among the
335 confirmed cases for which this information was reported.
Animals
All but three of the 17 reporting MS found animals testing positive to Coxiella burnetii (Q fever) in their cattle,
sheep or goat populations in 2013. A positive pig herd was also reported by one MS. Compared to the
previous years, no general trend was observed as regards the number of samples tested and the number of
samples positives.
West Nile virus
Humans
In 2013, a total of 250 cases of West Nile fever in humans were reported in the EU. The EU notification rate
of locally acquired and travel-related cases was 0.08 per 100,000 population. There was an overall
0.01 increase in the notification rate compared with 2012 (238 cases). The highest notification rate was
observed in Greece (0.78 cases per 100,000 population), as in previous years; however, case reporting
varied between countries.
Case numbers in the mostly affected countries have varied from year to year, but more and more areas are
affected. Sixteen deaths due to West Nile fever were reported by Greece, Italy and Hungary in 2013. This
resulted in an EU case-fatality rate of 3.4 % among the 227 probable and confirmed cases for which this
information was reported (90.8 % of all cases).
Animals
Although the number of tested animals increased in 2013 as compared to the previous year, there were less
than half as many cases detected in 2013 as compared to 2012. Presumed acute infections in animals (IgM
or Polymerase Chain Reaction (PCR) positive samples) were reported only by some of the Mediterranean
countries and by the Czech Republic and Hungary.
EFSA Journal 2015;13(1):3991
9
EU summary report on zoonoses, zoonotic agents and food-borne outbreaks 2013
Tularaemia
Humans
In 2013, a total of 279 confirmed cases of tularaemia in humans were reported in the EU. The EU notification
rate was 0.07 cases per 100,000 population which was a 65.3 % decrease compared with 2012. Notification
rates vary however across countries and within each country over time. The highest notification rate was
observed in Sweden (1.13 confirmed cases per 100,000 population) as in previous years.
There was a decreasing (not significant) EU trend of confirmed tularaemia cases in 2009–2013, and no
deaths were reported.
Animals
Occurrence of Francisella tularensis was reported by one MS in wild hares.
Other zoonoses and zoonotic agents
Findings of Taenia saginata cysts in bovine carcases were reported at very low to rare level by two MS. In
addition one MS investigated the presence of Taenia solium cysts in pig carcases but no positive findings
were reported.
Rare occurrence of Sarcocystis in bovine carcases was reported by one MS.
Food-borne outbreaks
In 2013, a total of 5,196 food-borne outbreaks, including water-borne outbreaks, were reported in the EU.
Overall, 43,183 human cases, 5,946 hospitalisations and 11 deaths were reported. The evidence supporting
the link between human cases and food vehicles was strong in 839 outbreaks (Figure 2).
The largest number of reported food-borne outbreaks was caused by Salmonella (22.5 % of all outbreaks),
followed by viruses (18.1 %), bacterial toxins (16.1 %), and Campylobacter (8.0 %). For 28.9 % of the
outbreaks the causative agent was unknown. Apart from the above mentioned markedly decreasing trend in
annual total number of Salmonella outbreaks within the EU during the six-year period 2008 to 2013, the
number of outbreaks due to bacterial toxins increased by 58.9 %, from 525 to 834 outbreaks, in the same
time period. Reported Campylobacter food-borne outbreaks decreased compared to 2012, while there was
an increase in the outbreaks caused by viruses.
As in the previous years, the most important food vehicles in the strong-evidence outbreaks were eggs and
egg products followed by mixed food, and fish and fish products.
Of particular note was the multinational hepatitis A virus (HAV) outbreak occurred in 2013 in several EU/EEA
countries, and associated with the consumption of berries and berry products.
In 2013, nine strong-evidence water-borne outbreaks were reported in the EU. Five different pathogens were
detected from these nine outbreaks: calicivirus (Norovirus, Norwalk-like virus), verocytotoxigenic E. coli
(VTEC O128), Cryptosporidium parvum, Cryptosporidium hominis and Salmonella. For three water-borne
outbreaks the causative agent was unknown.
EFSA Journal 2015;13(1):3991
10
EU summary report on zoonoses, zoonotic agents and food-borne outbreaks 2013
Bacterial toxins include toxins produced by Bacillus, Clostridium and Staphylococcus. Food-borne viruses include calicivirus, hepatitis A
virus, flavivirus, rotavirus and other unspecified viruses. Other causative agents include mushroom toxins, marine biotoxins, histamine,
mycotoxins and escolar fish (wax esters). Parasites include primarily Trichinella, but also Cryptosporidium, Giardia and other
unspecified parasites. Other bacterial agents include Listeria, Brucella, Shigella, Vibrio and other unspecified bacterial agents. In this
figure, the category ‘Pathogenic Escherichia coli (including VTEC)’ also includes one strong-evidence outbreak due to pathogenic E. coli
other than VTEC.
Figure 2. Distribution of all food-borne outbreaks per causative agent in the EU, 2013
EFSA Journal 2015;13(1):3991
11
EU summary report on zoonoses, zoonotic agents and food-borne outbreaks 2013
Table of contents
Summary ............................................................................................................................................................ 3
List of tables ...................................................................................................................................................... 14
List of figures .................................................................................................................................................... 15
Legal basis ........................................................................................................................................................ 17
1.
Introduction ....................................................................................................................................... 19
1.1.
The structure of the report ................................................................................................................ 19
2.
Materials and methods ..................................................................................................................... 20
2.1.
Data received in 2013 ....................................................................................................................... 20
2.1.1.
Human data ...................................................................................................................................... 20
2.1.2.
Data on food, animals and feed ........................................................................................................ 20
2.1.3.
Data on food-borne outbreaks .......................................................................................................... 21
2.2.
Statistical analysis of trends over time ............................................................................................. 21
2.2.1.
Human data ...................................................................................................................................... 21
2.2.2.
Food, animals and feed data ............................................................................................................ 21
2.3.
Cartographic representation of data ................................................................................................. 21
2.3.1.
Animal data ....................................................................................................................................... 21
2.4.
Data sources ..................................................................................................................................... 21
2.4.1.
Salmonella data ................................................................................................................................ 22
2.4.2.
Campylobacter data .......................................................................................................................... 23
2.4.3.
Listeria data ...................................................................................................................................... 23
2.4.4.
VTEC data ........................................................................................................................................ 24
2.4.5.
Yersinia data ..................................................................................................................................... 24
2.4.6.
Tuberculosis data ............................................................................................................................. 25
2.4.7.
Brucella data ..................................................................................................................................... 25
2.4.8.
Trichinella data ................................................................................................................................. 26
2.4.9.
Echinococcus data ............................................................................................................................ 26
2.4.10. Toxoplasma data .............................................................................................................................. 27
2.4.11. Rabies data ....................................................................................................................................... 27
2.4.12. Q-fever data ...................................................................................................................................... 27
2.4.13. West Nile Virus data ......................................................................................................................... 27
2.4.14. Tularaemia data ................................................................................................................................ 28
2.4.15. Other zoonoses and zoonotic agents data ....................................................................................... 28
2.4.16. Food-borne outbreaks data .............................................................................................................. 28
2.5.
Terms used to describe prevalence or proportion positive values ...................................................28
3.
Assessment ...................................................................................................................................... 29
3.1.
Salmonella ........................................................................................................................................ 29
3.1.1.
Salmonellosis in humans .................................................................................................................. 29
3.1.2.
Salmonella in food, animals and feedingstuffs ................................................................................. 33
3.1.3.
Salmonella food-borne outbreaks ..................................................................................................... 49
3.1.4.
Discussion......................................................................................................................................... 50
3.2.
Campylobacter .................................................................................................................................. 51
3.2.1.
Campylobacteriosis in humans ......................................................................................................... 51
3.2.2.
Campylobacter in food and animals ................................................................................................. 53
3.2.3.
Campylobacter food-borne outbreaks .............................................................................................. 57
3.2.4.
Discussion......................................................................................................................................... 57
3.3.
Listeria .............................................................................................................................................. 58
3.3.1.
Listeriosis in humans ........................................................................................................................ 58
3.3.2.
Listeria in food and animals .............................................................................................................. 60
3.3.3.
Listeria food-borne outbreaks ........................................................................................................... 67
3.3.4.
Discussion......................................................................................................................................... 68
3.4.
Verocytotoxigenic Escherichia coli ................................................................................................... 68
3.4.1.
Verocytotoxigenic Escherichia coli in humans.................................................................................. 68
3.4.2.
Verocytotoxigenic Escherichia coli in food ....................................................................................... 71
3.4.3.
Verocytotoxigenic Escherichia coli in animals .................................................................................. 73
3.4.4.
VTEC food-borne outbreaks ............................................................................................................. 75
3.4.5.
Discussion......................................................................................................................................... 75
3.5.
Yersinia ............................................................................................................................................. 76
3.5.1.
Yersiniosis in humans ....................................................................................................................... 76
3.5.2.
Yersinia in food and animals............................................................................................................. 78
EFSA Journal 2015;13(1):3991
12
EU summary report on zoonoses, zoonotic agents and food-borne outbreaks 2013
3.5.3.
Yersinia food-borne outbreaks ......................................................................................................... 81
3.5.4.
Discussion......................................................................................................................................... 81
3.6.
Tuberculosis due to Mycobacterium bovis ....................................................................................... 81
3.6.1.
Mycobacterium bovis in humans ...................................................................................................... 82
3.6.2.
Tuberculosis due to Mycobacterium bovis in cattle .......................................................................... 83
3.6.3.
Discussion......................................................................................................................................... 85
3.7.
Brucella ............................................................................................................................................. 85
3.7.1.
Brucellosis in humans ....................................................................................................................... 85
3.7.2.
Brucella in food and animals............................................................................................................. 87
3.7.3.
Brucella food-borne outbreaks ......................................................................................................... 92
3.7.4.
Discussion......................................................................................................................................... 92
3.8.
Trichinella ......................................................................................................................................... 92
3.8.1.
Trichinellosis in humans ................................................................................................................... 92
3.8.2.
Trichinella in animals ........................................................................................................................ 94
3.8.3.
Trichinella food-borne outbreaks ...................................................................................................... 98
3.8.4.
Discussion......................................................................................................................................... 98
3.9.
Echinococcus .................................................................................................................................... 99
3.9.1.
Echinococcosis in humans ............................................................................................................... 99
3.9.2.
Echinococcus in animals ................................................................................................................ 101
3.9.3.
Discussion....................................................................................................................................... 103
3.10.
Toxoplasma .................................................................................................................................... 104
3.10.1. Toxoplasmosis in humans .............................................................................................................. 105
3.10.2. Toxoplasma in animals ................................................................................................................... 105
3.10.3. Discussion....................................................................................................................................... 105
3.11.
Rabies ............................................................................................................................................. 106
3.11.1. Rabies in humans ........................................................................................................................... 106
3.11.2. Rabies in animals ........................................................................................................................... 106
3.11.3. Discussion....................................................................................................................................... 109
3.12.
Q fever ............................................................................................................................................ 110
3.12.1. Q fever in humans .......................................................................................................................... 110
3.12.2. Coxiella burnetii in animals ............................................................................................................. 112
3.12.3. Discussion....................................................................................................................................... 113
3.13.
West Nile virus ................................................................................................................................ 113
3.13.1. West Nile fever in humans .............................................................................................................. 113
3.13.2. West Nile virus in animals............................................................................................................... 115
3.13.3. Discussion....................................................................................................................................... 117
3.14.
Tularaemia ...................................................................................................................................... 118
3.14.1. Tularaemia in humans .................................................................................................................... 118
3.14.2. Francisella tularensis in animals ..................................................................................................... 120
3.14.3. Discussion....................................................................................................................................... 120
3.15.
Other zoonoses and zoonotic agents ............................................................................................. 121
3.15.1. Cysticercus ..................................................................................................................................... 121
3.15.2. Sarcocystis...................................................................................................................................... 121
3.16.
Food-borne outbreaks .................................................................................................................... 121
3.16.1. General overview ............................................................................................................................ 121
3.16.2. Overview by causative agent .......................................................................................................... 128
3.16.3. Water-borne outbreaks ................................................................................................................... 135
3.16.4. Discussion....................................................................................................................................... 137
References ..................................................................................................................................................... 138
Abbreviations .................................................................................................................................................. 142
Appendix: List of usable data ......................................................................................................................... 144
EFSA Journal 2015;13(1):3991
13
EU summary report on zoonoses, zoonotic agents and food-borne outbreaks 2013
List of tables
Table 1. Reported hospitalisation and case-fatality rates due to zoonoses in confirmed human cases
in the EU, 2013 .................................................................................................................................. 4
Table 2. Reported cases and notification rates per 100,000 of human salmonellosis in the EU/EEA,
2009–2013 ....................................................................................................................................... 30
Table 3. Distribution of reported confirmed cases of human salmonellosis in the EU/EEA, 2011–2013,
by the 20 most frequent serovars in 2013 ....................................................................................... 32
Table 4. Salmonella in fresh broiler meat at slaughter, processing/cutting level and retail level, 2013 ...........36
Table 5. Salmonella in breeding flocks of Gallus gallus during the production period (all types of
breeding flocks, flock-based data) in countries running control programmes in accordance
with Regulation (EC) No 2160/2003, 2013 ...................................................................................... 41
Table 6. Salmonella in laying hen flocks of Gallus gallus during the production period (flock-based data)
in countries running control programmes, 2013 .............................................................................. 42
Table 7. Salmonella in broiler flocks of Gallus gallus before slaughter (flock-based data) in countries
running control programmes, 2013 .................................................................................................. 43
Table 8. Salmonella in breeding flocks of turkeys (adults, flock-based data) in countries running control
programmes, 2013 ........................................................................................................................... 44
Table 9. Salmonella in fattening flocks of turkeys before slaughter (flock-based data) in countries running
control programmes, 2013 ............................................................................................................... 45
Table 10. Top 10 most commonly reported Salmonella serovars per animal population or food/feed
category in EU MS, 2013 ................................................................................................................. 48
Table 11. Strong- and weak-evidence food-borne outbreaks caused by Salmonella (excluding strongevidence water-borne outbreaks), 2013 .......................................................................................... 49
Table 12. Reported cases and notification rates per 100,000 of human campylobacteriosis in the EU/EEA,
2009–2013 ....................................................................................................................................... 52
Table 13. Campylobacter in fresh broiler meat, 2013 ...................................................................................... 55
Table 14. Reported cases and notification rates per 100,000 of human listeriosis in the EU/EEA,
2009-2013 ........................................................................................................................................ 59
Table 15. Reported cases and notification rates per 100,000 of human VTEC infections in the EU/EEA,
2009–2013 ....................................................................................................................................... 69
Table 16. Distribution of reported confirmed cases of human VTEC infections in 2013 in the EU/EEA,
2011–2013, by the 20 most frequent serogroups ............................................................................ 71
Table 17. Reported cases and notification rates of human yersiniosis in the EU/EEA, 2009-2013.................77
Table 18. Reported cases and notification rates per 100,000 of human tuberculosis due to M. bovis
(a)
in the EU/EEA, 2009-2013; OTF status is indicated ..................................................................... 82
Table 19. Reported cases and notification rates per 100,000 of human brucellosis in the EU/EEA,
(a)
2009-2013; OBF and ObmF status is indicated ............................................................................ 86
Table 20. Reported cases and notification rates per 100,000 of human trichinellosis in the EU/EEA,
2009-2013 ........................................................................................................................................ 93
Table 21. Reported cases and notification rates per 100,000 of human echinococcosis in the EU/EEA,
2009-2013 ...................................................................................................................................... 100
Table 22. Human rabies cases in the EU/EEA, 2009-2013 ........................................................................... 106
Table 23. Reported cases and notification rates per 100,000 of human Q fever in the EU/EEA,
2009-2013 ...................................................................................................................................... 111
Table 24. Reported cases and notification rates per 100,000 of human West Nile fever in 2009-2013
(total cases).................................................................................................................................... 114
Table 25. Reported cases and notification rates per 100,000 of human tularaemia in 2009-2013................119
Table 26. Number of all food-borne outbreaks and human cases in the EU, 2013 .......................................123
Table 27. Number of outbreaks and human cases per causative agents in food-borne outbreaks in the
EU (including strong evidence water-borne outbreaks), 2013 .......................................................126
Table 28. Strong- and weak-evidence food-borne outbreaks caused by viruses (excluding
strong-evidence water-borne outbreaks) in the EU, 2013 ............................................................. 129
Table 29. Strong-evidence food-borne outbreaks caused by viruses (excluding strong-evidence
water-borne outbreaks) in the EU, 2013 ........................................................................................ 130
Table 30. Strong- and weak-evidence food-borne outbreaks caused by Bacillus toxins (excluding
strong-evidence water-borne outbreaks), 2013 ............................................................................. 131
Table 31. Strong- and weak-evidence food-borne outbreaks caused by Clostridium toxins (excluding
strong-evidence water-borne outbreaks), 2013 ............................................................................. 131
Table 32. Strong-evidence food-borne outbreaks caused by Clostridium botulinum toxins (excluding
strong-evidence water-borne outbreaks), 2013 ............................................................................. 132
EFSA Journal 2015;13(1):3991
14
EU summary report on zoonoses, zoonotic agents and food-borne outbreaks 2013
Table 33. Strong- and weak-evidence food-borne outbreaks caused by staphylococcal toxins (excluding
strong-evidence water-borne outbreaks), 2013 ............................................................................. 133
Table 34. Strong- and weak-evidence food-borne outbreaks caused by other causative agents (excluding
strong-evidence water-borne outbreaks), 2013 ............................................................................. 134
Table 35. Strong-evidence food-borne outbreaks caused by other causative agents (excluding strong
evidence water-borne outbreaks), 2013 ........................................................................................ 134
Table 36. List of reported strong evidence water-borne outbreaks in 2013 ...................................................136
List of figures
Figure 1. Reported notification rates of zoonoses in confirmed human cases in the EU, 2013 ......................... 3
Figure 2. Distribution of all food-borne outbreaks per causative agent in the EU, 2013 ..................................11
Figure 3. Trend in reported confirmed cases of human non-typhoidal salmonellosis in the EU/EEA,
2009-2013 ....................................................................................................................................... 31
Figure 4. Proportion of units (single samples and batches) not complying with the EU Salmonella criteria,
2011-2013 ....................................................................................................................................... 34
Figure 5. Distribution of food vehicles in strong-evidence outbreaks caused by Salmonella in the EU,
2013 ................................................................................................................................................ 50
Figure 6. Trend in reported confirmed cases of human campylobacteriosis in the EU/EEA, 2009-2013 ........53
Figure 7. Trend in reported confirmed cases of human listeriosis in the EU/EEA, 2009-2013 ........................60
Figure 8. Proportion of single samples at processing and retail non-compliant with EU L. monocytogenes
criteria, 2011-2013 .......................................................................................................................... 63
Figure 9. Proportion of L. monocytogenes-positive units in ready-to-eat fishery products, 2013 ....................64
Figure 10. Proportion of L. monocytogenes-positive units in ready-to-eat meat categories in the EU,
2013 ................................................................................................................................................ 65
Figure 11. Proportion of L. monocytogenes-positive units in soft and semi-soft cheeses made from
raw or low heat-treated milk, 2013 ................................................................................................. 66
Figure 12. Trend in reported confirmed cases of human VTEC infections in the EU/EEA, 2009-2013 ...........70
Figure 13. Proportion of VTEC positive samples in animal/food categories in Member States and
non-Member States, 2012-2013 ..................................................................................................... 73
Figure 14. Proportion of VTEC- and VTEC O157- positive samples in all food/animal categories in
Member States and non-Member States, 2013 ............................................................................. 74
Figure 15. Trend in reported confirmed cases of human yersiniosis in the EU/EEA, 2009–2013 ...................78
Figure 16. Proportion of Yersinia-positive samples in food in Member States, 2012-2013 .............................79
Figure 17. Proportion of Yersinia-positive samples in animals in Member States and non-Member States,
2012-2013 ....................................................................................................................................... 80
Figure 18. Status of countries regarding bovine tuberculosis, 2013 ................................................................ 83
Figure 19. Proportion of existing cattle herds infected with or positive for M. bovis, 2009-2013 .....................84
Figure 20. Proportion of existing cattle herds infected with or positive for M. bovis, 2013 ..............................84
Figure 21. Trend in reported confirmed cases of human brucellosis in the EU/EEA, 2009-2013 ....................87
Figure 22. Status of countries regarding bovine brucellosis, 2013 .................................................................. 88
Figure 23. Proportion of existing cattle herds infected with or positive for Brucella, 2013 ...............................88
Figure 24. Proportion of existing cattle, sheep and goat herds infected with or positive for Brucella,
2005-2013 ....................................................................................................................................... 89
Figure 25. Status of countries regarding ovine and caprine brucellosis, 2013.................................................90
Figure 26. Proportion of existing sheep and goat herds infected with or positive for Brucella, 2013...............91
Figure 27. Trend in reported confirmed cases of human trichinellosis in the EU/EEA, 2009-2013 .................94
Figure 28. Findings of Trichinella in pigs not raised under controlled housing conditions, 2013 .....................96
Figure 29. Findings of Trichinella in hunted wild boars, 2013 .......................................................................... 96
Figure 30. Findings of Trichinella in wildlife (excluding hunted wild boars), 2013............................................97
Figure 31. Proportion of Trichinella-positive samples in wildlife in Member States and non-Member States,
2005-2013 ....................................................................................................................................... 98
Figure 32. Reported confirmed cases of human echinococcosis by species in selected Member States,
2009-2013 ..................................................................................................................................... 101
Figure 33. Findings of Echinococcus multilocularis in foxes, 2013 ................................................................ 102
Figure 34. Findings of E. multilocularis in foxes (including Member States providing data for at least four
consecutive years), 2005-2013 .................................................................................................... 103
Figure 35. Reported cases of classical rabies or unspecified Lyssavirus in animals other than bats,
in the Member States and non-Member States, 2006-2013 ........................................................107
Figure 36. Classical rabies or unspecified Lyssavirus cases in foxes, 2013..................................................108
EFSA Journal 2015;13(1):3991
15
EU summary report on zoonoses, zoonotic agents and food-borne outbreaks 2013
Figure 37. Classical rabies or unspecified Lyssavirus cases in bats, 2013 ...................................................109
Figure 38. Trend in reported confirmed cases of human Q fever in the EU/EEA, 2009-2013 .......................112
Figure 39. Trend in reported total cases of human West Nile fever in the EU/EEA, 2009-2013 ...................115
Figure 40. Findings of West Nile virus in birds in the EU, in 2013 ................................................................. 116
Figure 41. Findings of West Nile virus in domestic solipeds in the EU, in 2013 ............................................117
Figure 42. Trend in reported confirmed cases of human tularaemia in the EU/EEA, 2009-2013 ..................120
Figure 43. Reporting rate per 100,000 population in Member States and non-Member States, 2013 ..........124
Figure 44. Distribution of food-borne outbreaks in Member States and non-Member States, 2013 ..............124
Figure 45. Distribution of all food-borne outbreaks per causative agent in the EU, 2013 ..............................127
Figure 46. Total number of food-borne outbreaks in the EU, 2008-2013 .......................................................127
Figure 47. Distribution of strong-evidence outbreaks by food vehicle in the EU, 2013 ..................................128
Figure 48. Distribution of strong-evidence outbreaks by settings in the EU, 2013 ........................................128
EFSA Journal 2015;13(1):3991
16
EU summary report on zoonoses, zoonotic agents and food-borne outbreaks 2013
Legal basis
About EFSA
The European Food Safety Authority (EFSA), located in Parma, Italy, was established and funded by the
European Union (EU) as an independent agency in 2002 following a series of food scares that prompted the
European public to voice concerns about food safety and the ability of regulatory authorities to protect
consumers. EFSA provides objective scientific advice on all matters, in close collaboration with national
authorities and in open consultation with its stakeholders, with a direct or indirect impact on food and feed
safety, including animal health and welfare and plant protection. EFSA is also consulted on nutrition in
relation to EU legislation. EFSA’s work falls into two areas: risk assessment and risk communication. In
particular, EFSA’s risk assessments provide risk managers (EU institutions with political accountability,
i.e. the European Commission (EC), the European Parliament and the Council) with a sound scientific basis
for defining policy-driven legislative or regulatory measures required to ensure a high level of consumer
protection with regard to food and feed safety. EFSA communicates to the public in an open and transparent
way on all matters within its remit. Collection and analysis of scientific data, identification of emerging risks
and scientific support to the Commission, particularly in the case of a food crisis, are also part of EFSA’s
4
mandate, as laid down in the founding Regulation (EC) No 178/2002 of 28 January 2002.
About ECDC
The European Centre for Disease Prevention and Control (ECDC), an EU agency based in Stockholm,
5
Sweden, was established in 2004 and became operational in 2005. ECDC’s mission is to identify, assess
and communicate current and emerging threats to human health from infectious diseases. In order to
achieve this mission, ECDC works in partnership with national public health bodies across Europe and other
EU agencies to strengthen and develop EU-wide disease surveillance, early warning systems, and response
to public health threats in the European Union and European Economic Area countries. By working with
networks of experts throughout Europe, ECDC pools knowledge on health so as to provide independent
scientific opinions and expert advice about the risks posed by current and emerging infectious diseases.
About the report
The EU system for the monitoring and collection of information on zoonoses is based on the Zoonoses
6
Directive 2003/99/EC, which obliges EU Member States (MS) to collect relevant and, where applicable,
comparable data on zoonoses, zoonotic agents, antimicrobial resistance and food-borne outbreaks. In
addition, MS are required to assess trends and sources of these agents as well as outbreaks in their
territory, submitting an annual report each year by the end of May to the EC covering the data collected.
EFSA is assigned the task of examining these data and publishing the EU annual Summary Reports.
7
The data collection on human diseases from MS is conducted in accordance with Decision 1082/2013/EU
on serious cross-border threats to health which in October 2013 replaced Decision 2119/98/EC on setting up
a network for the epidemiological surveillance and control of communicable diseases in the EU. The case
definitions to be followed when reporting data on infectious diseases to ECDC are described in Decision
8
2012/506/EU.
Since 2005, ECDC has provided data on zoonotic infections in humans, as well as their analyses, for the EU
Summary Report. Starting with the statistics year 2007, data on human cases have been reported from The
European Surveillance System (TESSy), developed and maintained by ECDC.
4
Regulation (EC) No 178/2002 of the European Parliament and of the Council of 28 January 2002 laying down the general principles
and requirements of food law, establishing the European Food Safety Authority and laying down procedures in matters of food
safety. OJ L 31, 1.2.2002, p. 1–24.
5
Regulation (EC) No 851/2004 of the European Parliament and of the Council of 21 April 2004 establishing a European centre for
disease prevention and control. OJ L 142, 30.4.2004, p.1-11.
6
Directive 2003/99/EC of the European Parliament and of the Council of 17 November 2003 on the monitoring of zoonoses and
zoonotic agents, amending Council Decision 90/424/EEC and repealing Council Directive 92/117/EEC. OJ L 325, 12.12.2003 p. 31.
7
Decision No 1082/2013/EU of the European Parliament and of the Council of 22 October 2013 on serious cross-border threats to
health and repealing Decision No 2119/98/EC. OJ L 293, 5.11.2013, p. 1-15.
8
Commission Decision 2012/506/EU amending Decision 2002/253/EC laying down case definitions for reporting communicable
diseases to the Community network under Decision No 2119/98/EC of the European Parliament and of the Council. OJ L 262,
27.9.2012, p. 1–57.
EFSA Journal 2015;13(1):3991
17
EU summary report on zoonoses, zoonotic agents and food-borne outbreaks 2013
Terms of Reference
In accordance with Article 9 of the Zoonoses Directive 2003/99/EC, EFSA shall examine the national reports
that MS submit by the end of May to the EC on the trends and sources of zoonoses, zoonotic agents,
antimicrobial resistance and food-borne outbreaks in their territory. EFSA shall publish by the end of
November a Summary Report on the trends and sources of zoonoses, zoonotic agents and antimicrobial
resistance in the EU. The submitted national reports of the MS, and any summaries of them, shall be made
publicly available.
EFSA Journal 2015;13(1):3991
18
EU summary report on zoonoses, zoonotic agents and food-borne outbreaks 2013
1. Introduction
This European Union (EU) Summary Report 2013 on zoonoses, zoonotic agents and food-borne outbreaks
was prepared by the European Food Safety Authority (EFSA) in collaboration with the European Centre for
Disease Prevention and Control (ECDC). Member States, other reporting countries, the European
Commission (EC), members of EFSA’s Scientific Panels on Biological Hazards (BIOHAZ) and Animal Health
and Welfare (AHAW) and the relevant EU Reference Laboratories (EURLs) were consulted while preparing
the report.
The efforts made by MS, the reporting non-MS and the EC in the reporting of zoonoses data and in the
preparation of this report are gratefully acknowledged.
The 2013 data on antimicrobial resistance in zoonotic agents submitted and validated by the MS are
published in a separate EU Summary Report.
The present EU Summary Report on zoonoses and food-borne outbreaks focuses on the most relevant
information on zoonoses and food-borne outbreaks within the EU in 2013. If substantial changes compared
with the previous year were observed, they have been reported.
1.1.
The structure of the report
The current report, the EU Summary Report 2013, includes an abstract, a summary, an introduction to the
zoonoses reporting, a description of materials and methods and an EU assessment of the specific zoonoses.
It is available in printable format. The Appendix contains hyperlinks to all data summarised for the production
of this report, for humans, food, animals and food-borne outbreaks. It also includes hyperlinks to summary
tables and figures that were not displayed in this printable report because they did not trigger any marked
observation. The summarised data are presented in downloadable Excel and PDF files, and listed by
subject. Moreover, all submitted and validated data by the MS are available online
(http://www.efsa.europa.eu/en/efsajournal/pub/3991.htm).
Monitoring and surveillance schemes for most zoonotic agents covered in this report are not harmonised
among MS, and findings presented in this report must, therefore, be interpreted with care. The data
presented may not have been derived from sampling plans that were statistically designed, and, thus,
findings may not accurately represent the national situation regarding zoonoses. Regarding data on human
infections, please note that the numbers presented in this report may differ from national zoonoses reports
due to differences in case definitions used at EU and national level or because of different dates of data
submission and extraction. Results are generally not directly comparable between MS and sometimes not
even between different years in one country.
The national zoonoses reports submitted in accordance with Directive 2003/99/EC are published on the
EFSA website together with the EU Summary Report. They are available online at
http://www.efsa.europa.eu/en/zoonosesscdocs/zoonosescomsumrep.htm.
EFSA Journal 2015;13(1):3991
19
EU summary report on zoonoses, zoonotic agents and food-borne outbreaks 2013
2. Materials and methods
2.1.
Data received in 2013
2.1.1.
Human data
The human data analyses in the EU Summary Report for 2013 were prepared by the Food- and Waterborne
Diseases and Zoonoses programme at the ECDC and were based on the data submitted via the European
Surveillance System (TESSy), hosted at ECDC. Please note that the numbers presented in the report may
differ from national reports owing to differences in case definitions used at EU and national level or to
different dates of data submission and extraction. The latter may also result in some divergence in case
numbers presented in different ECDC reports.
TESSy is a software platform that has been operational since April 2008 and in which data on 52 diseases
and special health issues are collected. Both aggregated and case-based data were reported to TESSy.
Although aggregated data did not include individual case-based information, both reporting formats were
included where possible to calculate country-specific notification rates, case-fatality rates, proportion of
hospitalised cases and trends in diseases. Human data used in the report were extracted from TESSy on
29 September 2014. The denominators used for the calculation of the notification rates were the human
population data from EUROSTAT March 2014 update.
Data on human zoonoses cases were received from all 28 MS and also from two non-MS: Iceland and
Norway. The new MS Croatia reported information for the first time in 2013. Switzerland sent its data on
human cases directly to EFSA.
2.1.2.
Data on food, animals and feed
All 28 MS submitted data and national zoonoses reports for 2013. The new MS Croatia reported information
for the first time in 2013. In addition, data and reports were submitted by the three non-MS: Iceland, Norway
and Switzerland. For the ninth consecutive year, countries submitted data on animals, food, feed and foodborne outbreaks using a web-based zoonoses reporting system maintained by EFSA. In addition, many
countries submitted their data electronically to the EFSA zoonoses database, through EFSA’s Data
Collection Framework (DCF).
In 2013, data were collected on a mandatory basis for the following eight zoonotic agents in animals, food
and feed: Salmonella, Campylobacter, Listeria monocytogenes (L. monocytogenes), verocytotoxigenic
Escherichia coli (VTEC), Mycobacterium bovis (M. bovis), Brucella, Trichinella and Echinococcus. In
addition, based on the epidemiological situations in MS, data were reported on the following agents and
zoonoses: Yersinia, Toxoplasma, Lyssavirus (rabies), Coxiella burnetii (Q fever), West Nile virus (WNV),
Cysticerci, Francisella, Chlamydia and Sarcocystis, and Bacillus. Data on Staphylococcus, Meticillin-resistant
Staphylococcus aureus (MRSA) and antimicrobial resistance in indicator E. coli and enterococci isolates
were also submitted. Furthermore, MS provided data on certain other microbiological contaminants in food –
histamine, staphylococcal enterotoxins and Enterobacter sakazakii (Cronobacter spp.), for which food safety
criteria are set down in EU legislation.
The deadline for data submission was 31 May 2013. Two data validation exercises were implemented, by
20 June 2014 and by 25 July 2014, and reporting countries had the opportunity to resubmit revised data by
8 September 2014. Most validated data on food, animals, and feed used in the report were extracted from
the EFSA zoonoses database on 12 September 2014. Few subsets of data still needed further corrections
after 8 September 2014 before being fully validated and were extracted by 12 December 2014.
The draft EU Summary Report was sent to MS for consultation on 24 November 2014 and comments were
collected by 8 December 2014. The utmost effort was made to incorporate comments and data amendments
within the available time frame. The report was finalised by 18 December 2014 and published online by
EFSA and ECDC on 28 January 2015.
In this report, data are presented on the eight mandatory zoonotic agents and also on rabies, Toxoplasma, Q
fever, WNV, Yersinia, Francisella, Cysticercus and Sarcocystis.
For each pathogen, an overview table presenting all MS reported data is available. However, for the
summary tables, data from industry own-control programmes and Hazard Analysis and Critical Control Point
(HACCP) sampling and, unless stated otherwise, data from suspect sampling, selective sampling and
outbreak or clinical investigations are excluded. More details regarding the 2013 zoonoses models for data
entry
and
the
picklists
(qualitative
classifications)
of
variables
are
available
online
(http://www.efsa.europa.eu/en/efsajournal/pub/3991.htm). As regards the number of samples of
EFSA Journal 2015;13(1):3991
20
EU summary report on zoonoses, zoonotic agents and food-borne outbreaks 2013
investigations, there was no restriction and also smaller sample sizes, of fewer than 25 units, are included in
all tables. It is acknowledged that sampling biases and imprecision due to limited numbers of specimens
examined preclude extending findings to reflect actual prevalence or accurate prevalence estimations.
The detailed description of the terms used in the report is available in the EFSA’s manual for reporting on
zoonoses (EFSA, 2014b).
2.1.3.
Data on food-borne outbreaks
Twenty four MS and three non-MS reported data on food-borne outbreaks during 2013. No outbreak data
were reported by Bulgaria, Cyprus, Italy and Luxembourg. The non-reporting of food-borne outbreak data
does not necessarily mean that no outbreaks were notified in non-reporting countries.
In rare cases, MS did not provide any information on the number of human cases, hospitalisation and/or
deaths. In these cases, the number of human cases, hospitalisation and/or deaths was assumed to be zero.
Data on food-borne outbreaks used in the report were extracted from the EFSA zoonoses database on
12 December 2014.
The detailed description of the terms used in the report is available in the EFSA’s manual for reporting on
food-borne outbreaks (EFSA, 2014c).
2.2.
Statistical analysis of trends over time
2.2.1.
Human data
Routine surveillance data from TESSy were used to describe two components of the temporal pattern
(secular trend and seasonality) of human zoonoses cases for the EU and by MS.
Only confirmed human cases (with the exception of West Nile Fever, for which total numbers of cases were
used) reported consistently by MS, throughout the study period 2009–2013, were included in the time series
analysis. Diseases were analysed by month. Of the date variables available (date of onset, date of
diagnosis, etc.), the date chosen by the MS as the official ‘Date used for statistics’ was selected.
For assessing the temporal trends at EU level and by MS, moving averages were applied. Linear regression
was applied where appropriate to test the significance of trends. The level of statistical significance was set
®
at 5 %. All analyses were performed using Stata 12.
2.2.2.
Food, animals and feed data
No statistical analyses were carried out as regards trends of zoonotic agents in food or animals, in the EU
Summary Report 2013 on zoonoses and food-borne outbreaks.
2.3.
Cartographic representation of data
2.3.1.
Animal data
ArcGIS from the Economic and Social Research Institute (ESRI) was used to map animal data. Choropleth
maps with graduated colours over a continuous scale of values were used to map the proportion of positive
samples across EU and other reporting countries.
For Lyssavirus and WNV the number of positive samples, rather than the proportion, was displayed using
proportional circles, while for Trichinella in wild animals a simple absence/presence map was produced.
For disease status data a simple colour code was selected to represent the official status of each country as
defined in the legislation (free or not free).
2.4.
Data sources
In the following sections, the types of data submitted by the reporting countries are briefly described.
Information on human surveillance systems is based on the countries reporting data to ECDC for 2013.
EFSA Journal 2015;13(1):3991
21
EU summary report on zoonoses, zoonotic agents and food-borne outbreaks 2013
2.4.1.
Salmonella data
Humans
The notification of non-typhoidal salmonellosis in humans is mandatory in most MS, Iceland, Norway and
Switzerland, except for six MS where reporting is based on a voluntary system (Belgium, France,
Luxembourg, the Netherlands and Spain) or other system (the United Kingdom). In the United Kingdom,
although the reporting of food poisoning is mandatory, isolation and specification of the organism is
voluntary. The surveillance systems for salmonellosis have full national coverage in all MS except three
(Belgium, the Netherlands and Spain). The coverage in Spain in 2013 is estimated to be 30 % and in the
Netherlands 64 %. These proportions of populations were used in the calculation of notification rates for
Spain and the Netherlands. Diagnosis of human Salmonella infections is generally done by culture from
human stool samples. The majority of countries perform serotyping of strains (ECDC, 2012a).
Food
Salmonella in food is notifiable in 17 MS (Austria, Belgium, Bulgaria, the Czech Republic, Denmark, Estonia,
Finland, France, Germany, Hungary, Italy, Latvia, Romania, Slovakia, Slovenia, Spain and Sweden) and in
two non-MS (Norway and Iceland). Information was not provided from Cyprus, Greece, Lithuania,
Luxembourg, Malta, the Netherlands, Poland, Portugal and Switzerland.
9
Commission Regulation (EC) No 2073/2005 on microbiological criteria for food lays down food safety
criteria for Salmonella in several specific food categories. This Regulation came into force in January 2006
10
and was modified by Regulation (EC) No 1441/2007, entering into force in December 2007. Sampling
schemes for monitoring Salmonella in food, e.g. place of sampling, sampling frequency and diagnostic
methods, vary between MS and according to food types. For a full description of monitoring schemes and
diagnostic methods in individual MS, refer to the national reports. The monitoring schemes are based on
various types of samples, such as neck skin samples, carcase swabs and meat cuttings; these samples
were collected at slaughter, at processing plants, at meat cutting plants and at retail. Several MS reported
data collected as part of HACCP programmes based on sampling at critical control points. These targeted
samples could not be directly compared with those that were randomly collected for monitoring/surveillance
purposes and were not included in data analysis and tables. Information on serotype distribution was not
consistently provided by all MS.
Animals
Salmonella in Gallus gallus (fowl) and/or other animal species is notifiable in all MS, except for Hungary, and
also in three non-MS (Iceland, Norway and Switzerland). In Denmark, detection of Salmonella is notifiable in
broiler and laying hen flocks of Gallus gallus and in other animals. In France, Salmonella detection is
mandatory only for breeding flocks and laying hens of Gallus gallus, and in Malta for broilers and laying hen
flocks of Gallus gallus. In Poland and in Romania, the notification of Salmonella is mandatory only in poultry
(only for findings of Salmonella Enteritidis (S. Enteritidis), S. Typhimurium, S. Pullorum and S. Gallinarum in
Poland, and for findings of S. Enteritidis and S. Typhimurium in Romania).
The monitoring of Salmonella in animals is mainly conducted through passive, laboratory-based surveillance
of clinical samples, active routine monitoring of flocks of breeding and production animals in different age
11
groups, and tests on organs during meat inspection. Community Regulation (EC) No 2160/2003 prescribes
a sampling plan for the control of S. Enteritidis, S. Typhimurium, S. Infantis, S. Virchow and S. Hadar in
breeding flocks of Gallus gallus and for the control of S. Enteritidis and S. Typhimurium in laying hen flocks
and broiler flocks of Gallus gallus and for turkey flocks to ensure comparability of data among MS. Non-MS
(European Free Trade Association members) must also apply the Regulation in accordance with the
12
Decision of the EEA Joint Committee No 101/2006. No specific requirements for the monitoring and control
of other commercial poultry production systems or in other animals were applicable in 2013.
Details of monitoring programmes and control strategies in breeding flocks of Gallus gallus, laying hen
flocks, broiler flocks and breeding and production turkey flocks are available in the national reports.
9
Commission Regulation (EC) No 2073/2005 of 15 November 2005 on microbiological criteria for foodstuffs. OJ L 338, 22.12.2005,
p. 1–26.
10
Commission Regulation (EC) No 1441/2007 of 5 December 2007 amending Regulation (EC) No 2073/2005 on microbiological
criteria for foodstuffs. OJ L 322, 7.12.2007, p. 12–29.
11
12
Regulation (EC) No 2160/2003 of the European Parliament and of the Council and Regulation of 17 November 2003 on the control
of Salmonella and other specified food-borne zoonotic agents. OJ L 325, 12.12.2003, p. 1–15.
Decision of the EEA Joint Committee No 101/2006 of 22 September 2006 amending Annex I (Veterinary and phytosanitary matters)
to the EEA Agreement. OJ L 333, 30.11.2006, p. 6–9.
EFSA Journal 2015;13(1):3991
22
EU summary report on zoonoses, zoonotic agents and food-borne outbreaks 2013
Feed
There is no common sampling scheme for feed materials in the EU. Results from compulsory and voluntary
monitoring programmes, follow-up investigations and industry quality assurance programmes, as well as
from surveys, are reported. The MS monitoring programmes often include both random and targeted
sampling of feed that are considered at risk. Samples of raw material, materials used during processing and
final products are collected from batches of feed of domestic and imported origin. The reported
epidemiological units were either ‘Batch’ (usually based on pooled samples) or ‘Single’ (often several
samples from the same batch). As in previous years, most MS did not report separately data from the
different types of monitoring programmes or data from domestic and imported feed. Therefore, it must be
emphasised that the data related to Salmonella in feed cannot be considered national prevalence estimates.
Moreover, owing to the lack of a harmonised surveillance approach, information is not comparable among
countries. Nevertheless, data at country level are presented in the same tables. Information was requested
on feed materials of animal and vegetable origin and on compound feed (mixture of feed materials intended
for feeding specific animal groups). Data on the detection of Salmonella in feed material of land animal
origin, marine animal origin, cereals, oil seeds and products, and compound feed for cattle, pigs and poultry
in 2013 are presented. Single-sample and batch-based data from the different monitoring systems are
summarised.
2.4.2.
Campylobacter data
Humans
The notification of campylobacteriosis is mandatory in most MS, Iceland, Norway and Switzerland, except for
seven MS, where notification is based on a voluntary system (Belgium, France, Italy, Luxembourg, the
Netherlands and Spain) or other system (the United Kingdom). No surveillance system exists in Greece and
Portugal. The surveillance systems for campylobacteriosis have full national coverage in all MS except five
(Belgium, France, Italy, the Netherlands and Spain). The coverage of the surveillance system is estimated to
be 20 % in France, 52 % in the Netherlands and 30 % in Spain. These proportions of populations were used
in the calculation of notification rates for these three MS. Diagnosis of human infection is generally based on
culture from human stool samples and both culture and non-culture methods (Polymerase-Chain Reaction
(PCR)-based) are used for confirmation. Biochemical tests or molecular methods are used for species
determination of isolates submitted to the National Reference Level Laboratory.
Food
In food, Campylobacter is notifiable in the following 12 MS: Austria, Belgium, the Czech Republic, Estonia
(only C. jejuni), Germany, Italy, Latvia, the Netherlands, Poland, Slovakia, Slovenia and Spain.
Campylobacter is also notifiable in Iceland and Norway. Information on Campylobacter notification was not
provided from Cyprus, France, Lithuania, Luxembourg, Malta, Portugal and Romania. Bulgaria did not test
for Campylobacter. At processing, cutting and retail, sampling was predominantly carried out on fresh meat.
Food samples were collected in several different contexts, i.e. continuous monitoring or control programmes,
surveys and as part of HACCP programmes implemented within the food industry. Samples reported as
HACCP or own controls were not included for analysis and, unless stated differently in the specific section,
data from suspect and selective sampling and outbreak or clinical investigations were also excluded.
Animals
Campylobacter is notifiable in Gallus gallus in the Czech Republic, Finland, Slovenia, Iceland and Norway, in
cattle in Germany and in all animals in Belgium, Estonia (only C. jejuni), Ireland, Latvia, the Netherlands,
Spain and Switzerland. Information on Campylobacter notification was not provided from Cyprus, France,
Lithuania, Malta and Poland. Bulgaria did not test for Campylobacter. The most frequently used methods for
detecting Campylobacter in animals at farm, slaughter and in food were bacteriological methods (ISO, 2006;
NMKL, 2007) as well as PCR methods. In some countries, isolation of the organism is followed by
biochemical tests for speciation. For poultry sampled prior to slaughter, faecal material was collected either
as cloacal swabs or as sock samples (faecal material collected from the floor of poultry houses by pulling
gauze over footwear and walking through the poultry house). At slaughter, several types of samples were
collected, including cloacal swabs, caecal contents and/or neck skin.
2.4.3.
Listeria data
Humans
The notification of listeriosis in humans is mandatory in most MS, Iceland, Norway and Switzerland, except
for three MS, where notification is based on a voluntary system (Belgium, Spain, and the United Kingdom).
EFSA Journal 2015;13(1):3991
23
EU summary report on zoonoses, zoonotic agents and food-borne outbreaks 2013
No surveillance system exists in Portugal. The surveillance systems for listeriosis have full national coverage
in all MS except Spain, where the estimated coverage is 30 %. This population proportion was used in the
calculation of notification rates for Spain. Diagnosis of human infections is generally done by culture from
blood, cerebra-spinal fluid and vaginal swabs.
Food
Notification of Listeria in food is required in 12 MS (Austria, Belgium, Estonia, France, Germany, Hungary,
Italy, Latvia, the Netherlands, Slovakia, Slovenia and Spain); however, several other MS reported data.
Commission Regulation (EC) No 2073/2005 on microbiological criteria for foodstuffs lays down food safety
criteria for L. monocytogenes in ready-to-eat (RTE) foods. This Regulation came into force in January 2006.
Surveillance in RTE foods was performed in most MS. However, owing to differences in sampling and
analytical methods, comparisons from year to year were difficult.
Animals
Listeriosis in animals was notifiable in 13 MS (Belgium, the Czech Republic, Estonia, Finland, Germany,
Greece, Latvia, Lithuania, the Netherlands, Slovakia, Slovenia, Spain and Sweden), Switzerland and Norway
(information is missing from Bulgaria, Cyprus, Ireland, Malta and Poland). The monitoring of Listeria in
animals is mainly conducted through passive, laboratory-based surveillance of clinical samples, active
routine monitoring or random national surveys.
2.4.4.
VTEC data
Humans
The notification of VTEC infections is mandatory in most MS, Iceland, Norway and Switzerland, except for six
MS, where notification is based on a voluntary system (Belgium, France, Italy, Luxembourg and Spain) or
other system (the United Kingdom). No data were reported from Liechtenstein and no surveillance system
exists in Portugal. The surveillance systems for VTEC infections have full national coverage in all MS except
three (Belgium, France and Italy). In France, the VTEC surveillance is centred on paediatric Haemolyticuremic syndrome (HUS) surveillance. Diagnosis of human VTEC infections is generally done by culture from
stool samples although diagnosis by direct detection of the toxin or the toxin genes, without strain isolation,
is increasing.
Food and animals
VTEC is notifiable in food in 11 MS (Austria, Belgium, Estonia, Germany, Italy, Latvia, the Netherlands,
Romania, Slovakia, Slovenia and Spain) and in animals in eight MS (Belgium, the Czech Republic, Estonia,
Finland, Latvia, Lithuania, Spain and Sweden)
(information is missing from Bulgaria, Cyprus, the Czech Republic, Denmark, Greece, Hungary, Lithuania,
Malta, Poland, Portugal and Switzerland for food, and from Bulgaria, Cyprus, France, Germany, Greece,
Ireland, Malta, Poland, Portugal and Romania for animals).
Samples were collected in a variety of settings, such as slaughterhouses, cutting plants, dairies, wholesalers
and at retail level, and included different types of samples such as carcase surface swabs, cuts of meats,
minced meat, milk, cheese, and other products. The majority of investigated products were raw but intended
to undergo preparation before consumption. The samples were taken as part of official control and
monitoring programmes as well as random national surveys. The number of samples collected and types of
food sampled varied among individual MS. Most of the animal samples were collected at the slaughterhouse
or at the farm.
2.4.5.
Yersinia data
Humans
Notification of yersiniosis in humans is mandatory in most MS, Iceland, Norway and Switzerland. Belgium,
France, Italy, Luxembourg and Spain have a voluntary notification system and the United Kingdom has
another system. No surveillance system exists in Greece, the Netherlands and Portugal. The estimated
coverage of the sentinel surveillance for yersiniosis in Spain is 30 %, and this population proportion was
used in the calculation of notification rates. Diagnosis of human gastrointestinal infections is generally done
by culture from human stool samples.
Food and animals
Yersinia is notifiable in food in 10 MS (Austria, Belgium, Estonia, Germany, Italy, Latvia, the Netherlands,
Slovakia, Slovenia and Spain), and in animals in seven MS (Belgium, Ireland, Latvia, Lithuania, the
24
EFSA Journal 2015;13(1):3991
EU summary report on zoonoses, zoonotic agents and food-borne outbreaks 2013
Netherlands, Slovenia and Spain) and Switzerland. Information was not provided from Bulgaria, Cyprus, the
Czech Republic, Denmark, France, Greece, Hungary, Lithuania, Malta, Portugal, Romania and Switzerland
for food, and from Bulgaria, Cyprus, France, Germany, Greece, Malta and Poland for animals. Primarily,
domestic animals were tested. The reporting of specific human pathogenic serotypes/biotypes found in food
and animals is often lacking and differences in sampling and analytical methods make comparison between
countries difficult.
2.4.6.
Tuberculosis data
Humans
The notification of tuberculosis in humans is mandatory in all MS, Iceland, Norway and Switzerland. In
France, the notification system for human tuberculosis, however, does not distinguish between tuberculosis
cases caused by different species of Mycobacterium. Therefore, no reporting of cases due to M. bovis is
available from France.
Animals
Tuberculosis in animals is notifiable in 25 MS, Norway and Switzerland (information was not provided from
Bulgaria and Malta). In Cyprus, Greece, Hungary, Poland and Romania only bovine tuberculosis is notifiable,
and in Ireland only tuberculosis in ruminant animals is notifiable. Rules for intra-EU bovine trade, including
requirements for cattle herds and country qualification as officially free from tuberculosis, are laid down in
13
14
Council Directive 64/432/EC, as last amended by Commission Decision 2007/729/EC. More detailed
information regarding the 2013 status of EU MS, Norway and Switzerland and regions thereof in relation to
cattle tuberculosis can be found in European Commission’s DG SANCO’s ‘2013 annual report on bovine and
swine diseases (EC, online).
2.4.7.
Brucella data
Humans
The notification of brucellosis in humans is mandatory in all MS, Iceland, Norway and Switzerland except
Belgium, Denmark and the United Kingdom. Both the voluntary surveillance system in Belgium and the one
in United Kingdom however have full national coverage. In Denmark, brucellosis is not notifiable and no
surveillance system is in place.
Food
The notification of Brucella in food is mandatory in 10 MS (Austria, Belgium, Finland, Germany, Italy, Latvia,
the Netherlands, Slovenia, Spain and the United Kingdom). Information was not provided from Bulgaria,
Cyprus, the Czech Republic, Denmark, France, Greece, Lithuania, Luxembourg, Malta, Poland, Portugal,
Romania, Slovakia and Switzerland.
Animals
Brucellosis in animals is notifiable in 24 MS, Norway and Switzerland (information was not provided from
Bulgaria, Cyprus and Malta). Rules for intra-EU bovine trade, including requirements for cattle herds and
country qualification as officially free from brucellosis, are laid down in Council Directive 64/432/EC, as last
amended by Commission Decision 2007/729/EC. Rules for intra-EU trade of ovine and caprine animals and
country qualification as officially free from ovine and caprine brucellosis, caused by B. melitensis (ObmF),
15
16
are laid down in Council Directive 91/68/EEC, as last amended by Council Directive 2008/73/EC. More
detailed information regarding the 2013 status of EU MS, Norway and Switzerland and regions thereof in
relation to cattle brucellosis can be found in European Commission’s DG SANCO’s ‘2013 annual report on
bovine and swine diseases (EC, online).
13
Council Directive 64/432/EEC of 26 June 1964 on animal health problems affecting intra-Community trade in bovine animals and
swine. OJ L 121, 29.07.1964, p. 1977–2012.
14
Commission Decision 2007/729/EC of 7 November 2007 amending Council Directives 64/432/EEC, 90/539/EEC, 92/35/EEC,
92/119/EEC, 93/53/EEC, 95/70/EC, 2000/75/EC, 2001/89/EC, 2002/60/EC, and Decisions 2001/618/EC and 2004/233/EC as
regards lists of national reference laboratories and State institutes. OJ L 294, 13.11.2007, p. 26–35.
15
Council Directive 91/68/EEC of 28 January 1991 on animal health conditions governing intra-Community trade in ovine and caprine
animals. OJ L 46, 19.2.1991, p. 19–36.
16
Council Directive 2008/73/EC of 15 July 2008 simplifying procedures of listing and publishing information in the veterinary and
zootechnical fields and amending Directives 64/432/EEC, 77/504/EEC, 88/407/EEC, 88/661/EEC, 89/361/EEC, 89/556/EEC,
90/426/EEC, 90/427/EEC, 90/428/EEC, 90/429/EEC, 90/539/EEC, 91/68/EEC, 91/496/EEC, 92/35/EEC, 92/65/EEC, 92/66/EEC,
92/119/EEC, 94/28/EC, 2000/75/EC, Decision 2000/258/EC Directives 2001/89/EC, 2002/60/EC and 2005/94/EC. OJ L 219,
14.8.2008, p. 40–54.
EFSA Journal 2015;13(1):3991
25
EU summary report on zoonoses, zoonotic agents and food-borne outbreaks 2013
2.4.8.
Trichinella data
Humans
The notification of Trichinella infections in humans is mandatory in all MS, Iceland, Norway and Switzerland,
except Belgium, Denmark, France and the United Kingdom. Belgium, France and the United Kingdom have
voluntary surveillance systems for trichinellosis with full national coverage in France and the United
Kingdom. No surveillance system for trichinellosis exists in Denmark. In humans, diagnosis of Trichinella
infections is primarily based on clinical symptoms and serology (indirect enzyme-linked immunosorbent
assay (i-ELISA) and Western blot). Histopathology on muscle biopsies is rarely performed.
Food and animals
Trichinella in food is notifiable in 17 MS and Norway. Ireland and Switzerland report that Trichinella is not
notifiable. Information was not provided from Bulgaria, Cyprus, the Czech Republic, Denmark, Latvia,
Lithuania, Luxembourg, Malta and the Netherlands.
Trichinella infections in animals are notifiable in all MS except Hungary (information was not provided from
Malta) and Switzerland.
Rules for testing for Trichinella in slaughtered animals are laid down by Commission Regulation (EC) No
17
2075/2005. In accordance with this Regulation, all finisher pigs, sows, boars, horses, wild boars and some
other wild species must be tested for Trichinella at slaughter. The Regulation allows MS to apply for status
as a region with negligible risk of Trichinella infestation in animals. Denmark is the only MS to have been
assigned this status. Some MS reported using digestion and compression methods as described in Council
18
Directive 77/96/EEC.
2.4.9.
Echinococcus data
Humans
Cases of both cystic and alveolar echinococcosis are reported jointly to ECDC as echinococcosis since the
EU case definition does not distinguish between the two forms of the disease. ECDC can differentiate
between the two forms in the data only by analysing the reported species. The notification of echinococcosis
in humans is mandatory in most MS, Iceland and Norway. Four MS (Belgium, France, the Netherlands and
the United Kingdom) have a voluntary surveillance system for echinococcosis. Denmark and Italy have no
surveillance system for echinococcosis. Mandatory notification of the disease was introduced in Iceland in
2012. In Switzerland, echinococcosis in human is not notifiable.
Food and animals
Echinococcus is notifiable in food in 11 MS (Austria, Belgium, Estonia, Finland, Hungary, Italy, Latvia, the
Netherlands, Slovenia, Spain and Sweden) and Norway and not notifiable in food in Ireland, Slovakia and
the United Kingdom. Information was not provided from Bulgaria, Cyprus, the Czech Republic, Denmark,
France, Greece, Germany, Lithuania, Luxembourg, Malta, Poland, Portugal, Romania and Switzerland.
Echinococcus is notifiable in animals in 18 MS (Austria, Belgium, Denmark, Estonia, Finland, Germany,
Greece, Italia, Latvia, Lithuania, the Netherlands, Portugal, Romania, Slovakia, Slovenia, Spain, Sweden
and the United Kingdom), Norway and Switzerland and not notifiable in animals in the Czech Republic,
France, Hungary and Luxembourg (information was not provided from Bulgaria, Cyprus, Ireland, Malta and
Poland).
Guidelines for the control of E. granulosus through meat inspection of animal carcases for human
19
whereby visual inspection of all
consumption are provided through Council Directive 64/433/EC,
slaughtered animals is carried out by official veterinarians examining organs and muscles intended for
human consumption. Whole carcases or organs are destroyed in cases where Echinococcus cysts are
found.
17
Commission Regulation (EC) No 2075/2005 of 5 December 2005 laying down specific rules on official controls for Trichinella in
meat. OJ L 338, 22.12.2005, p. 60-82.
18
Council Directive 77/96/EEC of 21 December 1976 on the examination for trichinae (trichinella spiralis) upon importation from third
countries of fresh meat derived from domestic swine. OJ L 26, 31.1.1977, p. 67–77.
19
Council Directive 64/433/EC of 26 June 1964 on health problems affecting intra-Community trade in fresh meat. OJ L 121,
29.7.1964, pp. 2012–2032.
EFSA Journal 2015;13(1):3991
26
EU summary report on zoonoses, zoonotic agents and food-borne outbreaks 2013
2.4.10. Toxoplasma data
Humans
Data on congenital toxoplasmosis in the EU in 2013 are not included in this report but will be published in the
ECDC Annual Epidemiological Report 2015 (in preparation).
Animals
Toxoplasmosis is a notifiable disease in Latvia, Poland and Switzerland in all animals and in Finland in all
animals except hares, rabbits and rodents; no active monitoring programmes are in place in Switzerland. In
Germany, toxoplasmosis is notifiable in pigs, dogs and cats. In Austria, Denmark, and Sweden
toxoplasmosis is not notifiable (information is missing from Belgium, Bulgaria, Cyprus, the Czech Republic,
Estonia, France, Greece, Hungary, Ireland, Italy, Lithuania, Luxembourg, Malta, the Netherlands, Portugal,
Romania, Slovakia, Slovenia, Spain and the United Kingdom).
2.4.11. Rabies data
Humans
The notification of rabies in humans is mandatory in most MS, Iceland, Norway and Switzerland. Belgium
has a voluntary notification system and the United Kingdom has another system. Most countries use the EU
case definition apart from Belgium, Denmark, Finland, France, Germany and Italy who have other/non
specified case definitions. Most countries examine human cases based on blood samples or cerebrospinal
fluid, and saliva. However, in the case of post- mortem examinations, the central nervous system is sampled.
Identification is mostly based on antigen detection, viral genome detection by Real Time-Polymerase Chain
Reaction (RT-PCR) and/or isolation of virus.
Animals
Rabies is a notifiable disease in all MS and Switzerland. In animals, most countries test samples from the
central nervous system. Identification is mostly carried out using the fluorescent antibody test (FAT), which is
recommended by both World Health Organization (WHO, 1996) and World Organisation for Animal Health
(OIE, 2009), and the mouse inoculation test. However, ELISA, PCR, and histology are also used.
2.4.12. Q-fever data
Humans
The notification of Q fever in humans is mandatory in 23 MS, Iceland, Norway and Switzerland. The disease
is not notifiable in Austria, Denmark and Italy. Belgium, France, Spain and the United Kingdom have a
voluntary system, which for Belgium and Spain is based on sentinel surveillance. The population covered by
the sentinel surveillance system is estimated to be 30 % for Spain and unknown for Belgium, but both are
reportedly constant over the study years. Cases are reported in an aggregated format by Bulgaria and
Croatia, and case based for the other countries. Countries use EU case definitions apart for Belgium,
Finland, France, Germany and Romania (not specified).
Animals
C. burnetii in animals is notifiable in 15 MS (Bulgaria, the Czech Republic, Denmark, Finland, France,
Germany, Greece, Italy, Latvia, Lithuania, the Netherlands, Poland, Slovenia, Spain and Sweden) and
Switzerland. In Austria, C. burnetii in animals is not notifiable (information is missing from the remaining
11 MS and Norway).
Data reported are mostly based on suspect sampling due to an increase in abortions in the herd and
identification is mostly carried out using serological testing methods as ELISA or immunofluorescence assay
(IFA) tests or direct identification methods such as real-time PCR.
2.4.13. West Nile Virus data
Humans
The notification of West Nile fever in humans is mandatory in 21 MS, Norway and Switzerland. The disease
is not notifiable in Denmark, Germany and Portugal. Belgium, France and the United Kingdom have a
voluntary system, which in Belgium and France is based on sentinel surveillance, and in the United Kingdom
on another, unspecified, surveillance system. The population covered by the sentinel surveillance systems is
unknown, but in both cases is reportedly constant over the study years. EU case definitions are used by
EFSA Journal 2015;13(1):3991
27
EU summary report on zoonoses, zoonotic agents and food-borne outbreaks 2013
most countries apart for Belgium, Finland, Italy and the United Kingdom (not specified). Cases are reported
in an aggregated format by Croatia, and case-based for the other countries.
Total case numbers for West Nile fever were used because case confirmation according to the EU case
definition is usually carried out only when cases occur in previously unaffected areas. Subsequent cases are
usually diagnosed with laboratory methods for probable cases. Thus, both probable and confirmed cases
reflect more accurately the epidemiological situation. This approach is also used for the seasonal real-time
monitoring of West Nile cases in the EU carried out by ECDC.
Animals
Reporting of West Nile virus in animals is not mandatory. But where the epidemiological situation in a MS so
warrants, West Nile virus in animals shall also be monitored. West Nile virus infection is notifiable in horses
in Great Britain and in animals in Switzerland.
2.4.14. Tularaemia data
Humans
The notification of tularaemia in humans is mandatory in most MS, Norway and Switzerland (information is
missing from Denmark, Iceland and Liechtenstein). Two MS (Belgium and the United Kingdom) have a
voluntary surveillance system for tularaemia in humans.
Animals
The notification of tularaemia in animals is mandatory in Switzerland.
2.4.15. Other zoonoses and zoonotic agents data
Food and animals
Cysticercus in food and animals: Monitoring is carried out as a visual inspection (macroscopic examination)
20
of carcases at the slaughterhouse by meat inspection according to Regulation (EC) No 854/2004, or by
specific serological tests.
2.4.16. Food-borne outbreaks data
Food-borne outbreaks are incidents of two or more human cases of the same disease or infection in which
the cases are linked or are probably linked to the same food vehicle. Situations in which the observed human
cases exceed the expected number of cases and where the same food source is suspected are also
indicative of a food-borne outbreak.
For ‘weak-evidence’ food-borne outbreaks, the causative agent, as well as the number of human cases,
hospitalisations and deaths, should be reported. For the ‘strong-evidence’ food-borne outbreaks, more
detailed information is collected, including food vehicle and its origin, nature of evidence linking the outbreak
cases to the food vehicle, type of outbreak, setting, place of origin of the problem and contributory factors. All
food-borne outbreaks are included in the general tables and figures. The denominators used for the
calculation of the reporting rates were the human populations from the EUROSTAT as extracted on
12 December 2014.
2.5.
Terms used to describe prevalence or proportion positive values
In the report a set of standardised terms are used to characterise the proportion of positive sample units or
the prevalence of zoonotic agents in animals and food:
•
Rare:
< 0.1 %
•
Very low:
0.1 % to 1 %
•
Low:
> 1 % to 10 %
•
Moderate:
> 10 % to 20 %
•
High:
> 20 % to 50 %
•
Very high:
> 50 % to 70 %
•
Extremely high:
> 70 %
20
Regulation (EC) No 854/2004 of the European Parliament and of the Council of 29 April 2004 laying down specific rules for the
organisation of official controls on products of animal origin intended for human consumption. OJ L 139, 30.4.2004, p. 206-320.
EFSA Journal 2015;13(1):3991
28
EU summary report on zoonoses, zoonotic agents and food-borne outbreaks 2013
3. Assessment
This report section provides the EU assessment of the specific zoonoses during 2013. It is descriptive in
essence.
3.1.
Salmonella
The Appendix contains hyperlinks to all data summarised for the production of this section, for humans, food,
animals and feed, and for food-borne outbreaks. It also includes hyperlinks to Salmonella summary tables
and figures that were not displayed in this section because they did not trigger any marked observation. The
summarised data are presented in downloadable Excel and PDF files, and are listed by subject. Moreover,
all
submitted
and
validated
data
by
the
MS
are
available
online
(http://www.efsa.europa.eu/en/efsajournal/pub/3991.htm).
3.1.1.
Salmonellosis in humans
A total of 85,268 salmonellosis cases were reported by 27 EU MS in 2013, with 82,694 confirmed cases and
an EU notification rate of 20.4 cases per 100,000 population (Table 2). This represented a 7.9 % decrease in
the EU notification rate compared with 2012, with decreasing rates reported in 21 reporting MS. The highest
notification rates in 2013 were reported by the Czech Republic (93.1 cases per 100,000 population) and
Slovakia (70.3 per 100,000), while the lowest rates were reported by Portugal and Greece (≤ 4 per 100,000).
The proportion of domestic cases versus travel-associated cases varied markedly between countries, with
the highest proportion of travel-related cases, > 70 %, in the Nordic countries, including Finland, Sweden and
Norway (Table SALMHUMIMPORT).
EFSA Journal 2015;13(1):3991
29
EU summary report on zoonoses, zoonotic agents and food-borne outbreaks 2013
Table 2. Reported cases and notification rates per 100,000 of human salmonellosis in the EU/EEA,
2009–2013
2013
Country
National
Data
Coverage (a) Form at (a)
2012
Total
Cases
2011
2010
2009
Confirm ed
Confirm ed
Confirm ed
Confirm ed
Confirm ed
Cases & Rates Cases & Rates Cases & Rates Cases & Rates Cases & Rates
Cases Rate Cases
1404
16.6
1773
2528
3101
766
10.5
839
-
Rate
Cases Rate
Cases Rate Cases Rate
21.1
1432
17.0
2179
26.0
2775
33.2
3177
3169
3113
11.5
924
12.5
1154
15.5
1247
16.7
-
Austria
Belgium(b)
Bulgaria
Croatia(c)
Y
N
Y
Y
C
C
A
A
1435
2528
812
1254
Cyprus
Czech Republic
Denmark
Estonia
Finland
France
Germany
Greece
Hungary
Ireland
Italy (d)
Latvia
Lithuania
Luxembourg
Malta
Netherlands (e)
Poland
Portugal
Romania
Slovakia
Slovenia
Spain(f)
Sw eden
United Kingdom
Y
Y
Y
Y
Y
Y
Y
Y
Y
Y
Y
Y
Y
Y
N
Y
Y
Y
Y
Y
N
Y
Y
C
C
C
C
C
C
C
C
C
C
C
C
C
C
C
A
C
C
C
C
C
C
C
79
9959
1137
186
1986
8927
18986
417
5122
326
394
1199
120
84
979
7577
171
1404
4026
316
4537
2842
8465
79
9790
1137
183
1986
8927
18696
414
4953
326
385
1199
120
84
979
7307
167
1302
3802
316
4537
2842
8465
9.1
93.1
20.3
13.9
36.6
13.6
22.8
3.7
50.2
7.1
19.0
40.4
22.3
19.9
9.1
19.0
1.6
6.5
70.3
15.4
32.4
29.7
13.2
90
10056
1207
249
2199
8705
20493
404
5462
309
1453
547
1762
136
88
2198
7952
185
698
4627
392
4224
2922
8812
10.4
95.7
21.6
18.8
40.7
13.3
25.1
3.6
55.2
6.7
26.8
58.7
25.9
21.1
20.5
20.6
1.8
3.5
85.6
19.1
36.1
30.8
13.9
110
8499
1170
375
2098
8685
23982
471
6169
311
4464
995
2294
125
129
1284
8400
174
989
3897
400
3786
2887
9455
13.1
81.0
21.0
28.2
39.0
13.4
29.4
4.2
62.8
6.8
7.5
48.0
75.2
24.4
31.1
12.0
21.8
1.7
5.0
72.3
19.5
32.5
30.7
15.1
136
8209
1608
381
2421
7184
24833
297
5953
349
5305
877
1962
211
160
1447
9257
205
1285
4942
363
4420
3612
9670
EU Total
-
-
85268
82694
20.4
90883
22.1
96682
20.9
101589
Iceland
Liechtenstein
Norw ay
Sw itzerland(g)
Y
Y
Y
C
C
C
49
1362
1271
49
1361
1271
15.2
26.9
15.8
38
1371
1242
11.9
27.5
15.6
45
1290
1301
14.1
26.2
16.5
34
1370
1177
16.6
78.5
29.1
28.6
45.2
11.1
30.4
2.7
60.4
7.7
9.0
41.4
62.4
42.0
38.6
13.6
24.3
2.0
6.4
91.7
17.7
38.0
38.7
15.6
134
10480
2130
261
2327
7153
31395
403
5873
335
5715
795
2063
162
125
1204
8529
220
1105
4182
616
4304
3054
10479
16.8
100.5
38.6
19.5
43.7
11.1
38.4
3.6
59.5
7.4
9.7
36.8
64.8
32.8
30.4
11.4
22.4
2.1
5.5
77.7
30.3
37.2
33.0
17.0
22.1 110179
24.0
10.7
28.2
15.1
11.0
25.7
16.9
35
1235
1302
(a): Y: yes; N: no; A: aggregated data; C: case-based data;-: no report.
(b): Sentinel surveillance; no information on estimated coverage. Thus, notification rate cannot be estimated.
(c): All cases of unknown case classification.
(d): No report for 2013 and provisional data for 2012.
(e): Sentinel system; notification rates calculated with an estimated population coverage of 64 %.
(f): Notification rates calculated with an estimated population coverage of 30 % in 2013 and 25 % in 2009-2012.
(g): Switzerland provided data directly to EFSA.
There was a clear seasonal trend in confirmed salmonellosis cases reported in the EU in 2009-2013, with
most cases reported during summer months. There was a declining trend of salmonellosis in the
EU/European Economic Area (EEA) in the five-year period, although not statistically significant when
analysed by month (p=0.349 with linear regression) (Figure 3).
EFSA Journal 2015;13(1):3991
30
EU summary report on zoonoses, zoonotic agents and food-borne outbreaks 2013
Source: Austria, Belgium, Cyprus, Czech Republic, Denmark, Estonia, Finland, France, Germany, Greece, Hungary, Iceland, Ireland,
Lithuania, Luxembourg, Malta, Netherlands, Norway, Portugal, Romania, Slovakia, Slovenia, Spain, Sweden and United
Kingdom. Bulgaria, Croatia, Italy, Latvia, Poland and Romania did not report data over the whole period in the level of detail
needed for the analysis.
Figure 3. Trend in reported confirmed cases of human non-typhoidal salmonellosis in the EU/EEA,
2009-2013
Twelve MS provided information on hospitalisation for some or all of their cases. Slovakia and Spain
reported hospitalisation status for the first time in 2013, increasing the proportion of confirmed cases with
known hospitalisation status from 10.1 % to 26.4 % and resulting in a decrease of the proportion of cases
hospitalised from 45.1 % to 36.0 %. The highest hospitalisation proportions were reported in Cyprus,
Romania, Greece and Portugal (80–95 % of cases hospitalised). Three of these countries also reported the
lowest notification rates of salmonellosis, which indicates that the surveillance systems in these countries
primarily capture the more severe cases.
Fourteen MS provided data on the outcome of their cases in 2013, and, among them, nine MS reported a
total of 59 fatal cases. This gives an EU case-fatality rate of 0.14 % among the 40,976 confirmed cases for
which this information was reported (49.6 % of all confirmed cases).
Information on Salmonella serovars from cases of human infection was available from 25 MS (Bulgaria,
Croatia and Poland reported no case-based serovar data) and two non-MS. As in previous years, the two
most commonly reported Salmonella serovars in 2013 were S. Enteritidis and S. Typhimurium, representing
39.5 % and 20.2 %, respectively, of all reported serovars in confirmed human cases (N=73,627) (Table 3).
S. Enteritidis continued to decrease, with 4,760 fewer cases reported in the EU in 2013 than in 2012 and
with a decrease in confirmed cases of 19.3 % compared with 2011. In the two-year period from 2011 to
2013, cases of S. Typhimurium decreased by 26.0 %. Cases of monophasic S. Typhimurium 1,4,[5],12:i:-,
however, increased by 68.8 %, with four additional countries reporting this variant in 2013 compared with
2011. Adding the cases of S. Typhimurium and its variants, including monophasic strains (3rd most common
serovar), a decrease of 11.1 % was observed from 2011 to 2013.
Salmonella Infantis, the fourth most common serovar, increased in the EU/EEA in 2013 by 26.5 % compared
with 2011 (Table 3). Several countries contributed to this increase, and the most notable increase in 2013
was observed in Germany, where twice as many S. Infantis cases (685 confirmed cases) were reported
compared with the average of the previous two years. The increase could be largely attributed to a large
food-borne outbreak from pork products eaten raw, involving 267 cases in four German federal states.
Insufficient hygiene measures in the slaughterhouse were identified as the most probable cause of the
prolonged transmission of S. Infantis (Schroeder et al., 2014).
The increase observed in S. Derby, the fifth most common serovar in 2013, could partly be explained by a
local outbreak in Berlin, Germany, and surrounding areas in December 2013/January 2014 (Frank et al.,
2014). The outbreak occurred in hospitals and nursing homes with 145 elderly patients affected and one fatal
EFSA Journal 2015;13(1):3991
31
EU summary report on zoonoses, zoonotic agents and food-borne outbreaks 2013
case. The suspected vehicle of infection was raw fermented pork spread (‘teewurst’). A local outbreak in
Brittany, France, in the same period further contributed to the increase in this serovar. The outbreak involved
a common meal where a cross-contamination of the meat (beef and pork) during the preparation of the meal
was suspected to have occurred (Nathalie Jourdan, French Institute for Public Health Surveillance – Institut
de Veille Sanitaire (InVS), personal communication, October 2014). Among the 64 exposed persons,
45 developed symptoms and S. Derby was identified in laboratory-confirmed cases.
Owing to the multi-country outbreak of S. Stanley in the EU linked to contamination in the turkey production
chain, this serovar increased in 2011, peaked in 2012 and then decreased somewhat in 2013, although
remaining at higher levels than before the outbreak. In 2014, human clusters were still being reported with
the outbreak strain, suggesting that it was still circulating in the European food market (ECDC and EFSA,
2014).
The largest increase in the period 2011-2013 among other serovars on the top 20 list was observed for
S. Muenchen (139.6 %). Germany accounted for a large proportion of the increase in 2013 with
164 confirmed cases reported in June and July 2013 only.
Table 3. Distribution of reported confirmed cases of human salmonellosis in the EU/EEA, 2011–2013,
by the 20 most frequent serovars in 2013
Serovar
Enteritidis
Typhimurium
Monophasic Typhimurium 1.4.[5].12:i:Infantis
Derby
Stanley
Newport
Kentucky
Agona
Virchow
Muenchen
Napoli
Bovismorbificans
Saintpaul
Montevideo
Panama
Brandenburg
Oranienburg
Hadar
Rissen
Other
Total
Source:
Cases
36064
20068
3739
1760
710
516
803
579
476
495
187
320
423
384
375
259
272
371
291
250
12690
80782
2011
MS
27
27
10
25
22
22
23
22
21
25
18
14
19
18
18
14
13
18
18
17
27
%
44.6
24.8
4.6
2.2
0.9
0.6
1.0
0.7
0.6
0.6
0.2
0.4
0.5
0.5
0.5
0.3
0.3
0.5
0.4
0.3
15.7
100.0
Cases
33850
18216
5932
2007
732
1115
770
647
470
544
253
376
421
372
298
705
303
315
307
293
14550
82183
2012
MS
27
27
12
26
21
20
21
23
18
20
20
16
20
18
18
14
17
16
20
19
27
%
41.2
22.2
7.2
2.4
0.9
1.4
0.9
0.8
0.6
0.7
0.3
0.5
0.5
0.5
0.4
0.9
0.4
0.4
0.4
0.4
17.7
100.0
Cases
29090
14852
6313
2226
818
813
714
651
581
571
448
434
412
401
375
352
290
274
267
266
13745
73627
2013
MS
27
27
14
25
21
21
21
23
24
22
17
14
20
18
18
16
17
15
19
20
27
%
39.5
20.2
8.6
3.0
1.1
1.1
1.0
0.9
0.8
0.8
0.6
0.6
0.6
0.5
0.5
0.5
0.4
0.4
0.4
0.4
18.7
100.0
25 MS and two non-MS-Austria, Belgium, Cyprus, Czech Republic, Denmark, Estonia, Finland, France, Germany, Greece,
Hungary, Iceland, Ireland, Italy, Latvia, Lithuania, Luxembourg, Malta, Netherlands, Norway, Portugal, Romania, Slovakia,
Slovenia, Spain, Sweden and United Kingdom.
EFSA Journal 2015;13(1):3991
32
EU summary report on zoonoses, zoonotic agents and food-borne outbreaks 2013
3.1.2.
Salmonella in food, animals and feedingstuffs
Comparability of data
It is important to note that results from different countries are not directly comparable owing to betweencountry variation in the sampling and testing methods used. In addition, EU-level, overall results are highly
influenced by the reporting MS and the sample sizes in their investigations, both of which vary between the
years. Moreover, it should be taken into consideration that the proportion of positive samples observed might
have been influenced by the sampling season, because Salmonella are known to be more prevalent in
animals during summer (Hald and Andersen, 2001; Zdragas et al., 2012).
Only results for the most important food products and animals that might serve as a source for human
infection in the EU are presented.
Food
Twenty-seven MS and three non-MS reported data on Salmonella in various foodstuffs. Most MS reported
data on Salmonella in food of animal origin, primarily broiler meat, pig meat and bovine meat
(Table SALMOVERVIEWFOOD).
Compliance with microbiological criteria
The Salmonella criteria laid down by Regulation (EC) No 2073/2005 have been in force since
21
1 January 2006 (revised by Regulations (EC) No 1441/2007 and 1086/2011 ). The regulations prescribe
sampling and testing requirements, and set limits for the presence of Salmonella in specific food categories.
According to these criteria, Salmonella must be absent in relevant products when placed on the market,
during their shelf-life. Absence is defined by testing five or 30 samples of 25 g per batch, depending on the
food category; however, the definition of a batch varies widely and in official controls, often only single
samples are taken to verify compliance with the criteria.
An evaluation of compliance with the Salmonella criteria at the EU level for 2011-2013 is summarised in
Figure 4 (Tables SALMCOMPLFOODand SALMCOMPLPOULTRYMEAT). The evaluation includes only
investigations where the sampling unit (single samples or batches) and sampling stage at the retail level
have been reported for the relevant food types. As in previous years, the highest levels of non-compliance
with Salmonella criteria generally occurred in foods of meat origin, which are intended to be cooked before
consumption; however, even here the overall levels of non-compliance were low (< 10 %, Figure 4). Minced
meat and meat preparations from poultry intended to be eaten cooked had the highest level of noncompliance (6.3 % of single samples and 5.6 % of batches). Low non-compliance was also reported for meat
products from poultry meat intended to be eaten cooked (1.6 % of single samples and 1.7 % of batches) and
for minced meat and meat preparations from animal species other than poultry intended to be eaten cooked
(0.7 % of single samples and 3.1 % of batches). The occurrence of Salmonella in foods of meat origin
intended to be eaten raw is of particular relevance because of the risk such foods pose to human health.
There were only a few non-compliant findings of meat products, minced meat and meat preparations
intended to be eaten raw.
Since December 2011, a Salmonella criterion for S. Enteritidis and S. Typhimurium (including monophasic S.
Typhimurium strains with the antigenic formula 1,4,[5],12:i:-) in fresh poultry meat (including fresh meat from
breeding flocks of Gallus gallus, laying hens, broilers and breeding and fattening flocks of turkeys) has been
in force (Regulation (EC) No 1086/2011). Compared with 2012, the reported non-compliance decreased
from 0.5 % to 0.2 % of single samples and from 0.7 % to 0.2 % of batches, which is a very encouraging
trend, indicating that the continued investment of MS in Salmonella control is yielding noticeable results.
All samples/batches of dried infant formulae and dried dietary foods for medical purposes, milk and whey
powder, and cooked crustaceans and molluscan shellfish were found to be compliant with the Salmonella
criteria. Low non-compliance was reported for live bivalve molluscs and live echinoderms, tunicates and
gastropods (2.0 % of single samples and 1.0 % of batches) and for RTE sprouted seeds (0.8 % of single
samples). The proportion of non-compliant samples for the other food categories was low to very low, as
observed in previous years.
21
Commission Regulation (EU) No 1086/2011 of 27 October 2011 amending Annex II to Regulation (EC) No 2160/2003 of the
European Parliament and of the Council and Annex I to Commission Regulation (EC) No 2073/2005 as regards salmonella in fresh
poultry meat. OJ L 281, 28.10.2011, p. 7–11.
EFSA Journal 2015;13(1):3991
33
EU summary report on zoonoses, zoonotic agents and food-borne outbreaks 2013
% non-compliant single samples
0
1
2
3
4
5
6
7
8
9
Minced meat and meat preparations to be eaten raw (3 MS,
N=212)
Minced meat and meat preparations from poultry to be eaten
cooked (13 MS, N=1,741)
Minced meat and meat preparations from other species than
poultry to be eaten cooked (14 MS, N= 4,906)
Mechanically separated meat (1 MS, N=2)
Meat products intended to be eaten raw (8 MS, N=1,832)
Meat products from poultry meat intended to be eaten cooked (6
MS, N=254)
Gelatine and collagen (4 MS, N=174)
Cheeses, butter and cream made from raw or low heat-treated milk
(8 MS, N=834)
2011
Milk and whey powder (6 MS, N=137)
2012
Ice-cream (10 MS, N=6,855)
2013
Egg products (5 MS, N=547)
Ready-to-eat foods containing raw egg (2 MS, N=164)
Cooked crustaceans and molluscan shellfish (3 MS, N=125)
Live bivalve molluscs and live echinoderms, tunicates and
gastropods (4 MS, N=397)
Ready-to-eat sprouted seeds (2 MS, N=134)
Ready-to-eat pre-cut fruit and vegetables (7 MS, N=1,599)
Unpasteurised fruit and vegetable juices (4 MS, N=407)
Dried infant formulae, and dried dietary foods for medical purposes
(8 MS, N=693)
Fresh poultry meat (15 MS, N=2,591)
Figure 4. Proportion of units (single samples and batches) not complying with the EU Salmonella
criteria, 2011-2013
EFSA Journal 2015;13(1):3991
34
EU summary report on zoonoses, zoonotic agents and food-borne outbreaks 2013
% non-compliant batches
0
1
2
3
4
5
6
7
8
9
Minced meat and meat preparations to be eaten raw (1 MS, N=1)
Minced meat and meat preparations from poultry to be eaten
cooked (6 MS, N=518)
Minced meat and meat preparations from other species than
poultry to be eaten cooked (8 MS, N=1,564)
Mechanically separated meat (2 MS, N=11)
Meat products intended to be eaten raw (3 MS, N=214)
Meat products from poultry meat intended to be eaten cooked (3
MS, N=177)
Gelatine and collagen (1 MS, N=14)
Cheeses, butter and cream made from raw or low heat-treated milk
(4 MS, N=1,285)
2011
Milk and whey powder (2 MS, N=34)
2012
Ice-cream (4 MS, N=268)
2013
Egg products (2 MS, N=6)
Ready-to-eat foods containing raw egg (1 MS, N=5)
Cooked crustaceans and molluscan shellfish (2 MS, N=82)
Live bivalve molluscs and live echinoderms, tunicates and
gastropods (3 MS, N=412)
Ready-to-eat sprouted seeds (4 MS, N=96)
Ready-to-eat pre-cut fruit and vegetables (6 MS, N=598)
Unpasteurised fruit and vegetable juices (5 MS, N=589)
Dried infant formulae, and dried dietary foods for medical purposes
(4 MS, N=319)
Fresh poultry meat (6 MS, N=613)
Number of included MS and tested units indicated for 2013. Includes investigations where the sampling unit (single samples or batches)
and sampling stage at retail (also catering, hospitals and care homes) has been specified for the relevant food types.
The number of reporting MS and tested samples (in brackets after the food categories) refers to 2013 data.
Figure 4 (cont). Proportion of units (single samples and batches) not complying with the EU
Salmonella criteria, 2011-2013
Broiler meat and products thereof
Monitoring activities and control programmes for Salmonella in fresh broiler meat are based on sampling at
the slaughterhouse (mainly neck skin samples) and/or at processing or cutting plants and at retail, where
meat samples are usually collected.
Overall, Salmonella was detected in 3.5 % of the 66,458 units tested (2.9 % of single samples and 5.6 % of
batches), which is comparable to the findings in 2012. At retail, the overall proportion of Salmonella-positive
samples was 7.5 %, higher than at slaughterhouse (4.9 %) and at the processing plant (2.6 %) level (Table
4). These results are heavily influenced by Poland’s reports of large investigations at slaughterhouses and at
processing plants, which constituted about 80.5 % of the samples of fresh broiler meat. At retail, Hungarian
data heavily influenced the overall results because of reporting 106 (33 % of 325 samples) of the total
208 Salmonella-positive samples.
Ten MS reported at all three sampling stages, although, in some cases, the main monitoring or surveillance
activities were clearly at one or two sampling stages, with only a smaller number of samples obtained at the
other levels. Generally, MS that reported higher proportions of positive samples did so for all sampling
stages.
EFSA Journal 2015;13(1):3991
35
EU summary report on zoonoses, zoonotic agents and food-borne outbreaks 2013
In 2013, Salmonella was found in 0.3 % of the 4,776 samples of RTE broiler meat products tested at retail or
at processing (0.1 % of single samples and 1.9 % of batches). Ireland provided very detailed information on
the origin of samples of imported meat, but none of these tested positive (Table SALMRTEBROIL).
Table 4. Salmonella in fresh broiler meat at slaughter, processing/cutting level and retail level, 2013
Sampling stage
Retail
Country
Austria
Matrix
fresh
Description
food sample, Surveillance
Sample
origin
Austria
European
Union
Unknown
Belgium
fresh
Surveillance
Bulgaria
fresh
food sample - meat, Surveillance
Bulgaria
Cyprus
fresh
food sample - meat, Surveillance
Czech
Republic
fresh
food sample, Surveillance
Estonia
fresh
food sample - meat, Surveillance
Germany
fresh
food sample - meat, Monitoring
Hungary
fresh
food sample, Surveillance
Ireland
fresh
food sample - meat, Surveillance
Unknown
Italy
fresh
food sample, Surveillance
Italy
Latvia
fresh
food sample, Surveillance
Czech
Republic
European
Union
Non-EU
Germany
Sample
unit
single
single
Sample
weight
Tested
Positive
Percent
positive
25 g
127
14
50 g
1
0
11.02
0
25 g
12
1
8.33
single
25 g
5
1
20
single
25 g
317
10
3.15
batch
25 g
73
2
2.74
single
25 g
3
1
33.33
single
25 g
7
0
0
batch
25 g
31
0
0
batch
25 g
58
0
0
0
batch
25 g
2
0
single
25 g
20
1
5
single
25 g
496
20
4.03
single
25 g
325
106
32.62
single
25 g
1
0
0
single
25 g
10
0
0
single
25 g
150
4
2.67
Luxembourg fresh
food sample - meat, Surveillance
Unknown
single
25 g
30
2
6.67
Netherlands fresh
food sample - meat, Surveillance
Netherlands single
25 g
600
19
3.17
Portugal
food sample, Surveillance
Portugal
batch
25 g
45
0
0
Romania
fresh,
chilled
fresh
food sample - meat, Surveillance
batch
25 g
94
9
9.57
food sample - meat, Surveillance
batch
25 g
96
4
4.17
Slovakia
fresh,
chilled
fresh
single
25 g
20
0
0
batch
25 g
31
0
0
single
25 g
14
0
0
Unknown
single
25 g
4
0
0
batch
25 g
25
2
8
batch
25 g
24
0
0
batch
25 g
7
0
0
batch
25 g
54
9
16.67
Slovenia
Spain
Iceland
food sample, Surveillance
European
Union
Slovakia
fresh,
chilled
food sample, Surveillance
European
Union
Slovakia
fresh,
frozen
fresh,
chilled
fresh
food sample, Surveillance
food sample, Monitoring
European
Union
Slovenia
food sample - meat, Surveillance
Unknown
food sample - neck skin, Surveillance Iceland
fresh,
breeding
flocks
Slaughter batch
single
25 g
82
3
3.66
batch
25 g
18
0
0
0
0
0
Batch
540
26
4.81
Single
2224
182
8.18
Total Retail
2764
208
7.53
EFSA Journal 2015;13(1):3991
36
EU summary report on zoonoses, zoonotic agents and food-borne outbreaks 2013
Table 4 (cont). Salmonella in fresh broiler meat at slaughter, processing/cutting level and retail level,
2013
Sampling stage
Country
Processing plant Austria
Matrix
Description
Sample
origin
Sample
weight
Tested
Positive
Percent
positive
fresh
food sample, Surveillance
single
25 g
8
0
0
Belgium
fresh
Surveillance
single
25 g
113
3
2.65
Monitoring
single
25 g
758
49
6.46
Bulgaria
fresh,
chilled
fresh
batch
25 g
366
17
4.64
single
25 g
15
0
0
single
25 g
190
10
5.26
5.17
food sample - meat, Surveillance
Austria
Sample
unit
Bulgaria
Cyprus
fresh
food sample - meat, Surveillance
Czech
R
bli
Estonia
fresh
food sample - meat, Surveillance
Unknown
single
25 g
290
15
fresh
food sample - meat, Monitoring
Estonia
batch
25 g
11
0
0
Greece
carcase, food sample, Surveillance
frozen
fresh
food sample, Surveillance
single
25 g
10
2
20
single
25 g
30
5
16.67
Hungary
fresh
food sample, Surveillance
Hungary
single
25 g
263
61
23.19
Ireland
fresh
food sample - meat, Surveillance
Ireland
batch
25 g
20
0
0
single
25 g
1
0
0
Netherlands single
25 g
3
0
0
Poland
single
25 g
2
0
0
food sample - neck skin, Surveillance Ireland
batch
25 g
10
0
0
single
25 g
2
0
0
5
0
0
fresh,
frozen
Luxembourg fresh
food sample - meat, Surveillance
Unknown
batch
25 g
food sample - meat, Surveillance
Unknown
single
25 g
3
0
0
Poland
food sample - meat, Surveillance
batch
25 g
4696
317
6.75
fresh
single
1000 g
25 g
food sample - neck skin, Surveillance
9
0.64
316
2.57
batch
25 g
52
1
1.92
single
25 g
23250
358
1.54
Portugal
fresh
food sample - meat, Surveillance
Romania
fresh,
chilled
carcase
food sample - meat, Surveillance
food sample - neck skin, Surveillance Unknown
batch
25 g
fresh
food sample, Surveillance
Non-EU
single
25 g
Slovakia
single
25 g
3
0
0
16
2
12.5
Slovakia
Portugal
1415
12275
single
25 g
39
0
0
batch
25 g
36
3
8.33
2
1
50
4
0
0
food sample, Surveillance
Unknown
batch
25 g
Spain
fresh,
chilled
fresh
food sample - meat, Surveillance
Unknown
single
25 g
73
2
2.74
Sweden
fresh
food sample - meat, Control and
eradication programmes
batch
25 g
828
0
0
Slaughter batch
Batch
0
0
0
6042
341
5.64
Single
38747
830
2.14
Total Processing
plant
44789
1171
2.61
EFSA Journal 2015;13(1):3991
37
EU summary report on zoonoses, zoonotic agents and food-borne outbreaks 2013
Table 4 (cont). Salmonella in fresh broiler meat at slaughter, processing/cutting level and retail level,
2013
Sampling stage
Country
Slaughterhouse Austria
Belgium
Matrix
Description
Sample
origin
Austria
Sample
unit
Sample
weight
Tested
Positive
Percent
positive
fresh
food sample, Surveillance
single
25 g
10
0
0
carcase
Monitoring
single
1g
232
5
2.16
fresh
Monitoring
single
1g
234
32
13.68
Bulgaria
carcase
food sample - neck skin, Surveillance Bulgaria
batch
25 g
346
39
11.27
Cyprus
carcase
food sample - meat, Surveillance
single
25 g
55
10
18.18
food sample - neck skin, Surveillance
single
25 g
200
20
10
food sample - neck skin, Surveillance Unknown
single
25 g
105
4
3.81
single
25 g
625
73
11.68
Denmark
carcase, food sample - neck skin, Monitoring
Czech
chilled
Republic
carcase food sample - neck skin, Surveillance Denmark
batch
300 g
288
0
0
Estonia
carcase
food sample - neck skin, Monitoring
batch
25 g
14
0
0
Finland
carcase
batch
25 g
222
0
0
Germany
carcase
food sample - neck skin, Control and Finland
eradication programmes
food sample - neck skin, Monitoring
Germany
323
37
11.46
Hungary
carcase
food sample - neck skin, Surveillance Hungary
slaughter 25 g
batch
single
25 g
213
37
17.37
Ireland
carcase
food sample - neck skin, Surveillance Ireland
single
25 g
184
9
4.89
carcase, food sample - neck skin, Surveillance Ireland
spent
fresh
food sample - meat, Surveillance
Ireland
single
25 g
20
0
0
single
25 g
1
0
0
food sample - neck skin, Surveillance Ireland
batch
25 g
5
0
0
single
25 g
1
0
0
Czech
Republic
carcase
Estonia
Latvia
carcase
food sample - neck skin, Surveillance Latvia
single
25 g
100
0
0
Lithuania
carcase
food sample - neck skin, Surveillance Lithuania
batch
.
128
6
4.69
Poland
carcase
food sample - meat, Surveillance
single
25 g
135
0
0
food sample - neck skin, Surveillance
batch
125 g
243
117
48.15
4973
159
3.2
385
2
0.52
25 g
food sample - neck skin, Surveillance
single
200 g
25 g
6047
312
5.16
batch
25 g
104
15
14.42
batch
25 g
68
4
5.88
111
6
5.41
Romania
carcase
batch
25 g
Spain
carcase, food sample - neck skin, Surveillance
chilled
fresh,
food sample - meat, Surveillance
chilled
carcase food sample - meat, Surveillance
Unknown
single
25 g
262
28
10.69
Sweden
carcase
single
25 g
3120
0
0
Iceland
carcase
batch
25 g
food sample - neck skin, Control and
eradication programmes
food sample - neck skin, Surveillance Iceland
716
2
0.28
323
37
11.46
Batch
6502
346
5.32
Single
11929
532
4.46
Total
Slaughterhouse
Border
Cyprus
inspection
Portugal
18754
915
4.88
5
0
0
Slaughter batch
fresh,
frozen
fresh
food sample - meat
food sample - meat, Surveillance
Unknown
single
25 g
batch
25 g
Batch
Single
Total Border
inspection
Unspecified
Sweden
fresh
food sample - meat, Surveillance
single
25 g
140
29
20.71
140
29
20.71
5
0
0
145
29
20
6
0
0
Slaughter batch
0
0
0
Batch
0
0
0
Single
6
0
0
Total
Unspecified
Slaughter batch
6
0
0
323
37
11.46
Batch
13224
742
5.61
Single
52911
1544
2.92
Total (MS)
66458
2323
3.5
EFSA Journal 2015;13(1):3991
38
EU summary report on zoonoses, zoonotic agents and food-borne outbreaks 2013
Turkey meat and products thereof
In total, 6,639 samples of fresh turkey meat were tested and, overall, 5.4 % were Salmonella-positive (5.1 %
of single samples and 6.7 % of batches) (Table SALMTURKMEAT). Most of the samples were taken at the
slaughterhouse and processing plant (92.8 %) level and only a small proportion of samples were taken at
retail (6.6 %). The majority of the tested units were from Poland, which reported in total, as a result of five
investigations, 65.5 % of all units tested in the EU MS.
Of the 2,100 tested units of RTE products from turkey meat, only one single sample in each of two
investigations at retail and one single sample in an investigation at an unspecified sampling stage were
found to be Salmonella-positive (0.1 % in total) (Table SALMRTETURK).
Eggs and egg products
According to EU legislation, from 1 January 2009, eggs shall not be used for direct human consumption as
table eggs unless they originate from a commercial flock of laying hens subject to a national Salmonella
22
control programme (Regulation (EC) No 1237/2007 ).
In total, 0.1 % of the 23,441 tested table egg units were found to be Salmonella-positive (0.03 % of single
samples and 0.5 % of batches) (Table SALMEGGS). Most of the tested units were tested in Germany
(80.9 %), and Germany conducted some very large investigations including testing of table eggs, shells,
whites and yolks at retail, at the processing plants and at an unspecified sampling stage. The occurrence of
Salmonella in the German samples from table eggs was in all cases very low (< 1 %).
It should be noted that what constituted a batch or single sample varied considerably in terms of weight
(25-600 g) and content among the MS. This may have an impact on the results from the investigations and
should be kept in mind when comparing the results.
Pig meat and products thereof
Most of the national monitoring programmes for Salmonella in pig meat and products thereof are based on
sampling at the slaughterhouse by swabbing an area of the carcase and/or at the processing or cutting
plants where meat samples or environmental samples are usually collected.
Within the EU, a total of 78,624 units of fresh pig meat were tested, of which 0.7 % tested Salmonellapositive (Table SALMPIGMEAT). Most of the samples were tested at the slaughterhouse level (81.2 %) and
were mainly reported by five MS, accounting for 90.1 % of samples tested at this stage. Of the total number
of samples tested, 49.0 % were from Poland, and Poland reported data from some very large investigations
at the slaughterhouse and processing plant stages.
In 2013, 0.8 % of the 27,662 tested samples of RTE minced meat, meat preparations and meat products
from pig meat tested positive for Salmonella (Table SALMRTEPIG). Most of these samples were tested at
the processing plant (85.4 %) level, where investigations conducted in Poland included the majority of the
tested units (76.8 % of RTE foods of pig meat origin tested at processing). Six MS tested 1,161 samples of
fermented sausages at the retail level, and three of them reported 11 positive samples; of these, two were
S. Typhimurium-positive and one was positive for the monophasic variant of S. Typhimurium.
Bovine meat and products thereof
Data from the testing of fresh bovine meat mainly originates from surveillance programmes, where samples
are collected at slaughterhouses (carcase swabs or meat samples) and/or at processing plants, at retail or
during border inspections (meat samples).
The overall proportion of positive samples among the 40,268 samples of fresh bovine meat tested in MS was
0.3 % (Table SALMBOVINEMEAT). Most of the samples were tested at the slaughterhouse (63.2 %), where
very large investigations on carcases were reported by five MS, accounting for 92.7 % of samples tested at
this stage.
None of the 1,480 units of RTE minced meat, meat preparations and meat products from bovine meat tested
in the MS was found to be Salmonella-positive (Table SALMRTEBOVINE).
Salmonella in other foodstuffs
Of the 5,915 samples of vegetables tested, 0.1 % were Salmonella-positive (Table SALMVEGET). Several
investigations included imported vegetables, generally specified as originating from other EU countries or
22
Commission Regulation (EC) No 1237/2007 of 23 October 2007 amending Regulation (EC) No 2160/2003 of the European
Parliament and of the Council and Decision 2006/696/EC as regards the placing on the market of eggs from Salmonella infected
flocks of laying hens. OJ L 280, 24.10.2007, p 5-9.
EFSA Journal 2015;13(1):3991
39
EU summary report on zoonoses, zoonotic agents and food-borne outbreaks 2013
from non-EU states. Ireland, exceptionally, provided detailed information on the country of origin. Most units
were tested at retail (81.9 %) and positive samples were obtained by only three MS: Denmark found
Salmonella in one batch of leafy greens imported from another MS and in two batches of baby corn of nonEU origin; Ireland reported one positive single sample from an unspecified product imported from Italy; and
Italy reported two positive samples from an unspecified product of domestic origin.
In fruits, of the 1,558 tested units, Salmonella was found in only two investigations, in one of 85 single
samples of pre-cut RTE fruit tested at a processing plant in Greece, and in one single sample at an
unspecified stage in the Netherlands (0.8 % in total) (Table SALMFRUIT). Of the 427 samples reported as
‘Fruit and vegetables’, the proportion of positive samples was 0.2 % and only one sample from a pre-cut
product tested positive at retail (Table SALMFRUITVEG).
No positive samples were observed out of the 157 tested units of dried seeds (Table SALMDRIEDSEED). In
sprouted seeds, 0.8 % of the samples tested at the EU level were positive and Salmonella was detected by
three MS in four investigations (three at retail and one at an unspecified sampling stage) (Table
SALMSPRSEED).
In the 4,295 samples of spices and herbs tested for Salmonella, 0.4 % tested positive. Of the 15 positive
samples, three were of products originating outside the EU (Table SALMHERBS).
In total, 1,225 units of live bivalve molluscs were tested and, in three investigations conducted in different
countries at retail, Salmonella was found in low levels (1.8 %-6.3 %) (Table SALMBIVMOLLUSC).
In 2013, 1,620 samples of egg products were tested and 12 (0.7 %) were found to be positive (one at
processing, three at retail and eight at an unspecified sampling stage).
Animals
All MS and three non-MS reported data on Salmonella in various animal populations (Table
SALMOVERVIEWANI).
EU MS have compulsory or voluntary Salmonella control or monitoring programmes in place for a number of
farm animal species. To protect human health against Salmonella infections transmissible between animals
and humans, EU Regulation (EC) No 2160/2003 obliges MS to set up national control programmes for
Salmonella serovars in poultry and pigs, which are deemed to be of particular importance for public health.
The animal populations which are currently targeted include breeding flocks, laying hens, broilers of Gallus
gallus and breeding and fattening turkeys. The National Control Programmes are established in individual
MS to achieve EU reduction targets to decrease the Salmonella prevalence in those animal populations at
the primary production level. National control programmes have to be approved by the EC. The results of the
programmes have to be reported to the EC and EFSA as part of the annual zoonoses report.
Breeding flocks of Gallus gallus
The year 2013 was the seventh year in which MS were obliged to implement Salmonella control
programmes in breeding flocks of Gallus gallus in accordance with Regulation (EC) No 2160/2003 and
23
Regulation (EC) No 200/2010. The control programmes for breeding flocks aim to meet a reduction target
of 1 % or less of positive flocks for the following serovars: S. Enteritidis, S. Typhimurium, S. Infantis,
S. Virchow and S. Hadar, including monophasic S. Typhimurium. The target was set for all commercial-scale
adult breeding flocks, during the production period, comprising at least 250 birds. However, MS with fewer
than 100 breeding flocks would attain the target if only one adult breeding flock remained positive.
In 2013, 26 MS and three non-MS reported data within the framework of the programme. This is because
two MS (Luxembourg and Malta) do not have breeding flocks of Gallus gallus. During 2013, Salmonella was
found in 1.1 % of adult breeding flocks in the EU at some stage during the production period (Table 5),
compared with 2.0 % in 2012.
23
Commission Regulation (EC) No 200/2010 of 10 March 2010 implementing Regulation (EC) No 2160/2003 of the European
Parliament and of the Council as regards a Union target for the reduction of the prevalence of Salmonella serotypes in adult
breeding flocks of Gallus gallus. OJ L 61, 11.3.2010, p. 1–9.
EFSA Journal 2015;13(1):3991
40
EU summary report on zoonoses, zoonotic agents and food-borne outbreaks 2013
Table 5. Salmonella in breeding flocks of Gallus gallus during the production period (all types of
breeding flocks, flock-based data) in countries running control programmes in accordance with
Regulation (EC) No 2160/2003, 2013
Country
Tested
Percent
positive
Five target
(a)
serovars %
S. Enteritidis
%
S. Typhimurium
%
S. Infantis
%
S. Virchow
%
S. Hadar
%
Other than
target %
Austria
130
5.38
0.77
0.77
0
0
0
0
4.62
Belgium
551
2.18
0.36
0.36
0
0
0
0
2.36
Bulgaria
194
1.03
1.03
0
0
0.52
0
0.52
0
Croatia
118
0
0
0
0
0
0
0
0
Cyprus
36
8.33
0
0
0
0
0
0
8.33
Czech Republic
647
5.26
0.93
0.93
0
0
0
0
4.33
Denmark
165
0.61
0.61
0
0.61
0
0
0
0
Estonia
10
0
0
0
0
0
0
0
0
Finland
173
0.58
0.58
0
0.58
0
0
0
0
France
1818
0.11
0.11
0.06
0.06
0
0
0
0
Germany
705
2.13
1.56
0.28
0.28
0.99
0
0
0.57
Greece
547
2.93
0.73
0.73
0
0
0
0
2.19
Hungary
890
1.91
1.57
0.79
0.34
0.45
0
0
0.34
Ireland
163
0
0
0
0
0
0
0
0
1287
3.81
0.31
0
0.16
0.16
0
0
6.14
Latvia
26
0
0
0
0
0
0
0
0
Lithuania
68
0
0
0
0
0
0
0
0
140
0
0
0
0
0
0
0
0
1578
2.22
1.77
1.39
0.06
0.32
0
0
0.44
Portugal
508
1.77
0.2
0
0
0
0
0.2
1.57
Romania
10023
0.26
0
0
0
0
0
0
0.26
Slovakia
163
0
0
0
0
0
0
0
0
Slovenia
139
2.88
0
0
0
0
0
0
2.88
1783
1.18
0.39
0.17
0.17
0
0
0.06
0.79
155
0
0
0
0
0
0
0
0
1766
0.85
0.11
0
0.11
0
0
0
0.74
Iceland
42
2.38
0
0
0
0
0
0
2.38
Norway
158
0
0
0
0
0
0
0
0
74
0
0
0
0
0
0
0
0
23783
1.13
0.36
0.2
0.07
0.08
0
0.01
0.93
Italy
Netherlands
Poland
Spain
Sweden
United Kingdom
Switzerland
Total (MS)
Luxembourg and Malta do not have breeding flocks of Gallus gallus. Target is set up at 1 % for all countries.
(a): S. Enteritidis, S. Typhimurium including monophasic S. Typhimurium, S. Infantis, S. Virchow, S. Hadar.
The prevalence of the five targeted Salmonella serovars (S. Enteritidis, S. Typhimurium, S. Infantis,
S. Virchow and S. Hadar) was 0.36 % in 2013 (Table 5), continuing the decreasing trend in the last seven
year period from 1.4 % in 2007 to 0.4 % in 2012 (Figure SALMTRENDBREED). A total of 11 MS and three
non-MS reported no positive flocks for the target serovars.
In total, 22 MS and three non-MS met the target of 1 % set for 2013. The MS that did not meet the target
were Poland, Hungary, Germany and Bulgaria, with the highest flock prevalence of 1.77 % reported by
Poland (Figures SALMTARGETBREED and SALMMAPBREED).
The most commonly reported target serovar in breeding flocks of Gallus gallus in 2013 was S. Enteritidis
(0.2 %), reported by nine MS, followed by S. Infantis (0.08 %) and S. Typhimurium (0.07 %) (Table 5).
Monophasic S. Typhimurium, which is counted as a target serovar, was reported in five breeding flocks of
Gallus gallus in 2013: in France (one flock) and in Italy and Spain (two flocks each).
Laying hen flocks
24
The EU target for laying hens is defined in Regulation (EC) No 517/2011 as an annual minimum
percentage of reduction in the number of adult laying hen flocks (i.e. in the production period) remaining
positive for S. Enteritidis and/or S. Typhimurium by the end of the previous year. The annual targets are
proportionate, depending on the prevalence in the preceding year, but the ultimate EU target is defined as a
maximum percentage of adult flocks remaining positive at 2 %. Any reporting of monophasic S. Typhimurium
24
Commission Regulation (EU) No 517/2011 of 25 May 2011 implementing Regulation (EC) No 2160/2003 of the European
Parliament and of the Council as regards a Union target for the reduction of the prevalence of certain Salmonella serotypes in laying
hens of Gallus gallus and amending Regulation (EC) No 2160/2003 and Commission Regulation (EU) No 200/2010. OJ L 138,
26.5.2011, p. 45–51.
EFSA Journal 2015;13(1):3991
41
EU summary report on zoonoses, zoonotic agents and food-borne outbreaks 2013
is included within the S. Typhimurium total and as such is counted as a target serovar. However, MS with
fewer than 50 flocks of adult laying hens would attain the target if only one adult flock remained positive.
In 2013, all MS had control programmes approved by the EC. In total, 28 MS and three non-MS reported
data within the framework of the laying hen flock programme for 2013. Overall, the EU level prevalence of
adult laying hen flocks positive with Salmonella spp. was 2.6 % (Table 6), compared with 3.2 % in 2012.
The reported EU level prevalence of adult laying hen flocks positive with S. Enteritidis and/or S. Typhimurium
decreased further to 1 % from 1.3 % in 2012, following the decreasing trend observed since 2008 (Figure
SALMTRENDLAY). Five MS and two non-MS reported no flocks positive with S. Enteritidis and/or
S. Typhimurium (Table 6).
Overall, 27 MS and three non-MS met their 2013 reduction targets. Estonia and Latvia met the target even
with a proportion of positive flocks higher than 2 % (their target), as they tested fewer than 50 flocks of adult
laying hens and reported only one positive flock. Croatia did not reach the absolute target (2 %), but the
achievement of the relative reduction target for 2013 cannot be evaluated, as 2013 was the first year of
reporting for this MS (Figures SALMTARGETLAY and SALMMAPLAY).
The most common of the target serovars in laying hen flocks was S. Enteritidis (0.8 % compared with 0.2 %
S. Typhimurium). Monophasic S. Typhimurium was detected in France, the Netherlands, Poland and the
United Kingdom (one flock each), and in Italy and Spain (two flocks each).
Table 6. Salmonella in laying hen flocks of Gallus gallus during the production period (flock-based
data) in countries running control programmes, 2013
Country
Austria
Tested Percent positive
S. Enteritidis
S. Enteritidis % S. Typhimurium % Other than SET %
(a)
S. Typhimurium %
2731
2.12
0.84
0.51
0.33
1.54
Belgium
606
5.94
1.82
1.65
0.17
4.62
Bulgaria
455
1.32
0
0
0
1.32
Croatia
322
2.8
2.8
2.8
0
0
Cyprus
40
87.5
7.5
7.5
0
80
Czech Republic
471
2.55
1.49
1.49
0
1.06
Denmark
373
1.07
1.07
0.27
0.8
0
33
3.03
3.03
0
3.03
0
0
Estonia
Finland
844
0
0
0
0
France
4974
0.6
0.6
0.34
0.26
0
Germany
5338
2
1.18
0.75
0.43
0.82
Greece
Hungary
Ireland
432
6.71
1.16
1.16
0
6.02
1055
6.45
1.99
1.8
0.19
4.45
208
0
0
0
0
0
2277
2.55
1.27
1.01
0.26
8.83
Latvia
44
2.27
2.27
2.27
0
0
Lithuania
97
0
0
0
0
0
7
0
0
0
0
0
85
49.41
1.18
1.18
0
48.24
Netherlands
3457
0.72
0.72
0.55
0.17
0
Poland
2413
3.98
2.4
2.2
0.21
1.57
Italy
Luxembourg
Malta
Portugal
383
6.27
1.57
1.57
0
5.22
Romania
4596
2.44
0.81
0.81
0
1.63
Slovakia
396
1.26
0.25
0.25
0
1.01
Slovenia
182
3.85
1.1
1.1
0
2.75
2135
8.76
1.87
1.55
0.33
6.89
Spain
Sweden
636
1.1
1.1
0
1.1
0
4012
0.92
0.07
0.05
0.02
0.85
Iceland
30
0
0
0
0
0
Norway
747
0
0
0
0
0
Switzerland
901
0.22
0.22
0.11
0.11
0
38602
2.58
1
0.78
0.22
2.06
United Kingdom
Total (MS)
Target (production period) is calculated from the prevalence reported in 2012. Target is set up at 2.0 % for most of the countries, with
the exception of the following: Cyprus (11.0 %), Malta (5.5 %), Luxembourg (3.2 %) and Poland (2.6 %). Croatia did not have the
relative reduction target for 2013, as 2013 was the first year of reporting for this MS.
(a): S. Typhimurium includes monophasic S. Typhimurium.
EFSA Journal 2015;13(1):3991
42
EU summary report on zoonoses, zoonotic agents and food-borne outbreaks 2013
Broiler flocks
25
The EU target for broiler flocks is defined in Regulation (EC) No 200/2012 as a maximum percentage of
broiler flocks remaining positive for the target serovars S. Enteritidis and/or S. Typhimurium (including
monophasic S. Typhimurium) of 1 % or less. Positive flocks have to be counted and reported once only
(flock level prevalence), irrespective of the number of sampling and testing operations.
In 2013, all MS had control programmes approved by the EC. Twenty-seven MS and three non-MS reported
data on broiler flocks before slaughter. France reported the number of tested flocks (60,367), but the number
of positive flocks is not available. In 2013, the EU level prevalence of broiler flocks positive with Salmonella
spp. was 3.7 % (Table 6), compared with 3.1 % in 2012.
The reported prevalence of S. Enteritidis and S. Typhimurium in the EU was 0.2 %, slightly lower than in
2012 (0.3 %), continuing the decreasing trend observed since 2009 (0.7 %) (Figure SALMTRENDBROIBS).
Eight MS and three non-MS reported no flocks positive with S. Enteritidis and/or S. Typhimurium (Table 7).
In 2013, 26 MS and three non-MS met the target of 1 % or less of broiler flocks positive for S. Enteritidis
and/or S. Typhimurium. The MS that did not achieve the 2013 Salmonella reduction target was the Czech
Republic (Figures SALMTARGETBROIBS and SALMMAPBROIBS).
The most common target serovar in broiler flocks was S. Enteritidis (0.12 % compared with 0.06 %
S. Typhimurium). Monophasic S. Typhimurium was detected in 13 broiler flocks in 2013: in the Czech
Republic, Italy, Malta and the Netherlands (one flock each), Portugal and Spain (two flocks each) and the
United Kingdom (five flocks).
Table 7. Salmonella in broiler flocks of Gallus gallus before slaughter (flock-based data) in countries
running control programmes, 2013
Austria
3581
S. Enteritidis
S. Enteritidis % S. Typhimurium % Other than SET %
(b)
S. Typhimurium %
2.99
0.47
0.06
0.42
2.6
Belgium
8664
2.09
0.15
0.08
0.07
2.08
Bulgaria
2373
0.42
0
0
0
0.42
Croatia
3053
0.29
0.29
0.16
0.13
0
Cyprus
978
1.23
0
0
0
1.23
Czech Republic
4671
5.03
3.15
3.08
0.06
1.88
Denmark
3498
0.97
0.37
0
0.37
0.63
Estonia
571
0
0
0
0
0
Finland
3439
0.03
0
0
0
0.03
Country(a)
Germany
Tested Percent positive
22216
1.53
0.03
0
0.03
1.5
Greece
6252
0.21
0.02
0.02
0
0.19
Hungary
7873
16.18
0.09
0.04
0.05
16.09
21
9.52
0
0
0
9.52
22267
10.23
<0.01
0
<0.01
10.37
Latvia
598
0
0
0
0
0
Lithuania
186
0
0
0
0
0
8
0
0
0
0
0
519
15.22
0.58
0.19
0.39
14.64
Netherlands
15929
4.83
0.21
0.05
0.16
4.61
Poland
28941
0.29
0.19
0.18
<0.01
0.1
Portugal
11130
0.38
0.1
0.05
0.04
0.28
Romania
7784
13.96
0.62
0.45
0.17
13.35
Slovakia
2282
2.1
0.18
0.09
0.09
1.93
Slovenia
2218
2.25
0.14
0.09
0.05
2.12
34003
3.29
0.07
<0.01
0.06
3.22
3276
0.03
0.03
0
0.03
0
37721
2.25
0.05
0
0.05
2.2
Ireland
Italy
Luxembourg
Malta
Spain
Sw eden
United Kingdom
Iceland
640
2.34
0
0
0
2.34
Norw ay
5217
0.04
0
0
0
0.04
629
0.95
0
0
0
0.95
234052
3.68
0.18
0.12
0.06
3.53
Sw itzerland
Total (MS)
Target is set up at 1 % for all countries.
(a): French 2013 data for broiler flocks are not included, as the number of positive flocks out of the tested flocks (60,367) is not known.
(b): S. Typhimurium includes monophasic S. Typhimurium.
25
Commission Regulation (EC) No 200/2012 of 8 March 2012 concerning a Union target for the reduction of Salmonella enteritidis
and Salmonella typhimurium in flocks of broilers, as provided for in Regulation (EC) No 2160/2003 of the European Parliament and
of the Council. OJ L 71, 9.3.2012, p. 31–36.
EFSA Journal 2015;13(1):3991
43
EU summary report on zoonoses, zoonotic agents and food-borne outbreaks 2013
Breeding and fattening turkeys
In 2012, a final annual Salmonella reduction target for turkey flocks came into force. This target was an
extension of the transitional target implemented in the period of 2010–2012. The EU definitive target for
26
turkey flocks is defined in Regulation (EU) No 1190/2012 as a maximum percentage of breeding and
fattening turkey flocks remaining positive for the target serovars S. Enteritidis and/or S. Typhimurium
(including monophasic S. Typhimurium) of 1 % or less. Positive flocks have to be counted and reported once
only (flock level prevalence), irrespective of the number of sampling and testing operations. For MS with
fewer than 100 flocks of adult breeding or fattening turkeys, the EU target is that no more than one flock of
adult breeding or fattening turkeys may remain positive. All results are presented at flock level.
For breeding turkeys, 14 MS and two non-MS reported data from Salmonella testing in adult flocks in 2013
(Table 8), as in 2012. Data show that 93.1 % of the 1,567 turkey breeding flocks at the EU level were
reported by France, Germany, Hungary, Italy and the United Kingdom, whereas few flocks were reported by
the other countries. The overall EU prevalence of Salmonella was 4.9 % (Table 8), which was higher than in
2012 (4.6 %).
Overall, the EU level prevalence for the target serovars was 0.3 %, which is slightly lower than in 2012
(0.5 %) but still higher than the prevalence observed in 2011 (0.2 %) (Figure SALMTRENDBREEDTURK).
Only two MS (France and Germany) reported flocks positive for the target serovars.
In total, all 14 reporting MS and two non-MS met the target prevalence of S. Enteritidis and/or
S. Typhimurium set for adult turkey breeding flocks in 2013, which is one MS more than in 2012. Germany
met the target even though the proportion of positive flocks was higher than 1 %, as it tested fewer than
100 flocks of adult breeding flocks of turkeys and reported only one positive flock (Figures
SALMTARGETBREEDTURK and SALMMAPBREEDTURK).
The most common of the target serovars in breeding turkey flocks was S. Typhimurium (0.26 % compared
with 0.06 % S. Enteritidis). Monophasic S. Typhimurium was detected in only one flock in France.
Table 8. Salmonella in breeding flocks of turkeys (adults, flock-based data) in countries running
control programmes, 2013
Country
Tested Percent positive
S. Enteritidis
S. Enteritidis % S. Typhimurium % Other than SET %
(a)
S. Typhimurium %
Bulgaria
4
0
0
0
0
0
Croatia
8
0
0
0
0
0
Czech Republic
9
0
0
0
0
0
Finland
8
0
0
0
0
0
France
707
0.57
0.57
0.14
0.42
0
79
2.53
1.27
0
1.27
1.27
Germany
Greece
Hungary
Ireland
Italy
3
33.33
0
0
0
33.33
212
24.06
0
0
0
24.06
3
0
0
0
0
0
235
3.83
0
0
0
3.83
Slovakia
33
0
0
0
0
0
Spain
36
19.44
0
0
0
19.44
Sweden
4
0
0
0
0
0
226
1.33
0
0
0
1.33
Iceland
4
0
0
0
0
0
Norway
15
0
0
0
0
0
1567
4.91
0.32
0.06
0.26
4.59
United Kingdom
Total (MS)
Target is set up at 1 % for all countries.
(a): S. Typhimurium includes monophasic S. Typhimurium.
For fattening turkeys, in total, 23 MS and three non-MS provided data from flocks before slaughter. France
reported the number of tested flocks (10,653), but the number of positive flocks is not available. In 2013, the
EU level prevalence of turkey fattening flocks positive with Salmonella spp. was 11.1 % (Table 9), which is a
decrease compared with 2012, when a prevalence of 14.5 % was reported.
26
Commission Regulation (EU) No 1190/2012 of 12 December 2012 concerning a Union target for the reduction of Salmonella
Enteritidis and Salmonella Typhimurium in flocks of turkeys, as provided for in Regulation (EC) No 2160/2003 of the European
Parliament and of the Council. OJ L 340, 13.12.2012, p. 29–34.
EFSA Journal 2015;13(1):3991
44
EU summary report on zoonoses, zoonotic agents and food-borne outbreaks 2013
The overall prevalence at the EU level for the target serovars was 0.2 % (Table 9), lower than in 2012
(0.4 %), continuing the decreasing trend observed since 2011 (0.5 %) (Figure SALMTRENDFATTURKBS).
Ten MS and three non-MS reported no flocks positive with S. Enteritidis and/or S. Typhimurium.
In 2013, 21 MS and three non-MS met their 2013 reduction targets set for fattening turkeys. Slovakia met the
target even though the proportion of positive flocks was higher than 1 %, as it tested fewer than 100 adult
breeding flocks of turkeys and reported only one positive flock. Two MS (Croatia and the Czech Republic)
did not achieve the 2013 Salmonella reduction target (Figures SALMTARGETFATTURKBS and
SALMMAPFATTURKBS).
The most common of the target serovars in fattening turkey flocks was S. Typhimurium (0.11 % compared
with 0.06 % S. Enteritidis). Monophasic S. Typhimurium was detected only in Italy (three flocks) and Portugal
(two flocks).
Table 9. Salmonella in fattening flocks of turkeys before slaughter (flock-based data) in countries
running control programmes, 2013
Country
(a)
Tested Percent positive
S. Enteritidis
S. Enteritidis % S. Typhimurium % Other than SET %
(b)
S. Typhimurium %
Austria
356
10.11
0.28
0
0.28
9.83
Belgium
191
1.57
0.52
0
0.52
1.05
Bulgaria
3
0
0
0
0
0
Croatia
202
1.49
1.49
0
1.49
0
Cyprus
7
28.57
0
0
0
28.57
267
10.49
1.12
1.12
0
9.36
56
3.57
0
0
0
3.57
324
0.62
0.62
0
0.62
0
3879
0.54
0.08
0.03
0.05
0.46
Czech Republic
Denmark
Finland
Germany
Greece
Hungary
Ireland
Italy
Lithuania
Netherlands
Poland
52
0
0
0
0
0
2456
35.67
0.04
0.04
0
35.63
18
16.67
0
0
0
16.67
4747
23.76
0.06
0
0.06
32.72
25
0
0
0
0
0
273
0.37
0
0
0
0.37
4852
2.58
0.27
0.16
0.1
2.31
Portugal
813
0.98
0.49
0
0.49
0.49
Romania
154
1.95
0
0
0
2.6
Slovakia
15
20
6.67
6.67
0
13.33
137
2.92
0
0
0
2.92
2898
9.32
0.17
0.03
0.14
9.14
Slovenia
Spain
Sweden
193
0
0
0
0
0
2954
8.67
0.07
0
0.07
8.6
Iceland
29
6.9
0
0
0
6.9
Norway
223
0
0
0
0
0
41
2.44
0
0
0
2.44
24872
11.15
0.17
0.06
0.11
12.71
United Kingdom
Switzerland
Total (MS)
Target is set up at 1 % for all countries.
(a): French 2013 data for turkey fattening flocks are not included, as the number of positive flocks out of the tested flocks (10,653) is not
known.
(b): S. Typhimurium includes monophasic S. Typhimurium.
Ducks and geese
In 2013, the overall EU prevalence in flocks of ducks and geese was 8.4 % for Salmonella spp. and 4.9 % for
S. Enteritidis and S. Typhimurium (Table SALMDUCKGEESE). Owing to differences in types of flocks
sampled (breeding or meat production flocks), sampling strategy and sample type, prevalence is not
comparable across MS.
Pigs
The overall EU Salmonella prevalence from the bacteriological monitoring of pigs was 8.1 %, which is higher
than in 2012 (6.3 %). At the herd and slaughter batch levels, the Salmonella prevalence was 14.9 % and
30.0 %, respectively; it was lower at the individual animal level (7.4 %) (Table SALMPIGSBACT).
Investigations were reported from breeding and fattening pigs and unspecified animal categories, and from
different sampling stages: at the farm, slaughterhouse or unspecified sampling stage. Sample types reported
EFSA Journal 2015;13(1):3991
45
EU summary report on zoonoses, zoonotic agents and food-borne outbreaks 2013
were faeces, lymph nodes, organ or tissue samples, carcase swabs or nasal swabs, or sample types were
unspecified.
In the United Kingdom a study to estimate the prevalence of Salmonella in pigs was carried out in 2013. The
study design was consistent, where possible, with the technical specifications for the EU baseline survey for
27
Salmonella in slaughter pigs (Commission Decision 2006/668/EC ). The study was carried out at the
14 largest abattoirs of the 169 approved premises in the United Kingdom, who process 80 % of pigs
slaughtered in the United Kingdom.
Overall, 619 caecal samples and 624 carcase swabs were tested for the presence of Salmonella. After
accounting for within-farm clustering, the prevalence of Salmonella in the caecal samples was 30.5 % (95 %
confidence interval (CI) 26.5-34.6) and the prevalence in the carcase swab samples was 9.6 % (95 % CI
7.3-11.9). The proportion of positive ceacal samples was expected to represent the level of infection in the
pigs, and it varied from 11.3 % to 46.8 % in the abattoirs, whereas carcase contamination ranged from 0 %
to 21 %. For all but two abattoirs the prevalence of caecal carriage was higher than the carcase
contamination. However, it should be noted that some of the prevalence data are based on small sample
sizes and the method of comparison is crude, but the variation in the levels of Salmonella carcase
contamination between abattoirs suggests potential differences in how processing, in particular
decontamination by scalding and singeing, as well as general hygiene, is applied.
An age specific difference was also observed as the proportion of Salmonella caecal samples was 25.9 % in
pigs aged less than 6 months up to 40.7 % in pigs aged over 12 months. The overall contamination rate of
carcases in UK pigs was significantly higher in 2007 compared with this study (15.1 % versus 9.6 %).
Source: The United Kingdom National Zoonoses Report, 2013
Cattle
The overall proportion of Salmonella-positive samples from the bacteriological monitoring of cattle was
3.7 %, which is higher than in 2012 (2.4 %). The Salmonella prevalence was similar at the herd, slaughter
batch and animal levels, ranging from 2.7 % to 3.7 %. Higher prevalence was observed in one investigation
carried out in Italy in 17 holdings (41.2 %) (Table SALMCATBACT).
Investigations were reported from breeding animals, dairy cows or calves, or were unspecified, and were
from farms or slaughterhouses. Tested sample types were faeces, lymph nodes, organ or tissue samples or
carcase swabs, or sample types were unspecified.
Other animal species
Salmonella was also investigated in other animal species and detected in cats, dogs, sheep, goats, domestic
solipeds, birds, parrots, pigeons, reptiles, snakes, hedgehogs, badgers, minks and other wild animals.
Feedingstuffs
Data on Salmonella in feedingstuffs collected by MS are generated from various targeted surveillance
programmes as well as from unbiased reporting of random sampling of domestic and imported feedingstuffs.
The presentation of single sample and batch-based data from the different monitoring systems has therefore
been summarised and includes both domestic and imported feedingstuffs.
The overall level of Salmonella contamination in animal- and vegetable-derived feed material in 2013, was
low, with 1.4 % of positive samples of 15,315 samples tested (Table SALMDERIVEDFEED). The highest
proportion of positive samples in individual investigations was reported for the feed category ‘Feed material
of oil seed or fruit origin’, mainly rape seed-derived, soya (bean)-derived, sunflower seed-derived and cotton
seed-derived feed. But moderate to high contamination was also detected in ‘Feed material of marine animal
origin (fish meal)’ and ‘Feed material of land animal origin (meat meal)’. In meat and bone meal, Salmonella
contamination is to be considered only an indicator, and it does not pose any risk to food-producing animals
because meat and bone meal is still prohibited for feeding food-producing animals, although it is used in pet
foods.
In compound feedingstuffs (the finished feed for animals), the overall EU proportion of Salmonella-positive
findings in 2013 was low for all animal populations: 1.8 % of 1,091 tested samples for cattle, 1.6 % of
1,590 tested samples for pigs and 1.9 % of 2,551 tested samples for poultry (Tables
SALMCOMPFEEDCATTLE, SALMCOMPFEEDPIGS and SALMCOMPFEEDPOULTRY). The proportion of
27
Commission Decision 2006/668/EC of 29 September 2006 concerning a financial contribution from the Community towards a
baseline survey on the prevalence of Salmonella in slaughter pigs to be carried out in the Member States. OJ L 275, 6.10.2006,
p. 51–61.
EFSA Journal 2015;13(1):3991
46
EU summary report on zoonoses, zoonotic agents and food-borne outbreaks 2013
positive samples ranged among the reporting MS from 0 % to about 10 %, with only a few exceptions. It
should be highlighted that the reported proportions of positive samples might not always be representative of
feedingstuffs on the national markets, as some reports might reflect intensive sampling of high-risk products,
and representative sampling of feedingstuff is difficult.
Serovars
Data on the 10 most commonly reported Salmonella serovars per major animal population or food/feed
category are presented in Table 10. A total of 20,870 isolates were reported and 55.8 % were from Gallus
gallus, meat thereof and feed for Gallus gallus.
The amount of serovar information available and the within country serovar distributions varied considerably
between the reporting MS and non-MS. When comparing results in a stable-to-table perspective, it should be
kept in mind that all MS and non-MS did not report for all sources. In the following, the percentages of
serovars are calculated on the total number of isolates serotyped per each animal population, food/feed
category. Serovars reported as 1,4,5,12:i:-, monophasic, 4,5,12:i:-, 4,12:i:- and Typhimurium monophasic will
be referred to as monophasic variants of S. Typhimurium.
For Gallus gallus, S. Infantis was the most frequently reported serovar in isolates from Gallus gallus
(included breeding flocks, broilers and laying hens) (22.7 %) and in isolates from broilers (26.0 %). In broiler
meat 37.4 % of the isolates was reported as S. Infantis and 37.6 % was reported as S. Enteritidis.
S. Senftenberg was the serovar most often reported from feed for Gallus gallus (19.5 %), followed by
S. Typhimurium (17.1 %).
In turkeys, S. Saintpaul was the most frequently reported serovar (30.9 %), followed by S. Newport (16.2 %),
S. Blockley (16.1 %) and S. Derby (13.6 %). Italy reported 65 % of all findings in turkeys. In turkey meat,
there was a tendency for one MS to report majority of isolates within a serovar, e.g. for the three most
commonly reported serovars, Romania reported 37 of 38 S. Derby isolates, Poland reported 33 of
34 S. Typhimurium isolates and Hungary reported 22 of 28 S. Stanley isolates.
As in previous years, S. Typhimurium was the most frequently reported serovar in pigs (47.8 %) and pig
meat (30.7 %) followed by S. Derby (14.8 % and 27.1 %, respectively) and monophasic variants of
S. Typhimurium. Germany reported 52.0 % of all isolates from pigs. S. Senftenberg was the serovar most
often reported from pig feed, with four of the 18 isolates serotyped from this source (22.2 %), followed by
S. Typhimurium (16.7 %).
In cattle, S. Typhimurium was the most common serovar (38.6 %), followed by S. Dublin (29.4 %), and no
other serovars accounted for more than 10 % of the isolates. Also in bovine meat, S. Typhimurium was the
most frequently reported serovar (20.7 %) followed by S. Enteritidis (20.7 %) and S. Derby (19.5 %).
Compared to the number of isolates from bovine meat (N=87), serovar information was available for a much
larger number of isolates from cattle (N=4,859), which might partly explain why S. Dublin was only reported
in 9.2 % of the isolates from bovine meat, as two MS, where S. Dublin was dominant in cattle, did not report
on bovine meat (the United Kingdom) or only had a few isolates to report from this source (Ireland).
S. Infantis was the serovar most often reported from feed for cattle (54.6 %) out of the 22 isolates serotyped.
Detailed data on the 10 most common Salmonella serovars in specific food/feed categories and animal
populations are shown in tables referenced in the Appendix.
EFSA Journal 2015;13(1):3991
47
EU summary report on zoonoses, zoonotic agents and food-borne outbreaks 2013
Table 10. Top 10 most commonly reported Salmonella serovars per animal population or food/feed category in EU MS, 2013
Animal
population,
food/feed
category
Gallus gallus (c)
Broilers
Broiler meat
Feed for Gallus
gallus
Turkeys
Turkey meat
Pigs
Pig meat
Feed for pigs
Cattle
Bovine meat
Feed for cattle
Number of
isolates
Number of
isolates
serotyped
9971
8622
3436
47
2852
495
35850
1397
32
5931
181
21
5660
4613
1329
41
1195
206
2145
706
18
4859
87
11
Top 10 serovars per animal population, food/feed category(a)(b)
1
Infantis
2
Mbandaka
3
Enteritidis
4
Thompson
5
Livingstone
6
Typhimurium
7
Kentucky
8
9
Agona
Kedougou
2.7%
22.7%
14.8%
11.1%
10.6%
4.0%
3.9%
2.8%
2.7%
Infantis
Mbandaka
Thompson
Enteritidis
Livingstone
Montevideo
Kedougou
Typhimurium Agona
10
Montevideo
2.7%
1,3,23:i
26.0%
17.3%
12.6%
5.9%
4.4%
3.2%
3.2%
2.8%
2.8%
2.6%
Enteritidis
Infantis
Kentucky
1,4,5,12:i:-
Typhimurium
Paratyphi B
Indiana
Virchow
Ohio
Heidelberg
37.6%
37.4%
4.1%
3.5%
2.6%
2.6%
1.5%
1.3%
1,4,5,12:i:-
Montevideo Anatum
Senftenberg Typhimurium Djugu
Oranienburg Nyborg
1.3%
1.1%
Hadar
Lille
19.5%
17.1%
12.2%
9.8%
9.8%
7.3%
7.3%
4.9%
4.9%
2.4%
Saintpaul
Newport
Blockley
Derby
Hadar
Infantis
Kottbus
Kedougou
Typhimurium
Kentucky
16.1%
30.9%
16.2%
Derby
Typhimurium Stanley
18.5%
16.5%
Typhimurium Derby
47.8%
14.8%
13.6%
3.7%
2.3%
2.3%
2.3%
2.1%
1.7%
Kentucky
Infantis
Newport
Saintpaul
Bredeney
Enteritidis
Grampian
6.3%
6.3%
Choleraesuis (d) 4,12:i:-
3.4%
3.4%
Infantis
Group C
2.4%
Enteritidis
1.6%
13.6%
12.1%
9.7%
1,4,5,12:i:-
Group B
4,5,12:i:-
9.8%
3.7%
2.5%
2.5%
2.0%
1.9%
1.9%
Typhimurium Derby
4,5,12:i:-
1,4,5,12:i:-
Infantis
4,12:i:-
Rissen
Enteritidis
Brandenburg Monophasic Typhimurium
30.7%
6.1%
3.5%
3.4%
2.4%
5.5%
3.5%
Senftenberg Typhimurium Hadar
27.1%
Enteritidis
Enterica, enterica Havana
22.2%
11.1%
Agona
5.6%
5.6%
5.6%
5.6%
5.6%
5.6%
Give
Goldcoast
Infantis
Group D
Group C
Enteritidis
16.7%
Typhimurium Dublin
38.6%
29.4%
Typhimurium Enteritidis
20.7%
11.1%
Group B
Tennessee Montevideo
2.1%
1.1%
Derby
Cerro
8.2%
5.6%
3.3%
3.0%
1.3%
1.2%
Dublin
Altona
4,5,12:i:-
2.3%
Newport
1.5%
Derby
Infantis
Montevideo
1,4,5,12:i:-
19.5%
9.2%
4.6%
2.3%
2.3%
2.3%
20.7%
Livingstone
4.6%
4.6%
Infantis
Typhimurium Loenga
Anatum
Mbandaka
54.6%
9.1%
9.1%
9.1%
9.1%
9.1%
(a): The percentages are calculated on the total number of isolates serotyped per each animal population, food/feed category.
(b): The monophasic variants of S. Typhimurium are not included in S. Typhimurium, but are reported separately.
(c): The animal category Gallus gallus includes breeding flocks, broilers and laying hens.
(d): Variant Kunzendorf.
EFSA Journal 2015;13(1):3991
48
EU summary report on zoonoses, zoonotic agents and food-borne outbreaks 2013
3.1.3.
Salmonella food-borne outbreaks
In 2013, 22 MS reported a total of 1,168 food-borne outbreaks of human salmonellosis (including one waterborne outbreak), which constituted 22.5 % of the total number of reported outbreaks of food-borne illness in
the EU (Table 11). This represents a decrease of 23.8 % from 2012 to 2013.
The annual total number of Salmonella outbreaks within the EU has decreased markedly during recent
years. From 2008 to 2013, the total number of Salmonella outbreaks decreased by 38.1 %, from 1,888 to
1,168 outbreaks. This reduction parallels the general decline in notified human salmonellosis cases
observed within the EU over the same period.
Detailed information on the distribution of the food-borne outbreaks (excluding water-borne outbreaks) of
human salmonellosis in the different EU MS and non-MS, the number of cases, hospitalisations and deaths,
are summarised in Table 11.
Table 11. Strong- and weak-evidence food-borne outbreaks caused by Salmonella (excluding strongevidence water-borne outbreaks), 2013
Country
Strong-evidence outbreaks
N
Weak-evidence outbreaks
Cases Hospitalized Deaths
N
Cases Hospitalized Deaths
Total outbreaks Reporting rate per 100,000
Austria
7
17
4
0
37
118
38
0
44
Belgium
1
3
2
0
10
35
15
0
11
0.52
0.1
Croatia
2
22
13
0
29
204
26
0
31
0.73
Czech Republic
0
0
0
0
15
245
48
0
15
0.14
Denmark
4
185
1
0
4
31
0
0
8
0.14
Estonia
1
28
2
0
8
19
8
0
9
0.68
Finland
1
9
1
0
1
4
0
0
2
0.04
1
28
351
30
0
96
0.15
2 146
628
159
0
158
0.2
0
10
0.09
France
68
475
72
Germany
12
712
273
Greece
0
0
0
Hungary
5
168
Ireland
0
0
0
10
50
21
14
0
93
386
113
0
98
0.99
0
0
4
9
3
0
4
0.09
Latvia
1
7
4
0
23
110
44
0
24
1.19
Lithuania
6
81
60
0
34
82
67
0
40
1.35
Netherlands
0
0
0
0
3
7
1
0
3
0.02
114
780
299
0
68
516
156
0
182
0.47
Romania
4
209
139
0
1
14
9
0
5
0.02
Slovakia
2
34
9
0 212
650
137
0
214
3.96
Poland
Slovenia
Spain
0
0
0
76
848
214
2
13
5
0
2
0.1
0 116
0
716
131
2
192
0.41
0.06
Sweden
1
14
0
0
5
28
1
0
6
United Kingdom
9
773
26
0
4
122
21
0
13
0.02
Iceland
0
0
0
0
1
3
0
0
1
0.31
0
1
34
0
0
2
0.04
3 853
4338
1033
2
1167
0.27
Norway
Total (MS)
1
26
0
314
4365
1133
Figure 5 shows the distribution of the most common food vehicles implicated in the strong-evidence
Salmonella outbreaks in 2013. As in previous years, eggs and egg products were the most frequently
identified food vehicles, associated with 44.9 % of these outbreaks. Most of these outbreaks were reported
by three MS (Poland, Spain and France). The next most commonly implicated single food vehicle category in
the Salmonella outbreaks was sweets and chocolates (10.5 % of strong-evidence outbreaks, mostly reported
by Poland), followed by pig meat and products thereof (8.9 % of strong-evidence outbreaks, mostly reported
by France). In 2013, only one strong-evidence Salmonella outbreak reported by Slovakia was associated
with the consumption of cheese. This differed from what was observed in 2012, when cheese was the
second most commonly implicated single food vehicle category.
In 2013, one water-borne outbreak caused by Salmonella was reported by France (data not included in
Figure 5).
EFSA Journal 2015;13(1):3991
49
EU summary report on zoonoses, zoonotic agents and food-borne outbreaks 2013
Dairy products
Crustaceans,
(other than cheese), shellfish, molluscs
1.3%
Bovine meat and
and products
products thereof,
thereof, 1.0%
1.6%
Bakery products,
5.1%
Broiler meat (Gallus
5.1 %
gallus) and products
thereof, 5.1%
5.1 %
Mixed food, 5.1%
Other or mixed
meat and products
thereof, 6.7%
Other foodstuffs,
7.3%
Buffet meals, 0.6%
Vegetables and
juices and other
products thereof,
0.6%
Fish and fish
products, 0.6%
Milk, 0.6%
5.1 %
6.7 %
44.9 %
7.3 %
Eggs and egg
products, 44.9%
8.9 %
10.5 %
Pig meat and
products thereof,
8.9%
N=314
Sweets and
chocolate, 10.5%
Data from 314 outbreaks are included: Austria (7), Belgium (1), Croatia (2), Denmark (4), Estonia (1), Finland (1), France (68), Germany
(12), Hungary (5), Latvia (1), Lithuania (6), Poland (114), Romania (4), Slovakia (2), Spain (76), Sweden (1) and United Kingdom (9).
Water-borne outbreaks excluded.
Other foodstuffs (N=23) include: canned food products (1), cheese (1), herbs and spices (1), and other foods (20).
Other or mixed meat and products thereof (N=21) include: turkey meat and products thereof (1), other or mixed red meat and products
thereof (7), other, mixed or unspecified poultry meat and product thereof (1), meat and meat products (12).
Figure 5. Distribution of food vehicles in strong-evidence outbreaks caused by Salmonella in the EU,
2013
In 2013, 207 outbreaks with strong evidence were caused by S. Enteritidis, followed by S. Typhimurium
(66.0 % and 9.6 % of the total, respectively, excluding water-borne outbreaks). As in previous years, most of
the S. Enteritidis outbreaks were attributed to the consumption of eggs and egg products (59.9 %), while
those caused by S. Typhimurium were mostly attributed to pig meat and products thereof (46.7 %). The
distribution of food vehicles in strong-evidence outbreaks caused by S. Enteritidis and S. Typhimurium in the
EU is shown in Figures FBOSALMENTVEHIC and FBOSALMTYPVEHIC.
Information on the setting was reported in all of the 314 Salmonella outbreaks, although, for 28 outbreaks, it
was indicated as ‘Others’ (23 outbreaks) or ‘Unknown’ (five outbreaks). The most frequently reported
settings were restaurant, café, pub, bar, hotel, catering service (18 outbreaks), followed by household (five
outbreaks).
3.1.4.
Discussion
Non-typhoidal salmonellosis in humans continued to decrease in 2013. Salmonellosis is nonetheless the
second most common zoonosis in humans in the EU, with 1,173 food-borne outbreaks reported in 2013
involving 8,788 affected persons. The EU case-fatality rate was 0.14 % and 59 deaths due to non-typhoidal
salmonellosis were reported in the EU in 2013.
The salmonellosis notification rates for human infections vary between the MS, reflecting differences in, for
example, disease prevalence in the domestic animal population, food and animal trade between MS, the
proportion of travel-associated cases and the quality and coverage of the surveillance system. One example
of the last of these factors is that countries reporting the lowest notification rate for salmonellosis had the
highest proportion of hospitalisation, which may indicate that the surveillance systems in these countries are
focusing on the most severe cases.
The number of human cases of S. Enteritidis continued to decrease in 2013. S. Typhimurium and its variants
also decreased in 2013. Together, these two serovars accounted for 68 % of the human cases with the
EFSA Journal 2015;13(1):3991
50
EU summary report on zoonoses, zoonotic agents and food-borne outbreaks 2013
serotype reported. Other serovars, however, increased in 2013 and were attributed to outbreaks in individual
countries in several instances. Germany, in particular, accounted for a large proportion of the increasing
numbers in some serovars, most likely reflecting the fact that the country has the largest population in the
EU/EEA and a good surveillance system for salmonellosis. Considering that Germany in 2013, as in 2012,
reported a large disease outbreak from raw fermented sausages in susceptible populations, it appears that
the German recommendation against serving raw fermented meat products in institutional catering for
vulnerable populations (Frank et al., 2014) needs to be reinforced.
The multi-country outbreak of S. Stanley which started in 2011 and peaked in 2012, affecting several MS
and linked to the turkey production chain, declined in 2013. Cases of the outbreak strain were still reported in
2014, suggesting that the strain is still circulating in the European food market (ECDC and EFSA, 2014).
This highlights the impact of any Salmonella contamination at the farm level and its potential effect on public
health in the EU.
The continuing decrease in the numbers of salmonellosis cases in humans is likely to mainly be related to
the successful Salmonella control programmes in fowl (Gallus gallus) populations that are in place in EU MS,
although other control measures along the food chain might also have contributed to the reduction. The
majority of MS met their Salmonella reduction targets for breeding flocks, laying hens and broilers of Gallus
gallus and for turkey flocks in 2013, with an increase of MS that met the targets compared with 2012. The
EU-level prevalence of the target serovars was further reduced in all poultry populations indicating that
progress is still being made in combating these Salmonella serovars. Moreover, the EU-level reported
proportion of non-compliance with the Salmonella criterion for S. Enteritidis and S. Typhimurium (established
in 2011) decreased, which is a very encouraging tendency, indicating that the continued investment of MS in
Salmonella control is yielding noticeable results. During 2008-2013, the number of reported Salmonella
outbreaks within the EU decreased markedly. The most important source of food-borne Salmonella
outbreaks in 2013 was again eggs and egg products, followed by sweets and chocolates, although largely
reported by one MS, and then pig meat and products thereof.
As in previous years, Salmonella was most frequently detected in poultry meat and less often in pig or
bovine meat. Salmonella was rarely found in table eggs or products of vegetable origin. The fact that eggs
and egg products were still the most important source of food-borne Salmonella outbreaks in 2013 might be
explained by the fact that, as mentioned in a recent EFSA BIOHAZ Panel opinion (EFSA BIOHAZ Panel,
2014), very large numbers of eggs are eaten and eggs are very important and complete foods not only for
their nutritional aspects, but also for their functional properties, i.e. the coagulant capacity of proteins, the
foaming capacity of albumen proteins, the emulsifying capacity of the yolk, etc. Moreover, these properties
are used in different ways to produce and enrich many types of foods (e.g. bakery products including
pastries, meat pies, sauces and dressings, sweets and pasta) and in several (homemade) dishes (e.g.
mayonnaise, custard and ice cream). In such products eggs are often used raw or only lightly heat-treated.
S. Enteritidis is considered the only pathogen currently posing a major risk of egg-borne diseases in the EU.
The use of eggs and egg products is very diverse and the risk derived from egg-borne hazards such as
S. Enteritidis is affected by the storage conditions of the eggs, such as temperature and time; however, the
pooling of eggs is also important in household, food service and institutional settings. On the other hand,
other foods such as broiler meat, that might also be a source of S. Enteritidis, are normally consumed
cooked, mitigating the risk of human infection.
The highest levels of non-compliance with Salmonella criteria generally occurred in foods of meat origin,
although at low levels, and, overall, non-compliance with the Salmonella food safety criteria was at a level
comparable to the previous years. However, the overall trends are highly influenced by the reporting MS and
the sample sizes in their investigations, both of which vary markedly between the years.
3.2.
Campylobacter
The Appendix contains hyperlinks to all data summarised for the production of this section, for humans, food,
animals and food-borne outbreaks. It also includes hyperlinks to Campylobacter summary tables and figures
that were not displayed in this section because they did not trigger any marked observation. The
summarised data are presented in downloadable Excel and PDF files, and listed by subject. Moreover, all
submitted and validated data by the MS are available online (http://www.efsa.europa.eu/en/efsajournal/
pub/3991.htm).
3.2.1.
Campylobacteriosis in humans
Campylobacter has been the most commonly reported gastrointestinal bacterial pathogen in humans in the
EU since 2005. The number of reported confirmed cases of human campylobacteriosis in the EU in 2013
was 214,779 (Table 12). The EU notification rate was 64.8 per 100,000 population which was at the same
51
EFSA Journal 2015;13(1):3991
EU summary report on zoonoses, zoonotic agents and food-borne outbreaks 2013
level as in 2012 (65.9). The highest country-specific notification rates were observed in the Czech Republic
(173.7 cases per 100,000), Luxembourg (125.7), Slovakia (108.0) and the United Kingdom (104.0 cases per
100,000 population). The lowest rates were reported in Latvia, Romania, Poland and Bulgaria (< 2.0 per
100,000).
In many MS, campylobacteriosis was mainly a domestically acquired infection with ≥ 95 % domestic cases
reported in, for example, Hungary, Latvia, Malta, Poland, Slovakia, the Czech Republic, Estonia and the
Netherlands. The highest proportions of travel-associated cases were reported in the Nordic countries,
including Sweden, Norway and Finland (≥ 50 % of the cases) (Table CAMPHUMIMPORT).
Table 12. Reported cases and notification rates per 100,000 of human campylobacteriosis in the
EU/EEA, 2009–2013
2013
2012
2011
2010
2009
National
Data
Confirm ed
Confirm ed
Confirm ed
Confirm ed
Confirm ed
Total Cases
Coverage (a) Form at (a)
Cases & Rates Cases & Rates Cases & Rates Cases & Rates Cases & Rates
Cases
Rate
Cases
Rate
Cases
Rate
Cases
Rate
Cases
Rate
Austria
Y
C
5726
5726
67.7
4710
56.0
5129
61.0
4404
52.6
4502
Belgium(b)
N
C
8148
8148
-
6607
-
7716
-
6047
-
5697
53.9
-
Bulgaria
Y
A
124
124
1.7
97
1.3
73
1.0
6
0.1
26
0.3
Croatia(c)
Y
A
1379
-
-
-
-
-
-
-
-
-
-
Cyprus
Y
C
56
56
6.5
68
7.9
62
7.4
55
6.7
37
4.6
Czech Republic
Y
C
18389
18267
173.7
18287
174.1
18743
178.7
21075
201.5
20259
194.3
Denmark
Y
C
3772
3772
67.3
3720
66.7
4060
73.0
4037
72.9
3353
60.8
Estonia
Y
C
385
382
28.9
268
20.2
214
16.1
197
14.8
170
12.7
Finland
Y
C
4066
4066
74.9
4251
78.7
4267
79.4
3944
73.7
4050
76.0
France(d)
N
C
5198
5198
39.6
5079
38.9
5538
42.6
4324
33.5
3956
30.7
Germany
Y
C
63636
63271
77.3
62504
76.5
70812
86.8
65110
79.8
62787
76.7
Greece(e)
-
-
-
-
-
-
-
-
-
-
-
-
-
Hungary
Y
C
7250
7247
73.5
6367
64.4
6121
62.4
7180
72.9
6579
66.6
Ireland
Y
C
2288
2288
49.8
2391
52.2
2433
53.2
1660
36.5
1810
40.0
Italy (b)
N
C
1178
1178
-
774
-
468
-
457
-
531
-
Latvia
Y
C
9
9
0.4
8
0.4
7
0.3
1
0.0
0
0.0
Lithuania
Y
C
1142
1139
38.3
917
30.5
1124
36.8
1095
34.9
812
25.5
Luxembourg
Y
C
675
675
125.7
581
110.7
704
137.5
600
119.5
523
106.0
Malta
Y
C
246
246
58.4
220
52.7
220
53.0
204
49.3
132
32.1
Netherlands (f)
N
C
4182
3702
42.4
4248
48.8
4408
50.9
4322
50.1
3782
44.1
Poland
Y
C
552
552
1.4
431
1.1
354
0.9
367
1.0
359
0.9
Portugal(e)
-
-
-
-
-
-
-
-
-
-
-
-
-
Romania
Y
C
218
218
1.1
92
0.5
149
0.7
175
0.9
254
1.3
Slovakia
Y
C
5953
5845
108.0
5704
105.5
4565
84.7
4476
83.0
3813
70.8
Slovenia
Y
C
1027
1027
49.9
983
47.8
998
48.7
1022
49.9
952
46.8
Spain(g)
N
C
7064
7064
50.4
5548
47.4
5469
46.9
6340
54.6
5106
44.2
8114
8114
84.9
7901
83.3
8214
87.2
8001
85.7
7178
77.5
113.2 65043
67.0 201711
105.5
62.8
Sw eden
Y
C
United Kingdom
EU Total
Y
-
C
-
Iceland
Y
C
101
101
31.4
60
18.8
123
38.6
55
17.3
74
Liechtenstein
-
-
-
-
-
-
-
-
-
-
-
-
-
Norw ay
Y
C
3291
3291
65.2
2933
58.8
3005
61.1
2682
55.2
2848
59.3
Sw itzerland(h)
Y
C
7481
7481
93.1
8432
106.0
7963
101.2
6611
84.9
7803
101.3
66465 66465
217242 214779
104.0 72560
64.8 214316
114.3 72150
65.9 223998
115.3 70298
69.0 215397
23.2
(a): Y, yes; N, no; A, aggregated data; C, case-based data;-, no report.
(b): Sentinel surveillance; no information on estimated coverage. Thus, notification rate cannot be estimated.
(c): All cases of unknown case classification.
(d): Sentinel surveillance; notification rates calculated based on an estimated coverage of 20 %.
(e): No surveillance system.
(f): Sentinel surveillance; notification rates calculated based on an estimated coverage of 52 %.
(g): Sentinel surveillance; notification rates calculated based on an estimated coverage of 30 % in 2013 and 25 % in 2009-2012.
(h): Switzerland provided data directly to EFSA.
There was a clear seasonal trend in confirmed campylobacteriosis cases reported in the EU/EEA in
2009-2013 with peaks in the summer months. The 12-month moving average was fairly stable over the
EFSA Journal 2015;13(1):3991
52
EU summary report on zoonoses, zoonotic agents and food-borne outbreaks 2013
5-year period with no statistically significant increasing or decreasing trend when analysed by month
(p=0.334 with linear regression) (Figure 6).
Source: Austria, Belgium, Bulgaria, Cyprus, Czech Republic, Denmark, Estonia, Finland, France, Germany, Hungary, Iceland, Ireland,
Italy, Latvia, Lithuania, Luxembourg, Malta, Netherlands, Norway, Poland, Slovakia, Slovenia, Spain, Sweden, and United
Kingdom. Croatia and Romania did not report data over the whole period at the level of detail required for the analysis.
Greece and Portugal do not have surveillance systems for this disease.
Figure 6. Trend in reported confirmed cases of human campylobacteriosis in the EU/EEA, 2009-2013
Thirteen MS provided information on hospitalisation for some or all of their cases, which is one MS more
than in 2012. However, information on hospitalisation was still available only for 12.7 % of all confirmed
campylobacteriosis cases in 2013. The reason for this is that many MS have campylobacteriosis surveillance
systems which are based on laboratory notifications where information on hospitalisation is usually not
available. Of cases with known hospitalisation status, 43.6 % were hospitalised on average. The highest
hospitalisation rates (71-99 % of cases) were reported in the United Kingdom, Cyprus, Lithuania, Poland,
Romania and Latvia. Three of these countries also reported among the lowest notification rates of
campylobacteriosis, which indicates that the surveillance systems in these countries primarily capture the
more severe cases. The United Kingdom only provided information on hospitalisation for 6.5 % of its cases
and the data may therefore be biased.
An increase from 31 deaths attributed to campylobacteriosis in 2012 to 56 deaths in 2013 was observed.
This resulted in an EU case-fatality rate of 0.05 % (information provided for 52.9 % of all reported cases)
which was the highest rate observed in the last five years (average 2009-2012: 0.03 %). The United
Kingdom accounted for 33 of these 56 fatal outcomes.
Species information was provided for 48.1 % of confirmed cases reported in the EU, Iceland and Norway. Of
these, 80.6 % were reported to be C. jejuni, 7.1 % C. coli, 0.22 % C. lari, 0.10 % C. fetus and 0.08 %
C. upsaliensis. ‘Other’ Campylobacter species accounted for 11.9 % but the large majority of those cases
were reported at the national level as ‘C. jejuni/C. coli not differentiated’. For the species distribution by
country, see Table CAMPHUMSPECIES.
3.2.2.
Campylobacter in food and animals
Comparability of data
It is important to note that results from different countries are not directly comparable owing to betweencountry variation in the sampling and testing methods used. In addition, it should be taken into consideration
that the proportion of positive samples observed could have been influenced by the sampling season
because, in many countries, Campylobacter infections are known to be more prevalent during the summer
than during the winter.
EFSA Journal 2015;13(1):3991
53
EU summary report on zoonoses, zoonotic agents and food-borne outbreaks 2013
Only results for the most important food products and animals that might serve as a source for human
infection in the EU are presented.
Food
In 2013, 21 MS and one non-MS reported data on Campylobacter in food.
The number of samples tested within each food category ranged from a few to more than 1,000. Most of the
MS reported data on food of animal origin, where the majority of tested units were from broiler meat.
Fresh broiler meat
Broiler meat is considered to be the main source of human campylobacteriosis. In 2013, the occurrence of
Campylobacter in fresh broiler meat sampled at slaughter, processing and retail is presented in Table 13. In
2013, 31.4 % of the 8,022 tested units (single or batch) in every sampling stage were found Campylobacter
positive, representing an increase by 33.0 % compared with 2012, when 23.6 % of samples was found to be
positive out of the 7,663 samples tested. However, the apparent increase in the proportion of positive broiler
meat samples from 2012 to 2013 is mainly due to the inclusion of findings from Croatia, who reported data
for the first time in 2013.
In 2013, at retail, Campylobacter was detected in 9.8 % of the tested batches and 26.4 % of the tested single
samples. At processing plant, 12.0 % of the tested single samples and none of the two tested batches were
Campylobacter-positive. At slaughterhouse, 52.3 % of the tested slaughter batches and 49.9 % of the single
samples tested positive for Campylobacter.
As in previous years, the proportion of Campylobacter-positive fresh broiler meat samples at all sampling
stages varied widely among MS. The high proportion of positive samples observed at slaughterhouses in
2013 was mainly due to the inclusion of data from two Croatian investigations with notably high prevalence
(51.0 % and 81.5 %) accounting for approximately half of all samples tested at slaughter and approximately
two thirds of the positive samples obtained at this level (Table 13).
EFSA Journal 2015;13(1):3991
54
EU summary report on zoonoses, zoonotic agents and food-borne outbreaks 2013
Table 13. Campylobacter in fresh broiler meat, 2013
Sampling stage
Retail
Country
Austria
Matrix
fresh
Description
food sample, Surveillance
Sample
origin
Austria
Sample
unit
single
Sample
weight
25 g
European
Union
Unknown
single
25 g
Belgium
fresh
Surveillance
Czech
Republic
fresh
food sample
Denmark
Finland
fresh,
chilled
fresh
Germany
fresh
Hungary
fresh
food sample
Monitoring
food sample
Survey
food sample
Monitoring
food sample
Italy
fresh
food sample, Surveillance
Italy
Luxembourg fresh
food sample - meat
Unknown
Netherlands
fresh
food sample - meat
Slovakia
fresh
food sample, Monitoring
Slovakia
food sample, Surveillance
Slovenia
25 g
1g
single
58
14
6
42.86
21
5
23.81
306
57
18.63
25 g
13
0
0
6
0
0
Czech
Republic
European
Union
Unknown
single
25 g
single
25 g
1
0
0
- meat,
Denmark
single
10 g
884
104
11.76
- meat,
Finland
batch
25 g
185
21
11.35
- meat,
Germany
single
25 g
483
181
37.47
single
25 g
280
66
23.57
single
25 g
2
0
0
single
10 g
23
17
73.91
single
25 g
602
190
31.56
single
25 g
22
8
36.36
European
Union
batch
25 g
30
0
0
single
25 g
20
0
0
Slovakia
single
10 g
12
1
8.33
Unknown
single
- meat
10 g
4
0
0
25 g
4
2
50
food sample, Monitoring
Slovenia
single
1g
58
31
53.45
food sample - meat
Unknown
single
25 g
50
35
70
0
0
0
Batch
215
21
9.77
Single
2887
761
26.36
Total Retail
3102
782
25.21
88.52
Spain
fresh,
chilled
fresh
single
single
82
Percent
positive
70.73
Tested Positive
Slaughter batch
Processing plant
Austria
fresh
food sample, Surveillance
Belgium
fresh
Hungary
fresh,
Monitoring
skinned
fresh, with Monitoring
skin
fresh
food sample - meat
Austria
single
25 g
61
54
Unknown
single
25 g
1
1
100
single
1g
124
30
24.19
single
1g
376
22
5.85
single
1g
406
38
9.36
single
25 g
243
60
24.69
single
10 g
3
3
100
single
25 g
19
2
10.53
Surveillance
Luxembourg fresh
food sample - meat
Poland
fresh
food sample - meat
Portugal
fresh
Slovakia
fresh
food sample - meat,
Surveillance
food sample, Surveillance
Unknown
619
2
0.32
Portugal
single
500 g
25 g
28
13
46.43
European
Union
Non-EU
single
10 g
3
0
0
single
25 g
4
0
0
Slovakia
batch
10 g
2
0
0
Unknown
single
25 g
15
4
26.67
Slaughter batch
0
0
0
Batch
2
0
0
Single
1902
229
12.04
Total Processing
plant
1904
229
12.03
Spain
fresh
EFSA Journal 2015;13(1):3991
food sample - meat
55
EU summary report on zoonoses, zoonotic agents and food-borne outbreaks 2013
Table 13 (cont). Campylobacter in fresh broiler meat, 2013
Sampling stage
Slaughterhouse
Country
Matrix
Description
Sample
origin
Sample
unit
single
Sample
weight
1g
Tested Positive
Percent
positive
21.84
Belgium
carcase
Monitoring
206
45
Croatia
carcase
food sample - neck skin
Croatia
single
25 g
757
617
81.51
food sample
Surveillance
food sample
Monitoring
food sample
Monitoring
food sample
Monitoring
food sample
Surveillance
food sample
- neck skin,
Croatia
single
10 g
757
386
50.99
- meat,
Denmark
single
10 g
870
245
28.16
- neck skin,
Estonia
batch
25 g
12
0
0
- neck skin,
Germany
300
157
52.33
- meat,
Portugal
slaughter 25 g
batch
single
10 g
15
5
33.33
- meat
Unknown
single
Denmark
Estonia
fresh,
chilled
carcase
Germany
carcase
Portugal
carcase
Spain
carcase
25 g
Slaughter batch
96
51
53.13
300
157
52.33
Batch
12
0
0
Single
2701
1349
49.94
3013
1506
49.98
3
0
0
Total
Slaughterhouse
Unspecified
Sweden
fresh
Slaughter batch
food sample - meat,
Surveillance
single
25 g
0
0
0
Batch
0
0
0
Single
3
0
0
Total Unspecified
3
0
0
300
157
52.33
Slaughter batch
Batch
229
21
9.17
Single
7493
2339
31.22
Total (MS)
8022
2517
31.38
A source attribution study carried out in Switzerland indicated chicken as the main source of human
campylobacteriosis cases, as described in the text box below.
A Swiss Campylobacter source attribution study (Kittl et al., 2013) included 730 C. jejuni and C. coli isolates
from human cases, 610 isolates from chickens, 159 from dogs, 360 from pigs and 23 from cattle collected
between 2001 and 2012. All isolates had been typed with multi locus sequence typing (MLST) and flaBtyping in parallel and their genotypic resistance to quinolones was determined. Results obtained with MLST
and flaB data corresponded remarkably well; both indicated chickens as the main source for human infection
for both Campylobacter species. Based on MLST, 70.9 % of the human cases were attributed to chickens,
19.3 % to cattle, 8.6 % to dogs and 1.2 % to pigs. Furthermore, a host independent association between
sequence type (ST) and quinolone resistance was found.
Source: Swiss National Zoonoses Report, 2013
Other food
A considerable amount of other foods of animal origin was also analysed for the presence of Campylobacter.
Twelve MS reported data on turkey meat and a moderate proportion of the 975 tested units were found to be
Campylobacter-positive. The proportion of Campylobacter-positive samples (batch or single) of bovine meat
and pig meat was generally low and the proportion of Campylobacter-positive units of milk (mainly
unpasteurised or unspecified) was very low.
Detailed information on the data reported and on the occurrence of Campylobacter in the different food
categories have been included in specific tables referenced in the Appendix.
Animals
In 2013, 21 MS and three non-MS reported data on Campylobacter in animals, primarily in broiler flocks, but
also in pigs, cattle, turkeys, goats, sheep, horses, cats, dogs and a range of wild animals.
Broilers
In total, Campylobacter was found in 19.9 % of the 11,475 units tested in MS; 29.6 % of the tested slaughter
batches, 15.1 % of the tested flocks and 30.4 % of the tested animals were Campylobacter positive. The
prevalence in the investigations varied greatly between MS. The largest investigations were carried out in the
Nordic countries, where the observed prevalences ranged from 0.6 % to 13.1 %. In these countries,
EFSA Journal 2015;13(1):3991
56
EU summary report on zoonoses, zoonotic agents and food-borne outbreaks 2013
Campylobacter control or monitoring programmes have been in place for several years and, in 2013,
samples obtained in Denmark, Finland and Sweden constituted 73.2 % of the reported samples in the EU.
Hungary, Poland and the United Kingdom reported investigations with very high proportions of positive
samples (from 74.2 % to 80 %). Further details on the data reported and on the occurrence of
Campylobacter in broilers are in Table CAMPBROILERS.
Other animals
Five MS and one non-MS reported data on Campylobacter in pigs ranging from 0 % to 92.7 % positive
samples and seven MS reported prevalence data for cattle ranging from 0 % to 50.4 %.
The proportion of Campylobacter-positive cats and dogs was generally low, but in two clinical investigations
from the Netherlands and Norway 40.4 % and 31.2 %, respectively, of the tested dogs were found to be
Campylobacter-positive. Species information was reported by Norway, where 101 of the 119 Campylobacterpositive dogs were infected with C. upsaliensis and the rest of the findings were due to species more
commonly causing human disease (C. jejuni in 12 dogs and C. coli in one dog).
Details on the data reported and on the occurrence of Campylobacter in the different animals have been
included in specific tables referenced in the Appendix.
3.2.3.
Campylobacter food-borne outbreaks
Within the EU, 16 MS reported a total of 414 food-borne Campylobacter outbreaks, a decrease compared
with 2012, when a total of 501 outbreaks were reported. This represents 8.0 % of the total reported foodborne outbreaks in the EU, a decrease compared with 2012, when Campylobacter outbreaks constituted
9.3 % of the total reported food-borne outbreaks in the EU. Only 32 (7.7 %) Campylobacter outbreaks were
classified as strong-evidence outbreaks. In addition, Switzerland reported one strong-evidence outbreak.
As in previous years, broiler meat was the most frequently identified food vehicle, associated with 50.0 % of
these strong-evidence outbreaks. The proportion of strong-evidence Campylobacter outbreaks implicating
broiler meat was higher than in 2012 (44.0 %). The next most commonly implicated food vehicle was ‘other,
mixed or unspecified poultry meat and products thereof’, which was attributed to six outbreaks (18.8 %),
followed by milk and mixed food.
The most frequently reported setting was ‘Restaurant, café, pub, bar, hotel, catering service’ (18 outbreaks),
followed by household (five outbreaks).
Detailed information on strong- and weak-evidence Campylobacter outbreaks, as well as the distribution of
the most common food vehicles implicated in the strong-evidence Campylobacter outbreaks, are
summarised in Table FBOCAMP and Figure FBOCAMPVEHIC.
3.2.4.
Discussion
Campylobacteriosis has been the most commonly reported zoonosis in humans in the EU since 2005. The
EU notification rate did not change in 2013 compared with 2012, and no statistically significant increasing or
decreasing trend could be observed in the period 2009-2013 when analysed by month.
The case-fatality rate of campylobacteriosis increased in 2013 compared to the period 2009-2012. The
reason for this increase is unknown. The proportion of hospitalised campylobacteriosis cases was larger
than expected taking into account that the symptoms are often relatively mild. An explanation for this could
be that in some countries, the surveillance is focused on severe cases. In addition, the country with the most
campylobacteriosis cases only reported hospitalisation status for a fraction of its cases, and of these, the
majority were hospitalised. This fraction most likely represents cases reported from hospital doctors, while
for cases reported from other sources, e.g. laboratories, information on hospitalisation status is often
missing. Both these situations result in an overestimation of the proportion of hospitalised cases.
In 2013, just above 30 % of the tested samples of fresh broiler meat was Campylobacter-positive. It is
important to note that the apparent increase in the proportion of positive broiler meat samples from 2012 to
2013 is mainly due to the inclusion of findings from Croatia, who reported data for the first time in 2013.
There were large differences in the proportion of positive samples between the MS, however, it should be
noted that data are not comparable as some MS are not reporting a yearly prevalence because they collect
more samples during the high-prevalence summer period. As in previous years, in 2013 broiler meat was by
far the most commonly identified source of outbreaks in the EU accounting for 16 out of 32 outbreaks of
known source (50 %).
EFSA Journal 2015;13(1):3991
57
EU summary report on zoonoses, zoonotic agents and food-borne outbreaks 2013
In 2013, around 20 % of all tested broiler samples were Campylobacter-positive. However, as for the results
in broiler meat, the proportion of positive broiler samples varied greatly between MS and the majority of
tested units were from the Nordic countries where the prevalence is at a low or moderate level.
Fourteen of the 16 MS reporting data on broilers also provided information on Campylobacter in broiler meat.
In most MS the reported prevalence in animals was lower or at a similar level to the proportion of positive
samples in the investigations of broiler meat.
EFSA has estimated that the public health benefits of controlling Campylobacter in the primary production
will be greater than interventions at a later point in the food chain due to the spread of Campylobacter from
broilers to humans by transmission routes other than consumption of broiler meat. Implementation of strict
biosecurity in the primary production followed by Good Manufacturing Practice (GMP)/HACCP at slaughter is
expected to be able to reduce the prevalence in broilers and the proportion of carcases contaminated during
slaughter (EFSA BIOHAZ Panel, 2011).
3.3.
Listeria
The Appendix contains hyperlinks to all data summarised for the production of this section, for humans, food
and animals. It also includes hyperlinks to Listeria summary tables and figures that were not displayed in this
section because they did not trigger any marked observations. The summarised data are presented in
downloadable Excel and PDF files, and are listed by subject. Moreover, all submitted and validated data by
the MS are available online (http://www.efsa.europa.eu/en/efsajournal/pub/3991.htm).
3.3.1.
Listeriosis in humans
In 2013, 27 MS reported 1,763 confirmed human cases of listeriosis (Table 14). The EU notification rate was
0.44 cases per 100,000 population which was an 8.6 % increase compared with 2012. The highest MSspecific notification rates were observed in Finland, Spain, Sweden and Denmark (1.12, 1.00, 0.97 and
0.91 cases per 100,000 population, respectively). The vast majority of cases were reported to be
domestically acquired (Table LISTHUMIMPORT).
EFSA Journal 2015;13(1):3991
58
EU summary report on zoonoses, zoonotic agents and food-borne outbreaks 2013
Table 14. Reported cases and notification rates per 100,000 of human listeriosis in the EU/EEA, 20092013
2013
Country
National
Data
Coverage (a) Form at (a)
Total
Cases
Confirm ed
Cases &
Rates
2012
Confirm ed
Cases &
Rates
2011
Confirm ed
Cases &
Rates
2010
Confirm ed
Cases &
Rates
2009
Confirm ed
Cases &
Rates
Cases Rate Cases Rate Cases Rate Cases Rate Cases Rate
Austria
Y
C
36
36 0.43
36 0.43
26 0.31
34 0.41
46
Belgium
Y
C
66
66 0.59
83 0.75
70
40 0.37
58
Bulgaria
Y
A
3
3 0.04
10 0.14
4 0.05
4 0.05
5
Croatia(b)
Y
A
1
Cyprus
Y
C
1
1 0.12
1 0.12
2 0.24
1 0.12
0
Czech Republic
Y
C
36
36 0.34
32 0.31
35 0.33
26 0.25
32
Denmark
Y
C
51
51 0.91
50 0.90
49 0.88
62 1.12
97
Estonia
Y
C
2
2 0.15
3 0.23
3 0.23
5 0.38
3
Finland
Y
C
61
61 1.12
61 1.13
43 0.80
71 1.33
34
France
Y
C
369
369 0.56
348 0.53
282 0.43
312 0.48
328
Germany
Y
C
467
462 0.57
412 0.51
330 0.41
377 0.46
394
Greece
Y
C
10
10 0.09
11 0.10
10 0.09
10 0.09
4
Hungary
Y
C
48
48 0.49
13 0.13
11 0.11
20 0.20
16
Ireland
Y
C
8
8 0.17
11 0.24
7 0.15
10 0.22
10
Italy (c)
36
129 0.22
157 0.27
109
Latvia
Y
C
5
5 0.25
6 0.29
7 0.34
7 0.33
4
Lithuania
Y
C
6
6 0.20
8 0.27
6 0.20
5 0.16
5
Luxembourg
Y
C
2
2 0.37
2 0.38
2 0.39
0 0.00
3
Malta
Y
C
1
1 0.24
1 0.24
2 0.48
1 0.24
0
Netherlands
Y
C
72
72 0.43
73 0.44
87 0.52
72 0.43
44
Poland
Y
C
58
58 0.15
54 0.14
62 0.16
59 0.16
32
Portugal(d)
Romania
Y
C
9
9 0.05
11 0.06
1 0.01
6 0.03
6
Slovakia
Y
C
18
16 0.30
11 0.20
31 0.58
5 0.09
10
Slovenia
Y
C
16
16 0.78
7 0.34
5 0.24
11 0.54
6
Spain(e)
N
C
140
140 1.00
109 0.93
91 0.78
129 1.11
121
Sw eden
Y
C
93
93 0.97
72 0.76
56 0.60
63 0.67
73
United Kingdom
Y
C
192
192 0.30
183 0.29
164 0.26
176 0.28
235
EU Total
1771
1763 0.44
1644 0.41
1515 0.33
1663 0.37
1675
Iceland
Y
C
1
1 0.31
4 1.25
2 0.63
1 0.32
0
Liechtenstein
Norw ay
Y
C
21
21 0.42
30 0.60
21 0.43
22 0.45
31
Sw itzerland(f)
Y
C
64
64 0.80
39 0.49
47 0.60
67 0.86
41
(a): Y, yes; N, no; A, aggregated data; C, case-based data;-, no report.
(b): Case of unknown case classification.
(c): No report for 2013 and provisional data for 2012.
(d): No surveillance system.
(e): Sentinel system; notification rates calculated with an estimated population coverage of 30 % in 2013 and 25 % in 2009-2012.
(f): Switzerland provided data directly to EFSA.
0.55
0.07
0.00
0.31
1.76
0.23
0.64
0.51
0.48
0.04
0.16
0.22
0.19
0.19
0.16
0.61
0.00
0.27
0.08
0.03
0.19
0.30
1.05
0.79
0.38
0.37
0.00
0.65
0.53
A seasonal pattern was observed in the listeriosis cases reported in the EU/EEA in the period 2009-2013,
with large summer peaks and smaller winter peaks (Figure 7). There was a statistically significant increasing
trend (p=0.018 with linear regression) of listeriosis in the EU/EEA over this period.
EFSA Journal 2015;13(1):3991
59
EU summary report on zoonoses, zoonotic agents and food-borne outbreaks 2013
Source: Austria, Belgium, Bulgaria, Cyprus, the Czech Republic, Denmark, Estonia, Finland, France, Germany, Greece, Hungary,
Iceland, Ireland, Latvia, Lithuania, Malta, Netherlands, Norway, Poland, Romania, Slovakia, Slovenia, Spain, Sweden, and the
United Kingdom. Croatia, Italy and Luxembourg did not report data over the whole period at the level of detail required for the
analysis. Portugal has no surveillance system for listeriosis.
Figure 7. Trend in reported confirmed cases of human listeriosis in the EU/EEA, 2009-2013
Fifteen MS provided information on hospitalisation for all or the majority of their cases (which represented
42.1 % of all confirmed cases reported in the EU) in 2013. On average, 99.1 % of the cases were
hospitalised. This is the highest proportion of hospitalised cases of all zoonoses under the EU surveillance
and reflects the focus of the EU surveillance on severe, systemic listeriosis infections. In order to assess the
clinical manifestation of the disease, the variable ‘Specimen type’ was introduced as a surrogate. In cases
with a known specimen type (41.1 %), 75.3 % of positive specimens were from blood, 17.3 % were from
cerebrospinal fluid and 7.4 % were from another normally sterile site.
A total of 191 deaths due to listeriosis were reported in 2013 in the EU. Out of the 19 MS reporting outcome,
14 reported one or more fatal cases, with France reporting the highest number, 64 cases. The EU casefatality rate was 15.6 % among the 1,228 confirmed cases for which this information was reported (69.7 % of
all confirmed cases).
Seven EU MS and Norway provided information from conventional serotyping of L. monocytogenes
(accounting for 23.3 % of all confirmed cases). The most common serotypes in 2013 were 1/2a (57.5 %) and
4b (34.3 %), followed by 1/2b (6.4 %), 1/2c (1.4 %), 3a and 3b (both 0.2 %). This was the second year that
countries, which had changed to molecular-based techniques for serotyping, could report PCR serogrouping
in TESSy. Six MS and Norway provided data on this variable in 2013 (accounting for 35.1 % of all confirmed
cases). The most common PCR serogroup was IIa (44.7 %, corresponding to conventional serotypes 1/2a
and 3a), followed by IVb (44.6 %, corresponding to conventional serotypes 4b, 4d, and 4e), IIb (7.8 %,
corresponding to conventional serotypes 1/2b, 3b and 7) and IIc (2.9 %, corresponding to conventional
serotypes 1/2c and 3c).
3.3.2.
Listeria in food and animals
Comparability of data
It is important to note that results from different countries are not directly comparable owing to betweencountry variation in the sampling and testing methods used. The total in the summary tables might not be
representative for the EU, because results are highly influenced by the reporting MS and the sample sizes in
their investigations, both of which vary between years.
Only results for the most important food products and animals that might serve as a source for human
infection in the EU are presented.
EFSA Journal 2015;13(1):3991
60
EU summary report on zoonoses, zoonotic agents and food-borne outbreaks 2013
Food
In 2013, 26 MS and two non-MS reported data on Listeria in food. The number of samples tested within each
food category, ranged from a few to several thousand. The data presented in this section focus on RTE
foods, in which L. monocytogenes was detected in either qualitative investigations (absence or presence,
using detection methods) and/or quantitative investigations (counts of colony-forming units per gram (CFU/g)
using enumeration methods).
EU legislation (Regulation (EC) No. 2073/2005) lays down food safety criteria for L. monocytogenes in RTE
foods. This regulation came into force in January 2006, and the criteria are described below. The data
reported reflect the obligations of MS under this Regulation and the investigations have, therefore, focused
on testing RTE foods for compliance with the legal microbiological criteria for food safety.
Microbiological criteria
A wide range of different foodstuffs can be contaminated with L. monocytogenes. For a healthy human
population, foods where the levels do not exceed 100 CFU/g are considered to pose a negligible risk.
Therefore, the EU microbiological criterion for L. monocytogenes is set as ≤ 100 CFU/g for RTE products on
the market.
The reported results of L. monocytogenes testing in RTE food samples were evaluated in accordance with
the Listeria criteria indicated in EU legislation applying certain assumptions, where appropriate.
Regulation (EC) No. 2073/2005 covers primarily RTE food products, and requires the following:
•
In RTE products intended for infants and for special medical purposes L. monocytogenes must not
be present in 25 g of sample.
•
L. monocytogenes must not be present in levels exceeding 100 CFU/g during the shelf-life of other
RTE products.
•
In RTE foods that are able to support the growth of the bacterium, L. monocytogenes may not be
present in 25 g of sample at the time of leaving the production plant; however, if the producer can
demonstrate, to the satisfaction of the competent authority, that the product will not exceed the limit
of 100 CFU/g throughout its shelf-life, this criterion does not apply.
For many of the reported data, it was not evident whether the RTE food tested was able to support the
growth of L. monocytogenes or not. For the non-compliance analysis of samples collected at processing, the
criterion of absence in 25 g was applied, except for samples from hard cheeses and fermented sausages
(assumed to be unable to support the growth of L. monocytogenes) where the limit ≤ 100 CFU/g was
applied. For samples collected at retail, the limit ≤ 100 CFU/g was applied, except for RTE products intended
for infants and for special medical purposes, where presence in L. monocytogenes must not be detected in
25 g of sample.
The results from qualitative examinations using the detection method have been used to analyse the
compliance with the criterion of absence in 25 g of sample, and the results from quantitative analyses using
the enumeration method have been used to analyse compliance with the criterion ≤ 100 CFU/g.
Non-compliance in ready-to-eat products
In total, 22 MS reported data which were included in the evaluation for compliance with microbiological
criteria. Compliance with the L. monocytogenes criteria in food categories in 2013 is presented in Figure 8 as
well as in Table LISTERIACOMPL.
For RTE products on the market, very low percentages (< 1 %) were generally found to not comply with the
criterion of ≤ 100 CFU/g. However, higher levels of non-compliance (primarily presence in 25 g) were
reported in samples of RTE products at the processing stage, ranging from none to 4.6 % of single samples.
As in previous years, all samples of RTE food intended for infants and for medical purposes were compliant
with the L. monocytogenes criteria both at processing (one MS) and at retail (four MS). All RTE milk samples
collected at either processing (11 MS) or retail (seven MS) were also compliant.
As observed in the past two years, the food category with the highest levels of non-compliance at processing
was RTE fishery products (4.6 % of single samples and 19.9 % of batches), mainly in smoked fish. Most of
the tested units of RTE fishery products originated from Poland, and almost all non-compliant units
originated from two MS. At retail, the levels of non-compliance (0.5 % of single samples and 2.6 % of
batches) were generally lower than those observed at processing plants.
EFSA Journal 2015;13(1):3991
61
EU summary report on zoonoses, zoonotic agents and food-borne outbreaks 2013
Among samples from RTE products of meat origin, other than fermented sausages, low levels of noncompliance were observed at processing (1.7 % of single samples and 2.8 % of batches), where noncompliance was reported from 11 MS. Poland reported the majority of units tested at processing (77 %). At
retail, very low levels of non-compliance were reported (0.2 % of single samples and 0.1 % of batches), with
a few non-compliant products reported by three MS.
In the case of fermented sausages, all tested products were found to meet the L. monocytogenes criterion
(no levels exceeding 100 CFU/g) at both processing and retail.
For soft and semi-soft cheeses, low levels of non-compliance were observed in investigations at processing
(1.8 % of single samples and 0.3 % of batches). Non-compliance primarily occurred in soft and semi-soft
cheeses made from raw or low heat-treated cow’s milk. At retail, the levels of non-compliance were very low
(0.3 % of single samples and 0.4 % of batches), and the few non-compliant products were reported from
three MS. Low levels of non-compliance were also observed in unspecified cheeses at processing (1 % of
single samples) and at retail (0.7 %).
Hard cheeses are assumed not to support the growth of L. monocytogenes. All tested units complied with
the criteria of levels not exceeding 100 CFU/g at processing and retail, except for one single sample of hard
cheese made from pasteurised cow’s milk sampled at retail.
Among samples of unspecified cheeses, low levels of non-compliance were observed at processing (1.0 %
of single samples) and at retail (0.7 %). However, at retail, the level of L. monocytogenes non-compliance
observed in unspecified cheese was the highest of all the RTE foods at the same sampling stage.
EFSA Journal 2015;13(1):3991
62
EU summary report on zoonoses, zoonotic agents and food-borne outbreaks 2013
% non-compliance at processing
RTE fermented sausages (3 MS,
N=212)
Other RTE products of meat origin
(12 MS, N=23,064)
2011
Unspecified cheeses, RTE (3 MS,
N=1,456)
2012
2013
Soft and semi-soft cheese, RTE (12
MS, N=4,533)
Hard cheese, RTE (7 MS, N=621)
Fishery products, RTE (8 MS,
N=1,132)
Other RTE products (9 MS,
N=1,215)
0
1
2
3
4
5
6
7
8
% non-compliance at retail
RTE fermented sausages (3 MS,
N=662)
Other RTE products of meat origin
(8 MS, N=3,219)
2011
2012
Unspecified cheeses, RTE (3 MS,
N=282)
2013
Soft and semi-soft cheese, RTE (11
MS, N=2,258)
Hard cheese, RTE (6 MS, N=1623)
Fishery products, RTE (9 MS,
N=3,047)
Other RTE products (12 MS,
N=8,635)
0
1
2
3
4
5
6
7
8
RTE, ready-to-eat. In parentheses, the total number of included samples (N) and MS in 2013. Includes data where sampling stage at
retail (also catering, hospitals and care homes) and at processing (also cutting plants) have been specified for the relevant food types.
Figure 8. Proportion of single samples at processing and retail non-compliant with EU
L. monocytogenes criteria, 2011-2013
Ready-to-eat fish and fishery products
In total, 14,564 samples of fish were tested at retail or at processing plants in the MS and overall
L. monocytogenes was found in 10.8 % of these. In the 6,495 samples tested using the enumeration
method, L. monocytogenes was found in levels exceeding 100 CFU/g in 1.6 % of the samples.
The majority of the investigations in fish were carried out at processing plant level, where, overall, 12.9 % of
the 9,433 samples tested positive for L. monocytogenes. L. monocytogenes was detected in 18.6 % of
5,850 units tested using the detection method, and found in levels exceeding 100 CFU/g in 2.2 % of the
3,489 units tested quantitatively. Almost half of all samples tested at this sampling stage were from one MS.
EFSA Journal 2015;13(1):3991
63
EU summary report on zoonoses, zoonotic agents and food-borne outbreaks 2013
At retail, L. monocytogenes was detected in 5.6 % of the 198 units tested qualitatively and found in counts
above 100 CFU/g in 0.5 % of the 2,767 samples tested quantitatively.
In 2013, 17 MS reported on L. monocytogenes in RTE fishery products. In total 1,649 samples of various
fishery products, including shrimps, prawns and molluscan shellfish were tested and L. monocytogenes was
found in 1.6 % of these (using both methods).
A summary of the proportion of L. monocytogenes-positive units in different types of fishery products is
presented in Figure 9. As in previous years, L. monocytogenes was most often detected in RTE fish (mainly
smoked fish), in which the highest percentage of units with L. monocytogenes counts of more than
100 CFU/g was also detected. Compared with previous years, in 2013, levels of L. monocytogenes between
the detection limit and 100 CFU/g were found in a higher proportion of the tested crustaceans and molluscs;
however, this was mainly the result of the influence of the findings from one investigation on cooked
crustaceans in one MS.
16
14
12
% positive units
10
8
6
4
Fish
Crustaceans and molluscs
Enumeration; >100 cfu/g
Enumeration; ≤100 cfu/g
Detection
Enumeration; >100 cfu/g
Enumeration; ≤100 cfu/g
Detection
Enumeration; >100 cfu/g
Enumeration; ≤100 cfu/g
0
Detection
2
Unspecified fishery products
Test results obtained by detection and enumeration methods are presented separately.
Fish includes data from Austria, Belgium, Bulgaria, Cyprus, Czech Republic, Estonia, Germany, Greece, Hungary, Ireland, Italy,
Lithuania, Netherlands, Poland, Slovakia, Slovenia and Spain (detection: 14 MS; enumeration: 14 MS).
Crustaceans and molluscs include data from Austria, Bulgaria, Cyprus, Hungary, Ireland, Lithuania, Poland, Portugal, Romania and
Spain (detection: 10 MS; enumeration: 4 MS).
Unspecified fishery products (including unspecified fishery products and surimi) include data from Austria, Belgium, Estonia, Germany,
Ireland, Italy, Portugal, Romania, Slovakia, Slovenia and Sweden (detection: 10 MS; enumeration: 10 MS).
Data pooled for all sampling stages for all reporting MS (single and batch).
Figure 9. Proportion of L. monocytogenes-positive units in ready-to-eat fishery products, 2013
Further details on L. monocytogenes in samples from fish and fishery products can be found in Tables
LISTERIAFISH and LISTERIAFISHPR.
Ready-to-eat meat products, meat preparations and minced meat
A summary of the proportions of units positive for L. monocytogenes in RTE products of meat origin is
presented in Figure 10. Using detection methods, L. monocytogenes was most commonly detected in RTE
products from pig meat. For samples tested using enumeration methods, the occurrence in pig meat
products also appeared to be higher than the other meat types, but levels exceeding 100 CFU/g were most
frequently observed in RTE products from broiler meat. A very large proportion of the reported samples of
RTE products of broiler meat and pig meat all came from one MS and these results might therefore not be
considered representative for the EU.
Poultry meat
L. monocytogenes was detected in 1.6 % of the 5,275 samples of RTE broiler meat tested qualitatively
(Table LISTERIARTEBROIL). In total 2,479 samples were tested using enumeration methods, and in 1.0 %
of these L. monocytogenes was found in concentrations above 100 CFU/g. The majority of samples were
sampled at processing plant and mainly by Poland.
64
EFSA Journal 2015;13(1):3991
EU summary report on zoonoses, zoonotic agents and food-borne outbreaks 2013
L. monocytogenes was detected in 0.4 % of the 1,705 samples of RTE products of turkey meat tested using
detection methods (Table LISTERIARTETURK). One batch sampled at retail, representing 0.5 % of 188
units tested for enumeration, was found to exceed the criterion of 100 CFU/g.
Bovine meat
In 2013, L. monocytogenes was found in 2.3 % of the 2,575 units of RTE bovine meat tested qualitatively
and in 0.9 % of the 1,023 samples tested using enumeration methods, but levels above 100 CFU/g were not
observed in any of the tested samples (Table LISTERIARTEBOVINE).
All tested samples from fermented sausages were found to meet the L. monocytogenes criterion at both
processing and retail (≤ 100 CFU/g).
Pig meat
L. monocytogenes was detected in 3.4 % of the 36,511 samples of RTE pig meat or products thereof tested
using detection methods (Table LISTERIARTEPIG). Among the 19,926 units tested using enumeration
methods, L. monocytogenes was found at a level above 100 CFU/g in 0.4 % of the tested units. The majority
of RTE meat products from pigs were sampled at processing plants.
5
3
2
RTE broiler meat
RTE turkey meat
RTE bovine meat
Enumeration; >100 cfu/g
Enumeration; ≤100 cfu/g
Detection
Enumeration; >100 cfu/g
Enumeration; ≤100 cfu/g
Detection
Enumeration; >100 cfu/g
Enumeration; ≤100 cfu/g
Detection
Enumeration; >100 cfu/g
0
Enumeration; ≤100 cfu/g
1
Detection
% positive units
4
RTE pig meat
Test results obtained by detection and enumeration methods are presented separately.
RTE broiler meat includes data from Belgium, Bulgaria, Czech Republic, Estonia, Hungary, Ireland, Italy, Lithuania, Luxembourg,
Poland, Portugal, Romania, Slovakia and Sweden (detection: 13 MS; enumeration: 11 MS).
RTE turkey meat includes data from Cyprus, Czech Republic, Estonia, Hungary, Ireland, Luxembourg, Poland and Portugal (detection:
6 MS; enumeration: 6 MS).
RTE bovine meat includes data from Bulgaria, Cyprus, Czech Republic, Estonia, Germany, Hungary, Ireland, Italy, Luxembourg,
Poland, Romania, Spain and Sweden (detection: 13 MS; enumeration: 8 MS).
RTE pig meat includes data from Austria, Belgium, Bulgaria, Cyprus, Czech Republic, Estonia, Germany, Greece, Hungary, Ireland,
Italy, Lithuania, Luxembourg, Poland, Portugal, Romania, Slovakia, Spain and Sweden (detection: 19 MS; enumeration: 16 MS).
Data pooled for all sampling stages for all reporting MS (single and batch).
Figure 10. Proportion of L. monocytogenes-positive units in ready-to-eat meat categories in the EU,
2013
Ready-to-eat cheeses
A summary of tested units and the proportion of units positive for cheeses are presented in Figure 11.
L. monocytogenes was more often detected in samples of soft and semi-soft cheeses made from raw or low
heat-treated milk than in samples of cheeses made from pasteurised milk. Maybe slightly surprisingly, the
proportion of samples positive with a concentration in the interval between the limit of detection and
100 CFU/g in hard cheese made from pasteurised milk was at a level similar to soft and semi-soft cheeses
made from raw or low heat-treated milk, but this was mainly influenced by the results provided by one MS.
The proportion of samples with levels of L. monocytogenes above 100 CFU/g was in general very low in
cheese samples.
In soft and semi soft cheeses made from raw or low heat-treated milk, the proportion of positive samples for
detection was higher in cow’s cheeses than in cheeses from other animal species, whereas the proportion of
samples with L. monocytogenes greater than 100 CFU/g was higher in samples from sheep’s cheeses than
EFSA Journal 2015;13(1):3991
65
EU summary report on zoonoses, zoonotic agents and food-borne outbreaks 2013
in cheeses from other animal species. In hard cheeses made from raw and low heat-treated milk,
L. monocytogenes was more often detected in samples from sheep’s milk, followed by goat’s milk, than in
cheeses from cows or from mixed, unspecified or other animals. No major differences between animal
species were observed in cheeses made from pasteurised milk.
Soft and semi-soft cheeses
In 2013, lower levels of L. monocytogenes were observed in soft and semi-soft cheeses made from
pasteurised milk (0.1 % of the 8,895 samples tested qualitatively and 2.4 % of the 2,760 units tested
quantitatively had concentrations ≤ 100 CFU/g, and 0.1 % exceeded 100 CFU/g) than in soft and semi-soft
cheeses made from raw or low-heat-treated milk (4.3 % out of 2,538 samples tested qualitatively and 3 % of
the 1,447 units tested quantitatively had concentration ≤ 100 CFU/g, and 0.6 % exceeded 100 CFU/g).
Hard cheeses
In 2013, L. monocytogenes was found in 0.6 % of the 1,704 samples of hard cheeses made from raw or low
heat-treated milk tested for detection in MS. Counts between the detection limit and 100 CFU/g were found
in 1.2 % of the 426 units tested quantitatively. In hard cheeses made from pasteurised milk,
L. monocytogenes was found in 0.4 % of the 8,360 tested units, and, in 3.1 % of the 2,273 samples tested
using the enumeration method, the concentration was between the detection limit and 100 CFU/g. Levels of
L. monocytogenes above 100 CFU/g were not found in samples of hard cheeses (from raw or low heattreated milk and from pasteurised milk), except for one sample of hard cheese made from pasteurised milk
sampled at retail.
4.5
4.0
3.5
% positive units
3.0
2.5
2.0
1.5
1.0
Soft and semi-soft
cheeses
raw-LHT milk
Soft and semi-soft
cheeses
pasteurised milk
Hard cheese
raw-LHT milk
Enumeration; >100 cfu/g
Enumeration; ≤100 cfu/g
Detection
Enumeration; >100 cfu/g
Enumeration; ≤100 cfu/g
Detection
Enumeration; >100 cfu/g
Enumeration; ≤100 cfu/g
Detection
Enumeration; >100 cfu/g
Enumeration; ≤100 cfu/g
0.0
Detection
0.5
Hard cheese
pasteurised milk
Test results obtained by detection and enumeration methods are presented separately. LHT, low heat-treated milk
Soft and semi-soft cheeses, made from raw-LHT milk include data from Austria, Belgium, Bulgaria, Czech Republic, Germany, Ireland,
Italy, Netherlands, Poland, Portugal, Romania, Slovakia and United Kingdom (detection: 13 MS; enumeration: 10 MS).
Soft and semi-soft cheeses, made from pasteurised milk include data from Austria, Belgium, Bulgaria, Cyprus, Czech Republic, Estonia,
Germany, Greece, Hungary, Ireland, Poland, Portugal, Romania, Slovakia, Spain and United Kingdom (detection: 15 MS; enumeration:
13 MS).
Hard cheese, made from raw-LHT milk include Austria, Bulgaria, Czech Republic, Estonia, Germany, Ireland, Netherlands, Poland,
Portugal, Romania, Slovakia and United Kingdom (detection: 11 MS; enumeration: 7 MS).
Hard cheese, made from pasteurised milk include data from Austria, Bulgaria, Cyprus, Czech Republic, Estonia, Germany, Greece,
Hungary, Ireland, Poland, Romania, Slovakia and Spain (detection: 13 MS; enumeration: 10 MS).
Data pooled for all sampling stages for all reporting MS (single and batch).
Figure 11. Proportion of L. monocytogenes-positive units in soft and semi-soft cheeses made from
raw or low heat-treated milk, 2013
Detailed information on the data reported and on the occurrence of L. monocytogenes in the different cheese
categories has been included in specific tables referenced in the Appendix.
EFSA Journal 2015;13(1):3991
66
EU summary report on zoonoses, zoonotic agents and food-borne outbreaks 2013
Other ready-to-eat products
Results of a considerable number of investigations on L. monocytogenes in other RTE products, such as
bakery products, fruits and vegetables, prepared dishes and salads were reported.
In 2013, 14 MS provided data from investigations on RTE fruit and vegetables (Table LISTERIAFRUITVEG).
In total, 5,106 units were tested, where the majority were single samples sampled at retail, and L.
monocytogenes was found in 1.4 % of samples collected at all sampling stages. In 0.4 % of the 2,494
samples tested quantitatively, the concentration exceeded 100 CFU/g (all sampled at retail).
Overall, 12 MS reported on bakery products, where L. monocytogenes was found in 4.5 % of the
3,731 analysed samples (Table LISTERIABAKERY). Of these, 1,687 samples was tested using
enumeration, and 1.2 % was contaminated with L. monocytogenes in concentrations above 100 CFU/g.
L. monocytogenes was detected in 4.0 % of the 5,312 tested samples of RTE salads
(Table LISTERIASALAD). In two MS, L. monocytogenes was found in salads at levels exceeding 100 CFU/g
(in total, 0.1 % of the 3,370 units tested quantitatively). L. monocytogenes was found in 1 of the 302 tested
samples of sauces (Table LISTERIASAUCE) and at levels between the detection limit and 100 CFU/g in two
of the 506 samples of spices (Table LISTERIASPICES).
In the investigations of ‘Other processed food products and prepared dishes’ reported in 2013,
L. monocytogenes was detected in sandwiches at retail and in sushi sampled at retail
(Table LISTERIAPREPDISH).
In 2013, L. monocytogenes was not found in any of the relatively few reported investigations of confectionery
products and pastes (Table LISTERIACONF), egg products (Table LISTERIAEGGPR or RTE milk
(Table LISTERIAMILK).
Animals
In 2013, 12 MS and one non-MS reported qualitative data on Listeria in animals, including samples from
investigations where suspect sampling had been applied and samples from clinical investigations. The
majority of findings were reported as L. monocytogenes (234) or Listeria spp. (162), but a few findings of two
additional Listeria species, L. innocua (4) and L. ivanovii (1), were also reported.
Findings of Listeria were most often reported in cattle, sheep and goats, but Listeria was also detected in
laying hens and broilers, pigs, dogs, foxes, horses, African wild dogs and alpacas.
In total, 37,419 animals or flocks/herds were tested for Listeria and 2.0 % of these were found to be Listeria
positive. The size of the investigations and the prevalence varied considerably.
Further details on the findings of Listeria in animals are included in Table LISTERIAANIMALS.
3.3.3.
Listeria food-borne outbreaks
In 2013, a total of 12 Listeria outbreaks were reported by seven MS. This was slightly higher than in previous
years (2012, nine outbreaks; 2011, eight outbreaks).
Seven of the outbreaks reported were supported by strong evidence. Crustaceans, shellfish and molluscs
and products thereof were implicated in three strong-evidence outbreaks. In two of these outbreaks, the
source was crab meat. The responsible food vehicles in the remaining four outbreaks belonged to four
different food categories (‘Cheese’, ‘Meat and meat products’, ‘Pig meat and products thereof’, ‘Vegetables
and juices and other products thereof (mixed salad)’).
Except for one outbreak related to meat and meat products with 34 cases, the Listeria outbreaks reported in
2013 involved two to four cases each, resulting in 51 cases, 11 hospitalisations and three deaths. Three
Listeria strong-evidence outbreaks were responsible for one fatal case each. Specifically, one person died in
each of the two strong-evidence general outbreaks associated with the consumption of crab meat. These
two outbreaks were both reported as being related to mobile retailers or street vendors in the same MS. One
fatal case was reported in a general outbreak associated with the consumption of mixed salad in a hospital
or medical facility.
In addition, Norway reported one strong-evidence general outbreak, which was associated with the
consumption of fish and fish products (half-fermented trout). The Norvegian outbreak affected three people,
of which, one person died.
EFSA Journal 2015;13(1):3991
67
EU summary report on zoonoses, zoonotic agents and food-borne outbreaks 2013
3.3.4.
Discussion
Human listeriosis is a relatively rare but serious zoonotic disease, with high morbidity, hospitalisation and
mortality rates in vulnerable populations. Of all the zoonotic diseases under EU surveillance, listeriosis
caused the most severe human disease with 99.1 % of the cases hospitalised and 191 cases being fatal
(case fatality rate 15.6 %). This also reflects the focus of EU surveillance on severe, systemic infections. In
the last five years, there has been an increasing trend of listeriosis in the EU/EEA and, in 2013, the EU
notification rate increased by 9.4 % compared with 2012.
In 2013, seven strong-evidence food-borne outbreaks caused by L. monocytogenes were reported by five
MS. These outbreaks resulted in 51 cases, 11 hospitalisations and three deaths, i.e. 37.5 % of all deaths due
to strong-evidence food-borne outbreaks reported in 2013. Three outbreaks were related to crustaceans,
shellfish and molluscs and products thereof, and other sources were: mixed salad, meat and meat products,
cheese and pig meat and products thereof. In addition, one non-MS reported one strong-evidence outbreak
associated with the consumption of half-fermented trout and responsible of one fatal case.
L. monocytogenes is widespread in the environment and therefore a wide range of different foodstuffs can
be contaminated. For a healthy human population, foods not exceeding the level of 100 CFU/g are
considered to pose a negligible risk. Therefore, the EU microbiological criterion for L. monocytogenes in RTE
food is set at ≤ 100 CFU/g for RTE products on the market.
In 2013, the non-compliance for different RTE food categories generally was at a level comparable to
previous years and the proportion of non-compliant units at retail was lower than at processing, for all
categories. As last year, at processing plants the level of non-compliance was highest in fishery products
(mainly smoked fish). In 2013, the overall level of non-compliance for soft and semi-soft cheeses was
considerably higher than in previous years, mainly due to one MS. This highlights the influence of the
variations in the reporting MS and the sample sizes in their investigations.
As in previous years and consistent with the results of the EU baseline survey on the prevalence of
L. monocytogenes in certain RTE foods at retail (EFSA, 2013a), the proportion of positive samples at retail
was highest in fish products (mainly smoked fish), followed by soft and semi-soft cheeses, RTE meat
products and hard cheeses.
Several MS reported findings of Listeria in animals. Most of the tested samples were from cattle, and to a
lesser degree goats and sheep. Findings of Listeria were most often reported in these three animal species,
but Listeria was also detected in fowl, pigs, dogs, foxes, horses, African wild dogs and alpacas. Listeria is
widespread in the environment; therefore, isolation from animals is to be expected and increased exposure
may lead to clinical disease in animals.
3.4.
Verocytotoxigenic Escherichia coli
The Appendix contains hyperlinks to all data summarised for the production of this section, for humans, food,
animals and food-borne outbreaks. It also includes hyperlinks to VTEC summary tables and figures that were
not displayed in this section because they did not trigger any marked observation. The summarised data are
presented in downloadable Excel and PDF files, and are listed by subject. Moreover, all submitted and
validated data by the MS are available online (http://www.efsa.europa.eu/en/efsajournal/pub/3991.htm).
3.4.1.
Verocytotoxigenic Escherichia coli in humans
28
In 2013, 6,112 cases of VTEC infections, of which 6,043 were confirmed, were reported in the EU (Table
15). Twenty-four MS reported at least one confirmed case, two MS reported zero cases and one MS did not
provide information on case classification. The EU notification rate was 1.59 cases per 100,000 population,
which was 5.9 % higher than the notification rate in 2012. The highest country-specific notification rates were
observed in Ireland, the Netherlands and Sweden (12.29, 7.06 and 5.77 cases per 100,000 population,
respectively). The increase in Ireland in the last few years has primarily been due to non-O157 VTEC cases,
and has coincided with continuing changes in diagnostics in primary hospital laboratories during this time
(Patricia Garvey, Health Service Executive, Ireland, personal communication, October 2014). In the
Netherlands, the notification rate of VTEC infections has increased considerably after the introduction of
PCR for VTEC detection in stool samples (with many of the cases being asymptomatic) but also because
increasing numbers of laboratories are able to identify serogroups other than O157 (Ingrid Friesma, RIVM,
the Netherlands, personal communication, October 2014). The lowest rates were reported in Bulgaria,
Cyprus, Greece, Latvia, Poland, Romania and Spain (< 0.1 cases per 100,000).
28
Also known as verotoxigenic E. coli, verocytotoxigenic E. coli, verotoxin-producing E. coli and verocytotoxin-producing E. coli
(VTEC), Shiga toxin-producing E. coli (STEC).
EFSA Journal 2015;13(1):3991
68
EU summary report on zoonoses, zoonotic agents and food-borne outbreaks 2013
Table 15. Reported cases and notification rates per 100,000 of human VTEC infections in the EU/EEA,
2009–2013
2013
National
Data
Coverage (a) Form at (a)
2012
Total
Cases
2011
2010
2009
Confirm ed
Confirm ed
Confirm ed
Confirm ed
Confirm ed
Cases & Rates Cases & Rates Cases & Rates Cases & Rates Cases & Rates
Cases
Rate
Cases
Rate
Cases
Rate
Cases
Rate
Cases
Rate
Austria
Y
C
130
130
1.54
130
1.55
120
1.43
88
1.05
91
Belgium(b)
N
C
117
117
-
105
-
100
-
84
-
96
1.09
-
Bulgaria
Y
A
1
1
0.01
0
0.00
1
0.01
0
0.00
0
0.00
Croatia(c)
Y
A
2
-
-
-
-
-
-
-
-
-
-
Cyprus
Y
C
0
0
0.00
0
0.00
0
0.00
0
0.00
0
0.00
Czech Republic (d)
Y
C
17
17
0.16
9
0.09
7
0.07
-
-
-
-
Denmark
Y
C
199
191
3.41
199
3.57
215
3.87
178
3.22
160
2.90
Estonia
Y
C
8
8
0.61
3
0.23
4
0.30
5
0.38
4
0.30
Finland
Y
C
98
98
1.81
32
0.59
27
0.50
20
0.37
29
0.54
France(e)
N
C
218
218
-
208
-
221
-
103
-
93
-
Germany
Y
C
1673
1639
2.00
1573
1.93
5558
6.82
955
1.17
887
1.08
Greece
Y
C
2
2
0.02
0
0.00
1
0.01
1
0.01
0
0.00
Hungary
Y
C
13
13
0.13
3
0.03
11
0.11
7
0.07
1
0.01
Ireland
Y
C
581
564
12.29
412
8.99
275
6.02
197
4.33
237
5.24
Italy (b)
N
C
70
65
-
50
-
51
-
33
-
51
-
Latvia
Y
C
0
0
0.00
0
0.00
0
0.00
0
0.00
0
0.00
Lithuania
Y
C
6
6
0.20
2
0.07
0
0.00
1
0.03
0
0.00
Luxembourg
Y
C
10
10
1.86
21
4.00
14
2.74
7
1.39
5
1.01
Malta
Y
C
2
2
0.48
1
0.24
2
0.48
1
0.24
8
1.95
Netherlands
Y
C
1184
1184
7.06
1049
6.27
845
5.07
478
2.88
314
1.91
Poland
Y
C
8
5
0.01
3
0.01
5
0.01
4
0.01
0
0.00
Portugal(f)
-
-
-
-
-
-
-
-
-
-
-
-
-
Romania
Y
C
6
6
0.03
1
0.01
2
0.01
2
0.01
0
0.00
Slovakia
Y
C
7
7
0.13
9
0.17
5
0.09
10
0.19
14
0.26
Slovenia
Y
C
17
17
0.83
29
1.41
25
1.22
20
0.98
12
0.59
0.03
Spain
Y
C
28
28
0.06
32
0.07
20
0.04
18
0.04
14
Sw eden
Y
C
551
551
5.77
472
4.98
477
5.07
334
3.58
228
2.46
United Kingdom
EU Total
Y
-
C
-
1164
6112
1164
6043
1.82
1.59
1337
5680
2.11
1.50
1501
9487
2.40
2.58
1110
3656
1.79
1.00
1336
3580
2.17
0.98
Iceland
Y
C
3
3
0.93
1
0.31
2
0.63
2
0.63
8
2.51
Liechtenstein
-
-
-
-
-
-
-
-
-
-
-
-
-
Norw ay
Y
C
103
103
2.04
75
1.50
47
0.96
52
1.07
108
2.25
Sw itzerland(g)
Y
C
80
80
1.00
63
0.79
76
0.97
34
0.44
58
0.75
(a): Y, yes; N, no; A, aggregated data; C, case-based data; -, no report.
(b): Sentinel surveillance; no information on estimated coverage. Thus, notification rate cannot be estimated.
(c) : All cases of unknown case classification.
(d): Mandatory notification of VTEC in 2008 and reported to ECDC from 2011.
(e): Sentinel surveillance; only cases with HUS are notified.
(f): No surveillance system.
(g): Switzerland provided data directly to EFSA.
Most of the VTEC cases reported in the EU were infected within their own country (62.5 % domestic cases,
13.2 % travel-associated and 24.4 % of unknown origin) (Table VTECHUMIMPORT). Only Sweden reported
a higher proportion of travel-associated cases than domestic cases (50.6 % vs. 47.4 %, 3.6 % unknown) with
Turkey and Egypt the most common probable countries of infection (82 and 43 cases, respectively).
There was a clear seasonal trend in the confirmed VTEC cases reported in the EU in 2009-2013 with more
cases reported in the summer months (Figure 12). A dominant peak in the summer of 2011 was attributed to
the large enteroaggregative Shiga toxin-producing E. coli (STEC)/VTEC O104:H4 outbreak associated with
the consumption of contaminated raw sprouted seeds affecting more than 3,800 persons in Germany and
linked cases in an additional 15 countries (EFSA and ECDC, 2013). In the two consecutive years after the
outbreak, there were still higher numbers of VTEC cases reported in the EU, which was possibly an effect of
increased awareness and of more laboratories also testing for serogroups other than O157.
EFSA Journal 2015;13(1):3991
69
EU summary report on zoonoses, zoonotic agents and food-borne outbreaks 2013
Source: Austria, Belgium, Bulgaria, Cyprus, Denmark, Estonia, Finland, France, Germany, Greece, Hungary, Iceland, Ireland, Italy,
Latvia, Lithuania, Luxembourg, Malta, the Netherlands, Norway, Poland, Slovakia, Slovenia, Sweden, and United Kingdom.
Croatia, the Czech Republic, Spain and Romania did not report data over the whole period at the level of detail required for
the analysis. Portugal does not have any surveillance system for this disease.
Figure 12. Trend in reported confirmed cases of human VTEC infections in the EU/EEA, 2009-2013
Sixteen MS, which is three more than in 2012, provided information on hospitalisation, covering 41.1 % of all
confirmed VTEC cases in 2013. Of the cases with known hospitalisation status, 37.1 % of cases on average
were hospitalised. The highest proportions of hospitalised cases were reported in Romania, Italy, Estonia,
Slovenia, Lithuania and Slovakia (75-100 %). In 2013, 13 deaths due to VTEC infection were reported in the
EU. Eight MS reported one to five fatal cases each, and ten MS reported no fatal cases. This resulted in an
EU case-fatality rate of 0.36 % among the 3,582 confirmed cases for which this information was provided
(59.3 % of all reported confirmed cases). The serogroups associated with fatal cases were O157 (2 cases),
O26 (1), O55 (1), O103 (1), O111 (1), O145 (1), non-typable (2) and in four cases the serogroup was not
specified.
Data on VTEC serogroups (based on O antigens) were reported by 22 MS, Iceland and Norway in 2013. As
in previous years, the most commonly reported serogroup was O157 (48.9 % of cases with known
serogroup) (Table 16). Serogroup O26, the second most common in 2013, increased by 65.1 % between
2011 and 2013. The proportion of non-typeable VTEC strains doubled in the same period (the non-typable
include those strains where the laboratory tried but was not able to define the O-serogroup. The proportion of
non-typable depends on how many sera/molecular tools are included in the typing panel of each laboratory).
The serogroup which showed the largest relative increase between 2011 and 2013 was O182, which was
reported by five countries in 2013 compared with only one in 2011 and 2012. It is not known if these are true
increases in these serogroups or if they result from increased detection of serogroups other than O157. Only
three cases of O104:H4 were reported in 2013 by three countries (Belgium, Denmark and the Netherlands)
and eight cases of O104 with unknown H-group were reported by four countries (France, Germany, Ireland
and the Netherlands) (data not shown).
EFSA Journal 2015;13(1):3991
70
EU summary report on zoonoses, zoonotic agents and food-borne outbreaks 2013
Table 16. Distribution of reported confirmed cases of human VTEC infections in 2013 in the EU/EEA,
2011–2013, by the 20 most frequent serogroups
Serogroup
2011
Cases
MS
O157
2201
21
O26
289
O103
808
O145
80
12
O91
116
8
O111
52
9
O146
48
8
O128
54
Orough
28
Non-O157
2012
%
Cases
MS
2013
%
Cases
MS
%
41.0
1981
19
54.9
1828
23
48.9
17
5.4
417
17
11.6
477
17
12.8
12
15.0
231
13
6.4
160
12
4.3
1.5
112
11
3.1
96
11
2.6
2.2
131
8
3.6
94
11
2.5
1.0
66
10
1.8
78
13
2.1
0.9
59
9
1.6
75
9
2.0
9
1.0
37
8
1.0
41
8
1.1
4
0.5
24
5
0.7
41
5
1.1
16
1
0.3
21
3
0.6
36
3
1.0
O113
34
8
0.6
24
8
0.7
27
6
0.7
O117
17
5
0.3
22
6
0.6
24
8
0.6
O121
27
7
0.5
27
4
0.7
23
7
0.6
O177
18
5
0.3
4
3
0.1
22
7
0.6
O76
21
6
0.4
22
7
0.6
20
9
0.5
O63
26
2
0.5
12
2
0.3
18
3
0.5
O182
1
1
0.0
1
1
0.0
15
5
0.4
22
5
0.4
7
4
0.2
15
5
0.4
O118
8
2
0.15
8
4
0.22
13
6
0.3
O92
4
1
0.07
4
1
0.11
13
2
0.3
148
15
2.8
136
11
3.8
298
10
8.0
1499
-
27.9
398
-
11.0
622
-
16.6
O5
NT (non typeable)
Other
Total
5369
24
100.0
3608
22
100.0
3738
24
100.0
Source: 22 MS and two non-MS: Austria, Belgium, Czech Republic, Denmark, Estonia, Finland, France, Germany, Greece, Hungary,
Iceland, Ireland, Italy, Luxembourg, Malta, the Netherlands, Norway, Poland, Romania, Slovakia, Slovenia, Spain, Sweden
and United Kingdom.
3.4.2.
Verocytotoxigenic Escherichia coli in food
Comparability of data
Data on VTEC detected in food and animals are reported annually on a mandatory basis by EU MS to the
EC and EFSA, based on Directive 2003/99/EC. In order to improve the quality of the data from VTEC
monitoring in the EU, EFSA issued technical specifications for the monitoring and reporting of VTEC in
animals and food in 2009 (EFSA, 2009a). These guidelines were developed to facilitate the generation of
data which would enable a more thorough analysis of VTEC in food and animals in the future. The
specifications encourage MS to monitor and report data on serogroups defined by the BIOHAZ Panel as the
most important regarding human pathogenicity. When interpreting the VTEC data it is important to note that
data from different investigations are not necessarily directly comparable owing to differences in sampling
strategies and the analytical methods applied. Different analytical methods were used by the MS: the new
ISO 13136:2012 analytical method (ISO, 2012) recommended by the BIOHAZ Panel (EFSA BIOHAZ Panel,
2013a), which aims to detect any VTEC, and facilitate the isolation of strains belonging to VTEC serogroups
O157, O111, O26, O103 and O145; the ISO 16654:2001 analytical method (ISO, 2001), which is designed to
detect only VTEC O157; and finally other PCR–based methods. It is also important to note that the same MS
can have used several different analytical methods depending of the investigation.
Only results for the most important animal species and foods that might serve as a source for human
infection in the EU are presented.
Detailed information on the data reported and on the occurrence of VTEC in the different food categories has
been included in specific tables referenced in Appendix.
EFSA Journal 2015;13(1):3991
71
EU summary report on zoonoses, zoonotic agents and food-borne outbreaks 2013
In total, as regards food, 19 MS and one non-MS reported data on VTEC. Overall, nine MS reported using
the new ISO 13136:2012 analytical method, 10 MS reported having used the ISO 16654:2001 analytical
method and five MS reported using PCR. Of these, some MS have used more than one type of method. All
MS and non-MS reporting VTEC in food have provided information of VTEC serogroups O157, non-O157 or
other serogroups; where detailed information was provided on serogroups, the main reported VTEC
serogroups were O157, O26, O103, O121 and O55.
Bovine meat and unpasteurized (raw) milk
Contaminated bovine meat is considered to be a major source of food-borne VTEC infections in humans. In
2013, twelve MS reported data on VTEC in fresh bovine meat; all from surveillance and monitoring
programmes. A total of 3,898 samples (all single) were tested, and of these low proportions, respectively,
2.5 % and 1.3 % were positive for VTEC and for VTEC O157. Positive findings of serogroup O103 (Belgium
and Slovenia), O26 (France), O87 and O113 (both Germany) in bovine meat were also reported.
MS reported VTEC information by sampling stage (slaughterhouse, processing plant and retail) and those
were low to very low for VTEC and for VTEC O157. The testing results at sampling stage were influenced by
the MS-specific results and by those MS that had conducted most of the testing, especially the Netherlands
at retail and Spain at slaughterhouse level.
Nine MS tested 860 raw milk samples from bovine animals intended for direct human consumption and
2.3 % were VTEC-positive. In addition to three of the serogroups reported from bovine meat (O157, O103
and O26), O145 and O111 were also detected in milk samples. Eight MS also tested VTEC in non-raw milk
and non-raw dairy products such as cheeses, and low to very low proportions, respectively 5.0 % and 0.2 %
were positive for VTEC and for VTEC O157. Testing results at sampling stage were influenced by the
MS-specific results and by those MS that had conducted most of the testing, especially Ireland.
In Finland, every VTEC infection suspected to originate from cattle or farm environment initiates an
investigation at the suspected source farm. In 2013 no VTEC outbreaks occurred in humans, but the
investigation of four human VTEC O157 (sorbitol negative) sporadic cases related to farm visits and/or
consumption of unpasteurised milk was traced back by sampling at the farm level (four different farms). In all
cases, VTEC O157 (sorbitol negative) could be isolated from the samples. In three of these cases,
indistinguishable pulsed field gel electrophoresis (PFGE) genotypes of the isolated strains and the patient
strain suggested the farm as a source of the infection. The isolates recovered from the samples of the four
farms had virulence profiles of vtx1+, vtx2+, eae+ and hlyA+.
In addition, two human cases of a sorbitol-fermenting variant of VTEC O157 and one case each of VTEC
O26 and O103 led to the trace back sampling on the farm level. These VTEC types could not be isolated
from the farm samples and the origin of the infections in humans remained unknown. However, during the
trace back investigations of one of the sorbitol- fermenting VTEC O157 infections, the farm was found
positive for sorbitol negative VTEC O157.
Source: The Finnish National Zoonoses Summary Report, 2013
Ovine meat
Four MS tested in total 67 fresh ovine meat samples and eight (11.9 %) and two (3.0 %) samples tested
positive for VTEC and VTEC O157, respectively. The Netherlands tested 34 samples from retail and found
six (17.7 %) to be positive (all non-O157), and Spain tested eight samples and found one (O157) to be
positive. Austria and Italy found no VTEC-positive samples.
Pig meat
In total, six MS reported testing of 447 fresh pig meat samples from processing plant, retail and
slaughterhouse, with no positive findings of VTEC.
Vegetables and sprouted seeds
In 2013, ten MS reported data on VTEC in vegetables. In total, 1,895 samples were tested, of which Ireland
has reported 51.6 % of the tested samples, Italy reported 20.4 %, Germany reported 6.8 % and Hungary
reported 5.9 %. Only three samples were VTEC-positive (0.2 %); Ireland and Slovakia found one O157
positive sample each. Eight MS reported investigations of RTE sprouted seed with no positive findings.
VTEC serogroups in food
In total 12 MSs provided information on VTEC serogroups in 271 isolates (see submitted and validated data
by the MS available online (http://www.efsa.europa.eu/en/efsajournal/pub/3991.htm). Italy, Spain and Ireland
reported most of the data (34.3 %, 26.9 % and 10.7 % respectively). Depending on the analytical detection
EFSA Journal 2015;13(1):3991
72
EU summary report on zoonoses, zoonotic agents and food-borne outbreaks 2013
method used; Austria, Belgium, Estonia, France, Germany, Ireland and Italy reported several serogroups,
while Hungary, Netherlands and Spain only reported VTEC O157 and non-O157. The most frequently
reported serogroup was VTEC O157 (49.5 %) and these mainly originated from meat from bovine animals
(42.5 %) (fresh meat, minced meat, meat preparations and meat products), meat from pigs (14.9 %) (minced
meat, meat preparations and meat products) and mixed meat (13.4 %). The second most reported
serogroup was VTEC O145 (7.8 %) and were mainly detected in cheese made from unspecified milk
(57.1 %) and milk from cows (28.6 %). Serogroup VTEC O103 was mainly reported from bovine meat (fresh
meat, minced meat, meat preparations and meat products) and cow milk, and serogroup O26 was mainly
reported from cheese made from unspecified milk. Other reported serogroups were VTEC O15, O113, O2,
O22, O78, O136, O146, O76, O87 and O178. Non-VTEC O157 was reported in 21.4 % of the isolates.
3.4.3.
Verocytotoxigenic Escherichia coli in animals
In 2013, 12 MS and one non-MS provided data on VTEC in animals. Spain was the only MS using the new
ISO 13136:2012 analytical method adapted to animal samples. Six MS reported having used the ISO
16654:2001 analytical method adapted to animal samples, which only detects VTEC O157. Italy and
Sweden reported using PCR. Austria reported using a pre-enrichment (containing mitomycin) of rectoanal
swabs that were tested for verocytotoxin production. Positive samples where verocytotoxin was detected
were further processed by plating the enrichments on three different solid media and after incubation by
testing up to five colonies per plate by PCR.
Detailed information on the data reported and on the occurrence of VTEC in the different animal categories
has been included in specific tables referenced in Appendix.
Cattle
Seven MS reported data on VTEC in cattle in 2013. In total, 4,658 samples from both farms and
slaughterhouses were tested, mainly as part of official sampling (19 out of 23 investigations). The overall
proportion of positive VTEC units found in cattle was low as in 2012 (Figure 13).
Other animals: cats, dogs and Gallus gallus (laying hens).
Other meat: meat from pigs and poultry.
Other food: sprouted seed, live bivalve molluscs, juice, other food, spices, herbs and other processed dishes, ready-to-eat food.
Source 2012: Austria, Belgium, Czech Republic, Denmark, Finland, France, Germany, Greece, Hungary, Ireland, Italy, Netherlands,
Poland, Romania, Slovenia, Spain, and Sweden.
Source 2013: Austria, Belgium, Czech Republic, Denmark, Estonia, Finland, France, Germany, Hungary, Italy, Netherlands, Norway,
Poland, Slovakia and Spain.
Figure 13. Proportion of VTEC positive samples in animal/food categories in Member States and nonMember States, 2012-2013
EFSA Journal 2015;13(1):3991
73
EU summary report on zoonoses, zoonotic agents and food-borne outbreaks 2013
In total, in 2013, 6.7 % of the units tested positive for VTEC, 4.3 % were positive for non-O157 and 1.4 %
was positive for VTEC O157. In 2013, the highest proportion of positive findings in cattle was reported by
Austria, who found 30.5 % of the cattle over two years old (59 samples) and 33.8 % of the cattle aged one to
two years (71 samples) were positive for VTEC, using rectoanal swabs. The method is more sensitive than
faecal culture, and this could be the reason why Austria reported a higher VTEC prevalence in cattle than
other MS. In 2013, more than twenty different serogroups were reported from cattle, where the most
frequently reported were O157 (96), O26 (12), O174 (8), O103 (7), O91 (5), O185 (3) and O22 (3).
Pigs
In 2013, three countries reported data for pigs (Germany, Italy and the Netherlands), but only two of them
found VTEC-positive results: the Netherlands (15.8 % positive pens) and Germany (23.0 % positive holdings
and 17.0 % positive animals). The overall proportion of VTEC-positive units was 16.7 % (Figure 13). No
positive samples for the O157 serogroup were reported and no further serogroup information was reported.
In 2012 the overall proportion of VTEC-positive units was 28.7 % (Figure 13) and these data were reported
by two MS (Germany and the Netherlands).
Sheep and goats
In 2013, four MS and one non-MS reported data from sheep and goats. In total, 799 units were tested and
22.7 % were positive for VTEC (none was O157-positive). In 2012, the proportion of positive VTEC units was
9.3 %. Extremely high (above 70 %) non-O157 VTEC-positive proportions in animals were reported in 2013
by the Netherlands in sheep and by Germany in goats. Besides serogroup O157, a range of serogroups
were detected in sheep: O76, O146, O113, O103: O112, O121, O149 and others.
The serotype most commonly reported in the EU and often associated with both outbreaks and sporadic
cases is undoubtedly VTEC O157, which has also been identified as the major cause of HUS in children
(ECDC, 2013; EFSA BIOHAZ Panel, 2013a). Focus has therefore traditionally been on this serotype in many
of the MS’ surveillance programmes. In 2013, VTEC O157 was most commonly detected in ruminants and
meat products thereof (Figure 14).
Proportion positive units
25
20
15
10
5
VTEC
VTEC 0157
0
Categories
Other animal species meat: broilers, deer, goats, horses, other animal species unspecified, pigs, poultry, rabbits, turkeys and wild boars.
Other food: bakery products, beverages non-alcoholic, cereals, crustaceans, egg and egg products, fish and fishery products, mixed red
meat, infant formulae, juice, live bivalve molluscs, molluscan shellfish, mushrooms, nuts and nut products, other food unspecified,
processed food and prepared dishes, ready-to-eat salads, sauces and dressings, snails, soups, spices and herbs, water. Milk and dairy
products exclude raw milk.
Source 2013: Austria, Belgium, Czech Republic, Denmark, Estonia, Finland, France, Germany, Hungary, Italy, Netherlands, Norway,
Poland, Slovakia and Spain.
Figure 14. Proportion of VTEC- and VTEC O157- positive samples in all food/animal categories in
Member States and non-Member States, 2013
EFSA Journal 2015;13(1):3991
74
EU summary report on zoonoses, zoonotic agents and food-borne outbreaks 2013
VTEC serogroups in animals
In total 13 and 1 non-MSs provided information on VTEC serogroups in 377 isolates (see submitted and
validated data by the MS available online (http://www.efsa.europa.eu/en/efsajournal/pub/3991.htm). The
reported VTEC isolates, where detailed information was provided on serogroups, originated mainly from
cattle and from sheep (173 and 115 isolates, respectively). The most frequent reported serogroup in the
reported isolates was VTEC O157 (25.1 %), and the majority of the isolates was detected in cattle (98.1 %).
Other main serogroups reported from cattle was O26 (11 isolates), O174 (8 isolates), O103 (5 isolates), O91
(5 isolates) and O185 (3 isolates).
The distribution of serogroups reported from sheep was more diverse; the most frequent serogroups were
O145 and O146 (17 isolates each), O5 (14 isolates), O76 and O87 (11 isolates each). Other main findings in
sheep were serogroups O166 (8), O113 (7), O75 (4), O91, O128 and O174 (3 each).
Information on serogroups was provided on 48 pig isolates mainly reported by the Netherlands (60.4 %) and
Latvia (31.3 %). All isolates were reported as non-O157 with no further information on the serogroup. Latvia
was the only MS providing information on serogroups in isolates from dogs; 14 isolates of which 8 isolates
were non-O157, O103 (4 isolates), O26 and O121 (1 isolate each). Latvia also provided information from 6
isolates originating from cats; all reported as non-O157.
3.4.4.
VTEC food-borne outbreaks
In 2013, 11 MS reported a total of 73 outbreaks caused by VTEC (excluding one water-borne outbreak),
representing 1.4 % of the total number of reported food-borne outbreaks in the EU. In 2012, nine MS
reported a total of 41 food-borne outbreaks.
Only 12 of the reported outbreaks in the EU were supported by strong evidence. The main food vehicle was
bovine meat and products thereof, reported in four strong-evidence outbreaks, followed by ‘Vegetables and
juices and other products thereof’ (three outbreaks) and cheese (two outbreaks). Each of the remaining three
outbreaks was associated with fish and fishery products, herbs and spices, and other foods.
Information on the setting was provided in all of the 12 strong-evidence outbreaks, although for three
outbreaks the setting was reported as ‘Others’. Three outbreaks were associated with ‘Household’ and with
‘Restaurant, café, pub, bar, hotel, catering service’, while one outbreak was linked to ‘School or
kindergarten’. Contributing factors were unprocessed contaminated ingredients in four outbreaks and
storage time/temperature abuse in one outbreak. For seven outbreaks, the contributing factors were not
reported, unknown or not specified (‘Other’).
In Belgium, an outbreak of bloody diarrhoea and HUS caused by E. coli O157:H7 (vtx2 eae positive)
occurred in June-July 2013. The outbreak involved 18 disseminated cases, of which all were laboratoryconfirmed and could be linked using molecular typing techniques such as IS629- typing. The source of the
outbreak could be traced back to the processing plant by sampling. The patients were infected through the
consumption of raw bovine meat products such as ‘Steak tartare’.
Source: The Belgian National Summary Report, 2013
3.4.5.
Discussion
The EU notification rate of human VTEC infections increased in 2013 compared with 2012. The rates were
also higher in 2012 and 2013 than in the years prior to the largest STEC/VTEC outbreak ever reported in the
EU, which occurred in 2011. This could be an effect of increased awareness and of more laboratories also
testing for serogroups other than O157, and this is possibly reflected by the increase in some non-O157
serogroups. It could also be due to a shift in diagnostic methods, as PCR is becoming more commonly used
for the detection of VTEC in stool samples.
The number of countries reporting information on hospitalisation of their cases increased to sixteen in 2013.
Of the VTEC cases with known hospitalisation status, more than one-third was hospitalised. Some countries
reported very high proportions of hospitalised cases, but had notification rates that were among the lowest,
indicating that the surveillance systems in these countries primarily capture the more severe cases. A low
case-fatality rate (0.36 %; 13 deaths) was reported based on information provided by 18 MS covering almost
60 % of the confirmed VTEC cases. As in previous years, the most commonly reported serogroup was
O157, followed by O26, O103, O145, O91, O111 and O146.
EFSA Journal 2015;13(1):3991
75
EU summary report on zoonoses, zoonotic agents and food-borne outbreaks 2013
The EFSA BIOHAZ Panel concludes in the Scientific Opinion on VTEC-seropathotype and scientific criteria
regarding pathogenicity assessment, that the new ISO/TS 13136:2012 analytical method improves the
strategy for detecting VTEC in food by enlarging the scope of the previous standard to all types of VTEC
(EFSA BIOHAZ Panel, 2013a). Several of the MS have already adopted this typing method in their
surveillance systems, and this might provide more detailed information regarding VTEC serogroups in the
future.
No trends were observed in the presence of VTEC in food and animals. Contaminated bovine meat is
considered to be a major source of food-borne VTEC infections in humans. In 2013, 12 MS reported data on
VTEC in fresh bovine meat and low proportions of single samples were positive for VTEC and for VTEC
O157. A wide range of different VTEC serogroups, including the ones reported from human isolates, was
reported from both cattle and small ruminants and their meat, indicating that both animal species can be the
reservoirs of a diverse range of VTEC strains that are virulent to humans. Small ruminants were reported to
be positive for non-O157 VTEC strains in extremely high proportions by two MS. This is consistent with
sheep and goats to be considered an important source of VTEC strains that are virulent to humans. VTEC
has been considered a hazard of high public health relevance for sheep and goat meat inspection (EFSA,
2013b). There were few reports of positive findings of VTEC in fresh ovine meat but not in fresh pig meat.
According to the Scientific Opinion of the Panel on Biological Hazards on monitoring of VTEC, pigs have not
been identified to be major sources of human VTEC infection in Europe (EFSA, 2007b).
In 2013, a total of 62 outbreaks caused by human pathogenic E. coli (including VTEC) were reported, of
which 12 had strong evidence. The main food vehicle was bovine meat and products thereof, followed by
‘Vegetables and juices and other products thereof’ and cheese.
3.5.
Yersinia
The Appendix contains hyperlinks to all data summarised for the production of this section, for humans, food,
animals and food-borne outbreaks. It also includes hyperlinks to Yersinia summary tables and figures that
were not displayed in this section because they did not trigger any marked observation. The summarised
data are presented in downloadable Excel and PDF files, and are listed by subject. Moreover, all submitted
and validated data by the MS are available online (http://www.efsa.europa.eu/en/efsajournal/pub/3991.htm).
3.5.1.
Yersiniosis in humans
A total of 6,471 confirmed cases of yersiniosis were reported in the EU in 2013 (Table 17). The EU
notification rate was 1.92 cases per 100,000 population, which was a decrease of 2.8 % compared with
2012. The highest country-specific notification rates were observed in Finland and Lithuania (10.12 and
8.82 cases per 100,000 population, respectively).
The majority of yersiniosis cases were reported to be domestically acquired. The largest proportion of travelassociated cases was reported from Sweden and Norway (Table YERSHUMIMPORT).
EFSA Journal 2015;13(1):3991
76
EU summary report on zoonoses, zoonotic agents and food-borne outbreaks 2013
Table 17. Reported cases and notification rates of human yersiniosis in the EU/EEA, 2009-2013
2013
Country
Austria
Belgium(b)
Bulgaria
Croatia(c)
Cyprus
Czech Republic
Denmark
Estonia
Finland
France
Germany
Greece(d)
Hungary
Ireland
Italy (b)
Latvia
Lithuania
Luxembourg
Malta
Netherlands (d)
Poland
Portugal4
Romania
Slovakia
Slovenia
Spain(e)
Sw eden
United Kingdom
National
Data
Coverage (a) Form at (a)
Y
N
Y
Y
Y
Y
Y
Y
Y
N
Y
Y
Y
N
Y
Y
Y
Y
Y
Y
Y
Y
N
Y
Y
2012
Total
Cases
C
C
A
A
C
C
C
C
C
A
C
C
C
C
C
C
C
C
C
C
C
C
C
C
C
159
350
22
11
1
526
345
72
549
430
2590
62
4
25
25
264
15
0
199
43
165
26
243
313
59
2011
2010
2009
Confirm ed
Confirm ed
Confirm ed
Confirm ed
Confirm ed
Cases & Rates Cases & Rates Cases & Rates Cases & Rates Cases & Rates
Cases Rate Cases
158
1.87
130
350
256
22
0.30
11
1
0.12
0
526
5.00
611
345
6.16
291
72
5.45
47
549 10.12
565
430
462
2578
3.15
2686
62
0.63
53
4
0.09
2
25
14
25
1.24
28
262
8.82
276
15
2.79
66
0
0.00
0
199
0.52
201
43
0.22
26
164
3.03
181
26
1.26
22
243
1.75
221
313
3.28
303
59
0.09
54
Rate
Cases Rate
Cases Rate Cases Rate
1.55
119
1.42
84
1.00
140
1.68
214
216
238
0.15
4
0.05
5
0.07
8
0.11
0.00
0
0.00
0
0.00
0
0.00
5.82
460
4.39
447
4.27
463
4.44
5.22
225
4.05
193
3.49
238
4.32
3.55
69
5.19
58
4.35
54
4.04
10.46
554 10.31
522
9.75
633 11.88
294
238
208
3.29
3381
4.15
3346
4.10
3731
4.56
0.54
93
0.95
87
0.88
51
0.52
0.04
6
0.13
3
0.07
3
0.07
15
15
11
1.37
28
1.35
23
1.09
45
2.08
9.19
370 12.12
428 13.62
483 15.17
12.58
33
6.45
74 14.74
36
7.30
0.00
0
0.00
1
0.24
0
0.00
0.52
235
0.61
205
0.54
288
0.76
0.13
47
0.24
27
0.14
5
0.03
3.35
166
3.08
166
3.08
167
3.10
1.07
16
0.78
16
0.78
27
1.33
1.91
264
2.28
325
2.81
291
2.52
3.20
350
3.72
281
3.01
397
4.29
0.09
59
0.09
55
0.09
61
0.10
EU Total
-
-
6498
6471
1.92
6506
1.98
7002
2.23
6815
2.19
7578
2.46
Iceland
Liechtenstein
Norw ay
Y
Y
C
C
0
55
0
55
0.00
1.09
43
0.86
60
1.22
52
1.07
60
1.25
(a): Y, yes; N, no; A, aggregated data; C, case-based data; -, no report.
(b): Sentinel surveillance; no information on estimated coverage. Thus, notification rate cannot be estimated.
(c): All cases of unknown case classification
(d): No surveillance system.
(e): Sentinel system; notification rates calculated with an estimated population coverage of 30 % in 2013 and 25 % in 2009-2012.
There was a statistically significant (p=0.001) decreasing five-year trend in the EU in 2009–2013 (Figure 15).
More cases were normally reported between May and September compared with other months.
EFSA Journal 2015;13(1):3991
77
EU summary report on zoonoses, zoonotic agents and food-borne outbreaks 2013
Source: Austria, Belgium, Cyprus, Czech Republic, Denmark, Estonia, Finland, Germany, Hungary, Ireland, Italy, Latvia, Lithuania,
Malta, Norway, Poland, Romania, Slovakia, Slovenia, Spain, Sweden and United Kingdom. Bulgaria, Croatia, Iceland, France
and Luxembourg did not report data over the whole period at the level of detail required for the analysis. Greece, the
Netherlands and Portugal do not have any formal surveillance system for the disease.
Figure 15. Trend in reported confirmed cases of human yersiniosis in the EU/EEA, 2009–2013
Species information was reported for 6,395 (98.0 %) of the confirmed yersiniosis cases in the EU/EEA in
2013. Y. enterocolitica was the most common species reported, having been isolated from 98.66 % of the
confirmed cases. It was followed by Y. pseudotuberculosis, which represented 0.94 %, while the remaining
0.41 % were other species. For species distribution by country, see Table YERSHUMSPECIES.
Twelve MS provided information on hospitalisation for some or all of their cases, accounting for 15.3 % of
confirmed yersiniosis cases in the EU. Among these, almost half (48.4 %) were hospitalised in 2013. The EU
case-fatality rate was 0.05 %; two fatal cases due to infections with Y. pseudotuberculosis were reported in
2013 among the 4,036 confirmed yersiniosis cases for which this information was reported (62.4 % of all
confirmed cases). As for most diseases, however, the case-fatality rate should be interpreted with caution,
as the final outcome of cases is often unknown after the initial sampling.
3.5.2.
Yersinia in food and animals
Comparability of data
At present there is no harmonised surveillance of Yersinia in the EU and, when interpreting the Yersinia
data, it is important to note that data from different investigations are not necessarily directly comparable
owing to differences in sampling strategies and the used testing methods. A scientific report from EFSA
suggested harmonised specifications for the monitoring and reporting of Y. enterocolitica in slaughter pigs
(EFSA, 2009b). Only Austria, Belgium, Estonia and Slovakia provided information on the microbiological test
used. They reported using the microbiological test ISO 10273:2003 (ISO, 2003), which is a horizontal
method for the detection of Y. enterocolitica presumed to be pathogenic to humans. It is applicable to
products intended for human consumption and the feeding of animals, and environmental samples in the
area of food production and food handling.
Only results for the most important animal species and foods that might serve as a source for human
infection in the EU are presented.
Food
In 2013, nine MS and one non-MS provided data on food tested for Yersinia, and particularly for
Y. enterocolitica. Data were provided on samples from meat, milk, cheeses and other dairy products,
vegetables, and other types of food and prepared dishes.
EFSA Journal 2015;13(1):3991
78
EU summary report on zoonoses, zoonotic agents and food-borne outbreaks 2013
In 2013, five of six MS reported Yersinia-positive findings in pig meat and products thereof. Overall, 6.4 % of
the tested 1,700 pig meat samples were positive for Yersinia. Y. enterocolitica was found in 102 (6 %) of the
positive samples. Sampling was mainly carried out as part of surveillance or monitoring programmes. From
retail, 478 samples were investigated and 5.4 % were found to be Yersinia-positive, mainly Y. enterocolitica.
Serotypes O:3 and O:9 were detected in food, and both were mainly found in pig meat, being serotype O:3
the predominant one. Compared with 2012, where only four MS delivered data, the number of tested
samples was considerably higher in 2013 (1,700 vs. 479 samples in 2012). In 2013, however, the proportion
of samples with Yersinia was at a level comparable to 2012, albeit slightly lower (6.4 % vs. 7.7 % in 2012).
In 2013, four MS reported Yersinia in bovine meat or products thereof. In total, 46 samples (mainly
surveillance) were tested and 10.9 % were found to be positive for Yersinia compared with 15.0 % in 2012
(Figure 16). Four MS reported on Yersinia in milk and dairy products and found 8.9 % to be Yersinia-positive
out of 202 samples.
Only Spain reported testing of ovine meat in 2013 and had no positive findings.
Germany and Slovenia had Yersinia-positive findings in unpasteurised (raw) cow’s milk intended for direct
human consumption.
Four MS and one non-MS reported findings of Y. pseudotuberculosis in various foods (cow’s and goat’s milk,
bovine meat and minced bovine and pig meat).
Detailed information on the data reported and on the occurrence of Yersinia in the different food categories
has been included in specific tables referenced in the Appendix.
Proportion of positive samples
16
14
12
10
8
2012
6
2013
4
2
0
Milk and dairy Ovine meat
2012: 2 MS
2013: 4 MS
2012: 1 MS
2013: 1 MS
Pig meat
Bovine meat
2012: 4 MS
2013: 6 MS
2012: 4 MS
2013: 4 MS
Source 2012: Belgium, Germany, Italy and Spain.
Source 2013: Austria, Belgium, Estonia, Germany, Italy, Slovakia, Slovenia and Spain.
Figure 16. Proportion of Yersinia-positive samples in food in Member States, 2012-2013
Animals
In 2013, 12 MS and one non-MS provided data from investigations in animals for Yersinia. Eight MS reported
on Yersinia in pigs. In total, 6.9 % of 5,892 samples were positive. Most positive findings were reported as
Y. enterocolitica. The number of tested pigs reported in 2013 was higher than the number reported in 2012,
where 5,481 pigs were reported tested. In both years, the serotypes reported as detected in pigs were
serotype O:3 and O:9.
Generally, the proportion of positive samples found in pigs, domestic animals (other than pigs) and other
animals was higher in 2013 than in 2012 (Figure 17). The observed increases might primarily reflect
differences in reporting MS and the animal species being tested.
Four MS tested 6,644 samples and reported 62 positive findings of Y. enterocolitica in cattle (0.9 %). Three
MS reported information on Y. enterocolitica in sheep and goats (961 tested units and 6 positive findings).
EFSA Journal 2015;13(1):3991
79
EU summary report on zoonoses, zoonotic agents and food-borne outbreaks 2013
The predominant serotypes reported as detected in cattle were serotype O:3 and O:9, with serotype O:9 as
the slightly predominant serotype.
Y. enterocolitica was also detected in dogs, deer, foxes, hares, roe deer, squirrels and hunted wild boars.
Italy reported the only Y. enterocolitica serotype that was identified to be O:5, with 27 positive samples
detected in wild boars.
Detailed information on the data reported and on the occurrence of Yersinia in the different animal categories
has been included in specific tables referenced in Appendix.
Proportion of positive samples
8
7
6
5
4
2012
2013
3
2
1
0
Pigs
2012: 4 MS + 1 non-MS
2013: 8 MS
Domestic, excluding pigs
2012: 3 MS
2013:species
4 MS
Animal
Other animals
2012: 5 MS
2013: 4 MS
Source 2012: Germany, Hungary, Italy, Latvia, Netherlands, Poland and Switzerland.
Source 2013: Bulgaria, Estonia, Germany, Hungary, Italy, Netherlands, Poland, Spain and United Kingdom.
Domestic animals, excluding pigs: cattle, Gallus gallus, goats, other poultry, sheep, solipeds and turkeys.
Other animal species: badgers, Cantabrian chamois, cats, deer, dogs, stray dogs, foxes, hedgehogs, monkeys, other animals, pigeons,
squirrels, swans, wild animals, wild boars and zoo animals.
Figure 17. Proportion of Yersinia-positive samples in animals in Member States and non-Member
States, 2012-2013
Spain has a monitoring programme in fattening pigs at slaughter, and, in 2013, Y. enterocolítica was
detected in 38.7 % of the slaughter batches tested. All the strains belonged to biotype 4 serotype O:3.
Source: The Spanish National Summary Report, 2013
Switzerland carried out a Yersinia prevalence study in tonsils in slaughter pigs from March 2012 to February
2013 in accordance with the technical specifications for harmonised national surveys on Y. enterocolitica in
slaughter pigs (EFSA, 2009b). In total, 229 of 410 tonsils of slaughter pigs were positive for Y. enterocolitica
using culture methods in accordance with ISO 10273:2003 (56 %; 95 % Confidence interval (CI): 51-61 %).
All isolates except one belonged to the potentially human pathogenic biotypes; 74 % were biotype 4/serotype
O:3: and 16 % were biotype 3/serotype O:5,27. Other rare findings were biotypes 3/O:5, 3/O:9, 4/O:5 and
4/O:5,27. Biotype 1A was detected in only one sample.
Source: The Swiss National Summary report, 2013
In the United Kingdom a study to estimate the prevalence of Yersinia was carried out in 2013. The study
design was consistent, where possible, with the technical specifications for the EU baseline survey for
Salmonella in slaughter pigs, with a target sample size of 600 pigs. The study was carried out at the
14 largest abattoirs of the 169 approved premises in the United Kingdom, who process 80 % of pigs
slaughtered in the United Kingdom.
EFSA Journal 2015;13(1):3991
80
EU summary report on zoonoses, zoonotic agents and food-borne outbreaks 2013
Overall, 624 carcase swabs and 620 tonsil samples from 624 pigs were tested for the presence of Yersinia.
For tonsil samples, the prevalence was 32.9 % (95 % CI: 28.8-37.0 %), after accounting for clustering within
farms, and for carcase swabs the prevalence was 1.9 % (95 % CI: 0.8-3.0). Of the 620 pigs for which both
sample types were collected, 10 (1.6 %) pigs tested positive in both samples, with the remaining
196 (31.6 %) pigs testing positive in only one sample.
The majority of the positive pigs (87.3 %) and carcases (91.7 %) were infected with Y. enterocolitica. A
further 21 (10.3 %) of the positive pigs were infected with Y. pseudotuberculosis. Roughly one quarter of the
pigs aged < 6 months and > 12 months were found to carry Yersinia in the tonsils, compared with roughly
one-third of those aged 6-12 months. All the positive carcase swabs were from pigs aged 6-12 months.
Source: The United Kingdom National Summary Report, 2013
3.5.3.
Yersinia food-borne outbreaks
In the period 2007–2012, a total of 104 food-borne Yersinia outbreaks were reported by the MS (14 with
strong evidence). The food vehicle was identified in only ten outbreaks; in three outbreaks, the source was
contaminated vegetables (raw grated carrot (one) and RTE salad (two)), one outbreak was due to pig meat
and one outbreak was due to a RTE product contaminated with pig meat juice. Sources for five outbreaks
were classified as ‘Other’ food or ‘Mixed food’. In 2013, eight outbreaks were reported in the EU; with
16 human cases involved, of which two hospitalised. The source was identified as meat and meat products
in the one outbreak reported with strong evidence. In addition, in 2013, Norway and Switzerland reported
one weak-evidence Yersinia outbreak each.
3.5.4.
Discussion
Yersiniosis was the third most commonly reported zoonosis in the EU in 2013, even considering the
significantly decreasing trend in 2009–2013. The highest notification rates were reported in MS in northeastern Europe. Although Y. enterocolitica was the dominating species among cases, both fatal cases
reported in 2013 were infected with Y. pseudotuberculosis.
Yersinia was not presented in the Zoonoses Summary report in 2012 and some of the data are presented in
the current report and compared with data reported in 2013; however, there are not enough data to draw
conclusions regarding trends between the years.
Pigs are considered to be a major reservoir for Yersinia, and pork products are considered to be the most
important source for pathogenic Y. enterocolitica infection in humans. In 2013, five MS reported positive
findings for Yersinia (mostly Y. enterocolitica) in pig meat and products thereof. Positive findings were also
reported in bovine meat and unpasteurised (raw) cow’s milk intended for direct human consumption. Positive
findings were also reported in other animal species, including wild animals, cattle, sheep, goats, dogs, cats,
solipeds, etc.
According to the Opinion published by the BIOHAZ Panel in 2007 (EFSA, 2007c), the majority of human
pathogenic Y. enterocolitica strains in Europe belong to biotype 4 (serotype O:3), followed by biotype 2
(serotype O:9 and O:5,27). Biotypes 1B, 3 and 5 are also human pathogenic, whereas biotype 1A is
considered mainly to be nonpathogenic. Therefore, it is crucial that information is provided on the biotype of
each Y. enterocolitica isolate in order to gauge its public health significance. It is recommended that
biotyping, and preferably also serotyping, is increased in the future. Only a small amount of information is
provided on serotypes in the reporting system for Yersinia. Hopefully, an increased focus on the reported
Yersinia data and more sensitive methods will improve the detailed information on Yersinia in the future.
Two prevalence studies of Yersinia have been carried out by Switzerland and the United Kingdom; both
studies had higher levels of Yersinia-positive samples in slaughter pigs than reported from the monitoring
programmes in the EU. This discrepancy in findings might be due to the use of a more sensitive test in those
prevalence studies, i.e. bacteriological examination of tonsils of slaughter pigs.
3.6.
Tuberculosis due to Mycobacterium bovis
The Appendix contains hyperlinks to all data summarised for the production of this section, for humans and
animals. It also includes hyperlinks to M. bovis summary tables and figures that were not displayed in this
section because they did not trigger any marked observation. The summarised data are presented in
downloadable Excel and PDF files, and are listed by subject. Moreover, all submitted and validated data by
the MS are available online (http://www.efsa.europa.eu/en/efsajournal/pub/3991.htm).
EFSA Journal 2015;13(1):3991
81
EU summary report on zoonoses, zoonotic agents and food-borne outbreaks 2013
3.6.1.
Mycobacterium bovis in humans
In 2013, 134 confirmed cases of human tuberculosis due to M. bovis were reported in the EU by nine MS
(Table 18). The EU notification rate was 0.03 cases per 100,000 population and did not change compared
with 2012. Most cases were reported in Germany, the United Kingdom and Spain, while the highest
notification rate, 0.13 cases per 100,000 population, was reported in Ireland.
Table 18. Reported cases and notification rates per 100,000 of human tuberculosis due to M. bovis in
(a)
the EU/EEA, 2009-2013; OTF status is indicated
Country
Austria (OTF)
2013
2012
2011
2010
2009
National
Data
Confirm ed Confirm ed Confirm ed Confirm ed Confirm ed
Coverage (b) Form at (b) Cases Rate Cases Rate Cases Rate Cases Rate Cases Rate
Y
Y
C
1 0.01
1 0.01
0 0.00
4 0.05
2 0.02
Belgium (OTF)
C
12 0.11
4 0.04
5 0.05
9 0.08
3 0.03
Bulgaria
Y
C
0 0.00
0 0.00
2 0.03
0 0.00
0 0.00
Croatia
Y
C
0 0.00
0 0.00
-
-
Cyprus
Y
C
0 0.00
0 0.00
0 0.00
0 0.00
0 0.00
Czech Republic (OTF)
Y
C
0 0.00
0 0.00
4 0.04
0 0.00
0 0.00
Denmark (OTF)
Y
C
0 0.00
0 0.00
1 0.02
2 0.04
0 0.00
Estonia (OTF)
Y
C
0 0.00
0 0.00
0 0.00
0 0.00
0 0.00
Finland (OTF)
Y
C
1 0.02
0 0.00
0 0.00
0 0.00
0 0.00
France (OTF) (c)
Y
C
-
-
-
-
Germany (OTF)
Y
C
45 0.05
50 0.06
47 0.06
47 0.06
57 0.07
Greece
Y
C
0 0.00
0 0.00
0 0.00
0 0.00
0 0.00
Hungary
Y
C
0 0.00
0 0.00
0 0.00
0 0.00
0 0.00
Ireland
Y
C
6 0.13
4 0.09
6 0.13
12 0.26
8 0.18
Italy (d),(e)
Y
C
6 0.01
9 0.02
15 0.03
15 0.03
6 0.01
Latvia (OTF)
Y
C
0 0.00
0 0.00
0 0.00
0 0.00
0 0.00
Lithuania
Y
C
0 0.00
0 0.00
0 0.00
0 0.00
0 0.00
Luxembourg (OTF)
Y
C
0 0.00
0 0.00
0 0.00
0 0.00
0 0.00
Malta
Y
C
0 0.00
0 0.00
0 0.00
0 0.00
0 0.00
Netherlands (OTF)
Y
C
9 0.05
8 0.05
11 0.07
13 0.08
11 0.07
Poland (OTF)
Y
C
0 0.00
0 0.00
0 0.00
0 0.00
0 0.00
Portugal
Y
C
0 0.00
0 0.00
0 0.00
0 0.00
1 0.01
Romania
Y
C
0 0.00
0 0.00
1 0.01
0 0.00
0 0.00
Slovakia (OTF)
Y
C
0 0.00
0 0.00
0 0.00
0 0.00
0 0.00
Slovenia (OTF)
Y
C
0 0.00
0 0.00
0 0.00
0 0.00
0 0.00
Spain
Y
C
25 0.05
14 0.03
23 0.05
34 0.07
17 0.04
-
-
-
-
-
-
-
-
-
-
Sw eden (OTF)
Y
C
0 0.00
5 0.05
2 0.02
2 0.02
5 0.05
United Kingdom(f)
EU Total
Y
-
C
-
29 0.05
134 0.03
39 0.06
134 0.03
39 0.06
156 0.04
37 0.06
175 0.04
29 0.05
139 0.03
Iceland (g)
Y
C
0 0.00
0 0.00
0 0.00
0 0.00
0 0.00
Liechtenstein (OTF)
-
-
-
-
-
-
-
-
-
-
-
-
Norw ay (OTF)
Y
C
0 0.00
2 0.04
2 0.04
2 0.04
1 0.02
Sw itzerland(h)
Y
C
2 0.02
5 0.06
13 0.17
6 0.08
4 0.05
(a): OTF, officially tuberculosis free.
(b): yes; N, no; A, aggregated data; C, case-based data; -, no report.
(c): Not reporting species of the M. tuberculosis complex.
(d): In Italy, 6 regions and 15 provinces are OTF.
(e): All cases reported from Italy to TESSy in 2009–2013 were without laboratory results but were still included in the table, since they
were reported as M. bovis.
(f): In the United Kingdom, Scotland is OTF.
(g): In Iceland, which has no special agreement concerning animal health (status) with the EU, the last outbreak of bovine tuberculosis
was in 1959.
(h): Switzerland provided data directly to EFSA.
As tuberculosis is a chronic disease with a long incubation period, it is not possible to assess travelassociated cases in the same way as diseases with acute onset. Instead, the distinction is made between
individuals with the disease born in the reporting country (native infection) and those moving there at a later
stage (foreign infection). In a few cases, the distinction is also made based on nationality of the cases. On
EFSA Journal 2015;13(1):3991
82
EU summary report on zoonoses, zoonotic agents and food-borne outbreaks 2013
average, 61.2 % of the cases reported in 2013 were native to the reporting country, 35.8 % were foreign and
3.0 % were of unknown origin (Table MBOVHUMORIGIN). Among cases with known origin, there was a
larger proportion (71.9 %) of native cases in countries not free of bovine tuberculosis than in countries that
were officially tuberculosis free (54.5 %).
3.6.2.
Tuberculosis due to Mycobacterium bovis in cattle
The officially tuberculosis free status (OTF) in 2013 is presented in Figure 18 and in Figure 19. As in 2012,
Austria, Belgium, the Czech Republic, Denmark, Estonia, Finland, France, Germany, five Italian regions and
17 Italian provinces, Latvia, Luxembourg, the Netherlands, all administrative regions within the superior
administrative unit of the Algarve in Portugal, Poland, Slovakia, Slovenia, Sweden, Scotland in the United
29
Kingdom, Norway and Switzerland were OTF in accordance with EU legislation (Decision 2012/204/EU ).
Liechtenstein has the same status (OTF) as Switzerland. In Iceland, which has no special agreement
concerning animal health status with the EU, the last outbreak of bovine tuberculosis was in 1959.
MS Bulgaria, Croatia, Cyprus, Greece, Hungary, Ireland, Italy, Lithuania, Malta, Portugal, Romania, Spain
and the United Kingdom did not yet achieve the country-level OTF status in 2013. Croatia, as a new MS,
reported information for the first time in 2013.
Figure 18. Status of countries regarding bovine tuberculosis, 2013
29
Commission Implementing Decision 2012/204/EU of 19 April 2012 amending the Annexes to Decision 2003/467/EC as regards the
declaration of Latvia as officially brucellosis-free Member State and of certain regions of Italy, Poland and Portugal as officially
tuberculosis-free, brucellosis-free and enzootic-bovine-leukosis-free regions. OJ L 109, 21.4.2012, p. 26–32.
EFSA Journal 2015;13(1):3991
83
EU summary report on zoonoses, zoonotic agents and food-borne outbreaks 2013
Proportions of M. bovis-positive cattle herds are displayed only if they are above the legal threshold of 0.1 %.
* Proportions relate to the non-OTF regions
Figure 19. Proportion of existing cattle herds infected with or positive for M. bovis, 2009-2013
2
Proportion of herds (%)
1.8
1.6
1.4
1.2
EU OTF regions
1
0.8
EU non-OTF regions
0.6
EU all
0.4
0.2
0
2009
2010
2011
2012
2013
Year
Data reported by countries that are MS during the current year are included. The classification of the OTF and non-OTF status of a
region is based on Figure 18.
Figure 20. Proportion of existing cattle herds infected with or positive for M. bovis, 2013
In the 15 OTF MS and in the OTF regions of non-OTF MS, annual surveillance programmes are carried out
to confirm freedom from bovine tuberculosis. Bovine tuberculosis was not detected in cattle herds in 10 of
the OTF MS, or in Iceland, Norway or Switzerland. However, in total, out of the 1,384,692 existing cattle
herds in all OTF regions of the EU, Norway and Switzerland, 207 herds were infected with M. bovis: Belgium
(9 herds), France (112 herds), Germany (46 herds), Veneto region of Italy (4 herds), the Netherlands
(3 herds), Poland (20 herds), Scotland (3 herds) and Switzerland (10 herds). In the EU OTF regions, the
proportion of herds infected with M. bovis was 0.015 % in 2013, which is the same as reported in 2012.
EFSA Journal 2015;13(1):3991
84
EU summary report on zoonoses, zoonotic agents and food-borne outbreaks 2013
All 13 MS containing a non-OTF region have a national eradication programme for bovine tuberculosis in
place. In 2013, the five MS Ireland, Italy, Portugal, Spain and United Kingdom received EU co-financing for
their eradication programme and they reported the number of positive herds (Table DSTUBCOF), whereas
MS not receiving EU co-financing reported the number of infected herds (Table DSTUBNONCOF). The noncofinanced MS, Cyprus, Lithuania and Malta did not report any infected herd. Infected herds were reported
by Bulgaria (9 herds), Croatia (53 herds), Greece (221 herds), Hungary (6) and Romania (50), whereas
positive herds were reported by Ireland (4,640 herds), Italy (490 herds), Portugal (108 herds), Spain (1,526
herds) and the United Kingdom (10,956). In total, out of the 1,362,234 existing cattle herds in the EU nonOTF regions, 18,256 herds were infected with or positive for M. bovis in 2013. This group of infected/positive
herds represents 1.33 % of the total number of herds in the EU non-OTF regions, which is similar to the
1.32 % reported in 2012 (Figure 20). Overall, in the EU OTF and non-OTF regions (‘EU all’ in Figure 20), the
proportion of herds infected with M. bovis was 0.68 % in 2013, which is similar to the 0.67 % reported in
2012.
In 2013, 16 MS and two non-MS investigated animal species other than cattle for M. bovis. M. bovis was
reported in 903 animals other than cattle: alpacas (34), badgers (270), bison (17), cats (26), deer (149),
dogs (3), fox (1), goats (109), guinea pig (1), lamas (3), pet animal (1), pigs (35), sheep (6), wild boars (247)
and zoo animal (1) (Table TUBOTHERAN). Seventeen MS and two non-MS investigated animals for
Mycobacterium species other than M. bovis. M. tuberculosis was reported in one red deer and M. caprae
was reported in 544 animals by four MS (Austria, Germany, Hungary and Spain): cattle (113), deer (1),
fox (1), goats (351), sheep (3) and wild boar (75) (Table TUBOTHERSP).
3.6.3.
Discussion
Tuberculosis due to M. bovis is a rare infection in humans in the EU, with 134 confirmed human cases
reported in 2013. The case numbers in the EU have been stable over the last two years. There was no clear
association between a country’s status as OTF and notification rates in humans. This could be due to many
of the cases in both OTF and non-OTF countries having immigrated to the country; thus, the infection might
have been acquired in their country of origin. Cases native to the country could have been infected before
the disease was eradicated from the animal population, as it may take years before disease symptoms
develop.
The overall proportion of cattle herds infected with or positive for M. bovis remained very low in the EU
(0.68 % of the existing herds in the EU), although there is a heterogeneous distribution of M. bovis in
Europe. The prevalence ranges from absence of infected/positive animals in many OTF regions to a
prevalence of 12.1 % in the non-OTF regions of the United Kingdom (England, Northern-Ireland and Wales).
After a slight increase in the proportion of herds infected with or positive for M. bovis between 2009 and 2012
(0.45 % to 0.67 % of the existing herds), this number entered a plateau phase from 2012 to 2013. The
number of herds infected with M. bovis reported by France was lower in 2013 than in 2012, whereas higher
numbers were reported by Belgium, Germany, Italy and Poland. In the non-OTF regions, the number of
herds infected with or positive for M. bovis was similar in 2012 and 2013 and no major changes were
observed within the non-OTF MS or parts thereof.
3.7.
Brucella
The Appendix contains hyperlinks to all data summarised for the production of this section, for humans, food,
animals and food-borne outbreaks. It also includes hyperlinks to Brucella summary tables and figures that
were not displayed in this section because they did not trigger any marked observation. The summarised
data are presented in downloadable Excel and PDF files, and are listed by subject. Moreover, all submitted
and validated data by the MS are available online (http://www.efsa.europa.eu/en/efsajournal/pub/3991.htm).
3.7.1.
Brucellosis in humans
In 2013, 26 MS and two non-MS provided information on brucellosis in humans. Ten MS (Belgium, Croatia,
Cyprus, the Czech Republic, Estonia, Finland, Hungary, Luxembourg, Romania and Slovenia) and Iceland
reported no human cases. In total, 390 cases of human brucellosis, of which 357 were confirmed, were
reported in the EU in 2013 (EU notification rate 0.08 cases per 100,000 population) (Table 19). This was a
9.5 % increase in notification rate compared with 2012, partly attributable to the exclusion of Italy in the
notification rate calculations in 2013 owing to no reporting.
EFSA Journal 2015;13(1):3991
85
EU summary report on zoonoses, zoonotic agents and food-borne outbreaks 2013
Table 19. Reported cases and notification rates per 100,000 of human brucellosis in the EU/EEA,
(a)
2009-2013; OBF and ObmF status is indicated
2013
Country
National
Data
Coverage (b) Form at (b)
Total
Cases
Confirm ed
Cases &
Rates
2012
Confirm ed
Cases &
Rates
2011
Confirm ed
Cases &
Rates
2010
Confirm ed
Cases &
Rates
2009
Confirm ed
Cases &
Rates
Cases Rate Cases Rate Cases Rate Cases Rate Cases Rate
Austria (OBF/ObmF)
Belgium (OBF/ObmF)
Bulgaria
Cyprus
Croatia
Czech Republic (OBF/ObmF)
Denmark(c) (OBF/ObmF)
Estonia (OBF/ObmF)
Finland (OBF/ObmF)
France(d)(OBF)
Germany (OBF/ObmF)
Greece
Hungary (ObmF)
Ireland (ObmF)
Italy (e)
Latvia
Lithuania
Luxembourg (OBF/ObmF)
Malta
The Netherlands (OBF/ObmF)
Poland (ObmF)
Portugal(f)
Romania (ObmF)
Slovakia (OBF/ObmF)
Slovenia (ObmF)
Spain(g)
Sw eden (OBF/ObmF)
United Kingdom(h) (OBF/ObmF)
EU Total
Iceland(i)
Liechtenstein
Norw ay (OBF/ObmF)
Sw itzerland(j)
Y
Y
Y
Y
Y
Y
Y
Y
Y
Y
Y
Y
Y
Y
Y
Y
Y
Y
Y
Y
Y
Y
Y
Y
Y
Y
Y
Y
Y
C
A
A
C
C
C
C
C
C
C
C
C
C
C
C
C
C
C
C
C
C
C
C
C
C
C
C
C
C
7
0
1
0
0
0
0
0
29
28
160
0
1
1
2
0
1
5
1
34
0
1
0
94
10
15
390
0
2
4
7
0
0
0
0
0
0
0
19
26
159
0
1
1
2
0
1
5
1
22
0
1
0
87
10
15
357
0
2
4
0.08
0.00
0.00
0.00
0.00
0.00
0.00
0.00
0.03
0.03
1.44
0.00
0.02
0.05
0.07
0.00
0.24
0.03
0.00
0.21
0.00
0.02
0.00
0.19
0.11
0.02
0.08
0.00
0.04
0.05
2
4
1
0
0
0
0
1
28
28
123
0
2
53
0
0
0
0
3
0
37
0
1
0
62
13
14
372
0
4
3
0.02
0.04
0.01
0.00
0.00
0.00
0.00
0.02
0.04
0.03
1.11
0.00
0.04
0.09
0.00
0.00
0.00
0.00
0.02
0.00
0.35
0.00
0.02
0.00
0.13
0.14
0.02
0.07
0.00
0.08
0.04
5
5
2
0
0
0
0
21
24
98
0
1
166
0
0
1
0
1
0
76
1
0
1
43
11
25
481
0
2
8
0.06
0.05
0.03
0.00
0.00
0.00
0.00
0.03
0.03
0.88
0.00
0.02
0.28
0.00
0.00
0.20
0.00
0.01
0.00
0.73
0.01
0.00
0.05
0.09
0.12
0.04
0.10
0.00
0.04
0.10
3
0
2
0
1
0
0
20
22
97
0
1
171
0
0
1
0
6
0
88
2
1
0
78
12
12
517
0
2
5
0.04
0.00
0.03
0.00
0.01
0.00
0.00
0.03
0.03
0.87
0.00
0.02
0.29
0.00
0.00
0.20
0.00
0.04
0.00
0.85
0.01
0.02
0.00
0.17
0.13
0.02
0.11
0.00
0.04
0.06
2
1
3
0
0
0
1
19
19
106
0
0
167
0
1
0
0
3
3
80
3
0
2
114
7
17
548
0
0
14
0.02
0.01
0.04
0.00
0.00
0.00
0.02
0.03
0.02
0.95
0.00
0.00
0.28
0.00
0.03
0.00
0.00
0.02
0.01
0.77
0.02
0.00
0.10
0.25
0.08
0.03
0.11
0.00
0.00
0.18
(a): OBF/ObmF, officially brucellosis free/officially B. melitensis free in cattle or sheep/goat populations.
(b): Y, yes; N, no; A, aggregated data; C, case-based data; -, no report.
(c): No surveillance system.
(d): In France, 64 departments are ObmF and no cases of brucellosis have been reported in small ruminants since 2003.
(e): In Italy, 10 regions and 11 provinces are OBF and 11 regions and 8 provinces are ObmF.
(f): In Portugal, six islands of the Azores and the superior administrative unit of the Algarve are OBF, whereas all nine Azores islands
are ObmF.
(g): In Spain, two provinces of the Canary Islands, the Balearic Islands and Basque Country are OBF/ObmF; Murcia and La Rioja are
OBF; and Asturias, Cantabria, Castile and Leon, and Galicia are ObmF.
(h): In the United Kingdom, England, Scotland and Wales in Great Britain and the Isle of Man are OBF, and the whole of the United
Kingdom is ObmF.
(i): In Iceland, which has no special agreement concerning animal health (status) with the EU, brucellosis (B. abortus, B. melitensis,
B. suis) has never been reported.
(j): Switzerland provided data directly to EFSA
As in previous years, low notification rates were observed in MS with the status ‘officially free of bovine
brucellosis’ (OBF, Figure 22 and/or officially free of ovine and caprine brucellosis caused by B. melitensis
(ObmF, Figure 25). The majority of brucellosis cases in these countries were reported to have been
imported/travel-associated (Table BRUCHUMIMPORT). The highest notification rates of brucellosis were
reported in the Mediterranean MS that are not officially brucellosis-free in cattle, sheep or goats; Greece
(1.44 per 100,000 population), Malta (0.24/100,000), Portugal (0.21/100,000) and Spain (0.19/100,000),
which together accounted for 75.4 % of all confirmed cases reported in 2013 (Table 19). The case in Malta
was reported as imported/travel-associated. Italy did not report on human brucellosis cases in 2013 and had
cases in 2012 and before.
There was some seasonality observed in the number of confirmed brucellosis cases reported in the EU in
2009–2013, with more cases reported in April to September, but no significant increasing or decreasing EU
trend in the period (Figure 21).
EFSA Journal 2015;13(1):3991
86
EU summary report on zoonoses, zoonotic agents and food-borne outbreaks 2013
Source: Austria, Cyprus, Czech Republic, Estonia, Finland, France, Germany, Greece, Hungary, Iceland, Ireland, Latvia, Lithuania,
Malta, Netherlands, Norway, Poland, Portugal, Romania, Slovakia, Slovenia, Spain, Sweden, and United Kingdom. Belgium,
Bulgaria, Croatia, Italy and Luxembourg did not report data over the whole period at the level of detail required for the analysis.
Denmark does not have a surveillance system for this disease.
Figure 21. Trend in reported confirmed cases of human brucellosis in the EU/EEA, 2009-2013
Nine MS provided data on hospitalisation, accounting for 55.2 % of confirmed cases in the EU. On average,
70.6 % of the confirmed brucellosis cases were hospitalised. Eleven MS, four more than in 2012, provided
information on the outcome of the cases. One death due to brucellosis was reported in Austria in 2013. This
resulted in an EU case-fatality rate of 0.99 % among the 101 confirmed cases for which this information was
reported (28.3 % of all confirmed cases).
Species information was missing for 76.6 % of the 359 confirmed cases reported in the EU and Norway. Of
the 84 cases with known species, 86.9 % were reported to be infected with B. melitensis, 10.7 % with
B. abortus and 2.4 % with other Brucella species. For the species distribution by country, see Table
BRUCHUMSPECIES.
3.7.2.
Brucella in food and animals
Food
In 2013, two MS (Italy and Portugal) provided information on Brucella in cheeses, other dairy products and
raw milk from cows and other animal species. Most of the 778 samples were collected through surveillance
and none of them were found to be contaminated with Brucella (Table BRUCFOOD).
Cattle
The status regarding freedom from bovine brucellosis (OBF) and the occurrence of the disease in MS and
non-MS, in 2013, are presented, respectively, in Figure 22 and in Figure 23. As in 2012, Austria, Belgium,
the Czech Republic, Denmark, Estonia, Finland, France, Germany, 10 Italian regions and 11 Italian
provinces, Ireland, Latvia, Luxembourg, the Netherlands, all administrative regions within the superior
administrative unit of the Algarve as well as six of the nine islands of the Azores (Pico, Graciosa, Flores,
Corvo, Faial and Santa Maria) in Portugal, Poland, Slovakia, Slovenia, Sweden, England, Scotland and
Wales in the United Kingdom as well as the Isle of Man were OBF. In Spain, in 2013, in addition to the two
provinces of the Canary Islands (Santa Cruz de Tenerife and Las Palmas) that were OBF, the Balearic
Islands, Basque Country, Murcia and La Rioja were also declared OBF.
MS that did not yet gain in 2013 the country-level OBF status are Bulgaria, Croatia, Cyprus, Greece,
Hungary, Italy, Lithuania, Malta, Portugal, Romania, Spain and the United Kingdom. Croatia, as a new MS,
reported information for the first time in 2013.
Norway and Switzerland were OBF in accordance with EU legislation and Liechtenstein had the same status
(OBF) as Switzerland. In the non-MS Iceland, which has no special agreement concerning animal health
(status) with the EU, brucellosis (B. abortus, B. melitensis, B. suis) has never been reported.
EFSA Journal 2015;13(1):3991
87
EU summary report on zoonoses, zoonotic agents and food-borne outbreaks 2013
Figure 22. Status of countries regarding bovine brucellosis, 2013
Proportions of Brucella-positive cattle herds are displayed only if they are above the legal threshold of 0.1 %.
(*) Proportions relate to the non-OBF regions.
Figure 23. Proportion of existing cattle herds infected with or positive for Brucella, 2013
Over 2005–2013, the overall proportion of existing brucellosis-infected or -positive cattle herds in the EU
decreased steadily to very low levels, and, since 2007, bovine brucellosis has been rare, with the proportion
EFSA Journal 2015;13(1):3991
88
EU summary report on zoonoses, zoonotic agents and food-borne outbreaks 2013
of infected or positive herds in 2013 being 0.04 % (Figure 24). Overall, the percentage of existing infected or
positive herds in the non-OBF MS, with a total of 1,305,445 bovine herds in 2013, decreased from 2005 and
was also rare in 2013 (0.08 %).
In the 16 OBF MS and in the OBF regions of non-OBF MS, annual surveillance programmes are carried out
to confirm the freedom from bovine brucellosis. During 2013, bovine brucellosis was detected in only one
Belgian cattle herd out of the 1,375,934 existing herds in the 16 OBF MS, and it was not detected in Iceland,
Norway or Switzerland.
In four of the 12 non-OBF countries (Italy, Portugal, Spain and the United Kingdom) eradication programmes
for bovine brucellosis approved for European co-financing were carried out in 2013. However, all MS
containing a non-OBF region have a national eradication programme for bovine brucellosis in place. In
general, MS receiving EU co-financing for their eradication programme report the number of positive herds,
whereas MS not receiving EU co-financing report the number of infected herds.
2.0
1.8
Proportion of positive/infected herds
1.6
1.4
1.2
Non-ObmF MSs - herds
1.0
All MSs - sheep and goat herds
0.8
Non-OBF MSs - herds
All MSs - cattle herds
0.6
0.4
0.2
0.0
2005
2006
2007
2008
2009
2010
2011
2012
2013
Year
Bovine brucellosis: Missing data from one OBF MS (Germany (2008)) and non-OBF MS (Hungary (2005), Malta (2006) and Lithuania
(2007)). Romania included data for the first time in 2007, Bulgaria in 2008 and Croatia in 2013.
Sheep and goat brucellosis: Missing data from Bulgaria (2005–2007), Germany (2005–2007, 2012, 2013), Hungary (2005), Lithuania
(2005, 2007, 2010), Luxembourg (2005–2006, 2008–2009, 2011), Malta (2005–2006) and Romania (2005–2006, 2008). Romania
reported data at the animal level in 2008.
Figure 24. Proportion of existing cattle, sheep and goat herds infected with or positive for Brucella,
2005-2013
From the eight non-OBF MS without EU co-financed eradication programmes, Bulgaria, Cyprus, Hungary,
Lithuania, Malta and Romania did not report cases of infected herds. Croatia reported one infected herd out
of 35,707 existing herds, whereas Greece reported 281 infected (0.72 %) out of 38,951 herds, which was
lower than in 2012 (391 infected herds; 0.96 %). Fewer positive herds than in 2012 were reported by the cofinanced non-OBF MS Italy (531 herds; 576 in 2012) and Portugal (88 herds; 108 in 2012); whereas a few
more herds were reported by the co-financed non-OBFs Spain (91 herds; 83 in 2012) and the United
Kingdom (28 herds; 23 in 2012) (Table DSBRUCOFCAT).
Sheep and goats
The status of the countries regarding freedom from ovine and caprine brucellosis caused by B. melitensis
(ObmF) and the occurrence of the disease in MS and non-MS in 2013 are presented in Figure 25 and Figure
26. In 2013, as in 2012, Austria, Belgium, the Czech Republic, Denmark, Estonia, Finland, 64 departments in
France, Germany, Hungary, 11 regions and eight provinces in Italy, Ireland, Latvia, Lithuania, Luxembourg,
the Netherlands, the Azores Islands in Portugal, Poland, Romania, Slovakia, Slovenia, two provinces of the
Canary Islands and the Balearic Islands in Spain, Sweden and the United Kingdom, were ObmF. In Spain, in
2013, in addition to the two provinces of the Canary Islands and the Balearic Islands that are ObmF, the
Asturias, Cantabria, Castile and Leon, Galicia, and Basque Country, were also declared ObmF.
EFSA Journal 2015;13(1):3991
89
EU summary report on zoonoses, zoonotic agents and food-borne outbreaks 2013
MS that in 2013 did not gain yet the country-level ObmF status are Bulgaria, Croatia, Cyprus, France,
Greece, Italy, Malta, Portugal, and Spain. Croatia, as a new MS, reported information for the first time in
2013.
Norway and Switzerland were ObmF in accordance with EU legislation and Liechtenstein had the same
status (ObmF) as Switzerland. In the non-MS Iceland, which has no special agreement concerning animal
health (status) with the EU, brucellosis (B. abortus, B. melitensis, B. suis) has never been reported.
Figure 25. Status of countries regarding ovine and caprine brucellosis, 2013
EFSA Journal 2015;13(1):3991
90
EU summary report on zoonoses, zoonotic agents and food-borne outbreaks 2013
Proportions of Brucella-positive sheep and goat herds are displayed only if they are above the legal threshold of 0.1 %.
(*) Proportions relate to the non-ObmF regions.
Figure 26. Proportion of existing sheep and goat herds infected with or positive for Brucella, 2013
Over 2005–2013, the overall proportion of existing sheep and goat herds infected with or positive for B.
melitensis in the EU was at a very low level; it decreased until 2010 and then stabilised at a level of 0.17 %
in 2011, with a further decrease in 2012 and 2013 (0.11 %). A further decrease was also observed in the
proportion of existing sheep and goat herds infected with or positive for B. melitensis in the nine non-ObmF
MS from 2010 (0.42 %) to 2013 (0.23 %) (Figure 24).
In the 19 ObmF MS and in the ObmF regions of non-ObmF MS, annual surveillance programmes are carried
out to confirm the freedom from bovine brucellosis. During 2013, brucellosis due to B. melitensis was not
detected in any of the 653,155 sheep and goat herds in the 19 ObmF MS, or in Iceland, Norway or
Switzerland.
In five of the nine non-ObmF countries (Cyprus, Greece, Italy, Portugal and Spain), eradication programmes
for ovine and caprine brucellosis approved for European co-financing were carried out in 2013. But all MS
containing a non-ObmF region have a national eradication programme for ovine and caprine brucellosis in
place. In general, MS receiving EU co-financing for their eradication programme report the number of
positive herds, whereas MS not receiving EU co-financing report the number of infected herds.
From the four non-ObmF MS without EU co-financed eradication programmes, which have a total of
315,814 existing herds, Bulgaria, France and Malta did not report cases of infected herds, whereas Croatia
reported one infected herd. From the five co-financed non-ObmF MS, Cyprus reported no single infected
herd; fewer positive herds than in 2012 were reported by Italy (597 herds; 642 in 2012), Portugal (672 herds;
746 in 2012), Greece (21 herds; 33 in 2012) and Spain (153 herds; 272 in 2012) (Table DSBRUCOFOV).
Other animals
In 2013, 18 MS and two non-MS sampled animal species other than cattle, sheep or goats. Brucella-positive
tests were reported in 7 pig herds out of the 839 tested. Of the 496,544 animals tested, positive results were
reported for the following: water buffalos (1,884), wild boars (212), other wild ruminants (25), hares (16), pet
dogs (7), pigs (3), wild alpine chamois (1) and dolphin (1) (Table BRUCOTHERAN).
EFSA Journal 2015;13(1):3991
91
EU summary report on zoonoses, zoonotic agents and food-borne outbreaks 2013
3.7.3.
Brucella food-borne outbreaks
In 2013, four weak-evidence Brucella outbreaks were reported by Greece and Germany. Out of 10 human
cases involved in the seven outbreaks, seven were hospitalised. No strong-evidence outbreaks were
reported.
3.7.4.
Discussion
Brucellosis is a rare infection in humans in the EU. The highest notification rates and the majority of the
autochthonous cases were reported from Mediterranean countries that are not officially brucellosis-free in
cattle, sheep or goats. No significant increasing or decreasing trend of human brucellosis could be observed
at the EU level in the last five years. Seventy per cent of the human brucellosis cases with known
hospitalisation status had been hospitalised, but only one fatal case was reported in 2013.
There were no Brucella-positive findings in the surveillance samples of cheeses and other dairy products, or
raw milk reported by two Mediterranean MS. However, the four reported weak evidence food-borne
outbreaks in 2013 by two MS illustrate the health risk related to consumption of food contaminated with
Brucella.
MS have national surveillance and/or eradication programmes in place. A further decreasing tendency was
observed in the prevalence of both bovine and small ruminant brucellosis within the EU. In 2013, brucellosis
remained a rare (bovine brucellosis) or very low frequency (ovine and caprine brucellosis) event at the EU
level. Both bovine and small ruminant brucellosis cases of infected or positive herds are mostly reported by
four Mediterranean MS Greece, Italy, Portugal and Spain. Bovine brucellosis was also reported by Northern
Ireland in the United Kingdom in 28 cattle herds. Almost all non-OBF MS and non-ObmF MS reported fewer
positive and/or infected herds than in 2012.
An overview of the control and eradication programme results of brucellosis in Italy, from 1998 to 2011, has
recently been published (Graziani et al., 2013). The disease has been described in general and in detail,
analysing the official data available in Italy from the surveillance in animals and in humans in that period. The
report presents the integrated approach, under the “One Health, One Medicine” concept that Italy has
followed for the control of the disease, emphasising the importance of such an approach and the need for
extensive cooperation between public health and animal health professionals. It is intended as a tool for both
scientists and authorities, providing them with the available knowledge of the disease and focussing on
critical points and conditions that still affect the capacity for control of brucellosis in Italy.
3.8.
Trichinella
The Appendix contains hyperlinks to all data summarised for the production of this section, for humans, food,
animals and food-borne outbreaks. It also includes hyperlinks to Trichinella summary tables and figures that
were not displayed in this section because they did not trigger any marked observation. The summarised
data are presented in downloadable Excel and PDF files, and are listed by subject. Moreover, all submitted
and validated data by the MS are available online (http://www.efsa.europa.eu/en/efsajournal/pub/3991.htm).
3.8.1.
Trichinellosis in humans
In 2013, 256 cases of trichinellosis, of which 217 were laboratory-confirmed, were reported by ten MS (Table
20). The EU notification rate in 2013 was 0.05 cases per 100,000 population which was a decrease of
17.7 % compared with 2012. The highest notification rates were reported in Romania, Latvia and Bulgaria
(0.58, 0.54 and 0.49 cases per 100,000, respectively). These three countries accounted for 75.1 % of all
confirmed cases reported in 2013. The increase observed in Germany was attributed to an outbreak caused
by raw meat sausages made from Trichinella-positive wild boar meat which had accidentally entered the
German market (Schink et al., 2014). Only one case of trichinellosis was reported as travel-associated and
was related to travel to another EU country. The remaining cases were either reported as domestically
acquired or of unknown origin (Table TRICHUMIMPORT).
EFSA Journal 2015;13(1):3991
92
EU summary report on zoonoses, zoonotic agents and food-borne outbreaks 2013
Table 20. Reported cases and notification rates per 100,000 of human trichinellosis in the EU/EEA,
2009-2013
2013
Country
National
Data
Coverage (a) Form at (a)
Total
Cases
Confirm ed
Cases &
Rates
2012
Confirm ed
Cases &
Rates
2011
Confirm ed
Cases &
Rates
2010
Confirm ed
Cases &
Rates
2009
Confirm ed
Cases &
Rates
Cases Rate Cases Rate Cases Rate Cases Rate Cases Rate
Austria
Y
C
0
0 0.00
Belgium(b)
N
A
1
1
Bulgaria
Y
A
60
36 0.49
Croatia(c)
Y
A
1
Cyprus
Y
C
0
0 0.00
Czech Republic
Y
C
0
0 0.00
Denmark(d)
Estonia
Y
C
1
0 0.00
Finland
Y
C
0
0 0.00
France
Y
C
0
0 0.00
Germany
Y
C
14
14 0.02
Greece
Y
C
0
0 0.00
Hungary
Y
C
0
0 0.00
Ireland
Y
C
0
0 0.00
Italy (e)
Latvia
Y
C
11
11 0.54
Lithuania
Y
C
9
6 0.20
Luxembourg
Y
C
0
0 0.00
Malta
Y
C
0
0 0.00
Netherlands
Y
C
0
0 0.00
Poland
Y
C
9
4 0.01
Portugal
Y
C
0
0 0.00
Romania
Y
C
116
116 0.58
Slovakia
Y
C
5
5 0.09
Slovenia
Y
C
1
1 0.05
Spain
Y
C
28
23 0.05
Sw eden
Y
C
0
0 0.00
United Kingdom
Y
C
0
0 0.00
EU Total
256
217 0.05
Iceland
Y
C
0
0 0.00
Liechtenstein
Norw ay
Y
C
0
0 0.00
Sw itzerland(f)
Y
C
1
1 0.01
(a): Y, yes; N, no; A, aggregated data; C, case-based data; -, no report.
(b): Disease not under formal surveillance.
(c): Case of unknown case classification.
(d): No surveillance system.
(e): No report for 2013.
(f): Switzerland provided data directly to EFSA.
0
0
30
0
1
0
0
0
2
0
0
0
33
41
28
0
0
0
1
0
149
5
1
10
0
0
301
0
1
0.00
0.41
0.00
0.01
0.00
0.00
0.00
0.00
0.00
0.00
0.00
0.06
2.01
0.93
0.00
0.00
0.00
0.00
0.00
0.74
0.09
0.05
0.02
0.00
0.00
0.06
0.00
0.01
1
0
27
0
0
0
0
2
3
0
0
0
6
50
29
0
0
1
10
0
107
13
1
18
0
0
268
0
0
0.01
0.37
0.00
0.00
0.00
0.00
0.00
0.00
0.00
0.00
0.00
0.01
2.41
0.95
0.00
0.00
0.01
0.03
0.00
0.54
0.24
0.05
0.04
0.00
0.00
0.06
0.00
0.00
5
3
14
0
0
0
0
0
3
4
0
0
0
9
77
0
0
0
14
0
82
2
0
10
0
0
223
0
1
0.06
0.19
0.00
0.00
0.00
0.00
0.00
0.00
0.04
0.00
0.00
0.00
0.42
2.45
0.00
0.00
0.00
0.04
0.00
0.41
0.04
0.00
0.02
0.00
0.00
0.05
0.00
0.01
0
0
407
0
0
0
0
9
1
2
9
0
1
9
20
0
0
1
18
0
265
0
1
7
0
0
750
0
4
0.00
0.00
5.45
0.00
0.00
0.00
0.00
0.01
0.00
0.02
0.09
0.00
0.00
0.42
0.63
0.00
0.00
0.01
0.05
0.00
1.31
0.00
0.05
0.02
0.00
0.00
0.15
0.00
0.05
The temporal trend of trichinellosis in the EU in 2009–2013 was greatly influenced by a number of smaller
and larger outbreaks (Figure 27), with peaks often occurring in January. The large peak at the beginning of
2009 was attributed to Romania, which reported 243 confirmed cases in January-March only.
EFSA Journal 2015;13(1):3991
93
EU summary report on zoonoses, zoonotic agents and food-borne outbreaks 2013
Source: Austria, Cyprus, Czech Republic, Estonia, Finland, France, Germany, Greece, Hungary, Ireland, Latvia, Luxembourg, Malta,
Netherlands, Norway, Poland, Portugal, Romania, Slovakia, Slovenia, Sweden, and United Kingdom. Bulgaria, Croatia,
Iceland, Italy, Lithuania and Spain did not report data over the whole period at the level of detail required for the analysis.
Belgium and Denmark do not have any formal surveillance system for the disease.
Figure 27. Trend in reported confirmed cases of human trichinellosis in the EU/EEA, 2009-2013
Of the 12 MS that reported cases in 2013, seven provided information on hospitalisation for all of their cases
(corresponding to 74.7 % of all confirmed cases reported in the EU). On average, 65.4 % of the cases were
hospitalised. One death due to trichinellosis was reported in Latvia in 2013. The case was a hunter who had
consumed wild boar meat (Antra Bormane, Centre for Disease Prevention and Control of Latvia, personal
communication, October 2014).
T. spiralis was identified in 112 of the 217 confirmed cases. For the remainder of the cases, no species
information was provided. See Table TRICHUMSPECIES for species distribution by country.
3.8.2.
Trichinella in animals
Comparability of data
According to Commission Regulation (EC) No 2075/2005, carcases of domestic pigs, horses, wild boars and
other farmed or wild animal species that are susceptible to Trichinella infestation, should be systematically
sampled at slaughter as part of the meat inspection process and are tested for Trichinella. Animals (both
domestic and wild) slaughtered for own consumption are not included in the regulation, but are subject to
national rules, which differ per MS, as each MS can decide how to control Trichinella in this population (e.g.
test or not, freeze or not). Therefore, data from such animals might not be comparable between MS. Some
MS also report data from monitoring of Trichinella in wildlife not intended for human consumption, e.g.
Belgium and Denmark, which are obliged to have monitoring programmes for wildlife in order to maintain
their status as a region where the risk of Trichinella in domestic pigs is negligible in accordance with
Regulation (EC) No 2075/2005.
Only results for the most important animal species that might serve as a source for human infection in the
EU are presented.
Detailed information on the data reported and on the occurrence of Trichinella in the different animal
categories has been included in specific tables referenced in Appendix.
In 2013, all MS and three non-MS provided information on Trichinella in farm animals (pigs, farmed wild
boars and horses) and 10 MS reported positive findings. In pigs, a total of 357 positive findings out of
154,397,532 animals tested was reported (0.0002 %); 98.3 % of all the positive findings were reported from
pigs not raised under controlled housing conditions (Figure 28). Positive findings were mainly (82.4 %)
reported from eastern EU MS (Romania and Poland, and to a lesser extent Croatia and Bulgaria). In
addition, Spain reported 15.4 % of all positive findings. Most of the positive findings were of T. spiralis
94
EFSA Journal 2015;13(1):3991
EU summary report on zoonoses, zoonotic agents and food-borne outbreaks 2013
(66.4 %); the remaining was reported as unspecified Trichinella, except for a few findings of T. britovi from
Romania, France and Poland.
Nine MS reported data on farmed wild boars. In total, 7,908 animals were tested, and Greece and Italy each
reported one positive finding.
No positive findings were reported from 176,497 horses tested in the EU.
In Finland, the first diagnosis of Trichinella in domestic swine was made in 1954. There were very few pig
cases annually until 1981, when the number of Trichinella-positive pigs started to increase, reaching more
than 100 positive findings a year. In the 2000’s, however, the number of positive animals decreased to a
couple of animals a year, and, in 2005-2009, no cases were found. In 2010, only one Trichinella-positive pig
was found and, between 2011-2013, no cases were found.
The infection was known in brown bear and other wildlife during the 1950s, but since the 1980s trichinellosis
has also been found to be prevalent among wild carnivores, especially in the southern part of Finland, where
all the four European species (T. spiralis, T. nativa, T. britovi and T. pseudospiralis) have been reported. The
raccoon dog, Nyctereutes procyonoides, has been recognised as an important host, harbouring all four
Trichinella species.
It appears that the Trichinella situation in Finland has been changing with decreasing incidence in swine.
However, no sign of such changes in wildlife has been seen. The apparent reduction in swine may be due to
pig production becoming more intensive with bigger industrialised units. In wildlife, a substantial proportion of
infections are caused by T. nativa, the arctic species, which does not readily infect swine.
Source: The Finnish National Zoonoses Summary Report, 2013
In recent years, most Spanish Trichinella outbreaks have been due to the consumption of wild boar meat.
Outbreaks from wild boar meat are increasingly frequent in certain regions of Spain and could be explained
by ecological modifications in rural areas.
Source: The Spanish National Zoonoses Summary Report, 2013.
Twenty-three MS and one non-MS provided data on hunted wild boars. Fifteen MS reported 1,177 positive
findings out of 872,203 animals tested, with an overall EU proportion of positive samples of 0.1 %. Most of
the positive animals were reported by eastern EU MS (76.5 %); Poland reported 33.7 % and Romania
12.6 % (Figure 29). There was a tendency for the eastern EU MS to have a higher proportion of positive
samples than central EU MS. In addition, Spain reported 21.8 % of the positive samples. Most findings were
reported as Trichinella spp. (47.8 %) followed by T. spiralis (30.7 %) and T. britovi (20.9 %).
Twenty-two MS provided information about Trichinella in wildlife other than hunted wild boars, and reported a
total of 647 positive findings from 11,520 animals tested (5.62 %) representing 11 different animal species.
Most of the positive reporting was from eastern and north eastern EU MS (Figure 30).
EFSA Journal 2015;13(1):3991
95
EU summary report on zoonoses, zoonotic agents and food-borne outbreaks 2013
Figure 28. Findings of Trichinella in pigs not raised under controlled housing conditions, 2013
Figure 29. Findings of Trichinella in hunted wild boars, 2013
EFSA Journal 2015;13(1):3991
96
EU summary report on zoonoses, zoonotic agents and food-borne outbreaks 2013
Figure 30. Findings of Trichinella in wildlife (excluding hunted wild boars), 2013
The proportion of positive samples in different wildlife species from 2005 to 2013 is presented in Figure 31.
Over the years, the highest proportion of positive samples has been reported for raccoon dogs, followed by
bears. Most positive samples from raccoon dogs were from Finland, which reported between 19.9 % and
34.9 % positive samples each year. The decrease observed in the proportion of positive samples for raccoon
dogs in 2012-2013 is due to the reporting of data from Denmark with no positive samples. In 2013, Finland
reported 66.6 % of all positive findings in wildlife other than hunted wild boars, mainly in raccoon dogs and
lynx.
Trichinella was also reported from badgers, bears, foxes, jackals, lynx, martens, polecats, rats, white-tailed
eagles, wolves and wolverines.
Trichinella is found in large parts of Europe, as overall 19 MS and two non-MS reported positive findings.
EFSA Journal 2015;13(1):3991
97
EU summary report on zoonoses, zoonotic agents and food-borne outbreaks 2013
50.0
45.0
Proportion of positive samples
40.0
35.0
30.0
Other wildlife
25.0
Bears
Raccoon dogs
20.0
Foxes
Wild boars (Hunted)
15.0
10.0
5.0
0.0
2005
2006
2007
2008
2009
2010
2011
2012
2013
Years
Figure 31. Proportion of Trichinella-positive samples in wildlife in Member States and non-Member
States, 2005-2013
3.8.3.
Trichinella food-borne outbreaks
In 2013, 22 Trichinella outbreaks were reported by six MS (Romania reported 12 outbreaks). Twenty of the
outbreaks were supported by strong evidence. Pig meat was the most frequently reported food vehicle,
reported in 15 of the 22 outbreaks (68.2 %). These findings are similar to previous years. For a large
proportion of the strong evidence outbreaks (14) information on contributing factors was not provided. For
the remaining outbreaks, inadequate heat treatment and unprocessed contaminated ingredients were
reported as the main factors in four and two outbreaks, respectively.
3.8.4.
Discussion
Trichinellosis is a rare disease in the EU/EEA. While the EU notification rate decreased in 2013 compared
with 2012, the EU trend is not stable and is affected by the number and size of disease outbreaks each year.
All cases reported in 2013 had acquired the infection within the EU and the three countries with the highest
notification rates, Romania, Latvia and Bulgaria, accounted for 75 % of reported cases. On average, 65.4 %
of the confirmed human trichinellosis cases were hospitalised and one death due to trichinellosis was
reported in 2013, a hunter who had consumed wild boar meat.
Traditionally, pig meat has been one of the main sources of Trichinella infections in humans (Pozio and
Murrell, 2006). In the EU, most pigs are subject to official meat inspection at slaughter in accordance with
Regulation (EC) No 2075/2005; only pigs slaughtered for home consumption are not covered by the
regulation. Only nine MS reported Trichinella in pig meat in 2013 with an EU prevalence of 0.0002 %, and
the positive findings were mainly from pigs raised under non-controlled housing conditions. EFSA has
identified that for domestic pigs this type of production system is the single main risk factor for Trichinella
infections. In contrast, the risk of Trichinella infection in pigs from officially recognised controlled housing
conditions is considered negligible (EFSA, 2011). Most humans become infected when consuming
undercooked meat from pigs or wild boars that have not been taken to the local slaughterhouse for postmortem inspection and sampling for detection of Trichinella spp. larvae.
Trichinella is found in large parts of Europe, as overall 19 MS and two non-MS reported positive findings.
Nine MS reported data on farmed wild boars and only two MS reported a positive finding. The prevalence in
farmed wild boars is higher than in pigs, as controlled housing conditions are often not applied to this
production. No positive findings were reported from solipeds in 2013.
EFSA Journal 2015;13(1):3991
98
EU summary report on zoonoses, zoonotic agents and food-borne outbreaks 2013
Trichinella is commonly reported in wildlife by some northern and eastern European MS where Trichinella is
circulating in the wildlife population. The proportion of positive samples in hunted wild boars was higher than
in pigs and farmed wild boars in 2013. The proportion of positive samples from wildlife, other than wild boars,
was highest in raccoon dogs, followed by bears. Trichinella was also reported from badgers, jackals, lynx,
martens, polecats, white-tailed eagles, rats, wolves and wolverines. The increasing number of wild boars and
red foxes and the spread of the raccoon dog from eastern to western Europe may increase the prevalence of
Trichinella circulating among wild animals (Alban et al., 2011). Therefore, it is important to continue
educating hunters and others eating wild game about the risk of eating undercooked game meat.
Twenty-two food-borne outbreaks caused by Trichinella were reported in six MS. Pig meat was the most
frequently reported food vehicle among the 20 strong-evidence outbreaks. For the outbreaks where the
source was known, consumption of inadequately heat-treated pig or wild boar meat or use of unprocessed
contaminated ingredients were indicated as the main causes.
Generally, Trichinella is considered a medium risk for public heath related to the consumption of pig meat,
and integrated preventative measures and controls on farms and at slaughterhouses can ensure an effective
control of Trichinella (EFSA BIOHAZ, CONTAM and AHAW Panels, 2011). Infections of pigs occur when
there are biosecurity failures, which increase the probability of pigs coming into contact with reservoirs.
These include, for example, feeding pigs on food waste that potentially contains pig meat scraps, or
exposure of pigs to carcases of dead pigs or infected wildlife. Pigs raised outdoors are at risk of contact with
potentially Trichinella-infected wildlife. In pigs raised indoors, the risk of infection is mainly related to the lack
of compliance with rules on the treatment of animal waste. In such farms, infection could also occur as a
result of the breakdown of the biosecurity barriers around the farm, allowing the ingress of infected rodents
(EFSA, 2011).
3.9.
Echinococcus
The Appendix contains hyperlinks to all data summarised for the production of this section, for humans and
animals. It also includes hyperlinks to Echinococcus summary tables and figures that were not displayed in
this section because they did not trigger any marked observation. The summarised data are presented in
downloadable Excel and PDF files, and are listed by subject. Moreover, all submitted and validated data by
the MS are available online (http://www.efsa.europa.eu/en/zoonosesscdocs/zoonosescomsumrep.htm).
3.9.1.
Echinococcosis in humans
Cases of both cystic and alveolar echinococcosis, caused by E. granulosus and E. multilocularis
respectively, are reported jointly to ECDC as echinococcosis as the EU case definition does not differentiate
between the two clinical forms of the disease. In 2013, a total of 811 echinococcosis cases, of which
794 were laboratory confirmed, were reported in the EU (Table 21). The EU notification rate was 0.18 cases
per 100,000 population which was a decrease of 5.7 % compared with 2012. The highest notification rate
was reported by Bulgaria with 3.82 cases per 100,000 followed by Lithuania with 0.77 cases per 100,000.
EFSA Journal 2015;13(1):3991
99
EU summary report on zoonoses, zoonotic agents and food-borne outbreaks 2013
Table 21. Reported cases and notification rates per 100,000 of human echinococcosis in the EU/EEA,
2009-2013
2012
2013
Country
National
Data
Coverage (a) Form at (a)
2011
2010
2009
Confirm ed
Confirm ed
Confirm ed
Confirm ed
Confirm ed
Cases & Rates Cases & Rates Cases & Rates Cases & Rates Cases & Rates
Total
Cases
Cases Rate Cases
11
0.13
3
15
0.13
6
278
3.82
320
-
Rate
Cases Rate
Cases Rate Cases Rate
0.04
7
0.08
21
0.25
20
0.24
0.05
1
0.01
1
0.01
0
0.00
4.37
307
4.17
291
3.92
323
4.33
-
Austria
Belgium
Bulgaria
Croatia(b)
Y
Y
Y
Y
C
A
A
A
11
15
278
15
Cyprus
Czech Republic
Denmark(c)
Estonia
Finland
France
Germany
Greece
Hungary
Ireland
Italy (c)
Latvia
Lithuania
Luxembourg
Malta
Netherlands
Poland
Portugal
Romania
Slovakia
Slovenia
Spain
Sw eden
United Kingdom
Y
Y
Y
Y
Y
Y
Y
Y
Y
Y
Y
Y
Y
Y
Y
Y
Y
Y
Y
Y
Y
Y
C
C
C
C
C
C
C
C
C
C
C
C
C
A
C
C
C
C
C
C
C
C
0
2
3
4
34
121
10
5
1
7
25
0
0
33
39
3
55
20
6
94
16
14
0
2
3
4
34
121
10
5
1
7
23
0
0
33
39
3
55
20
6
94
16
14
0.00
0.02
0.23
0.07
0.05
0.15
0.09
0.05
0.02
0.35
0.77
0.00
0.00
0.20
0.10
0.03
0.28
0.37
0.29
0.20
0.17
0.02
0
0
3
3
49
114
21
6
0
8
23
0
0
28
2
96
3
6
96
16
7
0.00
0.00
0.23
0.06
0.08
0.14
0.19
0.06
0.00
0.39
0.77
0.00
0.00
0.07
0.02
0.48
0.06
0.29
0.21
0.17
0.01
2
0
0
1
45
142
17
11
0
10
24
1
0
49
19
1
53
2
8
53
19
9
0.24
0.00
0.00
0.02
0.07
0.17
0.15
0.11
0.00
0.48
0.79
0.20
0.00
0.29
0.05
0.01
0.27
0.04
0.39
0.11
0.20
0.01
0
5
0
1
33
117
11
9
1
14
23
1
0
36
3
55
9
8
82
30
7
0.00
0.05
0.00
0.02
0.05
0.14
0.10
0.09
0.02
0.66
0.73
0.20
0.00
0.09
0.03
0.27
0.17
0.39
0.18
0.32
0.01
1
1
0
1
27
106
22
8
1
15
36
0
0
25
25
4
42
4
9
86
12
7
0.13
0.01
0.00
0.02
0.04
0.13
0.20
0.08
0.02
0.69
1.13
0.00
0.00
0.15
0.07
0.04
0.21
0.07
0.44
0.19
0.13
0.01
EU Total
-
-
811
794
0.18
810
0.19
781
0.18
758
0.18
775
0.18
Iceland
Liechtenstein
Norw ay
Y
Y
C
C
0
2
0
2
0.00
0.04
2
0.04
3
0.06
1
0.02
4
0.08
(a): Y: yes; N: no; A: aggregated data; C: case-based data; -: no report.
(b): All cases of unknown case classification
(c): No surveillance system.
EFSA Journal 2015;13(1):3991
100
EU summary report on zoonoses, zoonotic agents and food-borne outbreaks 2013
The two forms of the disease can be differentiated in the data reported to ECDC by the reported species.
Species information was provided from 14 MS and Norway out of the 23 countries that reported cases in
2013. Six MS (Bulgaria, Latvia, the Netherlands, Portugal, Slovenia and the United Kingdom) and Norway
only reported cases of E. granulosus, two MS only reported cases of E. multilocularis (Estonia and France)
and six MS (Austria, Belgium, Germany, Lithuania, Poland and Slovakia) reported both parasites in humans.
In the EU/EEA, E. granulosus accounted for 427 cases (53.6 % of confirmed cases), E. multilocularis for
116 cases (14.6 %) and no information on species was provided for 253 cases (31.7 %). See Table
ECHINOHUMSPECIES for species distribution by country.
Over the last five years, there was an increasing number of cases infected with E. multilocularis (alveolar
echinococcosis) reported from the eight MS reporting this species during the five-year period (Figure 32). In
contrast, there was a decreasing number of cases infected with E. granulosus (cystic echinococcosis)
reported from the nine MS reporting this species throughout the period.
Source: TESSy data from countries reporting species for most or all their cases throughout the period. For E. granulosus from nine MS
(Austria, Belgium, Bulgaria, Estonia, Germany, Latvia, Lithuania, Poland and Slovakia). For E. multilocularis from eight MS
(Austria, Belgium, France, Germany, Latvia, Lithuania, Poland and Slovakia).
Figure 32. Reported confirmed cases of human echinococcosis by species in selected Member
States, 2009-2013
Twelve MS provided information on hospitalisation for all or the majority of their cases, accounting for 22.7 %
of the confirmed echinococcosis cases in 2013. On average, 70.6 % of the cases were hospitalised. There
was no difference in the percentage of cases hospitalised between the two species.
Thirteen MS provided information on the outcome of the cases. Two deaths due to E. multilocularis were
reported in 2013, one in Austria and one in Germany. This gives an EU case-fatality rate of 0.88 % among
the 226 confirmed cases for which this information was reported (28.5 % of all confirmed cases).
3.9.2.
Echinococcus in animals
Comparability of data
E. granulosus and E. multilocularis are two different tapeworms that are the causative agents of two
zoonoses with different epidemiology. For E. granulosus the definitive hosts are dogs and, rarely, other
canids, while the intermediate hosts are mainly livestock. For E. multilocularis the typical transmission cycle
in Europe is wildlife based. The intermediate hosts for E. multilocularis are wild small rodents, while the
definitive hosts in Europe are red foxes, raccoon dogs and, to a lesser extent, dogs and wolves.
As described earlier during the five-year period 2009-2013, there was an increasing number of (human)
cases reported to be infected with E. multilocularis (alveolar echinococcosis) in the EU/EEA. Therefore, it is
of particular importance to assess the occurrence and distribution of E. multilocularis in Europe in a more
representative way. However, for E. multilocularis, findings rely on the surveillance or monitoring in place,
which are not harmonised between MS. Data of E. multilocularis findings are therefore extremely difficult to
compare between MS. Surveillance for E. granulosus is carried out at meat inspection (macroscopic (visual)
EFSA Journal 2015;13(1):3991
101
EU summary report on zoonoses, zoonotic agents and food-borne outbreaks 2013
examination of organs of relevant farm animals at slaughter) and these MS data should therefore be to some
extent comparable given that compulsory notification is in place.
Proposals for harmonised schemes for the monitoring and reporting of Echinococcus in animals and
foodstuffs can be found in an External Scientific Report submitted to EFSA (Boué et al., 2010). Several MS
have had monitoring/surveillance programmes running for some years.
E. multilocularis in animals
E. multilocularis is mainly monitored in foxes. In 2013, 12 MS and two non-MS reported data on 6,629 foxes
examined for Echinococcus and seven MS reported positive findings of Echinococcus. Poland, Germany and
Slovakia reported the highest proportion of positive samples, 32.8 %, 31.4 % and 22.3 %, respectively
(Table ECHINOFOX2013).
Not all Echinococcus-positive samples were speciated. Slovakia and Germany reported the highest
proportions of E. multilocularis positive samples, 22.3 % and 21.9 %, respectively (Figure 33), followed by
Luxemburg (5.4 %) and Sweden (0.1 %). Germany reported 79.0 % of the E. multilocularis-positive samples
at EU-level. For comparison, in 2012, 9.9 % of the tested foxes were positive for E. multilocularis, and
Germany reported 68.3 % of the positive findings (Table ECHINOFOX2012).
Poland was the only MS to report E. multilocularis in other animal species; nine positive pigs out of
370 tested and one positive hunted wild boar (Table ECHINOOTHER2013)
Eleven MS and one non-MS reported investigations of foxes as being part of a monitoring programme, the
remaining countries reported data from surveys (2), clinical investigation (1) or unspecified (2).
Ten MS have reported data on E. multilocularis in foxes for a minimum of four consecutive years, from 2005
to 2013 (Figure 34). In this period, the Nordic countries (Finland and Sweden) reported no or very few
positive findings in foxes. In the Czech Republic an increase in prevalence of E. multilocularis is observed
during 2005-2011, as well as in Slovakia during 2010-2013. Findings from Germany, Luxembourg, the
Netherlands and Poland have continued to fluctuate. In the light of the fact that, as mentioned above, these
findings are extremely difficult to compare between MS, no overall trend graph for this group of MS was
produced for E. multilocularis in foxes.
In addition, the Netherlands and France reported regional data on foxes. The Netherlands reported 22 positive animals out of 37 tested
in the Zuid-Limburg region and France reported 18 positive animals out of 89 tested in the Lorraine region.
Figure 33. Findings of Echinococcus multilocularis in foxes, 2013
EFSA Journal 2015;13(1):3991
102
EU summary report on zoonoses, zoonotic agents and food-borne outbreaks 2013
Vertical bars indicate the exact binomial 95 % CI. Only MS-level submitted data are considered in this figure. MS reporting data for at
least four consecutive years are included.
Figure 34. Findings of E. multilocularis in foxes (including Member States providing data for at least
four consecutive years), 2005-2013
Echinococcus findings in other animals
In 2013, 113,635,194 domestic animals (cattle, sheep, goats, pigs and horses) were tested for Echinococcus
by 16 MS and two non-MS. Eight MS and one non-MS reported a total of 141,505 positive samples, mainly
from sheep (76.9 %) and cattle (17.2 %). Spain, Italy, Greece and the United Kingdom reported respectively
58.8 %, 10.9 %, 4.7 % and 25.4 % of all positive samples. In total, 66.1 % of the positive samples were
reported as E. granulosus and the remainder as Echinococcus spp. Seven MS and one non-MS reported
findings of E. granulosus and Echinococcus spp. in foxes, wild boar, deer, water buffalos, reindeers, wolves,
dogs, cats, beavers, monkeys and jackals (Table ECHINOOTHER2013).
Echinococcus is a large problem in Bulgaria and since 2000 there have been increases in the prevalence in
bovine animals, sheep and pigs during meat inspection of carcasses at slaughter. The prevalence in bovine
animals has increased from 9.2 % to 17.9 %, in sheep from 5.2 % to 7.5 % and in pigs from 0.8 % to 2.2 %.
The most important final hosts are sheep dogs, stray dogs, pet dogs and hunter dogs, with prevalence of,
respectively, 78 %, 57 %, 31 %, and 16 %. Some of the main reasons for the large number of human cases
are only partial registration of pet dogs and that not all pet dogs are treated with anthelmintics, many stray
dogs live without any anthelmintic treatment and not all infected viscera is destroyed in rendering plants.
Source: The Bulgarian National Zoonoses Report, 2013
3.9.3.
Discussion
The EU/EEA notification rate of confirmed human echinococcosis cases decreased in 2013 compared to
2012. Six MS and Norway only reported cases of E. granulosus, two MS only reported cases of
EFSA Journal 2015;13(1):3991
103
EU summary report on zoonoses, zoonotic agents and food-borne outbreaks 2013
E. multilocularis and six MS reported both parasites in humans. The highest population-based risk was noted
in Bulgaria (which only reported E. granulosus), where the notification rate was 21 times higher than the
average rate at the EU level.
There were almost four times as many reported cases of E. granulosus than for E. multilocularis although the
number of cases with the alveolar form of echinococcosis, caused by E. multilocularis, increased in 20092013. This increase is of concern as untreated alveolar echinococcosis is often fatal. Two deaths due to
alveolar echinococcosis (E. multilocularis) were reported in 2013, resulting in an EU case-fatality rate of
0.88 %.
E. multilocularis is found in red foxes mainly in central Europe, the north of Denmark, the Netherlands, and
Belgium, in eastern EU to the Baltic States and Slovakia, in the south to north eastern Italy and Hungary,
and in the west to central France (EFSA, 2007a). Recently, E. multilocularis has been identified in the red fox
in Sweden (Osterman et al., 2011). Surveillance of E. multilocularis in foxes is important in order to assess
the prevalence in Europe, particularly as the distribution of E. multilocularis is increasing in Europe
(Vervaeke et al., 2006; Berke et al., 2008; Takumi et al., 2008; Combes et al., 2012; Antolová et al., 2014).
An increase in infected foxes can also lead to E. multilocularis being isolated from unusual intermediate
hosts including beavers due to heavy environmental contamination with E. multilocularis eggs as has been
observed in Switzerland and Austria (Janovsky et al., 2002).
E. multilocularis has never been found in Finland, Ireland, Malta and the United Kingdom, and in order to
maintain the status of E. multilocularis freedom, these four countries are obliged to implement surveillance
30
programme aimed at detecting the parasite in any part of the country (Regulation (EU) No 1152/2011 ).
Within five years the results must be critically assessed. In 2013, EFSA carried out the assessment and
found that under the assumption of unbiased representative sampling (in the case of Finland, Ireland and the
United Kingdom) and unbiased risk based sampling (in the case of Malta) and considering the sensitivity of
the tests applied, all four MS have fulfilled the requirement of Regulation (EU) No 1152/2011 to the effect
that the surveillance activities should detect a prevalence of E. multilocularis of 1 % or less at a confidence
level of at least 0.95 (EFSA, 2013c). It should however be noted that E. multilocularis can occur at lower
prevalences as reported in Sweden where about 0.1 % of foxes are infected with E. multilocularis.
In Czech Republic an increase in prevalence of E. multilocularis in foxes was observed during 2005-2011, as
well as in Slovakia during 2010-2013.
Four MS reported almost all the positive findings of E. granulosus; mainly from domestic animals.
Information campaigns about E. multilocularis tend to focus on warnings against eating berries and
mushrooms from areas where E. multilocularis has been detected in the wildlife population, while little
consideration is given to ownership of dogs and contact with wild carnivores (Antolová et al., 2014). Several
case–control studies have showed that having a dog and contact with wild carnivores are the most important
risk factors (Stehr-Green et al., 1988; Kreidl et al., 1998; Craig et al., 2000; Kern et al., 2004).
The EFSA Panel on Animal Health and Welfare have stated in a scientific opinion that in many human cases
the diagnosis is established only as echinococcosis, and the aetiological agent of the
disease, E. multilocularis or E. granulosus, is not determined. Similarly, EFSA considers that the current data
about the occurrence of human echinococcosis in MS do not provide an accurate picture of the
epidemiological situation. In 2013, 31.8 % of human cases remained undetermined. Distinction between
infections with E. granulosus and E. multilocularis would be beneficial because the two diseases require
different management of prevention and treatment (EFSA AHAW Panel, 2013). Regarding animal data, the
quality of the data reported on Echinococcus has improved in recent years, with more information being
provided about the sampling context and more data reported at species level. Also in animals information on
parasite speciation is very important for risk management efforts as E. granulosus and E. multilocularis have
different epidemiologies and pose different health risks to humans.
3.10.
Toxoplasma
The Appendix contains hyperlinks to all data summarised for the production of this section, for animals. It
also includes hyperlinks to Toxoplasma summary tables and figures that were not displayed in this section
because they did not trigger any marked observation. The summarised data are presented in downloadable
Excel and PDF files, and are listed by subject. Moreover, all submitted and validated data by the MS are
available online (http://www.efsa.europa.eu/en/efsajournal/pub/3991.htm).
30
Commission Delegated Regulation (EU) No 1152/2011 of 14 July 2011 supplementing Regulation (EC) No 998/2003 of the
European Parliament and of the Council as regards preventive health measures for the control of Echinococcus multilocularis
infection in dogs. OJ L 296, 15.11.2011, p. 6-12.
EFSA Journal 2015;13(1):3991
104
EU summary report on zoonoses, zoonotic agents and food-borne outbreaks 2013
3.10.1. Toxoplasmosis in humans
Data on congenital toxoplasmosis in the EU in 2013 are not included in this report but will be published in the
ECDC Annual Epidemiological Report 2015 (in preparation).
3.10.2. Toxoplasma in animals
Comparability of data
Most of the reporting countries provided information on the type of specimen taken and the analytical method
used in testing. This facilitated a better interpretation of the data. Some countries tested meat or other
tissues for the presence of Toxoplasma cysts, while other countries serologically tested blood or meat juice
samples for the presence of Toxoplasma antibodies. Furthermore, some results derive from monitoring and
specific national surveys, while other results are from clinical investigations. Because of the use of different
tests and analytical methods, as well as different sampling schemes, the results from different countries are
not directly comparable.
Furthermore, it should be noted that the prevalence of Toxoplasma infection in farm animals is strongly
influenced by the age of the tested animals and the type of husbandry conditions applied at the farm.
Animals
In 2013, 14 MS and two non-MS provided data on Toxoplasma in animals (Table TOXOOVER).
Only six MS and one non-MS reported data on Toxoplasma in pigs (Table TOXOPIGS). Most of these data
derived from monitoring, objective sampling or specific surveys. France reported on the largest proportion
(48.3 %) of the 3,208 tested pigs, followed by the United Kingdom (19.3 %) and Poland (17.7 %). The
Toxoplasma positivity in pigs varied between the reporting MS. Italy reported 25.8 % positivity in pigs using
ELISA, while Poland reported 14.7 % and 13.6 % positivity using PCR and direct agglutination tests,
respectively. The United Kingdom detected 7.4 % positivity in pigs, but no specific details on the analytical
method used were reported. Estonia and Germany did not find any Toxoplasma-positive pigs out of the
20 and 280 animals tested, respectively.
Five MS reported data on Toxoplasma in cattle in 2013 (Table TOXOCATTLE). As in the previous year, both
Germany and Poland found low to moderate levels of samples to be positive. Italy and the United Kingdom
reported high to very high proportions of serologically positive samples of cattle at farms.
Twelve MS and two non-MS reported information on Toxoplasma in sheep and goats, probably because of
the clinical importance of the parasite in these animal species (Table TOXOOVINEGOAT). As in the
previous year, high proportions of serological samples were found to be positive by several countries,
particularly from clinical investigations and suspect sampling. The Netherlands also detected tissue cysts in
samples from sheep and goats.
Nine MS and two non-MS provided data on Toxoplasma in cats and dogs, mainly from clinical investigations,
and often found positive samples, using mostly serological tests (Table TOXOCATDOG).
In addition, several MS and two non-MS provided data on other animal species, reporting Toxoplasma
positive samples from hares, finches, camels, dromedaries, llamas, donkeys, wild boars, water buffaloes and
deer (Table TOXOOTHERAN). In particular, in wild boars, high proportions of seropositive samples were
detected in Poland, while Italy reported less seropositive wild boars than in 2012. A high proportion of
seropositive samples from deer were reported by Poland in 2013. In addition, Italy reported information on
eight camels out of which seven were seropositive for Toxoplasma.
3.10.3. Discussion
As highlighted in the recent EFSA opinions on modernisation of meat inspection, Toxoplasma poses an
important risk to human health, and has to be considered as a relevant hazard to be addressed in revised
meat inspection systems for pigs, sheep, goats, farmed wild boars and farmed deer (EFSA BIOHAZ,
CONTAM and AHAW Panels, 2011; EFSA BIOHAZ Panel, 2013b, c). Toxoplasma was reported by the MS
from pigs, sheep, goats, hunted wild boars and hunted deer, during the period 2011-2013. In the same
years, positive findings were also detected in cats (the natural hosts), cattle and dogs, as well as in several
other animals, indicating the wide distribution of the parasite among different farm, domestic and wildlife
animal species.
EFSA Journal 2015;13(1):3991
105
EU summary report on zoonoses, zoonotic agents and food-borne outbreaks 2013
3.11.
Rabies
The Appendix contains hyperlinks to all data summarised for the production of this section, for humans and
animals. It also includes hyperlinks to rabies summary tables and figures that were not displayed in this
section because they did not trigger any marked observation. The summarised data are presented in
downloadable Excel and PDF files, and are listed by subject. Moreover, all submitted and validated data by
the MS are available online (http://www.efsa.europa.eu/en/efsajournal/pub/3991.htm).
3.11.1. Rabies in humans
Generally, very few cases of rabies in humans are reported in the EU, and most MS have not had any
autochthonous cases for decades. In June 2013 one travel-associated case of rabies was reported from the
Netherlands (Table 22). The patient was a 51-year old man, exposed to an unknown source in Haiti.
Table 22. Human rabies cases in the EU/EEA, 2009-2013
Year
Country
2009
Romania
2010
Romania
2011
Portugal
Romania
2012
United Kingdom
Switzerland
2013
Netherlands
Case
1 fatal case: 69-year-old female from a rural area bitten by a fox. The patient did not
visit a hospital or report it to the veterinary authorities.
2 fatal cases: 10- and 11-year-old girls from rural areas. Possible transmission by cat
bite and unknown source, respectively.
1 fatal case imported from Guinea-Bissau. Case was a 41-year-old woman bitten by a
dog. No vaccine was available in the country at the time of the bite. The person
visited the hospital in Portugal two and a half months after the bite.
1 fatal case: a 5-year-old girl was bitten by a stray dog in a village in eastern Romania
and was initially mis-diagnosed; she died in February 2012.
1 fatal case: a British woman died of rabies in May 2012 in the United Kingdom,
contracted from a dog in India.
1 fatal case: an American citizen died of rabies in July 2012; he was bitten by a bat in
California 3 months before the symptoms started.
1 fatal case: 51-year-old male died of rabies in June 2013; he was exposed to an
unknown source in Haiti.
3.11.2. Rabies in animals
Rabies is a notifiable disease in all MS and Switzerland. In 2013, 12 MS had their annual or multi-annual
31
plan of rabies eradication co-financed by the EC. Eradication plans include oral vaccination of wild animals,
sampling of wild and domestic animals (suspected of having been infected by rabies and/or those found
dead) for rabies, and surveillance and monitoring of wild animals for vaccine efficacy. Co-financed oral
vaccination campaigns were carried out in 2013 in Bulgaria, Finland, Greece, Estonia, Italy, Latvia,
Lithuania, Hungary, Poland, Romania, Slovenia and Slovakia. Some of these vaccinations were applied in
neighbouring third countries to reduce the influx of rabies via foxes.
Domestic animals and wildlife
The majority of samples from wild and domestic animals tested for rabies are taken based on the suspicion
of rabies infection, including animals found dead. In addition, countries carrying out oral vaccination
programmes of wildlife monitor the efficiency of vaccination campaigns. This involves the sampling of healthy
(rabies unsuspected) hunted foxes and raccoon dogs randomly and homogeneously selected from the
vaccination areas. These hunted animals are tested for vaccine intake and for specific immunity, as well as
for the presence of the rabies virus.
Endemic rabies still occurs in foxes and other wildlife species in certain eastern parts of the EU, in particular
Romania, with sporadic spill-over to domestic animals, mainly dogs and cats (pet and stray) and ruminants.
In Romania and Poland, the incidence in both domestic and wild animals has remained at the same level
from 2012 to 2013. In Slovakia, a few cases were confirmed in a bordering area to Poland. A slight increase
in fox rabies has been observed in Hungary and Greece (northern part) whereas the situation in Croatia has
significantly improved (Source: The Croatian National Zoonoses Summary Report, 2013).
31
Commission Implementing Decision (EC) No 2012/761/EU of 30 November 2012 approving annual and multiannual programmes
and the financial contribution from the Union for the eradication, control and monitoring of certain animal diseases and zoonoses
presented by the Member States for 2013. OJ L 336, 8.12.2012, p. 83–93.
EFSA Journal 2015;13(1):3991
106
EU summary report on zoonoses, zoonotic agents and food-borne outbreaks 2013
Overall, in 2013, 783 animals other than bats tested positive for either classical rabies virus or unspecified
Lyssavirus, in reporting countries, including two imported cases (see specific Tables in the Appendix). The
number of cases reported in 2013 increased compared with 2012, when 712 cases where detected in
animals other than bats (Figure 35).
In 2013, two MS reported, each, one imported case of rabies in pet animals: one case of rabies in cat
imported from Morocco and one case in dog following illegal import from North Africa.
The geographical distribution of reported cases in foxes in 2013 is shown in Figure 36, while the distribution
of cases in wild animals other than foxes and bats is shown in Figure RABIESMAPWILD.
3,166
1,474
837
883
712
781
512
322
(22 MS +
4 non-MS)
(22 MS +
2 non-MS)
(25 MS +
2 non-MS)
(24 MS +
2 non-MS)
(23 MS +
2 non-MS)
(24 MS +
2 non-MS)
(24 MS +
2 non-MS)
(26 MS +
2 non-MS)
Year
(numberof
of reporting
reporting countries
)
Year
(number
countries)
The number of reporting MS and non-MS is indicated at the bottom of each bar. The total number of rabid cases is reported at the top of
each bar. Imported cases are not included.
Source 2013: Austria, Belgium, Bulgaria, Croatia, Cyprus, Czech Republic, Denmark, Estonia, Finland, France, Germany, Greece,
Hungary, Italy, Latvia, Lithuania, Luxembourg, Netherlands, Norway, Poland, Portugal, Romania, Slovakia, Slovenia, Spain, Sweden,
Switzerland and United Kingdom
Figure 35. Reported cases of classical rabies or unspecified Lyssavirus in animals other than bats, in
the Member States and non-Member States, 2006-2013
EFSA Journal 2015;13(1):3991
107
EU summary report on zoonoses, zoonotic agents and food-borne outbreaks 2013
Figure 36. Classical rabies or unspecified Lyssavirus cases in foxes, 2013
Bats
Bats infected with rabies virus were found in six MS (France, Germany, Luxembourg, the Netherlands,
Poland and Spain). In total, 19 positive cases were found out of 1,442 examined, the corresponding figures
for 2012 being 33 and 1,971, respectively (Table RABIESBATS). Thus the rate of positive/examined cases
has remained constant in this period.
The apparent prevalence varies from 0.2 % (France) to 8.4 % in Poland and 11.1 % in the Netherlands, but
the numbers are probably too small to indicate clear differences between MS. The geographical distribution
of classical rabies or unspecified Lyssavirus cases in bats in 2013 is shown in Figure 37.
EFSA Journal 2015;13(1):3991
108
EU summary report on zoonoses, zoonotic agents and food-borne outbreaks 2013
Figure 37. Classical rabies or unspecified Lyssavirus cases in bats, 2013
3.11.3. Discussion
Human rabies annually claims more than 50,000 lives worldwide. It is a rare and vaccine-preventable
zoonosis in Europe but the disease is invariably fatal in infected humans once the first clinical symptoms are
declared. Every year, one or two human cases are reported in European citizens, either travel-related or
autochthonous. In 2013, one case in a patient who travelled to a third country endemic for rabies was
reported in the EU. It remains important to inform and educate the public about the risk of contracting rabies
if bitten by animals while travelling to rabies-endemic countries or in MS which have not eradicated the
disease in their animal population.
The incidence of rabies in both domestic and wild animals in EU MS has been drastically reduced over the
past decades following systematic oral vaccination campaigns and rabies cases have disappeared in
western and most of central Europe. Thanks to EU co-financed eradication programmes, eastern European
countries have also observed a rapid decline in the number of reported rabies cases in animals following
their entry into the EU in 2004. Since 2010, the rate of EU funding for national rabies programmes has been
increased up to 75 % of the costs incurred by each MS. About €20 million is spent annually on oral
vaccination programmes in wildlife in the MS and bordering areas of neighbouring third countries, as the vast
32
majority of rabies cases in the EU occur in those areas. This is likely due to the fact that the continued
presence of sylvatic rabies in neighbouring third countries may continue to feed the endemic cycle in certain
areas.
At present, in several countries in eastern Europe, rabies remains a serious endemic disease. The
recurrence of rabies in some countries highlights the fragility of rabies-free country status and the need for
continuous surveillance. Mass vaccination of pets provides a first line of defence to prevent rabies in humans
whereas oral vaccination of foxes has proved efficient for the long-term control and elimination of terrestrial
rabies. Rabies control programmes for foxes should be complemented by appropriate management
measures in stray dogs and cats (population control and vaccination). Rabies in pets imported from endemic
32
Commission Implementing Decision (EC) No 2013/722/EU of 29 November 2013 approving annual and multiannual programmes
and the financial contribution from the Union for the eradication, control and monitoring of certain animal diseases and zoonoses
presented by the Member States for 2014 and the following years. OJ 328, 7.12.2013, p. 101-117.
EFSA Journal 2015;13(1):3991
109
EU summary report on zoonoses, zoonotic agents and food-borne outbreaks 2013
countries is regularly reported in Europe, highlighting the need for continued vigilance concerning pet
movements.
3.12.
Q fever
The Appendix contains hyperlinks to all data summarised for the production of this section, for humans, and
animals. It also includes hyperlinks to Q fever summary tables and figures that were not displayed in this
section because they did not trigger any marked observation. The summarised data are presented in
downloadable Excel and PDF files, and are listed by subject. Moreover, all submitted and validated data by
the MS are available online (http://www.efsa.europa.eu/en/efsajournal/pub/3991.htm).
3.12.1. Q fever in humans
In 2013, 25 EU MS, Iceland, Norway and Switzerland provided information on Q fever in humans. Belgium
has a sentinel surveillance system. In Spain, the data come from the microbiological surveillance system,
which covers an estimated 30 % of the population. Seven MS (the Czech Republic, Estonia, Ireland,
Lithuania, Luxembourg, Poland and Slovakia) reported no human cases. A total of 648 confirmed cases of
Q fever in humans were reported in the EU, four in Norway and 27 in Switzerland (Table 23). The EU
notification rate was 0.17 per 100,000 population. The highest notification rate (1.37 cases per
100,000 population) was reported by Hungary. The highest numbers of confirmed cases were reported by
France and Hungary (158 and 135, respectively). France and Germany accounted for most of the number of
confirmed cases reported in the last three years.
There was a decreasing EU trend of confirmed Q fever cases over the period 2009–2013 (Figure 38). The
peak in 2009 was attributed to a large outbreak occurring in the Netherlands between 2007 and 2010 and
involving more than 4,000 human cases (Van der Hoek et al., 2012), which is now considered over. There is
a seasonal variation in Q fever cases with the peak occurring mostly between April and August. Hungary’s
increase in notification rate was largely due to an outbreak reported from Baranya county, southern Hungary,
in June 2013, with 91 cases affected mainly by pneumonia (ISID, 2013). This increase, however, may have
also been influenced by modified diagnostic processes and improved surveillance (Katalin Krisztalovics,
Hungarian National Centre for Epidemiology, personal communication, 14 November 2013).
The large majority of cases in the EU were locally acquired (Table COXHUMIMPORT). Only Germany, the
Netherlands, Norway, Sweden and the United Kingdom reported travel-associated cases. In Sweden and
Norway, most or all cases were, respectively, imported. Of the 25 travel-associated cases reported in total,
eight were acquired within another EU country, including six cases acquired in Spain.
Two deaths due to Q fever were reported in 2013, one by Germany and one by Latvia. This resulted in an
EU case fatality rate of 0.61 % among the 335 confirmed cases with known outcome (51.2 % of all confirmed
cases).
EFSA Journal 2015;13(1):3991
110
EU summary report on zoonoses, zoonotic agents and food-borne outbreaks 2013
Table 23. Reported cases and notification rates per 100,000 of human Q fever in the EU/EEA, 20092013
2013
Country
Data
National
Coverage (a) Form at (a)
Confirm ed
Total
Cases &
Cases
Rates
2012
Confirm ed
Cases &
Rates
2011
Confirm ed
Cases &
Rates
2010
Confirm ed
Cases &
Rates
Cases Rate Cases Rate Cases Rate Cases
Austria(b)
Belgium(c)
N
C
6
6
18
6
30
Bulgaria
Y
A
23
23 0.32
29 0.40
12 0.16
14
Y
A
25
43 1.02
Croatia(d)
Cyprus
Y
C
3
3 0.35
4 0.46
5 0.60
4
Czech Republic
Y
C
0
0 0.00
1 0.01
1 0.01
0
Denmark(b)
Estonia
Y
C
0
0 0.00
0 0.00
0 0.00
0
Finland
Y
C
5
5 0.09
0 0.00
4 0.07
5
France
Y
C
158
158 0.24
168 0.26
228 0.35
286
Germany
Y
C
115
114 0.14
198 0.24
287 0.35
326
Greece
Y
C
11
11 0.10
11 0.10
3 0.03
1
Hungary
Y
C
175
135 1.37
36 0.36
36 0.37
68
Ireland
Y
C
0
0 0.00
5 0.11
4 0.09
9
Italy
Latvia
Y
C
1
1 0.05
1 0.05
1 0.05
2
Lithuania
Y
C
0
0 0.00
0 0.00
0 0.00
0
Luxembourg
Y
C
0
0 0.00
0 0.00
0 0.00
0
Malta
Y
C
2
2 0.48
0 0.00
0 0.00
0
Netherlands
Y
C
20
20 0.12
63 0.38
80 0.48
504
Poland
Y
C
0
0 0.00
0 0.00
0 0.00
0
Portugal
Y
C
23
21 0.20
26 0.25
5 0.05
13
Romania
Y
C
24
24 0.12
16 0.08
6 0.03
7
Slovakia
Y
C
0
0 0.00
0 0.00
0 0.00
0
Slovenia
Y
C
1
1 0.05
1 0.05
0 0.00
1
Spain(e)
N
C
75
75 0.54
58
33
69
Sw eden
Y
C
3
3 0.03
2 0.02
5 0.05
11
United Kingdom
Y
C
46
46 0.07
12 0.02
43 0.07
30
EU Total
716
648 0.17
692 0.16
759 0.20
1380
Iceland
Y
C
0
0 0.00
0 0.00
0 0.00
0
Liechtenstein
Norw ay
Y
C
4
4 0.08
0 0.00
0 0.00
0
Y
C
27
27 0.34
Sw itzerland(f)
(a): Y, Yes; N, No; A, aggregated data; C, case-based data;-, no report
(b): Not notifiable, no surveillance system exists
(c): Sentinel surveillance; no information on estimated coverage. Thus notification rate cannot be estimated
(d): All cases of unknown case classification.
(e): Microbiological surveillance system; notification rates calculated based on estimated coverage of 30 %.
(f): Switzerland provided data directly to EFSA.
EFSA Journal 2015;13(1):3991
2009
Confirm ed
Cases &
Rates
Rate Cases Rate
33
0.19
22 0.30
0.49
2 0.25
0.00
0 0.00
0.00
0 0.00
0.09
1 0.02
0.44
0.40
191 0.23
0.01
3 0.03
0.69
19 0.19
0.20
17 0.38
0.09
0 0.00
0.00
0 0.00
0.00
0 0.00
0.00
0 0.00
3.04
2354 14.28
0.00
3 0.01
0.13
14 0.14
0.04
2 0.01
0.00
0 0.00
0.05
0 0.00
34
0.12
5 0.05
0.05
19 0.03
0.35
2719 0.88
0.00
0 0.00
0.00
0 0.00
-
111
EU summary report on zoonoses, zoonotic agents and food-borne outbreaks 2013
800
Number of cases
600
400
200
Number of cases
12-month moving average
0
Jan 2009
Jul 2009
Jan 2010
Jul 2010
Jan 2011
Jul 2011
Jan 2012
Jul 2012
Jan 2013
Jul 2013
Month
Source: Belgium, Cyprus, Czech Republic, Finland, Germany, Greece, Hungary, Ireland, Latvia, Malta, Netherlands, Norway, Poland,
Portugal, Romania, Slovenia, Spain, Sweden and United Kingdom. Estonia, Iceland, Lithuania, Luxembourg and Slovakia
reported zero cases throughout the period. Austria, Croatia, Bulgaria, Denmark, France and Italy were excluded, as they did
not report over the whole period, reported cases that were not confirmed or had an unknown month of occurrence.
Figure 38. Trend in reported confirmed cases of human Q fever in the EU/EEA, 2009-2013
3.12.2. Coxiella burnetii in animals
Comparability of data
EU MS can report animal cases of Q fever to the EC under Directive 2003/99/EC on the monitoring of
zoonoses and zoonotic agents. This directive foresees that, in addition to a number of zoonoses and
zoonotic agents, for which monitoring is mandatory, others shall also be monitored where the
epidemiological situation so warrants. Because of the use of different tests and analytical methods, as well
as different sampling schemes, the results from different countries are not directly comparable. Proposals for
harmonised schemes for the monitoring and reporting of Q fever in animals can be found in an External
Scientific Report submitted to EFSA (Sidi-Boumedine et al., 2010).
Animals
In 2013, 17 MS and two non-MS provided data on Q fever (Coxiella burnetii) in animals. Compared with the
previous years, no general trend was observed as regards the number of samples tested and the number of
positive samples.
Most of the reporting countries provided information on the type of specimen taken and the analytical method
used in testing. Most countries serologically tested blood (serum) or milk samples for the presence of
C. burnetii antibodies using ELISA or a complement fixation test (CFT). Furthermore, many investigations
used direct methods such as testing tissues of aborted fetuses, still-born animals and placental swabs by
fluorescent in situ hybridization (FISH), RT-PCR, and ImmunoHistoChemistry (IHC). Most of the samples
were collected through active or passive monitoring schemes and clinical investigations.
In 2013, most samples from cattle were obtained from passive monitoring, followed by clinical investigations.
Unlike in 2012, not all countries reported positive findings (Table COXCATTLE). Finland, Poland, Romania,
Spain, and Norway did not detect C. burnetii in cattle samples. However, Romania and Spain provided
reports with only limited sample sizes (< 15). Belgium, the Czech Republic, Malta, Slovakia and Switzerland
tested high numbers of animals. Slovakia and Switzerland reported low percentages of positive samples
(2.2 % and 1.6 %, respectively). The other three countries found that between 6 % and 13 % of samples
tested positive. Most of these results came from serological testing; therefore, infection could have occurred
in animals either in the past or in the present. Germany tested high numbers of animals at herd level; 20 %
EFSA Journal 2015;13(1):3991
112
EU summary report on zoonoses, zoonotic agents and food-borne outbreaks 2013
of 1,000 herds were positive and reported as clinically affected.
herds.
33
Also, Belgium reported clinically affected
The majority of the reports on investigations for Q fever in sheep and goats for 2013 originated from
monitoring and clinical investigations. The Czech Republic, Denmark, Finland, Ireland, Latvia, Norway,
Poland, Romania and Sweden (50 % of the reporting countries) did not report positive findings. Slovakia and
Spain reported positive findings for goats but not sheep. Belgium, Cyprus and Germany reported a few
clinically affected sheep and goat herds (Table COXOVINEGOAT).
Overall, all but three (Finland, Poland and Romania) of the 17 reporting MS, and also Switzerland, found
animals testing positive to C. burnetii in their cattle, sheep or goat populations in 2013. Norway did not find
any positive cattle, sheep or goats.
In addition, Germany reported one positive pig herd out of 18 tested, and two non-MS, Norway and
Switzerland, provided data on a range of other farmed, domesticated, captive and wild animals and found no
positive samples (Table COXOTHERAN).
In May 2013, a Q fever epidemic in people occurred in Baranya county in Hungary. The investigation carried
out in cooperation between the human and animal health authorities identified a sheep farm as a possible
source of the disease. During the investigation, 1,379 tests were carried out on samples taken from sheep,
goat and cattle farms in the area around the sheep farm. In total, 72 bovine, 1 caprine and 34 ovine samples
were positive. From the 161 dust samples, 112 (70 %) were positive. Diagnostic methods used were a CFT
and an IHC test. There were no clinically affected herds.
Source: The Hungarian National Zoonoses Report, 2013
3.12.3. Discussion
In 2013, the notification rate of confirmed cases of Q fever in people continued to decrease by 0.01 per
100,000 population compared with 2012. France and Germany accounted for most of the number of
confirmed cases reported in the last three years. Hungary experienced an outbreak in humans in May 2013
and a sheep farm was identified to be the source.
All but three of the 17 reporting MS found animals positive for C. burnetii, which demonstrates that the
pathogen is widely distributed in the EU. Positive findings were detected in cattle and sheep, as well as in
goats and in one pig herd. Few MS reported clinically affected herds.
3.13.
West Nile virus
The Appendix contains hyperlinks to all data summarised for the production of this section, for humans and
animals. It also includes hyperlinks to WNV summary tables and figures that were not displayed in this
section because they did not trigger any marked observation. The summarised data are presented in
downloadable Excel and PDF files, and are listed by subject. Moreover, all submitted and validated data by
the MS are available online (http://www.efsa.europa.eu/en/efsajournal/pub/3991.htm).
3.13.1. West Nile fever in humans
In 2013, 24 MS and one non-MS provided information on West Nile fever (WNF) in humans. Belgium and
France have sentinel surveillance systems, which cover only part of the population, so no rates could be
calculated for these countries. Ten MS (Croatia, the Czech Republic, France, Greece, Hungary, Ireland,
Italy, Romania, Slovenia and Sweden) reported human cases, which was two MS more than in 2012 (the
Czech Republic, Ireland and Slovenia reported cases, while Bulgaria reported zero cases). In total,
250 cases of WNF in people, of which 186 were confirmed, were reported in the EU in 2013, acquired either
locally or during travel in or outside of Europe. The EU notification rate was 0.08 cases per
100,000 population (Table 24). There was an increase of 0.01 per 100,000 population (10 %) in notification
rate compared with 2012 (238 cases), and an increase of 0.04 (88 %) compared with 2011 (132 cases).
However, the notification rate was lower than in 2010. As in previous years, Greece had the highest
notification rate in 2013 (0.78 cases per 100,000 population); the type of cases reported varies however
between countries, making the comparison difficult. Compared with 2012, notification rates increased,
particularly in Croatia, by 0.34 (14 cases), in Italy, by 0.08 (51 cases) and in Hungary, by 0.2 (19 cases), but
rates in Greece decreased by 0.68 (86 cases).
33
A herd is defined as clinically affected based on a combination of results from PCR and serological tests as described respectively
for cattle and sheep/goats in the zoonoses reporting manual (EFSA, 2014b).
EFSA Journal 2015;13(1):3991
113
EU summary report on zoonoses, zoonotic agents and food-borne outbreaks 2013
Table 24. Reported cases and notification rates per 100,000 of human West Nile fever in 2009-2013
(total cases)
2013
Country
Austria
National
Data
Coverage (a) Form at (a)
2012
-
-
-
-
-
0
Belgium
N
C
0
0
-
2
Bulgaria
Y
C
0
0 0.00
4
Croatia
Y
A
20
20 0.48
6
Cyprus
Y
C
0
0 0.00
Czech Republic
Y
C
1
1 0.01
(b)
(c)
2011
2010
2009
Total cases Total cases Total cases Total cases Total cases
Confirm ed
& rates
& rates
& rates
& rates
& rates
Cases
Cases Rate Cases Rate Cases Rate Cases Rate Cases Rate
0.00
0 0.00
0 0.00
0 0.00
-
0
-
0
-
0
0.06
-
-
-
-
-
-
0.14
-
-
-
-
-
-
0
0.00
0 0.00
0 0.00
0 0.00
0
0.00
0 0.00
0 0.00
0 0.00
Denmark
-
-
-
-
-
-
-
Estonia
Y
C
0
0 0.00
0
0.00
-
-
0 0.00
-
-
0 0.00
-
-
-
0 0.00
Finland
Y
C
0
0 0.00
0
0.00
0 0.00
0 0.00
0 0.00
France(b)
N
C
1
1
-
3
-
1
-
3
-
1
-
German(c)
-
-
-
-
-
-
-
-
-
-
-
-
-
Greece
Y
C
48
86 0.78
162
1.46
100 0.90
262 2.34
0 0.00
Hungary
Y
C
12
36 0.37
17
0.17
4 0.04
19 0.19
7 0.07
Ireland
Y
C
1
1 0.02
0
0.00
1 0.02
0 0.00
0 0.00
Italy
Y
C
79
79 0.13
28
0.05
14 0.02
5 0.01
18 0.03
Latvia
Y
C
0
0 0.00
0
0.00
0 0.00
0 0.00
0 0.00
Lithuania
Y
C
0
0 0.00
0
0.00
0 0.00
0 0.00
0 0.00
Luxembourg
Y
C
0
0 0.00
0
0.00
0 0.00
0 0.00
0 0.00
Malta
Y
C
0
0 0.00
0
0.00
0 0.00
0 0.00
0 0.00
Netherlands
Y
C
0
0 0.00
0
0.00
1 0.01
1 0.01
0 0.00
Poland
Y
C
0
0 0.00
0
0.00
0 0.00
0 0.00
0 0.00
Portugal2
-
-
-
-
-
-
-
-
-
-
Romania
Y
C
22
24 0.12
15
0.08
11 0.06
57 0.28
2 0.01
Slovakia
Y
C
0
0 0.00
0
0.00
0 0.00
0 0.00
0 0.00
Slovenia
Y
C
1
1 0.05
0
0.00
0 0.00
0 0.00
0 0.00
Spain
Y
C
0
0 0.00
0
0.00
0 0.00
2 0.00
0 0.00
Sw eden
Y
C
1
1 0.01
1
0.01
0 0.00
0 0.00
0 0.00
United Kingdom
EU Total
Y
-
C
-
0
186
0 0.00
250 0.08
0
238
0.00
0.07
0 0.00
132 0.04
0 0.00
349 0.11
0 0.00
28 0.01
-
-
-
Iceland
-
-
-
-
-
-
-
-
-
-
-
-
-
Liechtenstein
-
-
-
-
-
-
-
-
-
-
-
-
-
Norw ay
Y
C
0
0 0.00
0
0.00
0 0.00
0 0.00
0 0.00
Sw itzerland(d)
Y
C
1
1 0.01
1 0.01
(a): Y, Yes; N, No; A, Aggregated data; C, Case-based data; -, No report.
(b): Sentinel surveillance; coverage unknown and notification rate cannot be estimated.
(c): No surveillance system.
(d): Switzerland provided data directly to EFSA.
0 0.00
0 0.00
0 0.00
The vast majority of cases reported in Greece, Hungary, Italy and Romania were domestically acquired.
France, Sweden and Switzerland reported only travel-associated cases, one case each. Italy and Hungary
both reported locally acquired cases, as well as two and one travel-associated cases, respectively. Of the
total of five travel-associated cases reported by EU MS, three were acquired within Europe (Serbia, Hungary
and Former Yugoslav Republic of Macedonia) and two cases contracted the infection in Africa.
WNF has been reportable at the EU level since 2008. Since then, the number of cases has varied from year
to year (Figure 39). However, a slight (not significant) increasing trend can be observed. Since 2009, in
Hungary and Italy, case numbers have been increasing, while they have decreased in Greece. There was
also strong seasonality in the number of WNF cases reported in the EU in 2009-2013, with most cases
(82 %) being reported between July and September.
EFSA Journal 2015;13(1):3991
114
EU summary report on zoonoses, zoonotic agents and food-borne outbreaks 2013
200
Number of cases
150
100
50
Number of cases
12-month moving average
0
Jan 2009
Jul 2009
Jan 2010
Jul 2010
Jan 2011
Jul 2011
Jan 2012
Jul 2012
Jan 2013
Jul 2013
Month
Source: Czech Republic, Greece, Hungary, Ireland, Italy, the Netherlands, Norway, Romania, Slovenia, Spain and Sweden. Belgium,
Cyprus, Estonia, Finland, Latvia, Lithuania, Luxembourg, Malta, Norway, Poland, Slovakia and United Kingdom reported zero
cases throughout the period. Austria, Bulgaria and Croatia did not report data over the whole period or not at the level of detail
required for analysis. Denmark, Germany and Portugal do not have a surveillance system for this disease.
Figure 39. Trend in reported total cases of human West Nile fever in the EU/EEA, 2009-2013
Three MS (Hungary, Romania and Slovenia) provided data on hospitalisation for all of their cases (20.8 % of
the cases reported in the EU), with an average rate of hospitalisation of 91.7 %.
Six MS provided information on the outcome of the disease. The overall EU case-fatality rate was 3.4 %
among the 227 probable and confirmed cases for which this information was reported (90.8 % of all cases).
This is much lower than the 11.1 % EU case-fatality rate reported in 2012. However, case-fatality rates for
the two most affected countries, Greece and Italy, remained similar over the last three years.
3.13.2. West Nile virus in animals
Comparability of data
In the EU, the reporting of WNV infections in animals is not mandatory. European MS can report WNV
infections in animals to the EC under Directive 2003/99/EC on the monitoring of zoonoses and zoonotic
agents. This directive foresees that, in addition to the number of zoonoses and zoonotic agents, for which
monitoring is mandatory, others shall also be monitored when the epidemiological situation so warrants.
Owing to heterogeneity in study design and analytical methods, the reported WNV prevalence in birds and
solipeds from different countries is not directly comparable. Proposals for harmonised schemes for the
monitoring and reporting of WNV in animals can be found in an External Scientific Report submitted to EFSA
(Mannelli et al., 2012).
In 2013, a total of 21,223 animals (solipeds, birds and other animal species) were reported to be tested for
WNV, which is an increase compared to 2012 when 18,460 animals were tested. Of these tested animals,
the number of positive cases decreased, with 246 animals reported positive in 2013, as compared to
664 positive cases in 2012.
In 2013, 8,937 birds have been sampled for WNV in six MS (Belgium, Germany, Hungary, Italy, Spain and
the United Kingdom) and six more in Switzerland. A total of 84 positive samples were reported by the four
MS Germany, Hungary, Italy and Spain (Figure 40).
EFSA Journal 2015;13(1):3991
115
EU summary report on zoonoses, zoonotic agents and food-borne outbreaks 2013
Figure 40. Findings of West Nile virus in birds in the EU, in 2013
Furthermore in 2013, 12,278 solipeds have been tested in 12 MS (Croatia, Cyprus, the Czech Republic,
Finland, Germany, Greece, Hungary, Italy, Slovakia, Slovenia, Spain and the United Kingdom) and one more
in Switzerland, in 2013. A total of 162 positive cases were detected in 10 MS: Croatia (9), Cyprus (1), the
Czech Republic (5), Finland (35), Greece (18), Hungary (1), Italy (56), Slovenia (1), Spain (35) and the
United Kingdom (1). But in Finland and the United Kingdom the positive horses were imported and are
therefore not displayed in Figure 41.
EFSA Journal 2015;13(1):3991
116
EU summary report on zoonoses, zoonotic agents and food-borne outbreaks 2013
Figure 41. Findings of West Nile virus in domestic solipeds in the EU, in 2013
In Finland during the year 2013, 193 horses from intra-EU trade and eight horses imported from outside EU
were tested negative by ELISA for IgM WNV antibodies (acute infection). IgG antibodies were found in
29 horses from intra-EU trade and six horses imported from outside EU (from US). The vaccination status for
WNV was known only in one horse in intra-EU trade.
Source: The Finnish National Zoonoses Summary Report, 2013
In the United Kingdom, about 350 birds per year are sampled as part of the United Kingdom's WNV
surveillance programme. Sampling is carried out from April to October during the mosquito season. Target
species are sampled (small passerines, corvids, waterside birds), birds with neurological signs and mass
mortality incidents. Horses are sampled post import or if clinical suspicion indicates sampling is necessary. In
2013, no WNV infection was detected during the year. In an imported horse, the results of testing were
complement ELISA (cELISA)-positive but IgM ELISA negative so this case was considered either a historical
infection or cross-reaction with unknown Flavivirus.
Source: The United Kingdom National Zoonoses Summary Report, 2013
3.13.3. Discussion
In 2013, the number of human cases of WNF reported in the EU/EEA increased slightly compared with 2012,
but was lower than in 2010. Three countries in the EU (Hungary, Italy and Romania) have reported
autochthonous cases for five consecutive years and the figures vary throughout the years. Greece, which
has implemented enhanced surveillance for WNV infection in humans and animals, has been affected for
four consecutive years but the notification rate seems to be going down. Croatia has reported cases to the
EU for two consecutive years. New areas were affected in Italy, Hungary and Croatia, and the Czech
Republic reported its first locally acquired case. Interestingly, the Czech Republic reported positive horses
for the second year in 2013. Of 783 blood samples from horses, five were confirmed as serologically
EFSA Journal 2015;13(1):3991
117
EU summary report on zoonoses, zoonotic agents and food-borne outbreaks 2013
positive. There were, however, no clinical cases and cross reactivity of laboratory diagnostics with viral tick34
borne encephalitis in the Czech Republic is considered to occur frequently.
It is important to point out that variations and differences in case numbers are partly due to variations and
differences in surveillance systems. In addition, the increase in case reports can be partly explained by the
substantial efforts made to strengthen the level of detection in the affected countries or in newly affected
countries, as soon as the first cases are identified. Health professionals (including blood safety authorities)
are alerted at the beginning of the season, as are the stakeholders involved in animal and entomological
surveillance. A detailed overview for both the EU and neighbouring countries, including at the regional level,
is published on the ECDC website (ECDC, 2012b) with an epidemiological update summarising the WNF
season and the last weekly update of the ECDC West Nile risk map.
In 2012, MS agreed to begin reporting WNV at the EU level under Directive 2003/99/EC on the monitoring of
zoonoses and zoonotic agents. Although the number of tested animals increased in 2013 compared with the
previous year, there were less than half as many cases detected in 2013 compared with 2012. In addition to
the countries that had already reported WNV presence in animals in 2012, positive samples were also
reported by Croatia, Cyprus, Finland and Germany in 2013. In Finland and the United Kingdom, these
samples were from imported animals which tested negative for immunoglobulin IgM WNV antibodies but
positive for IgG antibodies, so these cases can be considered either as historical infections or crossreactions with unknown Flavivirus. In Croatia, on the other hand, nine out of 266 IgG-positive samples tested
positive for IgM antibodies. Presumed acute infections in animals (IgM- or PCR-positive samples) were
reported by only some of the Mediterranean countries and by the Czech Republic and Hungary.
3.14.
Tularaemia
The Appendix contains hyperlinks to all data summarised for the production of this section, for humans and
animals. It also includes hyperlinks to tularaemia summary tables and figures that were not displayed in this
section because they did not trigger any marked observation. The summarised data are presented in
downloadable Excel and PDF files, and are listed by subject. Moreover, all submitted and validated data by
the MS are available online (http://www.efsa.europa.eu/en/efsajournal/pub/3991.htm).
3.14.1. Tularaemia in humans
In 2013, 24 MS, Iceland, Norway and Switzerland provided information on tularaemia in humans. Seven MS
(Cyprus, Greece, Ireland, Latvia, Luxembourg, Malta and the United Kingdom) reported no human cases. A
total of 279 confirmed cases of tularaemia in humans were reported in the EU, 28 in Norway and 30 were
reported in Switzerland (Table 25). The EU notification rate was 0.07 per 100,000 population. There was a
decrease in the EU notification rate of 0.13 per 100,000 population (-70 %) compared with 2012 (942 cases).
As in the previous four years, the highest notification rate was observed in Sweden (1.13 cases per
100,000 population). The highest case numbers were reported from Sweden and Hungary (114 and 49,
respectively). Notification rates vary across countries and within each country over time. The largest
decreases in notification rate were observed in Finland, by 3.03 (-94 %) and Sweden, by 5.09 (-82 %).
34
Source: The Czech Republic national zoonoses report.
EFSA Journal 2015;13(1):3991
118
EU summary report on zoonoses, zoonotic agents and food-borne outbreaks 2013
Table 25. Reported cases and notification rates per 100,000 of human tularaemia in 2009-2013
2013
Country
Austria
Belgium
Bulgaria
Croatia
Cyprus
Czech Republic
National
Data
Total
(a)
(a)
Coverage
Format Cases
2010
2009
2012
2011
Confirmed
Confirmed
Confirmed Confirmed Confirmed
Cases &
Cases &
Cases &
Cases &
Cases &
Rates
Rates
Rates
Rates
Rates
Cases Rate Cases Rate Cases Rate Cases Rate Cases Rate
2 0.02
2
0.02
0 0.00
3 0.04
2 0.02
1 0.01
0
0.00
0 0.00
0 0.00
0 0.00
1 0.01
0
0.00
0 0.00
3 0.04
7 0.09
2 0.05
1
0.02
0 0.00
0
0.00
0 0.00
0 0.00
0 0.00
36 0.34
42
0.40
57 0.54
50 0.48
64 0.61
Y
Y
Y
Y
Y
Y
C
A
A
C
C
C
2
1
1
2
0
36
Denmark
Estonia
Finland
France
Germany
Greece
Hungary
Ireland
Italy
Latvia
Lithuania
Luxembourg
Malta
Y
Y
Y
Y
Y
Y
Y
Y
Y
Y
Y
C
C
C
C
C
C
C
C
C
C
C
1
15
40
20
0
49
0
0
4
0
0
1
15
21
20
0
48
0
0
4
0
0
0.08
0.28
0.03
0.02
0.00
0.49
0.00
0.00
0.14
0.00
0.00
0
233
5
21
0
18
0
2
6
3
0
0
0.00
4.31
0.01
0.03
0.00
0.18
0.00
0.00
0.29
0.10
0.00
0.00
2
75
16
17
0
15
0
0
0
0
0
0
0.15
1.40
0.03
0.02
0.00
0.15
0.00
0.00
0.00
0.00
0.00
0.00
0
91
22
31
0
126
0
1
0
1
0
0
0.00
1.70
0.03
0.04
0.00
1.28
0.00
0.00
0.00
0.03
0.00
0.00
0
405
16
10
0
38
0
2
0
1
0
0
0.00
7.60
0.03
0.01
0.00
0.39
0.00
0.00
0.00
0.03
0.00
0.00
Netherlands (b)
Poland
(b)
Portugal
Romania
Slovakia
Slovenia
Spain
Sweden
United Kingdom
EU Total
Iceland
Y
Y
Y
Y
Y
Y
Y
Y
C
C
C
C
C
C
C
C
8
1
9
2
2
114
0
306
0
8
1
9
2
0
108
0
279
0
0.02
0.01
0.17
0.10
0.00
1.13
0.00
0.07
0.00
6
0.02
0
0.00
8
0.15
4
0.20
1
0.00
590
6.22
0
0.00
942 0.199
0
0.00
6
0
5
0
1
350
0
544
0
0.02
0.00
0.09
0.00
0.00
3.72
0.00
0.12
0.00
4
4
17
0
1
484
1
839
0
0.01
0.02
0.32
0.00
0.00
5.18
0.00
0.18
0.00
1
0
22
1
12
244
0
825
0
0.00
0.00
0.41
0.05
0.03
2.64
0.00
0.18
0.00
(b)
Liechtenstein(b)
Norway
Y
C
28
28 0.55
50
Switzerland(c)
Y
C
30
30 0.37
40
(a): Y, yes; N, no; A, aggregated data; C, case-based data;-, no data.
(b): No surveillance system.
(c): Switzerland provided data directly to EFSA.
1.00
0.50
180 3.66
15 0.19
33 0.68
14 0.18
13 0.27
4 0.05
There was a decreasing EU trend (not significant) of confirmed tularaemia cases in 2009–2013 (Figure 42).
The peak in 2012 was attributed to high case numbers occurring in Finland and Sweden. There is a
seasonal variation in tularaemia cases, and the peak occurs mostly between July to October.
EFSA Journal 2015;13(1):3991
119
EU summary report on zoonoses, zoonotic agents and food-borne outbreaks 2013
400
Number of cases
300
200
100
Number of cases
12-month moving average
0
Jan 2009
Jul 2009
Jan 2010
Jul 2010
Jan 2011
Jul 2011
Jan 2012
Jul 2012
Jan 2013
Jul 2013
Month
Source: Austria, Bulgaria, Czech Republic, Estonia, Finland, France, Germany, Hungary, Latvia, Norway, Poland, Romania, Slovakia,
Slovenia, Spain, Sweden and United Kingdom. Cyprus, Greece, Iceland, Ireland, Luxembourg and Malta reported zero cases
throughout the period. Belgium, Croatia, Lithuania and Italy did not report data over the whole period at the level of detail
required for analysis. Denmark, Netherlands and Portugal do not have a surveillance system for this disease.
Figure 42. Trend in reported confirmed cases of human tularaemia in the EU/EEA, 2009-2013
The majority of tularaemia cases in Europe were reported to be locally acquired (80.3 %)
(Table TULARHUMIMPORT). Only Germany, Hungary and Norway reported travel-associated cases. Of the
five travel-associated cases reported in total, four were acquired within another EU country, including two
acquired in Sweden.
Eight MS provided data on hospitalisation for all or some of their cases which accounted for 26.9 % of the
confirmed cases in the EU. On average, 52 % of confirmed tularaemia cases were hospitalised.
Nine MS provided information on the outcome of their cases which accounted for 46.3 % of all confirmed
cases. No deaths due to tularaemia were reported in 2013.
3.14.2. Francisella tularensis in animals
Only one MS, Sweden, reported on the occurrence of Francisella tularensis (F. tularensis) in animals during
2012 and 2013. In 2013, Sweden investigated 37 wild hares submitted for necropsy and found 11 positive
animals (29.7 %), similar to the level observed in 2012 when 12 positive hares (29.3 %) were detected out of
41 tested animals. Sweden also tested 238 wild rodents without positive findings. All the samples were
derived from passive monitoring.
3.14.3. Discussion
The incidence of tularaemia is highly variable among MS. Most cases are usually diagnosed in Sweden and
Finland, followed by Norway, Hungary and the Czech Republic. Southern European countries are more
exceptionally affected. The increase in case numbers reported to TESSy from France is an artefact, probably
due to differences in case definitions, as data displayed by the French public health website do not show this
increase (InVS, 2014). The Netherlands do not report the disease to ECDC; however, since 2011, after more
than 50 years without autochthonous cases, there have been five human cases of tularaemia and three
confirmed cases in hares. Tularaemia cases were found at different locations throughout the Netherlands
(Zomer et al., 2014).
Only Sweden reported to EFSA on the occurrence of F. tularensis in animals during 2012 and 2013, and
positive findings were found in wild hares in both years. According with the OIE World Animal Health
Information Database (WAHID), in addition to Sweden, four other MS and one non-MS have reported
findings of F. tularensis in animals during the years 2012-2013.
EFSA Journal 2015;13(1):3991
120
EU summary report on zoonoses, zoonotic agents and food-borne outbreaks 2013
3.15.
Other zoonoses and zoonotic agents
Submitted and validated
efsajournal/pub/3991.htm).
data
by
the
MS
are
available
online
(http://www.efsa.europa.eu/en/
3.15.1. Cysticercus
Belgium and Sweden reported information on Cysticercus in slaughter animals, during the period 2011-2013.
For Taenia saginata (T. saginata) cysts, in Belgium, 808,075 cattle were inspected at the slaughterhouse
and 994 (0.12 %) carcases were found to be positive in 2013, of which 16 were heavily contaminated. In
2012 and 2011, the proportions of positive carcases reported were 0.15 % and 0.16 %, respectively.
In 2013, Sweden inspected 417,384 bovine carcases for Cysticercus cysts (T. saginata) and detected one
positive, which is consistent with the data reported in 2012 and 2011.
Sweden also reported data on T. solium cysts in pigs at slaughter. As in 2011 and 2012, in 2013, none of the
2,550,712 tested pig carcases was found to be positive.
3.15.2. Sarcocystis
Belgium reported data on Sarcocystis in bovine carcases from meat production animals at the
slaughterhouse in 2013. Of the 808,075 carcases inspected, 75 (0.009 %) were found to be positive, which
is similar to what was reported in 2012 (0.007 %).
3.16.
Food-borne outbreaks
The Appendix contains hyperlinks to all data summarised for the production of this section, for food-borne
outbreaks. It also includes hyperlinks to food-borne outbreaks summary tables and figures that were not
displayed in this section because they did not trigger any marked observation. The summarised data are
presented in downloadable Excel and PDF files, and are listed by subject. Moreover, all submitted and
validated data by the MS are available online (http://www.efsa.europa.eu/en/efsajournal/pub/3991.htm).
Comparability of data
It is important to note that the food-borne outbreak investigation systems at the national level are not
harmonised among MS. Therefore, the differences in the number and type of reported outbreaks, as well as
in the causative agents, may not necessarily reflect the level of food safety among MS; rather they may
indicate differences in the sensitivity of the national systems in identifying and investigating food-borne
outbreaks. In addition, some MS implemented changes in national systems over time, which had an impact
on the number of outbreaks reported by the same MS in different years.
3.16.1. General overview
The reporting of investigated food-borne outbreaks has been mandatory for EU MS since 2003. Starting in
2007, harmonised specifications on the reporting of food-borne outbreaks at the EU level have been applied.
Since 2010, revised reporting specifications for food-borne outbreaks were implemented and the distinction
between ‘verified’ and ‘possible’ food-borne outbreaks was abandoned. Instead, outbreaks were categorised
as having ‘strong evidence’ or ‘weak evidence’ based on the strength of evidence implicating a suspected
food vehicle. In the former case, i.e. where the evidence implicating a particular food vehicle was strong,
based on an assessment of all available evidence, a detailed dataset was reported for outbreaks. In the
latter case, i.e. where no particular food vehicle was suspected or where the evidence for food-borne
outbreaks implicating a particular food vehicle was weak, only a limited dataset was reported. This minimal
dataset included the number of outbreaks per causative agent and the number of human cases,
hospitalisations and deaths. In this section the term ‘weak-evidence outbreak’ also covers outbreaks for
which no particular food vehicle was suspected.
Data from 2013 provide information on the total number of reported food-borne outbreaks attributed to
different causative agents, including food-borne outbreaks for which the causative agent was unknown.
In this general overview, all reported food-borne outbreaks, including water-borne outbreaks, are included in
the tables and figures. In Section 3.16.2, outbreaks are presented in more detail and are categorised by the
causative agent, excluding strong-evidence water-borne outbreaks. All water-borne outbreaks with strong
evidence are addressed separately in Section 3.16.3.
In 2013, 24 MS and three non-MS provided data on food-borne outbreaks, whereas no outbreak data were
reported by Bulgaria, Cyprus, Italy and Luxembourg.
EFSA Journal 2015;13(1):3991
121
EU summary report on zoonoses, zoonotic agents and food-borne outbreaks 2013
Types of evidence supporting the outbreaks
The classification of outbreaks as either strong- or weak-evidence outbreaks was based on an assessment
of all available evidence, and more than one type of evidence is often reported in one outbreak. For strongevidence outbreaks, the types of supporting evidence are:
•
•
Epidemiological evidence:
−
Descriptive epidemiological evidence
−
Analytical epidemiological evidence
Microbiological evidence:
−
Detection in the food vehicle or its component and detection of the indistinguishable
causative agent in humans
−
Detection in the food chain or its environment and detection of the indistinguishable
causative agent in humans
−
Detection in the food vehicle or its component and symptoms and onset of illness
pathognomonic of the causative agent found in the food vehicle or its component or in the
food chain or its environment
−
Detection in the food chain or its environment and symptoms and onset of illness
pathognomonic of the causative agent found in the food vehicle or its component or in the
food chain or its environment
The types of evidence reported for the strong-evidence outbreaks, including strong-evidence water-borne
outbreaks, are presented in Table FBOEVID.
Number of outbreaks and human cases
In 2013, a total of 5,196 food-borne outbreaks, including both weak- and strong-evidence outbreaks, were
reported by the 24 reporting MS. The overall reporting rate in 2013 at the EU level was 1.19 outbreaks per
100,000 population (Table 26), which was similar to the rate observed in 2012 (1.07).
As in the previous year, Latvia continued to have the highest reporting rate, followed by Slovakia (Table 26
and Figure 43). France reported the largest number of outbreaks and accounted for 23.5 % of all reported
outbreaks, followed by Latvia with 11.5 % of the total outbreaks reported.
A total of 839 strong-evidence outbreaks were reported by 21 MS, representing 16.1 % of the total number of
food-borne outbreaks recorded in 2013 (Table 26). This was 10 % higher than the number of strongevidence outbreaks reported in 2012. As in previous years, the highest numbers of strong-evidence
outbreaks were reported by France, Spain and Poland, accounting for 63.4 % of the total number of reported
strong-evidence outbreaks in 2013 (Table 26). MS varied in the proportion of strong- and weak-evidence
outbreaks reported in 2013 (Figure 44).
Overall, the 5,196 outbreaks reported by MS involved 43,183 human cases, 5,946 hospitalisations and
11 deaths. The 70 outbreaks reported in total by the non-MS (Iceland, Switzerland and Norway) comprised
1,236 human cases with 11 hospitalisations and one fatality. It is important to note that the number of human
cases may be unknown for some outbreaks. With regard to the 839 strong-evidence outbreaks reported in
the EU, a total of 13,524 human cases were involved and, of these cases, 1,811 people (13.4 %) were
admitted to hospital and nine people died (0.07 %). In the non-MS, eight strong-evidence outbreaks were
reported involving 133 human cases with nine hospitalisations and one fatality (Table 26).
In 2012 5,363 outbreaks (763 with strong-evidence) were reported by 25 MS, involving 55,453 human cases,
5,118 hospitalisations and 41 deaths, in 2012. The noticeable lower number of human cases during 2013 is
mainly explained by one strong-evidence norovirus outbreak reported by Germany in 2012, which affected
10,950 people (EFSA and ECDC, 2014). This outbreak was reported as having school/kindergarten as a
setting and was associated with one batch of frozen strawberries from China mainly distributed through one
big catering company.
Of the nine fatalities related to strong-evidence outbreaks, three were associated with Salmonella, three with
Listeria (under ‘Other bacterial agents’), one with Clostridium perfringens (C. perfringens) toxins, one with
mushroom toxins and one with an unknown agent (Table 27).
Further details on the number of food-borne outbreaks and human cases reported in the EU and in non-MS
in 2013 can be found in Table 26.
EFSA Journal 2015;13(1):3991
122
EU summary report on zoonoses, zoonotic agents and food-borne outbreak 2013
Table 26. Number of all food-borne outbreaks and human cases in the EU, 2013
Country
Strong-evidence outbreaks
N
Cases
Hospitalised
Weak-evidence outbreaks
Deaths
N
Cases
Hospitalised
Total outbreaks Reporting rate per 100,000
Deaths
Austria
24
262
34
0
109
306
74
0
133
1.57
Belgium
23
264
28
0
288
1048
66
0
311
2.79
Croatia
6
94
18
0
54
658
32
0
60
1.41
Czech Republic
0
0
0
0
19
350
50
0
19
0.18
40
1590
53
0
29
385
7
0
69
1.23
Denmark
Estonia
1
28
2
0
13
276
10
0
14
1.06
Finland
15
410
16
0
28
357
20
0
43
0.79
France
249
2558
152
2
972
7273
394
0
1221
1.86
33
865
290
3
375
1221
224
0
408
0.51
Greece
2
50
0
0
22
503
34
0
24
0.22
Hungary
9
409
27
0
110
1145
136
0
119
1.2
Ireland
5
51
17
0
20
155
28
0
25
0.54
Germany
Latvia
1
7
4
0
597
1818
1073
0
598
29.55
18
151
124
0
97
220
173
0
115
3.87
Malta
0
0
0
0
6
57
0
0
6
1.42
Netherlands
8
23
0
0
283
1442
6
0
291
1.73
125
949
397
1
321
4559
957
0
446
1.16
Portugal
18
372
25
0
0
0
0
0
18
0.17
Romania
19
428
316
0
1
14
9
0
20
0.1
Slovakia
4
235
14
0
454
2308
629
0
458
8.46
Lithuania
Poland
Slovenia
0
0
0
0
4
56
9
0
4
0.19
158
1769
239
0
266
2819
157
2
424
0.91
Sweden
16
476
3
0
270
1207
11
0
286
2.99
United Kingdom
0.13
Spain
65
2533
52
3
19
261
36
0
84
Iceland
0
0
0
0
3
34
1
0
3
0.93
Norway
4
114
8
1
55
1016
0
0
59
1.17
0
4
53
1
0
8
0.1
9 4357
28438
4135
2
5196
1.19
Switzerland
Total (MS)
EFSA Journal 2015;13(1):3991
4
19
1
839
13524
1811
123
EU summary report on zoonoses, zoonotic agents and food-borne outbreaks 2013
Austria
Belgium
Croatia
Czech Republic
Denmark
Estonia
Finland
France
Germany
Greece
Hungary
Ireland
Latvia
Lithuania
Malta
Netherlands
Poland
Portugal
Romania
Slovakia
Slovenia
Spain
Sweden
United Kingdom
Iceland
Norway
Switzerland
Reporting rate per 100,000
Figure 43. Reporting rate per 100,000 population in Member States and non-Member States, 2013
Austria
Belgium
Croatia
Czech Republic
Denmark
Estonia
Finland
France
Germany
Greece
Hungary
Ireland
Latvia
Lithuania
Malta
Netherlands
Poland
Portugal
Romania
Slovakia
Slovenia
Spain
Sweden
United Kingdom
Iceland
Norway
Switzerland
Strong-evidence outbreak
Weak-evidence outbreak
Number of outbreaks
Figure 44. Distribution of food-borne outbreaks in Member States and non-Member States, 2013
EFSA Journal 2015;13(1):3991
124
EU summary report on zoonoses, zoonotic agents and food-borne outbreaks 2013
Causative agents
Within the EU, the causative agent was known in 71.1 % of the total number of outbreaks reported (Table 27
and Figure 45). Salmonella remained the most commonly detected causative agent in the food-borne
outbreaks reported (22.5 % of outbreaks), followed by virus, bacterial toxins and Campylobacter, which
accounted for 18.1 %, 16.1 % and 8.0 % of the outbreaks, respectively. Other agents each accounted for
2.5 % or less of the food-borne outbreaks.
The total number of Salmonella outbreaks in 2013 decreased by 23.8 % compared to 2012, from
1,533 outbreaks to 1,168 outbreaks. Compared with 2008, when there were 1,888 outbreaks due to
Salmonella, the number of outbreaks decreased markedly by 38.1 %. A decrease (by 17.4 %) was also
observed in the number of reported outbreaks caused by Campylobacter, compared with 2012. In contrast,
increases of 24.6 % and 7.3 % were observed in the numbers of outbreaks caused by viruses and bacterial
toxins, respectively, compared with the previous year. The number of viral food-borne outbreaks within the
EU varied importantly during the six-year period 2008 to 2013. After a peak in 2009, the number of reported
viral food-borne outbreaks in the EU has notably increased (by 80.8 %) in the last three years. As regards
bacterial toxins, the total number of reported outbreaks, 834 in 2013, has actually increased by 58.9 % since
2008, when there were 525 outbreaks. The number of outbreaks in which the causative agent was unknown
also increased (by 1.6 %) in 2013 compared with 2012 (Figure 46).
Considering the outbreaks reported for each causative agent, the highest proportion of strong-evidence
outbreaks was reported for parasites (58.5 %), followed by the group of ‘Other causative agents’ (57.6 %)
and Salmonella (27.0 %). The single outbreak caused by pathogenic E. coli (non-VTEC) reported was
supported by strong evidence (Table 27 and Figure 45).
The causative agent was known in 91.8 % of the reported strong-evidence outbreaks in the EU. Salmonella
was the most frequent causative agent of strong-evidence outbreaks (37.5 % of outbreaks), followed by
bacterial toxins and viruses, responsible for 24.8 % and 10.4 % of outbreaks, respectively (Table 27).
Further details of the number of food-borne outbreaks and human cases per causative agent reported in the
EU in 2013 can be found in Table 27.
Food vehicle
The food vehicle was reported in all 839 strong-evidence outbreaks, even though in 64 outbreaks (7.6 %) it
was reported as ‘Other foods’ with no additional information on the food vehicle. As in previous years, the
most common single food vehicle categories implicated in strong-evidence outbreaks were eggs and egg
products (18.5 %), followed by mixed food (10.7 %), and fish and fish products (8.5 %). In 2013, strongevidence outbreaks associated with ‘Crustaceans, shellfish, molluscs and products thereof’ (7.3 %)
increased by 74.3 % compared with the previous year. The majority of these outbreaks were reported by
three MS and was caused by Calicivirus, followed by marine biotoxins and Listeria.
The distribution of the strong-evidence outbreaks by food vehicle in the EU is shown in Figure 47.
Setting
The setting was provided in all the 839 of strong-evidence outbreaks. However, for 73 outbreaks, the setting
was reported as ‘Others’ (58 outbreaks) or ‘Unknown’ (15 outbreaks). The category ‘Household/domestic
kitchen’ (38.5 %) was the most commonly reported setting, followed by ‘Restaurant, café, pub, bar, hotel’
(22.2 %). Apart from restaurants and households, the next most common settings in strong-evidence
outbreaks were ‘Other settings’ (8.6 %) and ‘School, kindergarten’ (8.3 %). In 2013, there were no major
changes in the distribution of the strong-evidence outbreaks by settings compared with 2012.
The distribution of the strong-evidence outbreaks by setting in the EU is shown in Figure 48.
EFSA Journal 2015;13(1):3991
125
EU summary report on zoonoses, zoonotic agents and food-borne outbreaks 2013
Table 27. Number of outbreaks and human cases per causative agents in food-borne outbreaks in the EU (including strong evidence water-borne
outbreaks), 2013
Causative agent
Salmonella
Strong-evidence outbreaks
N
%
Weak-evidence outbreaks
Cases Hospitalised Deaths
N
Total
Total
%
Cases Hospitalised Deaths outbreaks
%
315
37.54
4371
1134
3
853 19.58
4338
1033
2
1168 22.48
87
10.37
2023
126
0
855 19.62
7568
1841
0
942 18.13
208
24.79
4006
163
1
626 14.37
5197
289
0
834 16.05
Campylobacter
32
3.81
478
15
0
382
8.77
1314
131
0
414
7.97
Other causative agents
76
9.06
520
46
1
56
1.29
445
27
0
132
2.54
Other bacterial agents
14
1.67
213
25
3
66
1.51
688
84
0
80
1.54
Escherichia coli , pathogenic Verotoxigenic E. coli (VTEC)
Parasites
12
1.43
154
36
0
62
1.42
353
70
0
74
1.42
Viruses
Bacterial toxins
24
2.86
243
128
0
17
0.39
67
6
0
41
0.79
Yersinia
1
0.12
2
0
0
7
0.16
14
2
0
8
0.15
Escherichia coli , pathogenic (excluding
VTEC)
Unknown
1
0.12
128
0
0
0
0
0
0
0
1
0.02
69
8.22
1386
138
1 1433 32.89
8454
652
0
1502 28.91
100 13524
1811
100 28438
4135
2
5196
Total
839
9 4357
100
Bacterial toxins include toxins produced by Bacillus, Clostridium and Staphylococcus. Food-borne viruses include calicivirus, hepatitis A virus, Flavivirus, Rotavirus and other unspecified viruses. Other
causative agents include mushroom toxins, marine biotoxins, histamine, mycotoxins and escolar fish (wax esters). Parasites include primarily Trichinella, but also Cryptosporidium, Giardia and other
unspecified parasites. Other bacterial agents include Listeria, Brucella, Shigella, Vibrio and other unspecified bacterial agents.
EFSA Journal 2015;13(1):3991
126
EU summary report on zoonoses, zoonotic agents and food-borne outbreaks 2013
Unknown
Salmonella
Viruses
Bacterial toxins
Campylobacter
Other causative agents
Strong-evidence outbreaks
Other bacterial agents
Weak-evidence outbreaks
Escherichia coli, pathogenic (including
VTEC)
Parasites
Yersinia
Number of outbreaks
Bacterial toxins include toxins produced by Bacillus, Clostridium and Staphylococcus. Food-borne viruses include calicivirus, hepatitis A
virus, Flavivirus, Rotavirus and other unspecified viruses. Other causative agents include mushroom toxins, marine biotoxins, histamine,
mycotoxins and escolar fish (wax esters). Parasites include primarily Trichinella, but also Cryptosporidium, Giardia and other
unspecified parasites. Other bacterial agents include Listeria, Brucella, Shigella, Vibrio and other unspecified bacterial agents. In this
figure, the category ‘Escherichia coli, pathogenic (including VTEC)’ also includes one strong-evidence outbreak due to pathogenic
E. coli other than VTEC.
Figure 45. Distribution of all food-borne outbreaks per causative agent in the EU, 2013
Unknown
Salmonella
Viruses
Bacterial toxins
2008
Campylobacter
2009
Other causative agents
2010
2011
Other bacterial agents
2012
Escherichia coli, pathogenic (including
VTEC)
2013
Parasites
Yersinia
Number of outbreaks
Bacterial toxins include toxins produced by Bacillus, Clostridium and Staphylococcus. Food-borne viruses include calicivirus, hepatitis A
virus, Flavivirus, Rotavirus and other unspecified viruses. Other causative agents include mushroom toxins, marine biotoxins, histamine,
mycotoxins and escolar fish (wax esters). Parasites include primarily Trichinella, but also Cryptosporidium, Giardia, Anisakis and other
unspecified parasites. Other bacterial agents include Listeria, Brucella, Shigella, Vibrio and other unspecified bacterial agents. In this
figure, the category ‘Escherichia coli, pathogenic (including VTEC)’ also includes one strong-evidence outbreak due to pathogenic
E. coli other than VTEC.
Figure 46. Total number of food-borne outbreaks in the EU, 2008-2013
EFSA Journal 2015;13(1):3991
127
EU summary report on zoonoses, zoonotic agents and food-borne outbreaks 2013
Bakery products,
2.6%
Bovine meat and
products thereof,
3.6%
N=839
Tap water, 1.1%
Buffet meals, 3.7%
Eggs and egg
products
Sweets and
chocolate, 4.2%
Vegetables and juices
and other products
thereof, 4.4%
18.5 %
5.2 %
Broiler meat (Gallus
gallus) and products
thereof
Other foodstuffs
15.4 %
7.2 %
Other or mixed meat
and products thereof
7.3 %
Crustaceans,
shellfish, molluscs
and products thereof
7.7 %
Pig meat and
products thereof
10.7 %
8.5 %
Mixed food
Fish and fish products
Data from 839 outbreaks are included: Austria (24), Belgium (23), Croatia (6), Denmark (40), Estonia (1), Finland (15), France (249),
Germany (33), Greece (2), Hungary (9), Ireland (5), Latvia (1), Lithuania (18), Netherlands (8), Poland (125), Portugal (18), Romania
(19), Slovakia (4), Spain (158), Sweden (16) and United Kingdom (65).
Other foodstuffs (N=129) include: canned food products (3), cereal products including rice and seeds/pulses (nuts, almonds) (7), cheese
(11), dairy products (other than cheese) (7), drinks (3), fruit, berries and juices and other products thereof (10), herbs and spices (4),
milk (11), and other foods (73).
Figure 47. Distribution of strong-evidence outbreaks by food vehicle in the EU, 2013
At hospital/medical
care facility or care
home, 2.3%
Camp, picnic, 2.6%
Temporary mass
catering (fairs,
festivals), 1.8% Disseminated cases,
1.7%
Unknown
Residential institution
(nursing home, prison,
boarding school), 2.7%
Canteen or workplace
catering
School, kindergarten
Other settings
6.3 %
N=839
5.0 %
8.3 %
38.5 %
8.6 %
Household / domestic
kitchen
22.2 %
Restaurant, café, pub,
bar, hotel
Data from 839 outbreaks are included: Austria (24), Belgium (23), Croatia (6), Denmark (40), Estonia (1), Finland (15), France (249),
Germany (33), Greece (2), Hungary (9), Ireland (5), Latvia (1), Lithuania (18), Netherlands (8), Poland (125), Portugal (18), Romania
(19), Slovakia (4), Spain (158), Sweden (16) and United Kingdom (65).
Other settings (N=72) include: catering on aircraft or ship or train (1), farm (primary production) (2), mobile retailer, market/street vendor
(6), take-away or fast-food outlet (5) and other settings (58).
Figure 48. Distribution of strong-evidence outbreaks by settings in the EU, 2013
3.16.2. Overview by causative agent
Specific information on food-borne outbreaks caused by Salmonella, Campylobacter, pathogenic E. coli
(including VTEC), Brucella and Trichinella, can be found in the respective sections, while information on
food-borne outbreaks caused by viruses, bacterial toxins, other causative agents, and parasites is
128
EFSA Journal 2015;13(1):3991
EU summary report on zoonoses, zoonotic agents and food-borne outbreaks 2013
summarised in this section. The figures of outbreaks presented here do not include water-borne outbreaks,
which are addressed separately in Section 3.16.3.
Viruses
Twenty-one MS reported a total of 941 food-borne outbreaks caused by viruses (Table 28), excluding one
strong-evidence water-borne outbreak. This represents 18.1 % of all outbreaks reported in the EU. At the
national level, the number of outbreaks due to viruses continued to increase in Latvia (29 outbreaks in 2011,
compared with 311 in 2012 and 439 in 2013). It is important to note that from 2012 Latvia has reported viral
outbreaks with two or more cases, compared with only outbreaks with at least five human cases in 2011. The
overall reporting rate in the EU was 0.23 outbreaks per 100,000 population. Latvia reported the majority of
the outbreaks (46.7 %), followed by Poland (15.4 %). In addition, two non-MS reported 16 outbreaks (Table
28).
Only 86 (9.1 %) of reported viral outbreaks in the EU had strong evidence, and these were reported by
16 MS. Further information on the strong-evidence food-borne outbreaks caused by the different viruses can
be found in Table 29.
In strong-evidence outbreaks caused by viruses, ‘Crustaceans, shellfish, molluscs and products thereof’ was
the most commonly implicated food vehicle (40 % of outbreaks). The second most frequently reported
implicated single food vehicle was ‘Buffet meals’ (14.0 % of outbreaks), followed by ‘Fruit, berries and juices
and other products thereof’ and ‘Mixed food’ (both 11.6 %).
Information on the type of outbreak was available for all the strong-evidence outbreaks: 68 were general
outbreaks, and 18 were household/domestic kitchen outbreaks. The setting most frequently reported was
‘Restaurant, café, pub, bar, hotel’ (25 outbreaks), followed by household (21 outbreaks). The setting was
either not reported or indicated as ‘Others’ for 20 outbreaks.
Seventy-six outbreaks were caused by calicivirus (all caused by norovirus), representing 88.4 % of all the
viral strong-evidence outbreaks, excluding water-borne outbreaks. The distribution of food vehicles in strongevidence outbreaks caused by norovirus in the EU is shown in figure FBOVIRUSVEHIC.
Table 28. Strong- and weak-evidence food-borne outbreaks caused by viruses (excluding strongevidence water-borne outbreaks) in the EU, 2013
Country
Strong-evidence outbreaks
Weak-evidence outbreaks
N Cases Hospitalised Deaths
N
Cases Hospitalised Deaths
Total outbreaks Reporting rate per 100,000
Austria
7
135
13
0
7
36
4
0
14
Belgium
1
20
5
0
3
26
2
0
4
0.04
Croatia
0
0
0
0
11
295
3
0
11
0.26
Denmark
0.17
13
412
52
0
13
272
0
0
26
0.46
Estonia
0
0
0
0
1
248
0
0
1
0.08
Finland
7
154
13
0
7
170
2
0
14
0.26
France
23
249
5
0
43
530
8
0
66
0.1
Germany
3
21
4
0
23
73
12
0
26
0.03
Greece
0
0
0
0
1
3
3
0
1
0.01
Hungary
1
124
0
0
3
159
17
0
4
0.04
Ireland
2
23
13
0
2
72
0
0
4
0.09
Latvia
0
0
0
0 439
1356
813
0
439
21.69
Lithuania
2
6
6
0
14
31
31
0
16
0.54
Netherlands
4
14
0
0
12
200
0
0
16
0.1
Poland
1
10
3
0 144
2568
554
0
145
0.38
Portugal
2
96
0
0
0
0
0
0
2
0.02
Slovakia
1
5
5
0
92
904
387
0
93
1.72
Slovenia
0
0
0
0
1
33
0
0
1
0.05
Spain
9
92
6
0
12
238
2
0
21
0.04
Sweden
3
152
0
0
22
298
3
0
25
0.26
United Kingdom
7
336
1
0
5
56
0
0
12
0.02
Norway
2
85
5
0
13
517
0
0
15
0.3
Switzerland
0
0
0
0
1
21
0
0
1
0.01
86
1849
126
0 855
7568
1841
0
941
0.23
Total (MS)
EFSA Journal 2015;13(1):3991
129
EU summary report on zoonoses, zoonotic agents and food-borne outbreaks 2013
Table 29. Strong-evidence food-borne outbreaks caused by viruses (excluding strong-evidence
water-borne outbreaks) in the EU, 2013
Causative agent
Calicivirus - norovirus (Norwalk-like
virus)
Country
Austria
Belgium
Denmark
N outbreaks
6
Cases Hospitalised Deaths
129
9
0
1
20
5
0
12
340
1
0
Finland
6
139
2
0
France
23
249
5
0
Germany
2
16
0
0
Hungary
1
124
0
0
Netherlands
4
14
0
0
Poland
1
10
3
0
Portugal
2
96
0
0
Spain
9
92
6
0
Sweden
2
130
0
0
United Kingdom
7
336
1
0
Norway
1
78
0
0
Flavivirus
Lithuania
2
6
6
0
Slovakia
1
5
5
0
Hepatitis virus - Hepatitis A virus
Austria
1
6
4
0
Denmark
1
72
51
0
Finland
1
15
11
0
Ireland
2
23
13
0
Sweden
1
22
0
0
Norway
1
7
5
0
Germany
1
5
4
0
86
1849
126
0
Rotavirus
Total (MS)
Of particular note was the multinational Hepatitis A Virus (HAV) outbreak that began in May 2013 in EU/EEA
countries (see text box).
On 8 May 2013, Germany reported seven cases of HAV genotype IA infection in persons with a travel history
to ski resorts in northern Italy. Subsequently, Italy reported an increase in the number of HAV cases at the
national level and declared an outbreak. At the EU level, confirmed and probable epidemic case definitions
were adopted, with reference to the outbreak strain genotyping sequence result (GenBank accession
number KF182323). Since 1 January 2013, 1,444 cases associated with this HAV outbreak have been
reported by 12 EU/ EEA countries. Of these, 331 were confirmed cases. Italy reported 90 % of the cases.
Dispersed or clustered cases without any travel history were also reported in Finland, France, Germany,
Ireland, the Netherlands, Norway and Sweden. To date, no deaths associated with this outbreak have been
reported; however, surveillance systems for HAV infections are not always able to capture this information.
HAV contamination was detected in frozen mixed berries (14 lots) and mixed berry cakes/pastries (2 lots) in
Italy, France and Norway. In Ireland, the Netherlands and Sweden, analysis of food histories and
questionnaires identified suspect berries and berry products consumed by confirmed cases. Tracing of food
items in connection with the multinational HAV outbreak in the EU began with 38 lots/cases from Italy,
Ireland and the Netherlands; an additional 5 lots/cases were added from France, Norway and Sweden in
spring 2014. The tracing data were exchanged via the European Rapid Alert System for Food and Feed
(RASFF). The final dataset comprises 6,227 transactions among 1,974 food operators. Bulgarian
blackberries and Polish redcurrants were the most common ingredients in the traced lots/cases; however,
Poland is the largest producer of redcurrants in Europe, and Bulgaria is a major exporter of frozen
blackberries. No single point source of contamination linking all 43 lots/cases could be identified. HAV
cases/lots in five countries could be linked to seven Polish freezing processors and/or to five frozen berry
suppliers in Bulgaria. This indicates that HAV contamination could be occurring at the freezing processor or
in primary production of berries and therefore compliance with Good Hygiene Practice, Good Manufacturing
Practice and Good Agricultural Practice is recommended for countries producing berries for freezing. It is
possible that contaminated products related to this outbreak could still be circulating in the food chain.
Hence, for the public health domain, enhanced surveillance, risk communication, vaccination and further
research are recommended.
Source: EFSA Scientific Report on ‘Tracing of food items in connection to the multinational hepatitis A virus
outbreak in Europe’, 2014 (EFSA, 2014a).
EFSA Journal 2015;13(1):3991
130
EU summary report on zoonoses, zoonotic agents and food-borne outbreaks 2013
Bacterial toxins
Bacillus toxins
In 2013, nine MS reported 278 outbreaks in which Bacillus toxins were the causative agent, representing
5.4 % of all outbreaks reported within the EU, which is more than in 2012 when 10 MS reported
259 outbreaks representing 4.8 % of all outbreaks. The overall reporting rate in the EU was 0.1 per
100,000 population. France reported the vast majority (84.9 %) of these outbreaks and reported that
2,099 human cases, 69 hospitalisations and no deaths were involved (Table 30).
Table 30. Strong- and weak-evidence food-borne outbreaks caused by Bacillus toxins (excluding
strong-evidence water-borne outbreaks), 2013
Country
Strong-evidence outbreaks
Weak-evidence outbreaks
N Cases Hospitalised Deaths
N
Cases Hospitalised Deaths
Total outbreaks Reporting rate per 100,000
Belgium
5
35
0
0
0
0
0
0
5
0.04
Denmark
5
62
0
0
3
25
0
0
8
0.14
Finland
2
6
0
0
1
5
0
0
3
0.06
France
32
440
10
0 204
1659
59
0
236
0.36
Germany
3
12
0
0
1
19
0
0
4
0
Netherlands
3
7
0
0
10
22
0
0
13
0.08
Poland
2
106
73
0
1
34
34
0
3
0.01
Spain
2
25
0
0
1
3
0
0
3
0.01
0
3
10
0
0
3
0.03
0 224
1777
93
0
278
0.1
Sweden
Total (MS)
0
0
0
54
693
83
In the 54 strong-evidence Bacillus outbreaks, ‘Mixed food’ was the most commonly implicated food vehicle
(29.6 % of outbreaks), followed by ‘Vegetables and juices and other products thereof’ (11.1 % of outbreaks),
and ‘Cereal products’ (9.3 %). The distribution of food vehicles in strong-evidence outbreaks caused by
Bacillus toxins is shown in Figure FBOBACILLUSVEHIC.
Information on the type of outbreak was available for all the Bacillus strong-evidence outbreaks: 51 were
general outbreaks, and three were household/domestic kitchen outbreaks. The setting most frequently
reported was ‘School or kindergarten’ (17 outbreaks), followed by ‘Restaurant, café, pub, bar, hotel’
(12 outbreaks). The setting was either not reported or indicated as ‘Others’ for nine outbreaks.
Clostridium toxins
Twelve MS reported 170 food-borne outbreaks caused by C. perfringens, C. botulinum or other Clostridia
(Table 31). This represents 3.3 % of all outbreaks, almost the same as in 2012 when 13 MS reported
172 outbreaks representing 3.2 % of all outbreaks. France reported the majority (66.5 %) of the outbreaks
(Table 29), representing an increase of 22.8 % compared with 2012. In France, one death was reported from
a C. perfringens strong-evidence outbreak. In addition, one non-MS reported one weak-evidence outbreak.
Details on the number of reported food-borne outbreaks and human cases caused by Clostridium toxins are
summarised in Table 31.
Table 31. Strong- and weak-evidence food-borne outbreaks caused by Clostridium toxins (excluding
strong-evidence water-borne outbreaks), 2013
Country
Strong-evidence outbreaks
Weak-evidence outbreaks
N Cases Hospitalised Deaths
N
Cases Hospitalised Deaths
Total outbreaks Reporting rate per 100,000
Belgium
2
88
0
0
0
0
0
0
2
0.02
Croatia
2
63
4
0
1
11
0
0
3
0.07
Czech Republic
0
0
0
0
1
31
0
0
1
0.01
Denmark
10
682
0
0
6
40
0
0
16
0.29
France
21
482
7
1
92
1235
36
0
113
0.17
Hungary
1
66
0
0
0
0
0
0
1
0.01
Lithuania
2
4
4
0
0
0
0
0
2
0.07
Poland
1
2
2
0
0
0
0
0
1
0
Portugal
2
8
8
0
0
0
0
0
2
0.02
Spain
3
32
2
0
7
179
2
0
10
0.02
Sweden
2
72
1
0
1
10
0
0
3
0.03
14
510
0
0
2
15
0
0
16
0.03
0
1
14
0
0
1
0.31
1 110
1521
38
0
170
0.06
United Kingdom
Iceland
Total (MS)
0
0
0
60
2009
28
EFSA Journal 2015;13(1):3991
131
EU summary report on zoonoses, zoonotic agents and food-borne outbreaks 2013
‘Mixed food’ was the most commonly identified single food vehicle category, associated with 20.0 % of
strong-evidence Clostridium outbreaks, followed by ‘Bovine meat and products thereof’ (18.3 %). The
distribution of food vehicles in strong-evidence outbreaks caused by Clostridium toxins is shown in Figure
FBOCLOSTRIDIUMVEHIC.
Information on the type of outbreak was available for 59 out of 60 strong-evidence outbreaks: 50 were
general outbreaks, and nine were household/domestic kitchen outbreaks. The settings most frequently
reported were ‘Household’ (10 outbreaks) and ‘Restaurant, café, pub, bar, hotel’ (nine outbreaks), followed
by ‘Canteen or workplace catering’ (seven outbreaks) and ‘Residential institution’ (nursing home or prison or
boarding school) (six outbreaks). The setting was unknown or not reported in 10 outbreaks.
In total, seven strong-evidence outbreaks caused by C. botulinum were reported by six MS. All were
household outbreaks (except one for which the type of outbreak was unknown) and accounted for 14 human
cases and 13 hospitalisations (Table 32).
Table 32. Strong-evidence food-borne outbreaks caused by Clostridium botulinum toxins (excluding
strong-evidence water-borne outbreaks), 2013
Country
N outbreaks Cases Hospitalised Deaths
Croatia
1
3
3
0
Lithuania
2
4
4
0
Poland
1
2
2
0
Portugal
1
1
1
0
Spain
1
2
2
0
Sweden
1
2
1
0
Total (MS)
7
14
13
0
In two outbreaks caused by C. botulinum, the implicated food vehicles were canned food products (homemade preserved mushrooms), while the other two outbreaks were associated with the consumption of meat
and meat products (in one outbreak specified as ‘Homemade meat product, sausage’). Fish and fish
products (smoked whitefish) were implicated in one outbreak, while the remaining two outbreaks caused by
C. botulinum were associated with ‘Other foods’.
In Belgium, enterotoxigenic C. perfringens was found at levels up to 6 log CFU/g in leftovers of stew, which
was at the origin of an outbreak that occurred in a residential institution and led to 70 cases of illness. The
pathogenic strain was also isolated from human cases. After preparation of the stew, it was stored
refrigerated for 24 hours and reheated just before consumption. Insufficient cooling of the stew before
refrigerated storage probably caused perfect growth conditions for C. perfringens to reach such a high levels.
Source: The Belgian National Zoonoses Summary Report, 2013
Staphylococcal enterotoxins
In 2013, 12 MS reported 386 food-borne outbreaks caused by staphylococcal toxins (Table 33). This
represents 7.4 % of all outbreaks, an increase compared with 2012 when 14 MS reported 346 outbreaks
caused by staphylococcal toxins. In 2013, the overall reporting rate in the EU was 0.13 per 100,000. France
reported the vast majority (87 %) of the outbreaks (Table 33), representing an increase of 12 % compared
with 2012. In addition, one non-MS reported one weak-evidence outbreak caused by staphylococcal
enterotoxins.
Details on the number of food-borne outbreaks and human cases caused by staphylococcal enterotoxins
reported in 2013 are summarised in Table 33.
EFSA Journal 2015;13(1):3991
132
EU summary report on zoonoses, zoonotic agents and food-borne outbreaks 2013
Table 33. Strong- and weak-evidence food-borne outbreaks caused by staphylococcal toxins
(excluding strong-evidence water-borne outbreaks), 2013
Country
Strong-evidence outbreaks
Weak-evidence outbreaks
N Cases Hospitalised Deaths
N
Cases Hospitalised Deaths
Total outbreaks Reporting rate per 100,000
Belgium
4
59
0
0
0
0
0
0
4
0.04
Croatia
1
6
0
0
0
0
0
0
1
0.02
Denmark
2
104
0
0
1
10
3
0
3
0.05
63
680
23
0 273
1544
133
0
336
0.51
Germany
5
59
7
0
0
0
0
0
5
0.01
Hungary
1
17
13
0
0
0
0
0
1
0.01
Netherlands
0
0
0
0
5
133
0
0
5
0.03
Poland
1
9
0
0
4
94
20
0
5
0.01
Portugal
5
57
6
0
0
0
0
0
5
0.05
Slovakia
1
196
0
0
2
5
0
0
3
0.06
Spain
9
110
3
0
4
106
1
0
13
0.03
Sweden
2
7
0
0
3
7
1
0
5
0.05
Iceland
0
0
0
0
1
17
1
0
1
0.31
94
1304
52
0 292
1899
158
0
386
0.13
France
Total (MS)
The most commonly reported single food category in strong-evidence outbreaks was ‘Mixed foods’ (19.1 %),
followed by ‘Vegetables and juices and other products thereof’ (12.8 %). The distribution of food vehicles in
strong-evidence outbreaks caused by staphylococcal toxins is shown in Figure FBOSTAPHYLVEHIC.
Information on the type of outbreak was available for all the strong-evidence outbreaks caused by
staphylococcal toxins: 70 were general outbreaks, 21 were household/domestic kitchen outbreaks and three
outbreaks were classified as of ‘Unknown’ type. The setting most frequently reported was ‘Household’
(24 outbreaks), followed by ‘School or kindergarten’ (20 outbreaks) and ‘Restaurant, café, pub, bar, hotel’
(17 outbreaks). The setting was either not reported or indicated as ‘Others’ or ‘Unknown’ for nine outbreaks.
Other causative agents
In this report, the category ‘Other causative agents’ includes histamine, marine biotoxins, mushroom toxins,
mycotoxins and wax esters (from fish).
In 2013, 11 MS reported a total of 132 food-borne outbreaks due to other causative agents (Table 34). This
represents 2.5 % of all outbreaks reported at the EU level, similar to 2012. The reporting rate was 0.04 per
100,000 population. In total, 76 strong-evidence outbreaks were reported by nine MS, mostly by France.
The majority (55.3 %) of strong-evidence outbreaks due to other causative agents were caused by histamine
and accounted for 44.4 % of human cases and 65.2 % of hospitalisations reported in these outbreaks. Other
agents included marine biotoxins, mushroom toxins, mycotoxins, and wax esters (Table 35).
The majority of these outbreaks (69.7 %) were associated with the consumption of ‘Fish and fishery
products’.
Information on the type of outbreak was available for all the strong-evidence outbreaks caused by
staphylococcal toxins: 39 were general outbreaks, 31 were household/domestic kitchen outbreaks and six
outbreaks were classified as of ‘Unknown’ type. The setting most frequently reported was ‘Household’
(30 outbreaks), followed by ‘Restaurant, café, pub, bar, hotel’ (27 outbreaks). The setting was either not
reported or indicated as ‘Others’ or ‘Unknown’ for eight outbreaks.
EFSA Journal 2015;13(1):3991
133
EU summary report on zoonoses, zoonotic agents and food-borne outbreaks 2013
Table 34. Strong- and weak-evidence food-borne outbreaks caused by other causative agents
(excluding strong-evidence water-borne outbreaks), 2013
Country
Strong-evidence outbreaks
Weak-evidence outbreaks
N Cases Hospitalised Deaths N Cases Hospitalised Deaths
Total outbreaks Reporting rate per 100,000
Belgium
3
7
3
0
1
2
0
0
4
0.04
Croatia
1
3
1
0
1
23
1
0
2
0.05
Denmark
5
140
0
0
0
0
0
0
5
0.09
Finland
3
27
1
0
0
0
0
0
3
0.06
France
36
185
26
0 43
209
16
0
79
0.12
Germany
7
17
3
0
0
0
0
0
7
0.01
Latvia
0
0
0
0
1
2
0
0
1
0.05
Poland
3
9
9
1
0
0
0
0
3
0.01
15
111
3
0
7
195
0
0
22
0.05
Sweden
3
21
0
0
2
4
0
0
5
0.05
United Kingdom
0
0
0
0
1
10
10
0
1
0
Switzerland
3
7
1
0
0
0
0
0
3
0.04
76
520
46
1 56
445
27
0
132
0.04
Spain
Total (MS)
Table 35. Strong-evidence food-borne outbreaks caused by other causative agents (excluding
strong-evidence water-borne outbreaks), 2013
Causative agent
Histamine
Country
N outbreaks
Belgium
3
Croatia
Finland
France
Germany
Spain
Sweden
Switzerland
Cases Hospitalised Deaths
7
3
0
1
3
1
0
3
27
1
0
14
71
22
0
7
17
3
0
11
85
0
0
3
21
0
0
3
7
1
0
22
114
4
0
Spain
1
16
0
0
Poland
3
9
9
1
Spain
2
8
3
0
Mycotoxins
Denmark
5
140
0
0
Wax esters (from fish)
Spain
1
2
0
0
76
520
46
1
Marine biotoxins
Mushroom toxins
Total (MS)
France
Other bacterial agents
Under the category ‘Other bacterial agents’, outbreaks due to Listeria, Shigella, Brucella, Vibrio
parahaemolyticus and other bacterial agents are reported. Outbreaks caused by Listeria and Brucella are
discussed in the respective sections.
Two strong-evidence outbreaks caused by Shigella sonnei were reported by two MS, Denmark and Spain.
The Danish outbreak was associated with the consumption of buffet meals and affected five people, who all
had their meal in the same hotel in Turkey. The Spanish outbreak was associated with the consumption of
broiler meat and involved 28 human cases, of which two were hospitalised. Both the setting and the type of
outbreak were reported as ‘Unknown’ for the Spanish outbreak. In addition, 24 weak-evidence outbreaks
caused by Shigella were reported by 10 MS.
Two strong-evidence general outbreaks due to Vibrio parahaemolyticus were reported by two MS, France
and Spain. Both outbreaks were associated with the consumption of crustaceans, shellfish, molluscs and
products thereof. Overall, 33 people were affected, but no one was hospitalised. The setting of the Spanish
outbreak was ‘Restaurant, café, pub, bar, hotel’; while no specific information on the setting (classified as
‘Other’) was reported for the French outbreak.
In addition, three strong-evidence general food-borne outbreaks due to other (unspecified) bacteria were
reported by Austria. Of these, two outbreaks were associated with the consumption of mixed food, while one
outbreak was attributed to the consumption of vegetables and juices and other products thereof. In total
EFSA Journal 2015;13(1):3991
134
EU summary report on zoonoses, zoonotic agents and food-borne outbreaks 2013
96 people were affected, and 12 of them were hospitalised. Two different settings were reported:
‘Restaurant, café, pub, bar, hotel’ (two outbreaks) and ’Canteen or workplace catering’ (one outbreak).
Parasites
Under the category ‘Parasites’, outbreaks due to Trichinella, Cryptosporidium, Giardia and Taenia saginata
are reported. Outbreaks caused by Trichinella are discussed in the respective section.
One strong-evidence food-borne outbreak, caused by Cryptosporidium spp. was reported by Sweden. This
outbreak affected 10 people and was linked to the consumption of salad. The outbreak setting was
‘Household’, but no specific information where reported on the type of outbreak (classified as ‘Unknown’).
Two weak-evidence food-borne outbreaks were also reported by Germany and Ireland. In addition, three
strong-evidence water-borne outbreaks attributable to Cryptosporidium were reported by two MS (see
Section 3.16.3).
Furthermore, 12 weak-evidence food-borne outbreaks of Giardia were reported by four MS, Germany (seven
outbreaks), Ireland and Poland (two outbreaks each) and Latvia (one outbreak). Overall, these outbreaks
involved 30 human cases and three hospitalisations.
One weak-evidence outbreak caused by Taenia saginata was reported by the Czech Republic and involved
24 human cases.
Unknown agents
In 2013, 19 MS reported 1,499 outbreaks (28.9 % of all outbreaks) in which the causative agent was
unknown (Table OUT3), excluding 3 strong-evidence water-borne outbreaks. This represents an increase in
the proportion of total outbreaks due to unknown agents compared with 2012 (N=1,478). Of these, 66 were
supported by strong evidence (7.9 % of all strong-evidence outbreaks).
3.16.3. Water-borne outbreaks
In 2013, six MS reported nine strong-evidence water-borne outbreaks, compared to 16 strong-evidence
water-borne outbreaks reported by four MS in 2012.
Five different pathogens were detected in these nine outbreaks: calicivirus (norovirus, Norwalk-like virus),
verocytotoxigenic E. coli (VTEC O128), Cryptosporidium parvum, Cryptosporidium hominis and Salmonella.
There were three water-borne outbreaks in which the causative agent was unknown.
The largest water-borne outbreak was caused by norovirus and occurred in Finland, where 174 people were
affected, of whom seven hospitalised (see box below).
Three strong-evidence general water-borne outbreaks attributable to Cryptosporidium were reported by
Ireland and the United Kingdom. The two Irish outbreaks were caused by Cryptosporidium parvum and
affected 26 people in total, of whom three were hospitalised. The outbreak reported by the United Kingdom
was caused by Cryptosporidium hominis and involved 39 disseminated human cases, of whom one was
hospitalised.
Further details on the number of outbreaks and human cases, including information on the causative agents,
reporting countries and settings can be found inTable 36.
In May–June 2013, more than 170 people in 10 different customer groups in Finland fell ill with
gastroenteritis after visiting a remote hotel. The prolonged outbreak concerned several visiting groups at the
hotel. One of the suggested causes for the outbreak, among foodstuff and human to human contacts, was
drinking water.
The symptoms, incubation time and duration of the disease suggested norovirus, but patient samples
analysed by conventional PCR diagnostic methods were negative for norovirus and sapoviruses. Further
molecular biological analyses conducted by the National Institute for Health and Welfare found an unusual
genotype 1 norovirus. The same type of virus was then found in a repeat analysis of a water sample taken in
May and from swab samples taken from surfaces at the hotel. Drinking water extracted from the hotel’s own
borehole well was not treated before consumption. The outbreak was brought under control by setting boiling
instructions for water, cleaning and disinfecting the household water system, and by enhancing the cleaning
of the hotel premises to prevent secondary infections. The source for the contamination of water was not
identified.
Source: The Finnish National Zoonoses Summary Report, 2013
EFSA Journal 2015;13(1):3991
135
EU summary report on zoonoses, zoonotic agents and food-borne outbreaks 2013
Table 36. List of reported strong evidence water-borne outbreaks in 2013
Causative agent
Escherichia coli , pathogenic Verotoxigenic E. coli (VTEC)
Parasites
Country
Settings
Austria
Household
Ireland
N outbreaks
1
Cases
Hospitalised
2
Deaths
1
0
Disseminated cases
2
26
3
0
United Kingdom Disseminated cases
1
39
1
0
Salmonella
France
1
6
1
0
Unknown
Finland
Restaurant or Cafe or Pub or Bar or
Hotel or Catering service
Restaurant or Cafe or Pub or Bar or
Hotel or Catering service
Camp or picnic
1
40
1
0
1
15
0
0
Unknown
1
3
0
0
Restaurant or Cafe or Pub or Bar or
Hotel or Catering service
1
174
0
0
9
305
7
0
Spain
Viruses
Total (MS)
EFSA Journal 2015;13(1):3991
Finland
136
EU summary report on zoonoses, zoonotic agents and food-borne outbreaks 2013
3.16.4. Discussion
A total of 5,196 food-borne outbreaks were reported by the 24 reporting MS in 2013, compared with
5,363 outbreaks reported in total by 25 MS for 2012. The main causative agents in these outbreaks were
Salmonella, bacterial toxins, viruses and Campylobacter. For 2013 43,183 human cases were reported
compared with 55,453 human cases in 2012. This noticeable lower number of human cases during 2013
was mainly explained by one strong-evidence norovirus outbreak reported by Germany in 2012, which
affected 10,950 people (EFSA and ECDC, 2014).
In 2013, compared with 2012, a decrease was observed in the number of reported outbreaks caused by
Salmonella and Campylobacter, whereas the number of outbreaks due to bacterial toxins and viruses
increased. Virus and bacterial toxins were the second and third most commonly reported causative agents in
2013. However, it should be noted that the increase in the number of outbreaks caused by bacterial toxins is
mainly related to the reporting from one MS. During the six-year period from 2008 to 2013 within the EU, the
annual total number of Salmonella outbreaks has decreased markedly by 38.1 %, whereas the annual total
number of outbreaks due to bacterial toxins increased by 58.9 %. The number of reported viral food-borne
outbreaks within the EU varied substantially during the six-year period from 2008 to 2013.
Overall, the outbreaks reported by MS involved 43,183 human cases, 5,946 hospitalisations and 11 deaths.
Of the nine fatalities related to strong-evidence outbreaks, three were associated with Salmonella, three with
Listeria, one with Clostridium perfringens toxins, one with mushroom toxins and one with an unknown agent.
The most frequently reported food vehicle categories implicated in strong-evidence outbreaks were eggs and
egg products, followed by mixed food, and fish and fish products, as in 2012 and 2011. Interestingly, the
number of strong-evidence outbreaks associated with ‘Crustaceans, shellfish, molluscs and products thereof’
increased compared with 2012. The majority of these outbreaks were reported by three MS and were
caused by Calicivirus.
Most of the outbreaks implicating eggs and egg products were caused by Salmonella. Interestingly, sweets
and chocolates represented the second most commonly reported food vehicle in Salmonella outbreaks in
2013, although that these outbreaks were mainly reported by one MS.
Broiler meat was the main food vehicle implicated in Campylobacter outbreaks, as in 2012. This is consistent
with EFSA’s BIOHAZ Panel Scientific Opinion (EFSA BIOHAZ, CONTAM and AHAW Panels, 2012) that
handling, preparation and consumption of broiler meat may account for 20-30 % of human cases.
Of particular note was the multinational hepatitis A virus outbreak that occurred in 2013 in several EU/EEA
countries, and was associated with the consumption of berries and berry products. As indicated in the
EFSA’s scientific report on the tracing of food items in connection with this multinational outbreak (EFSA,
2014a), hepatitis A virus contamination could be occurring at the freezing processor or in primary production
of berries and therefore compliance with Good Hygiene Practice (GHP), Good Manufacturing Practice (GMP)
and Good Agricultural Practice (GAP) is recommended for countries producing berries for freezing.
The number of reported strong-evidence water-borne outbreaks decreased compared with 2012. The largest
water-borne outbreak was caused by norovirus and occurred in Finland, where 174 people were affected, of
whom seven hospitalised.
As in previous years, the data reported on food-borne outbreaks demonstrate that reporting by a single or a
small number of MS can have a strong influence on the apparent distribution of causative agents and food
vehicles at the EU level. It also appears that, within the MS, there may be large differences with regard to the
reported causative agents and implicated food vehicles between years.
EFSA Journal 2015;13(1):3991
137
EU summary report on zoonoses, zoonotic agents and food-borne outbreaks 2013
References
Alban L, Pozio E, Boes J, Boireau P, Boué F, Claes M, Cook AJ, Dorny P, Enemark HL, van der Giessen J,
Hunt KR, Howell M, Kirjusina M, Nöckler K, Rossi P, Smith GC, Snow L, Taylor MA, Theodoropoulos G,
Vallée I, Viera-Pinto MM and Zimmer IA, 2011. Towards a standardised surveillance for Trichinella in the
European Union. Preventive Veterinary Medicine, 99, 148-160.
Antolová D, Miterpáková M, Radoňák J, Hudačková J, Szilágyiová and Žáček M, 2014. Alveolar
echinococcosis in a highly endemic area of northern Slovakia between 2000 and 2013. Euro Surveillance
19(34):pii=20882. Available online: http://www.eurosurveillance.org/ViewArticle.aspx?ArticleId=20882
Berke O, Roming T and von Keyserlingk M, 2008. Emergence of Echinococcus multilocularis among red
foxes in northern Germany 1991-2005. Veterinary Parasitology, 155, 319-322.
Boué F, Boes J, Boireau P, Claes M, Cook AJC, Dorny P, Enemark H, van der Giesen J, Hunt KR, Howell M,
Kirjušina M, Nöckler K, Pozio E, Rossi P, Smith GC, Snow L, Taylor MA, Theodoropoulos G, Vallée I,
Vieira-Pinto MM and Zimmer IA, 2010. Development of harmonised schemes for the monitoring and
reporting of Echinococcus in animals and foodstuffs in the European Union. Available at:
http://www.efsa.europa.eu/en/supporting/doc/36e.pdf
Combes B, Comte S, Raton V, Raoul F, Boué F, Umhang G, Favier S, Dunoyer C, Woronoff N and
Giraudoux P, 2012. Westward Spread of Echinococcus multilocularis in Foxes, France, 2005-2010.
Emerging Infectious Diseases, 18, 2059-2062.
Craig PS, Giraudoux P, Shi D, Bartholomot B, Barnish G, Delattre P, Quere JP, Harraga S, Bao G, Wang Y,
Lu F, Ito A and Vuitton DA, 2000. An epidemiological and ecological study of human alveolar
echinococcosis transmission in south Gansu, China. Acta Tropica, 77, 167-177.
EC (European Commission), online. Bovine and swine diseases. 2013 Annual report. Available at:
http://ec.europa.eu/food/animal/liveanimals/bovine/docs/final_report_2013_en.pdf
ECDC (European Centre for Disease Prevention and Control), 2012a. Survey of National Reference
Laboratory (NRL) capacity for six food-and waterborne diseases in EU/EEA countries. Stockholm: ECDC;
2012, 74 pp. Available at: http://www.ecdc.europa.eu/en/publications/publications/survey-nrl-capacity-forfood-waterborne-agents.pdf
ECDC (European Centre for Disease Prevention and Control), 2012b. West Nile fever maps. Historical data
(2010–2012). Available at: http://ecdc.europa.eu/en/healthtopics/west_nile_fever/West-Nile-fever-maps/
Pages/historical-data.aspx
ECDC (European Centre for Disease Prevention and Control), 2013. Surveillance of food- and waterborne
diseases in the EU/EEA – 2006–2009. Stockholm: ECDC; 2013.
ECDC and EFSA (European Centre for Disease Prevention and Control and European Food Safety
Authority), 2014. Multi-country outbreak of Salmonella Stanley infections – Third update, 8 May 2014.
Stockholm and Parma: ECDC/EFSA; 2014. Available at: http://www.ecdc.europa.eu/en/publications/
Publications/Salmonella-stanley-multi-country-outbreak-assessment-8-May-2014.pdf
EFSA (European Food Safety Authority), 2007a. Scientific opinion of the Panel on Animal Health and
Welfare (AHAW Panel) regarding the assessment of the risk of Echinococcosis introduction into the UK,
Ireland, Sweden, Malta and Finland as a consequence of abandoning national rules. The EFSA Journal
2007, 441, 1-59.
EFSA (European Food Safety Authority), 2007b. Scientific Opinion of the Panel on Biological Hazards on a
request from EFSA on monitoring of verotoxigenic Escherichia coli (VTEC) and identification of human
pathogenic VTEC types. The EFSA Journal 2007, 579, 1-61.
EFSA (European Food Safety Authority), 2007c. Scientific Opinion of the Panel on BIOHAZ on a request
from EFSA on monitoring and identification of human enteropathogenic Yersinia spp. The EFSA Journal
2007, 595, 1- 30.
EFSA (European Food Safety Authority), 2009a. Scientific Report of EFSA on technical specifications for the
monitoring and reporting of verotoxigenic Escherichia coli (VTEC) on animals and food (VTEC surveys on
animals and food). EFSA Journal 2009;7(11):1366, 43 pp. doi:10.2903/j.efsa.2009.1366
EFSA (European Food Safety Authority), 2009b. Technical specifications for harmonised national surveys of
Yersinia enterocolitica in slaughter pigs on request of EFSA. EFSA Journal 2009;7(11):1374. 23 pp.
doi:10.2903/j.efsa.2009.1374
EFSA Journal 2015;13(1):3991
138
EU summary report on zoonoses, zoonotic agents and food-borne outbreaks 2013
EFSA (European Food Safety Authority), 2011. Scientific Report on Technical specifications on harmonised
epidemiological indicators for public health hazards to be covered by meat inspection of swine. EFSA
Journal 2011;9(10):2371, 125 pp. doi:10.2903/j.efsa.2011.2371
EFSA (European Food Safety Authority), 2013a. Analysis of the baseline survey on the prevalence of
Listeria monocytogenes in certain ready-to-eat (RTE) foods in the EU, 2010-2011 Part A: Listeria
monocytogenes
prevalence
estimates.
EFSA
Journal
2013;11(6):3241,
75
pp.
doi:10.2903/j.efsa.2013.3241
EFSA (European Food Safety Authority), 2013b. Technical specifications on harmonised epidemiological
indicators for biological hazards to be covered by meat inspection of domestic sheep and goats. EFSA
Journal 2013;11(6):3277, 63 pp. doi:10.2903/j.efsa.2013.3277
EFSA (European Food Safety Authority), 2013c. Assessment of Echinococcus multilocularis surveillance
reports submitted 2013 in the context of Commission Regulation (EU) No 1152/2011. EFSA Journal
2013;11(11):3465, 41 pp. doi:10.2903/j.efsa.2013.3465
EFSA (European Food Safety Authority), 2014a. Tracing of food items in connection to the multinational
hepatitis
A
virus
outbreak
in
Europe.
EFSA
Journal
2014;12(9):3821,
186
pp.
doi:10.2903/j.efsa.2014.3821
EFSA (European Food Safety Authority), 2014b. Manual for reporting on zoonoses and zoonotic agents,
within the framework of Directive 2003/99/EC and on some other pathogenic microbiological agents for
information derived from the year 2013. EFSA supporting publication 2014:EN-573. 107 pp.
EFSA (European Food Safety Authority), 2014c. Manual for reporting on food-borne outbreaks in
accordance with Directive 2003/99/EC for information derived from the year 2013. EFSA supporting
publication 2014:EN-575, 46 pp.
EFSA AHAW Panel (EFSA Panel on Animal Health and Welfare), 2013. Scientific opinion of the European
Union summary report on trends and sources of zoonoses, zoonotic agents and food-borne outbreaks –
Terms of reference 2 to 7. EFSA Journal 2013;11(1):3074, 29 pp. doi: 10.2903/j.efsa.2013.3074
EFSA BIOHAZ Panel (EFSA Panel on Biological Hazards), 2011. Scientific Opinion on Campylobacter in
broiler meat production: control options and performance objectives and/or targets at different stages of
the food chain. EFSA Journal 2011;9(4):2015, 141 pp. doi: 10.2903/j.efsa.2011.2105
EFSA BIOHAZ Panel (EFSA Panel on Biological Hazards), 2013a. Scientific Opinion on VTECseropathotype and scientific criteria regarding pathogenicity assessment. EFSA Journal 2013;11(4):3138,
106 pp. doi:10.2903/j.efsa.2013.3138
EFSA BIOHAZ Panel (EFSA Panel on Biological Hazards), 2013b. Scientific Opinion on the public health
hazards to be covered by inspection of meat from farmed game. EFSA Journal 2013;11(6):3264, 181 pp.
doi:10.2903/j.efsa.2013.3264
EFSA BIOHAZ Panel (EFSA Panel on Biological Hazards), 2013c. Scientific Opinion on the public health
hazards to be covered by inspection of meat from sheep and goats. EFSA Journal 2013;11(6):3265, 186
pp. doi:10.2903/j.efsa.2013.3265
EFSA BIOHAZ Panel (EFSA Panel on Biological Hazards), 2014. Scientific Opinion on the public health risks
of table eggs due to deterioration and development of pathogens. EFSA Journal 2014;12(7):3782, 147
pp. doi:10.2903/j.efsa.2014.3782
EFSA BIOHAZ, CONTAM and AHAW Panels (EFSA Panels on Biological Hazards, on Contaminants in the
Food Chain, and on Animal Health and Welfare), 2011. Scientific Opinion on the public health hazards to
be covered by inspection of meat (swine). EFSA Journal 2011;9(10):2351, 198 pp.
doi:10.2903/j.efsa.2011.2351
EFSA BIOHAZ, CONTAM and AHAW Panels (EFSA Panels on Biological Hazards, on Contaminants in the
Food Chain, and on Animal Health and Welfare), 2012. Scientific Opinion on the public health hazards to
be covered by inspection of meat (poultry). EFSA Journal 2012;10(6):2741, 179 pp.
doi:10.2903/j.efsa.2012.2741
EFSA and ECDC (European Food Safety Authority and European Centre for Disease Prevention and
Control), 2013. The European Union summary report on trends and sources of zoonoses, zoonotic
agents and food-borne outbreaks in 2011. EFSA Journal 2013;11(4):3129, 250 pp.
doi:10.2903/j.efsa.2013.3129
EFSA Journal 2015;13(1):3991
139
EU summary report on zoonoses, zoonotic agents and food-borne outbreaks 2013
EFSA and ECDC (European Food Safety Authority and European Centre for Disease Prevention and
Control), 2014. The European Union Summary Report on Trends and Sources of Zoonoses, Zoonotic
Agents and Food-borne Outbreaks in 2012. EFSA Journal 2014;12(2):3547, 312 pp.
doi:10.2903/j.efsa.2014.3547
Frank C, Werber D, Askar M, Blümel B, Rabsch W, Simon C, Sagebiel D, Siffczyk C and Wichmann-Schauer
H, 2014. Catering risky food to those at-risk: Salmonella Derby outbreak among the elderly in Berlin,
December 2013/January 2014. Proceedings of the European Scientific Conference on Applied Infectious
Disease,
Stockholm
5-7
November
2014.
Available
at:
http://www.ecdc.europa.eu/en/
ESCAIDE/programme/abstract-book/Documents/ECSAIDE-2014-abstracts.PDF
Graziani C, Mancini FR, Adone R, Marianelli C, Pasquali P, Rizzo C, Bella A, De Massis F, Danzetta ML,
Calistri P, Primavera A, Ruocco L and Busani L, 2013. Brucellosis in Italy from 1998 to 2011. Instituto
Superiore di Sanità, 75 pp. (in Italian). Available at: http://www.iss.it/publ/index. php?id=2790&
tipo=5&lang=1
Hald T and Andersen JS, 2001. Trends and seasonal variations in the occurrence of Salmonella in pigs, pork
and humans in Denmark, 1995-2000. Berliner und Munchener Tierarztliche Wochenschrift, 114, 346-349.
Kern P, Ammon A, Kron M, Sinn G, Sander S, Petersen LR, Gaus W and Kern P, 2004. Risk factors for
alveolar echinococcosis in humans. Emerging Infectious Diseases, 2004;10(12):2088-2093.
Kittl S, Heckel G, Korczak BM and Kuhnert P, 2013. Source Attribution of Human Campylobacter Isolates by
MLST and Fla-Typing and Association of Genotypes with Quinolone Resistance. PLoS ONE, 8: e81796.
doi:10.1371/journal.pone.0081796
Kreidl P, Allersberger F, Judmaie G, Auer H, Aspöck H and Hall AJ, 1998. Domestic pets as risk factor for
alveolar hydatid disease in Austria. American Journal of Epidemiology,147, 978-981.
InVS (Institute de Veille Sanitaire), 2014. Tularémie – Données épidémiologiques 2013. Available at:
http://www.invs.sante.fr/fr/Dossiers-thematiques/Maladies-infectieuses/Zoonoses/Tularemie/Donnees-epi
demiologiques/Tularemie-Donnees-epidemiologiques-2013
ISID (International Society for Infectious Diseases), 2013. Q fever – Hungary: (Baranya) Request for
information. ProMED-mail. Archive Number: 20130607.1760537. Available at: http://www.promed
mail.org/direct.php?id=20130607.1760537
ISO (International Organization for Standardization), 2001. ISO 16654:2001. Microbiology of food and animal
feeding stuffs – Horizontal method for the detection of Escherichia coli O157.
ISO (International Organization for Standardization), 2003. ISO 10273:2003. Microbiology of food and animal
feeding stuffs – Horizontal method for the detection of presumptive pathogenic Yersinia enterocolitica.
ISO (International Organization for Standardization), 2006. ISO 10272-1:2006. Microbiology of food and
animal feeding stuffs - Horizontal method for detection and enumeration of Campylobacter spp. – Part 1:
Detection method.
ISO (International Organization for Standardization), 2012. ISO 13136:2012. Microbiology of food and animal
feed – Real-time polymerase chain reaction (PCR)-based method for the detection of food-borne
pathogens – Horizontal method for the detection of Shiga toxin-producing Escherichia coli (STEC) and
the determination of O157, O111, O26, O103 and O145 serogroups.
Janovsky M, Bacciarini L, Sager H, Gröne A and Gottstein B, 2002. Echinococcus multilocularis in a
European Beaver from Switzerland. Journal of Wildlife Diseases, 38, 618–620.
Mannelli A, Martello E, Tomassone L, Calzolari M, Casalone C, De Meneghi D, Dottori M, Estrada-Peña A,
Fabbi M, Ferreri L, Ferroglio E, Luini M, Nicolau Solano S, Ortega C, Pautasso A, Prati P and Vesco U,
2012. Inventory of available data and data sources and proposal for data collection on vector-borne
zoonoses
in animals. Supporting Publications 2012:EN-234, 189
pp. Available
at:
http://www.efsa.europa.eu/en/supporting/doc/234e.pdf
NMKL (Nordisk Metodikkomité for Næringsmidler- Nordic Committee on Food Analysis), 2007. NMKL 119.
Thermotolerant Campylobacter. Detection, semi-quantitative and quantitative determination in foods and
drinking water. Available at: http://www.nmkl.org/index.php? option=com_zoo&task=item&item_id=295&
Itemid=319&lang=en
OIE (World Organisation for Animal Health), 2009. Manual of Diagnostic Tests and Vaccines for Terrestrial
Animals. Available at: http://web.oie.int/eng/normes/MMANUAL/A_Index.htm
EFSA Journal 2015;13(1):3991
140
EU summary report on zoonoses, zoonotic agents and food-borne outbreaks 2013
Osterman Lind E, Juremalm M, Christensson D, Widgren S, Hallgren G, Ågren EO, Uhlhorn H, Lindberg A,
Cedersmyg M, Wahlström H, 2011. First detection of Echinococcus multilocularis in Sweden, February to
March 2011. Euro Surveillance 16(14): pii=19836. Available online: http://www.eurosurveillance. org/
ViewArticle.aspx?ArticleId=19836
Pozio E and Murrell KD, 2006. Systematics and epidemiology of Trichinella. Advances in Parasitology, 63,
367- 439.
Schroeder S, Harries M, Prager R, Rabsch W and Rimek D, 2014. A prolonged outbreak of Salmonella
Infantis associated with pork products in central Germany, April to October 2013. Proceedings of the
European Scientific Conference on Applied Infectious Disease, Stockholm 5-7 November 2014.
Accessible at: http://www.ecdc.europa.eu/en/ESCAIDE/programme/abstract-book/Documents/ECSAIDE2014-abstracts.PDF
Schink SB, Faber M, Mayer-Scholl A, Ziesch C, Schönfelder R, Wichmann-Schauer H, Nöckler K and Stark
K, 2014. Rapid information to the public helps to contain trichinellosis outbreak: early post-exposure
prophylaxis limits infection after exposure to contaminated raw meat products, Germany, 2013.
Proceedings of the European Scientific Conference on Applied Infectious Disease. Available at:
http://ecdc.europa.eu/en/ESCAIDE/programme/abstract-book/Documents/ECSAIDE-2014-abstracts.PDF
Sidi-Boumedine K, Rousset E, Henning K, ziller M, Miemczuk K, Roest HIJ and Thiéry R, 2010.
Development of harmonised schemes for the monitoring and reporting of Q-fever in animals in the
European Union. Available at: http://www.efsa.europa.eu/en/search/doc/48e.pdf
Stehr-Green JK, Stehr-Green PA, Schantz PM, Wilson JF and Lanier A, 1988. Risk factors for infection with
Echinococcus multilocularis in Alaska. American Journal of Tropical Medicine and Hygiene, 38, 380-385.
Takumi K, de Vies A, Chu m L, Mulder J, Teunis P and van der Giessen J, 2008. Evidence for an increasing
presence of Echinococcus multilocularis in foxes in the Netherlands. International Journal for Parasitology
38, 571-578.
Van der Hoek W, Morroy G, Renders NH, Wever PC, Hermans MH, Leenders AC and Schneeberger PM,
2012. Epidemic Q fever in humans in the Netherlands. Advances in Experimental Medicine and Biology,
984, 329-364.
Vervaeke M, van der Giessen J, Brochier B, Losson B, Jordaens, Verhagen R, de Lezenne Coulander C and
Teunis P, 2006. Spatial spreading of Echinococcus multilocularis in red foxes across nation borders in
Western Europe. Preventive Veterinary Medicine, 76, 137-150.
WHO (World Health Organization), 1996. Laboratory Techniques in Rabies, 493 pp. Available at:
http://libdoc.who.int/publications/1996/9241544791_eng.pdf
Zdragas A, Mazaraki K, Vafeas G, Giantzi V, Papadopoulos T and Ekateriniadou L, 2012. Prevalence,
seasonal occurrence and antimicrobial resistance of Salmonella in poultry retail products in Greece.
Letters in Applied Microbiology, 55, 308–313.
Zomer TP, De Rosa M, Stenvers O, Valkenburgh S, Roest HJ, Friesema IHM, Maas M, van der Giessen
JWB, van Pelt W, Maassen K, 2014. Zoonotic Diseases Report 2013. RIVM Report 2014-0076; 74 pages.
Available
at:
http://www.rivm.nl/en/Documents_and_publications/Scientific/Reports/2014/december/
Zoonotic_Diseases_Report_2013. Accessed on 15.12.2014.
EFSA Journal 2015;13(1):3991
141
EU summary report on zoonoses, zoonotic agents and food-borne outbreaks 2013
Abbreviations
AHAW
Animal Health and Welfare
BIOHAZ
Biological Hazards
cELISA
Complement enzyme-linked immunosorbent assay
CFT
Complement fixation test
CFU
Colony-forming unit
CI
Confidence Interval
CONTAM
Contaminants in the Food Chain
DCF
Data Collection Framework
EBLV
European bat Lyssavirus
EC
European Commission
ECDC
European Centre for Disease Prevention and Control
EEA
European Economic Area
EFSA
European Food Safety Authority
EFTA
European Free Trade Association
ELISA
Enzyme-linked immunosorbent assay
ESRI
Economic and Social Research Institute
EU
European Union
EURL
European Union Reference Laboratory
FAT
Fluorescent antibody test
FISH
Fluorescent in situ hybridization
g
Gram
GAP
Good Agricultural Practice
GHP
Good Hygiene Practice
GMP
Good Manufacturing Practice
HACCP
Hazard Analysis and Critical Control Point
HAV
Hepatitis A Virus
HUS
Haemolytic–Uraemic Syndrome
i-ELISA
Indirect enzyme-linked immunosorbent assay
IFA
Immunofluorescence assay
IHC
ImmunoHistoChemistry
InVS
Institut de Veille Sanitaire – the French Institute for Public Health Surveillance
ISO
International Organization for Standardization
LHT
Low heat-treated
MLST
Multi locus sequence typing
MRSA
Meticillin-resistant Staphylococcus aureus
MS
Member State
NMKL
Nordic Committee on Food Analysis
NT
Not typable
EFSA Journal 2015;13(1):3991
142
EU summary report on zoonoses, zoonotic agents and food-borne outbreaks 2013
OBF
Official brucellosis-free status of Member States and regions of Member States as regards
bovine herds
ObmF
Official brucellosis (Brucella melitensis)-free status of Member States and regions of Member
States as regards ovine and caprine herds
OIE
World Organisation for Animal Health
OTF
Official tuberculosis-free status of Member States and regions of Member States as regards
bovine herds
PCR
Polymerase chain reaction
PFGE
Pulsed field gel electrophoresis
RASFF
Rapid Alert System for Food and Feed
RTE
Ready-to-eat
RT-PCR
Real time polymerase chain reaction
ST
Sequence type
STEC
Shiga toxin-producing Escherichia coli
TESSy
The European Surveillance System
VTEC
Verocytotoxigenic Escherichia coli
WNF
West Nile Fever
WNV
West Nile Virus
WAHID
World Animal Health Information Database
WHO
World Health Organization
Country codes
Austria
AT
Luxembourg
LU
Belgium
BE
Malta
MT
Bulgaria
BG
Netherlands
NL
Croatia
HR
Norway
NO
Cyprus
CY
Poland
PL
Czech Republic
CZ
Portugal
PT
Denmark
DK
Romania
RO
Estonia
EE
Slovakia
SK
Finland
FI
Slovenia
SI
France
FR
Spain
ES
Germany
DE
Sweden
SE
Greece
GR
Switzerland
CH
Hungary
HU
United Kingdom
UK
Iceland
IS
Ireland
IE
Italy
IT
Latvia
LV
Lithuania
LT
EFSA Journal 2015;13(1):3991
143
EU summary report on zoonoses, zoonotic agents and food-borne outbreaks 2013
Appendix: List of usable data
Summary
Table abbreviation
Table name
ZOONHOSPITRATES
Reported hospitalization and case-fatality rates due to zoonoses
in confirmed human cases in the EU, 2013
Figure abbreviation
Figure name
ZOONHUMRATES
Reported notification rates of zoonoses in confirmed human
cases in the EU, 2013
3.1. Salmonella
Table abbreviation
Table name
SALMOVERVIEW
Overview of countries reporting data for Salmonella
3.1.1. Salmonellosis in humans
Humans
Humans
Table abbreviation
Table name
SALMHUMRATES
Reported cases and notification rates for confirmed cases of
human salmonellosis in the EU/ EEA, 2009–2013
SALMHUMSEROVARS
Distribution of reported confirmed cases of human salmonellosis
in the EU/EEA, 2011–2013, by the 20 most frequent serovars in
2013
SALMHUMIMPORT
Proportion of confirmed salmonellosis cases associated with
travel, domestic cases and cases with unknown travel
information by country in 2013
Figure abbreviation
Figure name
SALMHUMTREND
Trend in reported confirmed cases of human non-tuphodial
salmonellosis in the EU/EEA, 2009-2013
3.1.2. Salmonella in food, animals and feed
Food
Table abbreviation
Table name
SALMOVERVIEWFOOD
Overview of countries reporting food data for Salmonella
SALMCOMPLFOOD
Compliance with the food safety Salmonella criteria laid down by
EU Regulations 2073/2005 and 1441/2007 and 1086/2030
SALMCOMPLPOULTRYMEAT
Compliance with the food safety Salmonella criteria laid down by
EU Regulations 2073/2005 and 1441/2007and 1086/2030
(Fresh poultry meat)
SALMBROILMEAT
Salmonella in fresh broiler meat at slaughter, processing/cutting
level and retail, 2013
SALMRTEBROIL
Salmonella in RTE products from broiler meat, 2013
SALMTURKMEAT
Salmonella in fresh turkey meat at slaughter, processing/cutting
level and retail, 2013
SALMRTETURK
Salmonella in RTE products from turkey meat, 2013
SALMPIGMEAT
Salmonella in fresh pig meat, at slaughter, cutting/processing
level and retail, 2013
EFSA Journal 2015;13(1):3991
144
EU summary report on zoonoses, zoonotic agents and food-borne outbreaks 2013
Food
Animals
Feed
Table abbreviation
Table name
SALMRTEPIG
Salmonella in RTE products from minced meat,
preparation and meat products from pig meat, 2013
SALMBOVINEMEAT
Salmonella in fresh bovine meat, at slaughter, cutting/processing
level and retail, 2013
SALMRTEBOVINE
Salmonella in RTE products minced meat, meat preparations
and meat products from bovine animals, 2013
SALMEGGS
Salmonella in table egg samples, 2013
SALMBIVMOLLUSC
Salmonella in live bivalve molluscs, 2013
SALMFRUIT
Salmonella in fruit, 2013
SALMFRUITVEG
Salmonella in fruit and vegetable, 2013
SALMVEGET
Salmonella in vegetables, 2013
SALMHERBS
Salmonella in spices and herbs, 2013
SALMSPRSEED
Salmonella in seeds, sprouted, 2013
SALMDRIEDSEED
Salmonella in seeds, dried, 2013
SALMOVERVIEWANI
Overview of countries reporting animal data for Salmonella
SALMBREEDPROD
Salmonella in breeding flocks of Gallus gallus during the
production period (all types of breeding flocks, flock-based data)
in countries running control
SALMLAYPROD
Salmonella in laying hen flocks of Gallus gallus during the
production period (flock-based data) in countries running control
programmes in accordance with Regulation (EC) No 2160/2003,
2013
SALMBROIBS
Salmonella in broiler flocks of Gallus gallus before slaughter
(flock-based data) in countries running control programmes1,
2013
SALMBREEDTURK
Salmonella in breeding flocks of turkeys (adults, flock-based
data) in countries running control programmes, 2013
SALMFATTURKBS
Salmonella in fattening flocks of turkeys before slaughter (flockbased data) in countries running control programmes, 2013
SALMAPBREEDEGGLINE
Salmonella in adult parent breeding flocks for the egg production
line during the production period (Gallus gallus, flock-based
data) in countries running control programmes in accordance
with Regulation (EC) No 2160/2003,2013
SALMAPBREEDMEAT
Salmonella in adult parent breeding flocks in the broiler meat
production line (Gallus gallus, flock-based data) in countries
running control programmes in accordance with Regulation (EC)
No 2160/2003,2013
SALMGPBREEDPROD
Salmonella in elite and grandparent breeding flocks of Gallus
gallus during the production period (flock-based data) in
countries running control programmes in accordance with
Regulation (EC) No 2160/2003, 2013
SALMDUCKGEESE
Salmonella in flocks of ducks and geese (flock-based data),
2013
SALMPIGSBACT
Salmonella in pigs from bacteriological monitoring programmes,
2013
SALMCATBACT
Salmonella
in cattle
programmes, 2013
SALMDERIVEDFEED
Salmonella in feedingstuffs, in the EU, 2013
SALMCOMPFEEDCATTLE
Salmonella in compound feedingstuffs for cattle, in the EU, 2013
SALMCOMPFEEDPIGS
Salmonella in compound feedingstuffs for pigs, in the EU, 2013
EFSA Journal 2015;13(1):3991
from
bacteriological
meat
monitoring
145
EU summary report on zoonoses, zoonotic agents and food-borne outbreaks 2013
Table abbreviation
Table name
Feed
SALMCOMPFEEDPOULTRY
Salmonella in compound feedingstuffs for poultry, in the EU,
2013
Serovars
SERBROMEAT
Distribution of the ten most common Salmonella serovars in
broiler meat, 2013
SERTURKMEAT
Distribution of the ten most common Salmonella serovars in
turkey meat, 2013
SERPIGMEAT
Distribution of the ten most common Salmonella serovars in pig
meat, 2013
SERBOVMEAT
Distribution of the ten most common Salmonella serovars in
bovine meat, 2013
SERGAL
Distribution of the ten most common Salmonella serovars in
Gallus gallus, 2013
SERBRO
Distribution of the ten most common Salmonella serovars in
broilers, 2013
SERTURK
Distribution of the ten most common Salmonella serovars in
turkeys, 2013
SERPIGS
Distribution of the ten most common Salmonella serovars in
pigs, 2013
SERBOV
Distribution of the ten most common Salmonella serovars in
cattle, 2013
SERMONT
Distribution of S. Typhimurium-like strains and monophasic
S. Typhimurium detected in poultry flocks
SERGALFEED
Distribution of the ten most common Salmonella serovars in
compound feed for Gallus gallus, 2013
SERPIGSFEED
Distribution of the ten most common Salmonella serovars in
compound feed for pigs, 2013
SERBOVFEED
Distribution of the ten most common Salmonella serovars in
compound feed for cattle, 2013
SEROVAR2013
Distribution and prevalence of Salmonella serovars in different
food and animal categories in EU countries, 2013
Figure abbreviation
Figure name
Food
SALMCOMPLCRITERIA
Proportion of units not complying with the EU Salmonella
criteria, 2011-2013
Animals
SALMTRENDBREED
Prevalence of S. Enteritidis, S. Typhimurium, S. Infantis, S.
Virchow and/or S. Hadar-positive breeding flocks of Gallus
gallus during production in the EU, 2007-2013
SALMTARGETBREED
Prevalence of S. Enteritidis, S. Typhimurium, S. Infantis, S.
Virchow and/or S. Hadar-positive breeding flocks of Gallus
gallus during the production period and target for Member
States, Iceland, Norway and Switzerland, 2013
SALMMAPBREED
Prevalence of the five target serovars (S. Enteritidis, S.
Typhimurium, S. Infantis, S. Virchow and/or S. Hadar)-positive
breeding flocks of Gallus gallus during the production period,
2013
SALMTRENDLAY
Prevalence of S. Enteritidis and/or S. Typhimurium-positive
laying hen flocks of Gallus gallus during the production period in
the EU, 2008-2013
SALMTARGETLAY
Prevalence of S. Enteritidis and/or S. Typhimurium-positive
laying hen flocks of Gallus gallus during the production period
and targets for Member States, Norway and Switzerland, 2013
EFSA Journal 2015;13(1):3991
146
EU summary report on zoonoses, zoonotic agents and food-borne outbreaks 2013
Animals
Figure abbreviation
Figure name
SALMMAPLAY
Prevalence of the two target serovars (S. Enteritidis and/or S.
Typhimurium)-positive laying hen flocks of Gallus gallus during
the production period, 2013
SALMTRENDBROIBS
Prevalence of S. Enteritidis and/or S. Typhimurium-positive
broiler flocks of Gallus gallus during the production period in the
EU, 2009–2013
SALMTARGETBROIBS
Prevalence of S. Enteritidis and/or S. Typhimurium-positive
broiler flocks of Gallus gallus before slaughter and target for
Member States, Iceland, Norway and Switzerland, 2013
SALMMAPBROIBS
Prevalence of the two target serovars (S. Enteritidis and/or S.
Typhimurium)-positive broiler flocks of Gallus gallus before
slaughter, 2013
SALMTRENDBREEDTURK
Prevalence of S. Enteritidis and/or S. Typhimurium-positive
breeding flocks of turkeys during the production period, in the
EU, 2010–2013
SALMTARGETBREEDTURK
Prevalence of S. Enteritidis and/or S. Typhimurium-positive
breeding flocks of turkeys during the production period and
target for Member States, Iceland, Norway and Switzerland,
2013
SALMMAPBREEDTURK
Prevalence of the two target serovars (S. Enteritidis and/or S.
Typhimurium)-positive breeding flocks of turkeys during the
production period, 2013
SALMTRENDFATTURKBS
Prevalence of S. Enteritidis and/or S. Typhimurium-positive
fattening flocks of turkeys, in the EU, 2010–2013
SALMTARGETFATTURKBS
Prevalence of S. Enteritidis and/or S. Typhimurium-positive
fattening flocks of turkeys and target for Member States, Iceland,
Norway and Switzerland, 2013
SALMMAPFATTURKBS
Prevalence of the two target serovars (S. Enteritidis and/or S.
Typhimurium)-positive fattening flocks of turkeys, 2013
3.2. Campylobacter
Table abbreviation
Table name
CAMPOVERALL
Overview of countries reporting data for Campylobacter, 2013
3.2.1. Campylobacteriosis in humans
Humans
Humans
Table abbreviation
Table name
CAMPHUMIMPORT
Proportion of confirmed campylobacteriosis cases associated
with travel, domestic cases and cases with unknown travel
information by country in 2013
CAMPHUMRATES
Reported cases and notifciation rates of human
campylobacteriosis in the EU/ EEA, 2009–2013
CAMPHUMSPECIES
Species distribution of confirmed campylobacteriosis cases in
2013
Figure abbreviation
Figure name
CAMPHUMTREND
Trend in reported confirmed cases of human campylobacteriosis
in the EU/EEA, 2009-2013
EFSA Journal 2015;13(1):3991
147
EU summary report on zoonoses, zoonotic agents and food-borne outbreaks 2013
3.2.2. Campylobacter in food and animals
Food
Animals
Animals
Table abbreviation
Table name
CAMPBOVMEAT
Campylobacter in fresh bovine meat, 2013
CAMPBOVPROD
Campylobacter in ready-to-eat bovine meat products, 2013
CAMPBROILMEAT
Campylobacter in fresh broiler meat, 2013
CAMPBROILPROD
Campylobacter in ready-to-eat broiler meat products, 2013
CAMPCHEESE
Campylobacter in cheeses, 2013
CAMPMILK
Campylobacter in milk, 2013
CAMPOTHERPOULMEAT
Campylobacter in fresh other poultry meat, 2013
CAMPPIGMEAT
Campylobacter in fresh pig meat, 2013
CAMPPIGPROD
Campylobacter in ready-to-eat pig meat products, 2013
CAMPTURKMEAT
Campylobacter in fresh turkey meat, 2013
CAMPTURKPROD
Campylobacter in ready-to-eat turkey meat products
CAMPUNSPPROD
Campylobacter in ready-to-eat unspecified meat products, 2013
CAMPBROILERS
Campylobacter in broilers, 2013
CAMPCATDOG
Campylobacter in cats and dogs, 2013
CAMPCATTLE
Campylobacter in cattle, 2013
CAMPOTHERAN
Campylobacter in other animals, 2013
CAMPPIGS
Campylobacter in pigs, 2013
CAMPTURKEYS
Campylobacter in turkeys, 2013
Figure abbreviation
Figure name
CAMPBROIMEAT
Proportion of positive Campylobacter samples in broiler meat by
sampling stage in Member States and non-Member States,
2008-2013
Table abbreviation
Table name
LISTERIAOVER
Overview of countries reporting data for Listeria, 2013.
3.3. Listeria
3.3.1. Listeriosis in humans
Humans
Table abbreviation
Table name
LISTHUMIMPORT
Proportion of confirmed listeriosis cases associated with travel,
domestic cases and cases with unknown travel information by
country in 2013
EFSA Journal 2015;13(1):3991
148
EU summary report on zoonoses, zoonotic agents and food-borne outbreaks 2013
Humans
Humans
Table abbreviation
Table name
LISTHUMRATES
Reported cases and notification rates per 100,000 of human
listeriosis in 2009-2013
Figure abbreviation
Figure name
LISTHUMTREND
Trend in reported confirmed cases of human listeriosis in the
EU/EEA, 2009-2013
3.3.2. Listeria in food and animals
Food
Table abbreviation
Table name
LISTERIABAKERY
L. monocytogenes in RTE bakery products, 2013
LISTERIACOMPL
Compliance with the L. monocytogenes criteria laid down by
Regulation (EC) No 2073/2005 in food categories in the EU,
2020
LISTERIACONF
L monocytogenes in RTE confectionary products and pastes,
2013
LISTERIAEGGPR
L. monocytogenes in RTE egg products, 2013
LISTERIAFISHPR
L. monocytogenes in RTE fishery products, 2013
LISTERIAFISH
L. monocytogenes in fish, 2013
LISTERIAFRUITVEG
L. monocytogenes in RTE fruit and vegetables, 2013
LISTERIAHCCOWPM
L. monocytogenes in hard cheeses made from pasteurised milk
from cows, 2013
LISTERIAHCCOWRM
L. monocytogenes in hard cheeses made from raw or low heat
treated milk from cows, 2013
LISTERIAHCGOATPM
L. monocytogenes in hard cheeses made from pasteurised milk
from goats, 2013
LISTERIAHCGOATRM
L. monocytogenes in hard cheeses made from raw or low heat
treated milk from goats, 2013
LISTERIAHCMIXEDPM
L. monocytogenes in hard cheeses made from pasteurised milk
from mixed, unspecified or other animal milk, 2013
LISTERIAHCMIXEDRM
L. monocytogenes in hard cheeses made from raw or low heattreated milk from mixed, unspecified or other animal milk, 2013
LISTERIAHCSHEEPPM
L. monocytogenes in hard cheeses made from pasteurised milk
from sheep, 2013
LISTERIAHCSHEEPRM
L. monocytogenes in hard cheeses made from raw or low heat
treated milk from sheep, 2013
LISTERIAMILK
L. monocytogenes in RTE milk, 2013
LISTERIAPREPDISH
L. monocytogenes in RTE other processed food products and
prepared dishes, 2013
EFSA Journal 2015;13(1):3991
149
EU summary report on zoonoses, zoonotic agents and food-borne outbreaks 2013
Food
Animals
Food
Table abbreviation
Table name
LISTERIARTEBOVINE
L. monocytogenes in RTE meat products from bovine animals,
2013
LISTERIARTEBROIL
L. monocytogenes in RTE meat products from broilers, 2013
LISTERIARTEPIG
L. monocytogenes in RTE meat products from pig, 2013
LISTERIARTETURK
L. monocytogenes in RTE meat products from turkey, 2013
LISTERIASALAD
L. monocytogenes in RTE salads, 2013
LISTERIASCCOWPM
L. monocytogenes in soft and semisoft cheeses made from
pasteurised milk from cows, 2013
LISTERIASCCOWRM
L. monocytogenes in soft and semisoft cheeses made from raw
or low heat treated milk from cows, 2013
LISTERIASCGOATPM
L. monocytogenes in soft and semisoft cheeses made from
pasteurised milk from goats, 2013
LISTERIASCGOATRM
L. monocytogenes in soft and semisoft cheeses made from raw
or low heat treated milk from goats, 2013
LISTERIASCHEEPRM
L. monocytogenes in soft and semisoft cheeses made from raw
or low heat-treated milk from sheep, 2013
LISTERIASCMIXEDPM
L. monocytogenes in soft and semisoft cheeses made from
pasteurised milk from mixed, unspecified or other animal milk,
2013
LISTERIASCMIXEDRM
L. monocytogenes in soft and semisoft cheeses made from raw
or low heat-treated milk from mixed, unspecified or other animal
milk, 2013
LISTERIASCSHEEPPM
L. monocytogenes in soft and semisoft cheeses made from
pasteurised milk from sheep, 2013
LISTERIASAUCE
L. monocytogenes in sauce and dressings RTE, 2013
LISTERIASPICES
L. monocytogenes in RTE spices and herbs, 2013
LISTERIAANIMALS
Listeria monocytogenes and other species in animals, 2013
Figure abbreviation
Figure name
LISTERIACOMPLFIG
Proportion of single samples at processing and retail in noncompliance with EU L. monocytogenes criteria, 2011-2013
LISTERIAMEAT
Proportion of L. monocytogenes-positive units in ready-to-eat
meat categories in the EU, 2013
LISTERIACHEESE
Proportion of L. monocytogenes-positive units in soft and semisoft cheeses, and hard cheeses made from raw or low heattreated milk and pasturised milk, 2013
LISTERIAFISHFIG
Proportion of L. monocytogenes-positive units in ready-to-eat
fishery products categories in EU, 2013
EFSA Journal 2015;13(1):3991
150
EU summary report on zoonoses, zoonotic agents and food-borne outbreaks 2013
3.4. Verocytotoxigenic Escherichia coli
Table abbreviation
Table name
VTECOVERALL
Overview of countries reporting data for VTEC, 2013
3.4.1. VTEC in humans
Humans
Humans
Table abbreviation
Table name
VTECHUMRATES
Reported cases and notification rates of human VTEC infections
in the EU, 2009–2013
VTECHUMIMPORT
Proportion of confirmed VTEC infections associated with travel,
domestic cases and cases with unknown travel information by
country in 2013
VTECHUMSEROGROUP
Distribution of reported confirmed cases of human VTEC
infections in the EU/EEA, 2011–2013, by the 20 most frequent
serogroups in 2013
Figure abbreviation
Figure name
VTECHUMTREND
Trend in reported confirmed cases of human VTEC infections in
the EU/EEA, 2009-2013
3.4.2. VTEC in food and animals
Food
Table abbreviation
Table name
VTECBOVINEMEAT
VTEC in fresh bovine meat, 2013
VTECBROIMEAT
VTEC in fresh broiler meat, 2013
VTECDAIRY
VTEC in milk and dairy products, excluding raw milk, 2013
VTECFRUITS
VTEC in fruits, 2013
VTECGOATMEAT
VTEC in fresh goat meat, 2013
VTECOTHERFOOD
VTEC in other food, 2013
VTECOTHERMEAT
VTEC in fresh meat from other animal species, 2013
VTECOVINEMEAT
VTEC in fresh ovine meat, 2013
VTECPIGSMEAT
VTEC in fresh pigs meat, 2013
VTECRAWCOWMILK
VTEC in raw cows' milk, 2013
VTECRAWGOATSMILK
VTEC in raw goats' milk, 2013
VTECRAWSHEEPMILK
VTEC in raw sheep' milk, 2013
VTECSEED
VTEC in sprouted seed, 2013
VTECTURKMEAT
VTEC in fresh turkey meat, 2013
EFSA Journal 2015;13(1):3991
151
EU summary report on zoonoses, zoonotic agents and food-borne outbreaks 2013
Table abbreviation
Table name
Food
VTECVEGETABLE
VTEC in vegetables, 2013
Animals
VTECCATTLE
VTEC in cattle, 2013
VTECOTHERANIMAL
VTEC in other animals, 2013
VTECOVINEGOAT
VTEC in sheep and goats, 2013
VTECPIGS
VTEC in pigs, 2013
Figure abbreviation
Figure name
VTEC0157PROPORTION
Proportion of VTEC and VTEC 0157 positive samples in all
categories in Member States and non-Member States, 2013
VTECPROPORTION
Proportion of VTEC positive samples in animal/food categories
in Member States and non-Member States, 2012-2013
Table abbreviation
Table name
YERSOVERALL2012
Overview of countries reporting Yersinia data, 2012.
YERSOVERALL2013
Overview of countries reporting data for Yersinia, 2013
Animals
3.5. Yersinia
3.5.1. Yersinia in humans
Humans
Humans
Table abbreviation
Table name
YERSHUMIMPORT
Proportion of confirmed yersiniosis cases associated with
travel, domestic cases and cases with unknown travel
information by country in the EU/EEA 2013
YERSHUMRATES
Reported cases and notification rates per 100,000 of human
yersiniosis in the EU, 2009-2013
YERSHUMSPECIES
Species distribution of confirmed yersiniosis cases in humans,
2013
Figure abbreviation
Figure name
YERSHUMTREND
Trend in reported confirmed cases of human yersiniosis in the
EU/EEA, 2009-2013
3.5.2. Yersinia in food and animals
Food
Table abbreviation
Table name
YERSPIGMEAT2012
Yersinia in pig meat and products thereof, 2012
YERSPIGMEAT2013
Yersinia in pig meat and products thereof, 2013
EFSA Journal 2015;13(1):3991
152
EU summary report on zoonoses, zoonotic agents and food-borne outbreaks 2013
Food
Animals
Animals
Table abbreviation
Table name
YERSBOVINEMEAT2012
Yersinia in bovine meat and products thereof, 2012
YERSBOVINEMEAT2013
Yersinia in bovine meat and products thereof, 2013
YERSOVINEMEAT2012
Yersinia in ovine meat and products thereof, 2012
YERSOVINEMEAT2013
Yersinia in ovine meat and products thereof, 2013
YERSMILKDAIRY2012
Yersinia in milk and dairy products, 2012
YERSMILKDAIRY2013
Yersinia in milk and dairy products, 2013
YERSPIGS2012
Yersinia in pigs, 2012
YERSPIGS2013
Yersinia in pigs, 2013
YERSDOMAN2012
Yersinia in domestic livestock other than pigs, 2012
YERSDOMAN2013
Yersinia in domestic livestock other than pigs, 2013
YERSOTHERAN2012
Yersinia in other animal species, 2012
YERSOTHERAN2013
Yersinia in other animal species, 2013
Figure abbreviation
Figure name
YERSANIMPROPORTION
Proportion of Yersinia-positive samples in animal in Member
States and non-Member States, 2012-2013
YERSFOODPROPORTION
Proportion of Yersinia-positive samples in food in Member
States and non-Member States, 2012-2013
3.6. Tuberculosis due to Mycobacterium bovis
Table abbreviation
Table name
TUBOVER
Overview of countries reporting data for tuberculosis due to
M. bovis for humans and for animals, 2013
3.6.1. M. bovis in humans
Humans
Table abbreviation
Table name
MBOVHUMORIGIN
Proportion of confirmed cases of tuberculosis due to M. bovis
associated with native and foreign cases and cases with
unknown origin by country in 2013
MBOVHUMRATES
Reported cases and notification rates per 100,000 of human
tuberculosis due to M. bovis in 2009-2013
EFSA Journal 2015;13(1):3991
153
EU summary report on zoonoses, zoonotic agents and food-borne outbreaks 2013
3.6.2. Tuberculosis due to M. bovis in cattle
Animals
Animals
Table abbreviation
Table name
DSTUBCOF
M. bovis in cattle herds in co-financed non-OTF Member
States, 2013
DSTUBNONCOF
M. bovis in cattle herds in non-co-financed non-OTF Member
States, 2013
TUBOTHERAN
M.bovis in species other than cattle, 2013
TUBCATTLE
Complementary reporting on M.bovis in cattle, 2013
TUBOTHERSP
Mycobacteria other than M. bovis, in animals, 2013
Figure abbreviation
Figure name
DSTUBPROPINF
Proportion of existing cattle herds infected with or positive for
M. bovis, 2009-2013
DSTUBMAP
Status of countries regarding bovine tuberculosis, 2013.
DSTUBPROPMAP
Proportion of existing cattle herds infected with or positive for
M. bovis, 2013.
Table abbreviation
Table name
BRUCOVER
Overview of countries reporting data for Brucella
3.7. Brucella
3.7.1. Brucellosis in humans
Humans
Table abbreviation
Table name
BRUCHUMIMPORT
Proportion of confirmed brucellosis cases associated with
travel, domestic cases and cases with unknown travel
information by country in 2013
BRUCHUMRATES
Reported cases and notification rates per 100,000 of human
brucellosis in the EU/ EEA, 2009-2013;
BRUCHUMSPECIES
Species distribution of confirmed brucellosis cases in 2013
BRUCHUMTREND
Trend in reported confirmed cases of human brucellosis in the
EU, 2009-2013
3.7.2. Brucella in food and animals
Table abbreviation
Table name
Food
BRUCFOOD
Brucella in food, 2013
Animals
DSBRUCOFCAT
Brucella in cattle herds in co-financed non-OBF Member
States, 2013
EFSA Journal 2015;13(1):3991
154
EU summary report on zoonoses, zoonotic agents and food-borne outbreaks 2013
Animals
Figure abbreviation
Figure name
DSBRUCOFOV
Brucella in sheep and goat herds in co-financed non-ObmF
Member States, 2013
BRUCOTHERAN
Brucella in species other than cattle, sheep and goat, 2013
DSBRUCCATMAP
Status of countries regarding bovine brucellosis, 2013.
DSBRUCCATPROPMAP
Proportion of existing cattle herds infected with or positive for
Brucella, country-based data, 2013.
DSBRUCOVCAPMAP
Status of countries regarding ovine and caprine brucellosis,
2013.
DSBRUCOVCAPPROPMAP
Proportion of existing sheep and goats herds infected with or
positive for Brucella, country-based data, 2013.
DSBRUCPROPINF
Proportion of existing cattle, sheep and goat herdsinfected with
or positive for Brucella, 2005-213
3.8. Trichinella
Table abbreviation
Table name
TRICHOVER
Overview of countries reporting data on Trichinella spp., 2013
3.8.1. Trichinellosis in humans
Humans
Humans
Table abbreviation
Table name
TRICHUMIMPORT
Proportion of confirmed trichinellosis cases associated with
travel, domestic cases and cases with unknown travel
information by country in 2013
TRICHUMRATES
Reported cases and notification rates per 100,000 of human
trichinellosis in 2009-2013
TRICHUMSPECIES
Species distribution of confirmed trichinellosis cases in 2013
Figure abbreviation
Figure name
TRICHUMTREND
Trend in reported confirmed cases of human trichinellosis in
the EU/EEA, 2009-2013
3.8.2. Trichinella in animals
Animals
Table abbreviation
Table name
TRICHPIGSNOT
Findings of Trichinella in pigs not raised under controlled
housing conditions, 2013
TRICHPIGS
Findings of Trichinella in pigs other than not raised under
controlled housing conditions, 2013
TRICHHORSE
Findings of Trichinella in domestic solipeds, 2013
EFSA Journal 2015;13(1):3991
155
EU summary report on zoonoses, zoonotic agents and food-borne outbreaks 2013
Animals
Animals
Table abbreviation
Table name
TRICHFARMEDWILDBOAR
Findings of Trichinella in farmed wild boar, 2013
TRICHWILDWILDBOAR
Findings of Trichinella in hunted wild boar, 2013
TRICHFOX
Findings of Trichinella in foxes, 2013
TRICHBEARS
Findings of Trichinella in bears, 2013
TRICHRACCOON
Findings of Trichinella in raccoon dogs, 2013
TRICHOTHERWILD
Findings of Trichinella in other wildlife, 2013
Figure abbreviation
Figure name
TRICHMAPPIGS
Findings of Trichinella in pigs other than not raised under
controlled housing conditions, 2013.
TRICHMAPPIGSNOT
Findings of Trichinella in pigs not raised under controlled
housing conditions, 2013.
TRICHMAPWILDWILDBOAR
Findings of Trichinella in hunted wild boar, 2013.
TRICHMAPOTHERWILD
Findings of Trichinella in wildlife (including hunted wild boar),
2013.
TRICHPROPORTION
Proportion of Trichinella-positive samples in animals in
Member States and non-Member States, 2005-2013
3.9. Echinococcus
Table abbreviation
Table name
ECHINOOVER2012
Overview of countries reporting data on Echinococcus spp.,
2012
ECHINOOVER2013
Overview of countries reporting data on Echinococcus spp.,
2013
3.9.1. Echinococcus in humans
Humans
Humans
Table abbreviation
Table name
ECHINOHUMRATES
Reported cases and notification rates per 100,000 of human
echinococcosis in the EU/ EEA, 2009-2013
ECHINOHUMSPECIES
Species distribution of confirmed echinococcosis cases in
humans, 2013
Figure abbreviation
Figure name
ECHINOHUMTREND
Reported confirmed cases by species in selected MS, 20092013
EFSA Journal 2015;13(1):3991
156
EU summary report on zoonoses, zoonotic agents and food-borne outbreaks 2013
3.9.2. Echinococcus in animals
Animals
Animals
Table abbreviation
Table name
ECHINOFOX2012
Echinococcus findings in foxes, 2012
ECHINOFOX2013
Echinococcus findings in foxes, 2013
ECHINOOTHER2012
Other Echinococcus findings in animals, 2012
ECHINOOTHER2013
Other Echinococcus findings in animals, 2013
Figure abbreviation
Figure name
ECHINOFOXMAP
Findings of E. multilocularis in foxes, 2013.
ECHINOPROPORTION
Proportion of E. multilocularis-positive samples in foxes in
Member States and non-Member States, 2005-2013
ECHINOFOXTRELLIS
Findings of E. multilocularis in foxes (including Member States
providing data for at least four consecutive years), 2005-2013
3.10. Toxoplasma
Table abbreviation
Table name
TOXOOVER
Overview of countries reporting data for Toxoplasma, 2013
3.10.1. Toxoplasma in animals
Animals
Table abbreviation
Table name
TOXOPIGS
Toxoplasma in pigs, 2013
TOXOCATTLE
Toxoplasma in cattle, 2013
TOXOOVINEGOAT
Toxoplasma in sheep and goats, 2013
TOXOCATDOG
Toxoplasma in cats and dogs, 2013
TOXOOTHERAN
Toxoplasma in other animal species, 2013
Table abbreviation
Table name
RABIESOVER
Overview of countries reporting data for Rabies, 2013
3.11. Rabies
3.11.1. Rabies in humans
Humans
Table abbreviation
Table name
RABHUMCASES
Human rabies cases in the EU/EEA, 2009-2013
EFSA Journal 2015;13(1):3991
157
EU summary report on zoonoses, zoonotic agents and food-borne outbreaks 2013
3.11.2. Rabies in animals
Animals
Animals
Table abbreviation
Table name
RABIESFARMED
Rabies in farmed animal, 2013
RABIESCAT
Rabies in cats, 2013
RABIESDOG
Rabies in dogs, 2013
RABIESBATS
Rabies in bats, 2013
RABIESRACCOON
Rabies in raccoon dogs, 2013
RABIESFOX
Rabies in foxes, 2013
RABIESWILD
Rabies in wildlife other than bats, foxes and raccoon dogs,
2013
Figure abbreviation
Figure name
RABIESANIMEXCLBATS
Reported cases of classical rabies or unspecified Lyssavirus in
animals other than bats, in the Member States and nonMember States, 2006-2013
RABIESMAPBAT
European Bat Lyssavirus (EBLV) or unspecified Lyssavirus
cases in bats.
RABIESMAPFOX
European Bat Lyssavirus (EBLV) or unspecified Lyssavirus
cases in foxes.
RABIESMAPWILD
European Bat Lyssavirus (EBLV) or unspecified Lyssavirus
cases in wild animals.
Table abbreviation
Table name
COXOVER
Overview of countries reporting data for Q-fever, 2013
3.12. Q-fever
3.12.1. Q-fever in humans
Humans
Humans
Table abbreviation
Table name
COXHUMRATES
Reported cases and notifcation rates per 100,000 of human Qfever in the Eu/ EEA, 2009-2013
COXHUMIMPORT
Proportion of confirmed Q fever cases associated with travel,
domestic cases and cases with unknown travel information by
country in 2013
Figure abbreviation
Figure name
COXHUMTREND
Trend in reported confirmed cases of human Q fever in the
EU/EEA, 2009-2013
EFSA Journal 2015;13(1):3991
158
EU summary report on zoonoses, zoonotic agents and food-borne outbreaks 2013
3.12.2. Coxiella burnetii in animals
Animals
Table abbreviation
Table name
COXCATTLE
Q fever in cattle, 2013
COXOVINEGOAT
Q fever in sheep and goats, 2013
COXOTHERAN
Q fever in other animals species, 2013
3.13. West Nile Virus
Table abbreviation
Table name
WNVOVER
Overview of countries reporting data for West Nile Virus, 2013
3.13.1. West Nile Virus in humans
Humans
Humans
Table abbreviation
Table name
WNFHUMRATES
Reported cases and notification rates per 100,000 of human
West Nile fever in 2009-2013
WNFHUMIMPORT
Proportion of West Nile fever cases associated with travel,
domestic cases and cases with unknown travel information by
country in 2013
Figure abbreviation
Figure abbreviation
WNFHUMTREND
Trend in reported cases of human West Nile fever in the EU,
2009-2013
3.13.2. West Nile Virus in animals
Animals
Animals
Table abbreviation
Table name
WNVSOLIP
West Nile Virus in solipeds, 2013
WNVBIRDS
West Nile Virus in birds, 2013
WNVOTHERAN
West Nile Virus in other animal species, 2013
Figure abbreviation
Figure abbreviation
WNVBIRDSMAP
Findings of West Nile Virus in birds in the EU, 2013.
WNVSOLIPMAP
Findings of West Nile Virus in solipeds in the EU, 2013.
WNVPROPORTION
Proportion of West Nile Virus positive samples in Member
States and non-Member States, 2013
EFSA Journal 2015;13(1):3991
159
EU summary report on zoonoses, zoonotic agents and food-borne outbreaks 2013
3.14. Tularaemia
Table abbreviation
Table name
FRANCISELLAOVERALL
Overview of countries reporting data for Francisella, 2013
3.14.1. Tularaemia in humans
Humans
Humans
Table abbreviation
Table name
TULARHUMIMPORT
Proportion of confirmed tularaemia cases associated with
travel, domestic cases and cases with unknown travel
information by country in 2013
TULARHUMRATES
Reported cases and notifciation rates per 100,000 of human
tularaemia in the Eu/ EEA, 2009-2013
Figure abbreviation
Figure name
TULARHUMTREND
Trend in reported confirmed cases of human tularaemia in the
EU/EEA, 2009-2013.
3.14.2. F. tularensis in animals
Animals
Table abbreviation
Table name
FRANCISELLAANI
Francisella tularensis in animals, 2013
3.16. Food-borne outbreaks
3.16.1. General overview
Table abbreviation
Table name
FBOOVER
Overview of countries reporting data on food-borne outbreaks,
2013
FBOEVID
Evidence in strong-evidence food-borne outbreaks (including
strong-evidence water-borne outbreaks) in the EU, 2013
NOFBOSTR
Number of outbreaks and human cases per causative agents
in food-borne outbreaks in the EU (including strong-evidence
water-borne outbreaks), 2013
NOOUTHUM
Number of all food-borne outbreaks and human cases in the
EU, 2013
Figure abbreviation
Figure name
FBOCOUNTRYRATE
Reporting rate per 100,000 population in Member States and
non-Member States, 2013
FBOCOUNTRYNUMOUT
Distribution of food-borne outbreaks in Member States and
non-Member States, 2013
FBOAGENTNUMOUT
Distribution of all food-borne outbreaks per causative agent in
the EU, 2013
EFSA Journal 2015;13(1):3991
160
EU summary report on zoonoses, zoonotic agents and food-borne outbreaks 2013
Figure abbreviation
Figure name
FBOAGENTTREND
Total number of food-borne outbreaks in the EU, 2008-2013
FBODISTRIBFOODVEHIC
Distribution of strong-evidence outbreaks by food vehicle in the
EU, 2013
FBODISTRIBSETTING
Distribution of strong-evidence outbreaks by settings in the EU,
2013
3.16.2. Agent specific outbreaks
Table abbreviation
Table name
FBOSALM
Strong- and weak-evidence food-borne outbreaks caused by
Salmonella (excluding strong-evidence water-borne
outbreaks), 2013
FBOCAMP
Strong- and weak-evidence food-borne outbreaks caused by
Campylobacter (excluding strong-evidence water-borne
outbreaks), 20133
FBOECOLI
Strong- and weak-evidence food-borne outbreaks caused by
pathogenic E. coli (excluding strong-evidence water-borne
outbreaks), 2013
FBOSTRVIRUS
Strong-evidence food-borne outbreaks caused by viruses
(excluding strong-evidence water-borne outbreaks), 2013
FBOBACIL
Strong- and weak-evidence food-borne outbreaks caused by
Bacillus toxins (excluding strong-evidence water-borne
outbreaks), 2013
FBOCLOSTOX
Strong- and weak-evidence food-borne outbreaks caused by
Clostridium toxins (excluding strong-evidence water-borne
outbreaks), 2013
FBOBOT
Strong-evidence food-borne outbreaks caused by Clostridium
botulinum toxins (excluding strong-evidence water-borne
outbreaks), 2013
FBOSTAPH
Strong- and weak-evidence food-borne outbreaks caused by
staphylococcal (excluding strong-evidence water-borne
outbreaks), 2013
FBOVIRUS
Strong- and weak-evidence food-borne outbreaks caused by
viruses (excluding strong-evidence water-borne outbreaks),
2013
FBOOTHER
Strong- and weak-evidence food-borne outbreaks caused by
other causative agents (excluding strong-evidence water-borne
outbreaks), 2013
FBOSTROTHER
Strong-evidence food-borne outbreaks caused by other
causative agents (excluding strong-evidence water-borne
outbreaks), 2013
EFSA Journal 2015;13(1):3991
161
EU summary report on zoonoses, zoonotic agents and food-borne outbreaks 2013
Figure abbreviation
Figure name
FBOSALMVEHIC
Distribution of food vehicles in strong-evidence outbreaks
caused by Salmonella in the EU, 2013
FBOSALMENTVEHIC
Distribution of food vehicles in strong-evidence outbreaks
caused by S. Enteritidis in the EU, 2013
FBOSALMTYPVEHIC
Distribution of food vehicles in strong-evidence outbreaks
caused by S. Typhimurium in the EU, 2013
FBOCAMPVEHIC
Distribution of food vehicles in strong-evidence outbreaks
caused by Campylobacter (excluding strong-evidence waterborne outbreaks), 2013
FBOVIRUSVEHIC
Distribution food vehicles in strong-evidence outbreaks caused
by calicivirus, including norovirus (excluding strong-evidence
water-borne outbreaks), 2013
FBOBACILLUSVEHIC
Distribution of food vehicles in strong-evidence outbreaks
caused by Bacillus toxins in the EU, 2013
FBOCLOSTRIDIUMVEHIC
Distribution of food vehicles in strong-evidence outbreaks
caused by Clostridium toxins (excluding strong-evidence
water-borne outbreaks), 2013
FBOSTAPHYLVEHIC
Distribution of food vehicles in strong-evidence outbreaks
caused by staphylococcal toxins in the EU (excluding strongevidence water-borne outbreaks), 2013
3.16.3. Water-borne outbreaks
Table abbreviation
Table name
FBOWATER
List of reported strong evidence water-borne outbreaks in 2013
EFSA Journal 2015;13(1):3991
162


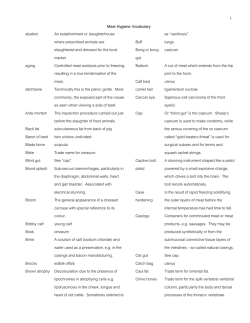
© Copyright 2026