
5000 Persistent User Scale out Test with Citrix
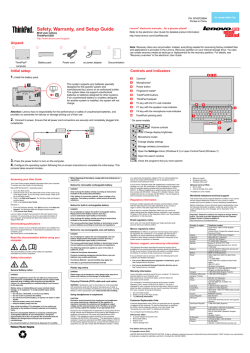
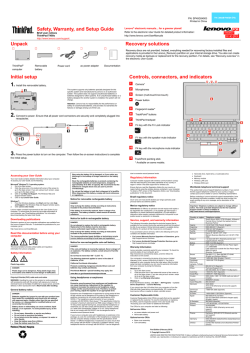
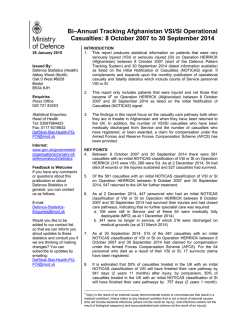
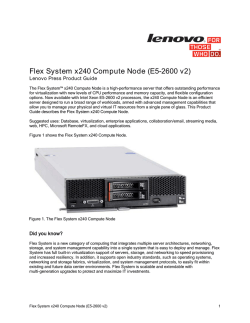
5000 Persistent User Scale out Test with Citrix XenDesktop and Atlantis Computing Last Update 28 January 2015 Mike Perks Kenny Bain Pawan Sharma Table of Contents Executive summary ......................................................................................... 1 1 Lenovo Client Virtualization solution ...................................................... 2 1.1 Hardware components ............................................................................................. 2 1.2 Software components .............................................................................................. 6 2 Performance test methodology and tools ............................................... 8 2.1 Test methodology ..................................................................................................... 8 2.2 Login VSI ................................................................................................................. 8 2.3 VMware esxtop ........................................................................................................ 9 2.4 Superputty.............................................................................................................. 10 2.5 IBM FlashSystem performance monitor ................................................................. 10 3 Performance test hardware configuration .............................................11 3.1 System under test .................................................................................................. 11 3.2 Load framework ..................................................................................................... 13 4 Software configuration and setup .......................................................... 15 4.1 Setting up Management VMs ................................................................................. 15 4.2 Setting up master user VM..................................................................................... 15 4.3 Setting up master launcher VM .............................................................................. 16 4.4 Setting up Login VSI .............................................................................................. 16 4.5 Setting up Atlantis Computing software.................................................................. 16 4.6 Setting up 5000 persistent desktop VMs ................................................................ 17 5 Scale out performance results ............................................................... 18 5.1 Brokerless by using RDP ....................................................................................... 18 5.2 Citrix XenDesktop .................................................................................................. 22 Resources ....................................................................................................... 28 ii 5000 Persistent User Scale out Test with Citrix XenDesktop and Atlantis Computing Executive summary This paper documents persistent desktop scale out performance testing that was done at the Lenovo solution lab in Austin, Texas. The goal was to test 5000 persistent desktops by using a combination of Lenovo® servers ® ® and networking, IBM FlashSystem™ storage, and Atlantis Computing software. This paper includes the following sections: Section 1 describes the hardware and software components that were used in the Lenovo Client Virtualization (LVC) solution for Citrix XenDesktop. Section 2 describes the methodology and tools that were used for the scale out performance test including Login VSI. Section 3 describes the hardware configuration that was used. Section 4 describes the software configuration that was used. Section 5 describes the performance results. The Lenovo results show a best in class achievement of 5000 persistent desktops with Citrix XenDesktop. This type of result has not been documented before, partly because 5000 persistent desktops require a significant investment in storage. However, as shown in this paper, a combination of Atlantis Computing software and IBM FlashSystem storage turns the usual I/O performance problem into a non-event. Without data reduction technology, enterprise class flash storage can be expensive. The Atlantis Computing de-duplication and compression facilities make it cost effective (the storage cost for 5000 users is less than $130 per user, including the Atlantis license). Moreover, the performance of logging onto a desktop in 16 seconds and rebooting 5000 desktops in 20 minutes makes this system easy to use for users and IT staff. A total of 35 Lenovo Flex System servers in 30U were used to support 5000 users with up to 160 persistent users per server. The Lenovo servers provide a dense and cost effective solution in terms of CAPEX and OPEX. The performance results show that the usual persistent desktop I/O problem was effectively eliminated and the compute server performance is the driving factor. More compute servers can be added to support more users or more compute intensive users; it all depends on the individual customer environment and user load. For more information about the Lenovo Client Virtualization solution for Citrix XenDesktop, contact your Lenovo sales representative or business partner. For more information about the Citrix XenDesktop reference architecture that includes information on the LCV solution, performance benchmarks, and recommended configurations, see this website: http://lenovopress.com/tips1278. 1 5000 Persistent User Scale out Test with Citrix XenDesktop and Atlantis Computing 1 Lenovo Client Virtualization solution The LCV solution includes compute servers, networking, storage, and clients. The compute servers use the VMware ESXi hypervisor for user Virtual Machines (VMs) or management VMs. In this configuration, 10 Gb Ethernet (10 GbE) networking is used for connectivity between compute servers and clients. A SAN network that uses Fibre Channel is used for connectivity between compute servers and shared storage. Citrix XenDesktop provides a connection broker service between clients and user VMs to support virtual applications or virtual desktops. XenDesktop uses management VMs and supports multiple hypervisors, although only ESXi is used for the scale out performance test. Atlantis Computing software provides an important service, which substantially reduces the amount of IO from the virtual desktops to the shared storage. Figure 1 shows an overview of the main components in the LCV. The rest of this section describes the subset of hardware and software components that are used for the scale out performance test. Clients Virtual Desktops and Applications Broker Hypervisor Servers Storage Tablets IBM Storwize x3550 M4/3650 M4 Laptops NetApp NAS + DAS XenDesktop ESXi Thin Clients Flex x240 M4 IBM FlashSystem Desktops and All-in-Ones EMC VNX ThinkServer RD350/RD450 Workstations Figure 1: Overview of Lenovo Client Virtualization Solution 1.1 Hardware components This section describes the hardware components that are used for the 5000 persistent user scale out performance test, which includes Lenovo compute servers, Lenovo networking components, and IBM storage components. 1.1.1 Flex System elements Flex® System is an enterprise-class platform that is specifically created to meet the demands of a virtualized data center and help clients establish a highly secure private cloud environment. Flex System includes the following features: Greatest choice for clients in processor type and OS platform all in the same chassis and is managed from a single point of control. 2 5000 Persistent User Scale out Test with Citrix XenDesktop and Atlantis Computing Flex System networking delivers 50% latency improvement through node-to-node (east-west) traffic rather than routing everything through the top-of-rack (TOR) switch (north-south). Figure 2: Flex System Enterprise Chassis, and Flex System compute nodes For more information, see the following Flex System website: ibm.com/systems/pureflex/overview.html 1.1.2 Flex System x240 Compute Node The Flex System x240 Compute Node (as shown in Figure 3) is a high-performance Intel® Xeon® processor-based server that offers outstanding performance for virtualization with new levels of processor performance and memory capacity and flexible configuration options for a broad range of workloads. The Flex System x240 Compute Node is ideal for virtualization, with maximum memory support (24 DIMMs and up to 768 GB of memory capacity), 10 GbE Integrated Virtual Fabric, and 8 Gb or 16 Gb Fibre Channel for high networking bandwidth. The Flex System x240 Compute Node also supports Flex System Flash for up to eight 1.8-inch solid-state drives (SSDs) for maximum local storage. Figure 3: Lenovo Flex System x240 Compute Node 1.1.3 Flex System x222 Compute Node The Flex System x222 Compute Node (as shown in Figure 4) is a high-density blade server that is designed for virtualization, dense cloud deployments, and hosted clients. The Flex System x222 Compute Node has two independent compute nodes in the one mechanical package, which means that Flex System x222 has a double-density design that allows up to 28 servers to be housed in a single 10U Flex System Enterprise 3 5000 Persistent User Scale out Test with Citrix XenDesktop and Atlantis Computing Chassis. The Flex System x222 Compute Node supports up to 768 GB of memory capacity, 10 GbE Integrated Virtual Fabric, and 16 Gb Fibre Channel for high networking bandwidth. The Flex System x222 Compute Node also supports Flex System Flash for up to four 1.8-inch SSDs for maximum local storage. Figure 4: Flex System x222 Compute Node 1.1.4 Flex System Fabric EN4093R 10Gb Scalable Switch The Flex System Fabric EN4093R 10Gb Scalable Switch (as shown in Figure 5) provides unmatched scalability, port flexibility, and performance. It also delivers innovations to address many networking concerns today and provides capabilities that help you prepare for the future. This switch can support up to 64 10 Gb Ethernet connections while offering Layer 2/3 switching, in addition to OpenFlow and "easy connect" modes. It is designed to install within the I/O module bays of the Flex System Enterprise Chassis. Figure 5: Flex System Fabric EN4093R 10 Gb Scalable Switch For more information, see this website: ibm.com/redbooks/abstracts/tips0864.html 1.1.5 Flex System FC3171 8Gb SAN Switch The Flex System FC3171 8Gb SAN Switch (as shown in Figure 6) is a full-fabric Fibre Channel component with expanded functionality that is used in the Lenovo Flex System Enterprise Chassis. The SAN switch supports high-speed traffic processing for Flex System configurations, and offers scalability in external SAN size and complexity, and enhanced systems management capabilities. The FC3171 switch provides 14 internal 8 Gb Fibre Channel ports and 6 external ports and supports 2 Gb, 4 Gb, and 8 Gb port speeds. 4 5000 Persistent User Scale out Test with Citrix XenDesktop and Atlantis Computing Figure 6: Flex System FC3171 8 Gb SAN Switch For more information, see this website: ibm.com/redbooks/abstracts/tips0866.html 1.1.6 Flex System FC5022 16Gb SAN Switch The Flex System FC5022 16 Gb SAN Scalable Switch (as shown in Figure 7) is a high-density, 48-port, 16 Gbps Fibre Channel switch that is used in the Flex System Enterprise Chassis. The switch provides 28 internal ports to compute nodes and 20 external SFP+ ports. The FC5022 offers end-to-end 16 Gb and 8 Gb Fibre Channel connectivity. Figure 7: Flex System FC5022 16 Gb SAN Switch For more information, see this website: ibm.com/redbooks/abstracts/tips0870.html 1.1.7 Lenovo RackSwitch G8264 Designed with top performance in mind, Lenovo RackSwitch G8264 (as shown in Figure 8) is ideal for today’s big data, cloud, and optimized workloads. The G8264 switch offers up to 64 10 Gb SFP+ ports in a 1U form factor and can accommodate future needs with four 40 Gb QSFP+ ports. It is an enterprise-class and full-featured data center switch that delivers line-rate, high-bandwidth switching, filtering, and traffic queuing without delaying data. Large data center grade buffers keep traffic moving. Redundant power and fans and numerous high availability features equip the switches for business-sensitive traffic. Figure 8: Lenovo RackSwitch G8264 The G8264 switch is ideal for latency-sensitive applications, such as client virtualization. It supports Virtual Fabric to help clients reduce the number of I/O adapters to a single dual-port 10 Gb adapter, which helps reduce cost and complexity. The G8264 switch supports the newest protocols, including Data Center Bridging/Converged Enhanced Ethernet (DCB/CEE) for support of FCoE, in addition to iSCSI and NAS. For more information, see this website: ibm.com/redbooks/abstracts/tips0815.html 5 5000 Persistent User Scale out Test with Citrix XenDesktop and Atlantis Computing 1.1.8 IBM System Storage SAN24B-5 The IBM System Storage SAN24B-5 SAN switch (as shown in Figure 9) is designed to meet the demands of hyper-scalable, private cloud storage environments by delivering 16 Gbps Fibre Channel technology and capabilities that support highly virtualized environments. These switches support autosensing of 2 Gb, 4 Gb, 8 Gb or 16 Gb port speeds. The SAN24B-5 supports up to 24 ports in a 1U package. A 48-port version (SAN48B-5) also is available. Figure 9: IBM System Storage SAN24B-5 For more information, see this website: ibm.com/systems/networking/switches/san/b-type/san24b-5 1.1.9 IBM FlashSystem 840 The IBM FlashSystem™ 840 (as shown in Figure 10) is an all-flash storage system that is used to make applications and data centers faster and more efficient by providing over 1 million input/output operations per second (IOPS). The FlashSystem 840 storage system has an industry-leading latency of nearly 100 microseconds. This latency is especially useful for client virtualization that requires high IOPS and low-latency access to large amounts of data. For enterprise-level availability, the IBM FlashSystem 840 system uses two-dimensional flash RAID with patented IBM Variable Stripe RAID™ technology that maintains system performance and capacity if there are partial or full-flash chip failures, which helps reduce downtime and forestall system repairs. It is also extremely compact, with up to 40 TB of useable flash storage in a 2U package with hot-swappable power supplies, backup batteries, and controllers. IBM FlashSystem 840 supports all industry standard interfaces, including 4 Gb, 8 Gb, or 16 Gb Fibre Channel, 40 Gb InfiniBand®, 10 Gb iSCSI, and 10 Gb FCoE. Figure 10: IBM FlashSystem 840 For more information, see this website: ibm.com/systems/storage/flash/840/ 1.2 Software components This section describes the software components that are used for the 5000 persistent user scale out performance test, which includes VMware ESXi hypervisor, Citrix XenDesktop, and Atlantis Computing software. 6 5000 Persistent User Scale out Test with Citrix XenDesktop and Atlantis Computing 1.2.1 VMware ESXi hypervisor VMware ESXi™ is a bare-metal hypervisor. ESXi partitions a physical server into multiple virtual machines. The compute, memory, and networking resources on the server are all virtualized. One advantage is that ESXi can be booted from a small USB key. For more information, see this website: vmware.com/products/esxi-and-esx/ 1.2.2 Citrix XenDesktop Citrix XenDesktop is an industry-leading connection broker for virtual applications and virtual desktops. It provides a range of services for provisioning, managing, and connecting users to Microsoft Windows virtual machines. For more information, see this website: citrix.com/products/xendesktop/. 1.2.3 Atlantis Computing Atlantis Computing provides a software-defined storage solution, which can deliver better performance than physical PC and reduce storage requirements by up to 95% in virtual desktop environments of all types. The key is Atlantis HyperDup content-aware data services, which fundamentally changes the way VMs use storage. This change reduces the storage footprints by up to 95% while minimizing (and in some cases, entirely eliminating) I/O to external storage. The net effect is a reduced CAPEX and a marked increase in performance to start, log in, start applications, search, and use virtual desktops or hosted desktops and applications. Atlantis software uses random access memory (RAM) for write-back caching of data blocks, real-time inline de-duplication of data, coalescing of blocks, and compression, which significantly reduces the data that is cached and persistently stored in addition to greatly reducing network traffic. Atlantis software works with any type of heterogeneous storage, including server RAM, direct-attached storage (DAS), SAN, or network-attached storage (NAS). It is provided as a VMware ESXi compatible VM that presents the virtualized storage to the hypervisor as a native data store, which makes deployment and integration straightforward. Atlantis Computing also provides other utilities for managing VMs and backing up and recovering data stores. For the purposes of this scale out test, the Atlantis ILIO Persistent VDI version was used in disk-backed mode. This mode provides the optimal solution for desktop virtualization customers that are using traditional or existing storage technologies that are optimized by Atlantis software with server RAM. In this scenario, Atlantis employs memory as a tier and uses a small amount of server RAM for all I/O processing while using the existing SAN, NAS, or all-flash arrays storage as the primary storage. Atlantis storage optimizations increase the number of desktops that the storage can support by up to 20 times while improving performance. Disk-backed configurations can use various different storage types, including host-based flash memory cards, external all-flash arrays, and conventional spinning disk arrays. For more information, see this website: atlantiscomputing.com/products/ 7 5000 Persistent User Scale out Test with Citrix XenDesktop and Atlantis Computing 2 Performance test methodology and tools This section describes the test methodology that was used for the scale out performance test and the tools that were used to run and monitor the test. 2.1 Test methodology An industry standard client virtualization test tool, Login VSI is used to provide a simulated load of up to 5000 users. Normally, Login VSI is used to benchmark compute servers to find the maximum number of users that can be supported in a specific configuration and the CPU load is at 100%. For the scale out performance test, the idea is not to overload any part of the system and ensure that all of the components are running at less than 100% utilization. This condition mirrors what is required for customer deployments. Login VSI supports two launcher modes: serial and parallel. Serial mode is normally used to test the maximum workload for a specific server. For the scale out performance testing, Login VSI was used in parallel mode so that the login interval could be substantially reduced from the default of every 30 seconds and the simulated load evenly distributed across the Login VSI launchers and compute servers. The user login interval was varied to achieve the best result given the available servers and in many cases one logon every two seconds was used. This means that 5000 users logon over a period of 10,000 seconds (approximately 2.75 hours) and the total test time (including the standard 30 minute Login VSI idle period and logoff) would be about 3.5 hours. All user VMs were pre-booted before the test so they were idle and ready to receive users. The Login VSI medium workload was chosen to represent typical customer workloads. The more intensive heavy workload simply required more servers to support the extra CPU load. During the scale out performance test, different performance monitors were used to ensure that no single component is overloaded. The esxtop tool was used for the compute servers and storage monitoring tools for the IBM FlashSystem shared storage. The results from these tools are described in section 5 on page 17. After each test run, the user VMs and Login VSI launcher VMs are rebooted and everything is reset and ready for the next run a few hours later. Two or three runs often were done for each test variation. 2.2 Login VSI Login VSI is a vendor-independent benchmarking tool that is used to objectively test and measure the performance and scalability of server-based Windows desktop environments (client virtualization). Leading IT analysts recognize and recommend Login VSI as an industry-standard benchmarking tool for client virtualization and can be used by end-user organizations, system integrators, hosting providers, and testing companies. Login VSI can be used for the following purposes: Benchmarking: Make the correct decisions about different infrastructure options that are based on tests. Load-testing: Gain insight in the maximum capacity of your current (or future) hardware environment. Capacity planning: Decide exactly what infrastructure is needed to offer users an optimal performing desktop. 8 Change Impact Analysis: To test and predict the performance effect of every intended modification before its implementation. 5000 Persistent User Scale out Test with Citrix XenDesktop and Atlantis Computing Login VSI measures the capacities of virtualized infrastructures by simulating typical (and atypical) user workloads and application usage. For example, the Login VSI medium workload simulates a medium-level knowledge worker that uses Microsoft Office, Internet Explorer, and PDFs. The medium workload is scripted in a 12- to 14-minute loop when a simulated Login VSI user is logged on and each test loop performs the following operations: Microsoft Outlook: Browse 10 messages. Internet Explorer: One instance is left open (BBC.co.uk) and one instance is browsed to Wired.com, Lonelyplanet.com Flash application: gettheglass.com (not used with MediumNoFlash workload). Microsoft Word: One instance to measure response time, one instance to review and edit document. Bullzip PDF Printer and Acrobat Reader: The Word document is printed and reviewed to PDF. Microsoft Excel: A large randomized sheet is opened. Microsoft PowerPoint: A presentation is reviewed and edited. 7-zip: By using the command line version, the output of the session is zipped. After the loop finished, it restarted automatically. Each loop takes approximately 14 minutes to run. Within each loop, the response times of specific operations are measured at a regular interval: six times within each loop. The response times of these seven operations is used to establish the VSImax score. VSImax is the maximum capacity of the tested system expressed in the number of Login VSI sessions. For more information see this website: loginvsi.com/ 2.3 VMware esxtop IOPS distribution and latency are the two most important metrics to be considered in the analysis of storage system. The VMware tool esxtop was used to capture this information from the ESXi hypervisor. Figure 11 shows the command that was used to pipe the esxtop data to a file. Figure 11: esxtop command line and usage For more information, see this website: http://pubs.vmware.com/vsphere-55/index.jsp#com.vmware.vsphere.monitoring.doc/GUID-D89E8267-C 74A-496F-B58E-19672CAB5A53.html For more information about interpreting esxtop statistics, see this website: http://communities.vmware.com/docs/DOC-9279 9 5000 Persistent User Scale out Test with Citrix XenDesktop and Atlantis Computing 2.4 Superputty Superputty is a Windows GUI application that allows multiple PuTTY SSH clients to be opened, one per tab. In particular, this tool was used to allow simultaneous control of multiple SSH sessions and start tools (such as esxtop) in each session at the same time. For more information, see this website: https://code.google.com/p/superputty/ 2.5 IBM FlashSystem performance monitor As with other IBM storage platforms, IBM FlashSystem features an integrated web-based GUI that can be used for management and performance analysis, in addition to supporting data collection from external tools. The procedure described at the following website was used to export performance metrics into CSV format so they can be easily reviewed for this study: http://ibm.com/support/docview.wss?uid=tss1td106293&aid=1 10 5000 Persistent User Scale out Test with Citrix XenDesktop and Atlantis Computing 3 Performance test hardware configuration The hardware configuration for the 5000 persistent user scale out performance test consists to two major parts: the “System under test” that runs the 5000 persistent desktop VMs, and the “Load framework” that provides the simulated load of 5000 users that were using Login VSI. Figure 12 shows an overview of the hardware configuration for the 5000 persistent user performance test. G8264 Switch SAN24B-5 Switch User Network Management Network Storage Network SAN Network IBM FlashSystem 840 Storage for 5000 persistent user VMs Active Directory, DHCP, and DNS Server Launcher Servers NAS Storage for results, logs, management and launcher VM images Compute Servers (for users and management) System Under Test Load Framework Figure 12: Overview of hardware configuration for performance test 3.1 System under test The system under test configuration consists of 35 compute servers that are running 5000 user VMs and two management servers that are running management VMs. All servers have a USB key with ESXi 5.5. The 35 compute servers are various Lenovo Flex x240 and Lenovo Flex x222 compute nodes, as listed in Table 1. Table 1: Compute nodes used in system under test Server Processor Memory Count x222 2 x E5-2470 (Sandy Bridge EN) in each half 192 GB each half (384 total) 5x2 x240 2 x E5-2670 (Sandy Bridge EP) 256 GB 18 x240 2 x E5-2690 (Sandy Bridge EP) 256 Gb 5 x240 v2 2 x E5-2690v2 (Ivy Bridge EP) 384 GB 2 11 5000 Persistent User Scale out Test with Citrix XenDesktop and Atlantis Computing Each x240 compute node has a two-port 10 GbE LAN on motherboard (LOM) adapter and a two-port 8 Gb Fibre Channel (FC) adapter (FC3172). Each x222 compute node also has a two-port LOM for each half and a shared four port 16 Gb Fibre Channel adapter (FC5024D). The 35 compute nodes are placed in three Lenovo Flex chassis, which use a total of 30U in a rack. Each Flex chassis is configured with a EN4093R 10 GbE switch that is connected to a Lenovo G8264 64-port TOR 10 GbE ethernet switch. Each chassis is connected by using four a 40 GbE cable for best performance. An extra EN4093R switch in each chassis and a second G8264 TOR switch can be used for redundancy. Each Flex chassis also contains an FC3171 or FC5022 FC switch that is configured in pass-thru mode. The chassis switches are connected with four LC-LC fibre cables to an IBM SAN24B-5 TOR SAN switch. An extra FC switch in each chassis and a second SAN24B-5 TOR switch can be used for redundancy. All zoning for the compute nodes and IBM FlashSystem 840 storage is centralized in the SAN24B-5 switch. The IBM FlashSystem 840 storage server was configured with a full complement of 12 4 TB flash cards for a total of 40 TB of redundant storage (usable after two-dimensional RAID protection). The 5000 persistent virtual desktops used less than 5 TB of FlashSystem capacity after Atlantis Computing data reduction. The FlashSystem 840 is connected to the SAN24B-5 switch by using four LC-LC fibre cables, two to each storage controller for redundancy. Another four fibre cables can be used to connect to a second SAN switch for further failover protection. Even with redundancy, there are enough ports on the IBM FlashSystem 840 for a direct FC connection from the Flex chassis FC switches. Pass-thru mode to a TOR SAN switch was used to show how a larger SAN network is built. All of the management VMs that are required by Citrix XenDesktop and Atlantis ILIO center are split across two x240 compute nodes. The configuration and number of these VMs is in Table 2. Table 2: Characteristics of management VMs Storage Windows OS Count 4 GB 50 GB 2008 R2 SP1 1 (+1) for redundancy 2 4 GB 70 GB 2008 R2 SP1 2 (1 per 2500 VMs) Delivery Controller 4 16 GB 70 GB 2008 R2 SP1 4 (1 per 1250 VMs) Citrix licensing server 2 4 GB 20 GB 2008 R2 SP1 1 XenDesktop SQL server 2 4 GB 150 GB 2008 R2 SP1 1 vCenter server 10 32 GB 100 GB 2008 R2 SP1 1 vCenter SQL server 4 4 GB 150 GB 2008 R2 SP1 1 Atlantis ILIO center 2 4 GB 20 GB Linux 1 Virtual System processors memory AD, DNS and DHCP 2 Web Interface Management VM The VM for the Active Directory, DNS, and DHCP services is shared by the servers in the system under test and the load framework and a second instance is used for redundancy. Windows Server 2012 R2 can be used instead of Windows 2008 R2 SP1. 12 5000 Persistent User Scale out Test with Citrix XenDesktop and Atlantis Computing For production purposes the AD server and SQL servers should be replicated to provide fault tolerance. Four VMs for the XenDesktop Delivery Controller are used to provide adequate performance under load. Figure 13 shows the compute servers, shared storage, and networking hardware for the system under test. • 42 42 41 41 40 40 39 IBM G8264 64 port 10GbE TOR 39 38 38 2 4 37 D A Rst A 1 12 24 36 14 26 38 48 2 D Mgmt 11 23 35 37 47 3 D S A D 2 A 1 4 3 6 5 8 7 10 11 9 12 13 14 15 16 17 18 19 20 21 22 23 24 25 26 27 28 30 31 29 32 33 34 35 36 37 38 39 40 41 42 43 44 45 46 47 48 36 • IBM SAN24B-5 FC SAN TOR 36 0 4 1 5 2 6 3 7 8 12 9 13 10 14 11 15 16 20 17 21 18 22 19 23 35 35 SAN24B-5 34 34 840 33 • 33 1 IBM FlashSystem 840 (40TB) for 12 32 32 1-2 31 31 30 storage of persistent VMs 30 29 13 14 28 12 27 9 x222 7 x222 10 26 26 25 x222 8 x222 6 25 24 24 5 x222 1 1 • 23 IBM Flex Chassis with 29 28 11 27 0 3 23 0 x240 x240 1 22 22 0 0 1 4 1 x240 x240 2 21 21 Flex System Enterprise – – 5 x222 twin node (compute) 4 x240 node (compute) 20 20 1 1 0 0 19 13 18 x240 x240 1 1 0 0 11 12 1 17 17 0 9 0 x240 x240 10 16 16 1 1 0 0 7 x240 15 1 1 0 0 x240 8 x240 6 x240 4 x240 2 15 14 14 5 x240 1 • 13 Two IBM Flex Chassis with 19 18 x240 x240 1 14 1 x240 1 1 0 0 1 13 0 0 3 12 x240 12 11 11 Flex System Enterprise – – 26 x240 node (compute) 2 x240 node (management) 10 10 1 1 0 0 09 13 08 x240 x240 1 1 0 0 11 09 08 x240 x240 1 14 12 1 07 07 0 9 0 x240 x240 10 06 06 1 1 0 0 7 x240 05 1 1 0 0 x240 8 x240 6 05 04 04 5 x240 1 1 03 0 x240 3 02 x240 1 4 02 1 0 1 03 0 0 x240 x240 01 2 01 Flex System Enterprise Figure 13: Hardware configuration for System under Test 3.2 Load framework The load framework uses Login VSI 3.7 to simulate a user load of up to 5000 users with the medium workload. The load framework consists of 29 compute servers and one management server that uses Lenovo x3550 rack servers with the VMware ESXi 5.5 hypervisor, and NAS shared storage for the Login VSI launcher VMs and performance data. The compute servers for the load framework must have adequate performance to support the required load of 8 - 12 Login VSI launcher VMs. These compute servers often have two Westmere EP or better processors and 96 GB or more of memory. Each “launcher” compute server has a USB key with ESXi 5.5 and a two-port 10 GbE adapter that is connected to the same G8264 10 GbE TOR switch that is used by the system under test. There is no need for an FC connection to the IBM FlashSystem storage, although there is nothing preventing centralization of the storage on FlashSystem. Instead, all of the data for the load framework is stored on NAS shared storage, which is connected to the same G8264 10 GbE switch. The management server for the load framework supports several VMs. The main VM is used to run Login VSI Launcher and Analyzer tools. In addition a separate Citrix XenDesktop configuration is used to provision 13 5000 Persistent User Scale out Test with Citrix XenDesktop and Atlantis Computing multiple launcher VMs using XenDesktop machine creation services (MCS). There are different ways this could have been done but it was easy to use MCS in dedicated mode to create the launcher VMs. Figure 14 shows the compute servers and storage hardware for load framework. 42 42 System x3550 41 41 System x3550 40 40 System x3550 39 39 System x3550 38 38 System x3550 37 37 System x3550 36 36 System x3550 35 29 IBM System x3550 nodes 35 System x3550 34 34 System x3550 33 33 System x3550 32 (launchers) 32 System x3550 31 31 System x3550 30 30 System x3550 29 29 System x3550 28 28 System x3550 27 27 System x3550 26 26 System x3550 25 25 System x3550 24 24 System x3550 23 23 System x3550 22 22 System x3550 21 21 System x3550 20 20 System x3550 19 19 System x3550 18 18 System x3550 17 17 System x3550 16 16 System x3550 15 1 IBM System x3550 node 15 System x3550 14 14 System x3550 13 13 System x3550 (management) 12 11 12 2.0TB 2.0TB 2.0TB 2.0TB 2.0TB 2.0TB 2.0TB 2.0TB 2.0TB 2.0TB 2.0TB 2.0TB 2.0TB 2.0TB 2.0TB 2.0TB 2.0TB 2.0TB 2.0TB 2.0TB 2.0TB 2.0TB 2.0TB 2.0TB 2.0TB 2.0TB 2.0TB 2.0TB 2.0TB 2.0TB 2.0TB 2.0TB 2.0TB 2.0TB 2.0TB 2.0TB 2.0TB 2.0TB 2.0TB 2.0TB 2.0TB 2.0TB 2.0TB 2.0TB 2.0TB 2.0TB 2.0TB 2.0TB 10 10 09 09 08 07 08 06 NAS Storage for launcher VMs 11 07 06 05 05 04 04 03 03 02 02 System Storage N6240 01 01 Figure 14: Hardware configuration for Load Framework 14 5000 Persistent User Scale out Test with Citrix XenDesktop and Atlantis Computing 4 Software configuration and setup The following software and configurations setup tasks must be done before any performance tests are run: Management VMs Master User VM Master Launcher VM Login VSI Atlantis Computing software 5000 Persistent Desktop VMs 4.1 Setting up Management VMs The configuration and set up of the management VMs that are required for Citrix XenDesktop should follow the normal procedures as documented by Microsoft and Citrix. The following special considerations apply: The Active directory, DNS, and DHCP server is shared between all compute servers on the network (from the system under test and the load framework). There are four XenDesktop Delivery Controllers. The mapping between user IDs and the names of the persistent desktop VMs is statically specified to the connection broker rather than being randomly assigned the first time it is needed. This specification makes it easier to remedy any VM setup problems before the first performance test. If this is not done, the assignment of user IDs to VMs must be rerun until it completes successfully for all 5000 users. 4.2 Setting up master user VM Windows 7 Professional with SP1 is used as the basis for the master user VM (master image) for the scale out performance testing. The master image was created by completing the following steps: 1. Create a Windows 7 Professional 64-bit with SP1 VM. The following VM parameters should be specified: 1 vCPU, 1024 MB vRAM, and 24 GB Disk. 2. Configure Windows 7, networking, and other OS features. 3. Install VMware VMtools for access by vCenter and reboot. 4. Join to the Active Directory domain and reboot. 5. Disable all Internet Explorer plug-ins. 6. Ensure that the firewalls are turned off. 7. Enable remote desktop for remote access to the desktop. 8. Install the Windows applications that are needed for Login VSI medium workload, including Microsoft Office, Adobe Acrobat, and so on. 9. Apply the Citrix recommended optimizations. For more information, see this website: support.citrix.com/article/CTX125874 10. Install the Citrix XenDesktop Virtual Desktop Agent (VDA). This step is not needed for the brokerless RDP test scenario. 15 5000 Persistent User Scale out Test with Citrix XenDesktop and Atlantis Computing 11. Add registry to point to the FQDNs of the 4 XenDesktop Delivery Controller VMs. For more information, see this website: support.citrix.com/article/CTX137993. This step is not needed for the brokerless RDP test. The Citrix desktop service randomly selects a controller from the list (grouped or ungrouped) until a successful connection to a controller is established. 12. Shutdown the VM and take a snapshot. 4.3 Setting up master launcher VM The setting up the master launcher VM for Login VSI is similar to that for the master user VM except that the Citrix receiver should be installed. The Citrix receiver is not needed for the brokerless RDP test scenario. To save time, an autologon script is added so that the launcher VMs are automatically logged on after being started. 4.4 Setting up Login VSI Login VSI 3.7 was used to simulate the load of 5000 users for the scale out testing. The process starts by installing Login VSI using the install instructions that are available at this website: loginvsi.com/documentation/index.php?title=Installation A separate management VM is used to run Login VSI performance tests and analyze the results. As noted earlier a Citrix MCS environment is used to create the launcher VMs. First add all of the physical launcher machines to VMware vCenter and also Citrix XenCenter. Then using the master launcher image as a template, the 288 launcher VMs are created using MCS dedicated mode. The number of launcher VMs per physical server depends on its performance; however, 8 - 12 launcher VMs works well. The Login VSI tool is started to ensure that all of the launchers were created properly and are ready to use. Finally, a script is used to add the 5000 unique user IDs to AD. The password for all of these users is the same for simplicity. For the brokerless RDP test scenario, the following slightly different steps are used for running Login VSI: Ensure that the LoginVSI RDP group has access to the Master image. Use vCenter to copy and paste the IP addresses of the user VMs that are performing the LoginVSI test into a CSV file (named %csv_target% in the commandline example below). In the Login VSI configuration, replace the commandline with the following: C:\Program Files\Login Consultants\VSI\Launcher\RDPConnect.exe %csv_target% <AD domain>\<login vsi user> P@ssword1 4.5 Setting up Atlantis Computing software Install Atlantis ILIO Persistent VDI product by following the standard installation procedure. The Atlantis ILIO Center VM can be run on one of the servers that is designated for management VMs. It is a recommended Atlantis best practice that each ILIO VM has its own logical unit number (LUN) on shared storage. Therefore, 35 volumes (each with 300 GB capacity) were created on the IBM FlashSystem storage. 16 5000 Persistent User Scale out Test with Citrix XenDesktop and Atlantis Computing This capacity totals about 10 TB. Each ILIO VM and its datastore of user VMs requires less than 150 GB for a total of only 5 GB on the shared storage. However, in production, the de-duplication savings for persistent desktops is more likely to be 80% - 90% instead of the 98% that is achieved by this performance test. By using vCenter, each physical server has access to all 35 of the volumes, even though only one is actually used per physical server. The ILIO master VM and the master user VM is then placed in one of those volumes. Scripts that are available from Atlantis Computing are used to clone the ILIO VM and the master user VM across all 35 compute servers in preparation for the next step. 4.6 Setting up 5000 persistent desktop VMs Each of the 35 compute servers supports persistent desktop VMs. The number of VMs depends upon the processor capability of the server. Table 3 lists the number of VMs per compute server and VM total. Table 3: Number of VMs per compute server Server Processor Count VMs Total VMs x222 2 x E5-2470 (Sandy Bridge EN) in each half 5x2 100 1000 x240 2 x E5-2670 (Sandy Bridge EP) 2 160 2880 x240 2 x E5-2690 (Sandy Bridge EP) 5 160 800 x240 v2 2 x E5-2690v2 (Ivy Bridge EP) 18 160 320 Total 5000 A command line script from Atlantis and a CSV file are used to fast clone the master VM on each compute server to create the required number of VMs on each of the servers. A naming scheme of the server name and VM number is used to create a set of 5000 uniquely named VMs. The cloning process can take half a day to complete, but needs to be done only once for each different master VM image. Each VM is started to register with active directory and automatically assign the machine name to the VM. This process can be done as a separate step or as part of the fast cloning process described above. The VMs are then shutdown via vCenter. The dedicated machine catalog is created for Citrix XenDesktop and a 5000 line CSV file is used to automatically insert all of the named VMs into the machine catalog. A desktop group is created and the 5000 VMs are added to it. XenDesktop automatically starts each VM and ensures that it is accessible from XenDesktop. Sometimes it is necessary to do some manual steps to get all of the VMs into the correct state. The last step is to perform a standard Login VSI profile run to automatically create the user profile in each persistent desktop. Because of the static assignment of names, any failures can be corrected manually or by rerunning Login VSI. A final restart of the guest operating systems and the 5000 persistent desktops are ready for a performance test. 17 5000 Persistent User Scale out Test with Citrix XenDesktop and Atlantis Computing 5 Scale out performance results To show the performance of 5000 persistent users, the following test scenarios were run: Brokerless with RDP connected clients (no Citrix XenDesktop) Citrix XenDesktop 7.5 with HDX connected clients This section describes the results of the scale out tests by examining the performance of Login VSI test, the compute servers, and shared storage. 5.1 Brokerless by using RDP In this test scenario, the View connection server is not used and the launcher VMs are connected directly to the VMs by using the RDP protocol. This test is used as a baseline and comparison for the other tests. Figure 15 shows the output from LoginVSI with a new logon every second. Out of 5000 started sessions, 4998 successfully reported back to Login VSI. The average response time is extremely good with a VSI baseline of 860 milliseconds (ms). The graph is flat with only a slight increase in the average between the first and last desktop. As measured by Login VSI, the longest time to logon for any session was 8 seconds. Figure 15: Login VSI performance result for Brokerless by using RDP Figure 16 shows the percentage CPU utilization by using representative curves for each of the four different servers that were used in the test. The utilization slowly climbs as more users logon and then sharply drops off after the steady state period ends and the users are logged off. The E5-2470 based server has the lowest 18 5000 Persistent User Scale out Test with Citrix XenDesktop and Atlantis Computing utilization because only 100 VMs are started on those servers. The E5-2670 has the highest utilization (92%) because it has the slowest CPU of the other three servers, which all have 160 VMs. Figure 16: Esxtop CPU utilization for Brokerless by using RDP Figure 17 shows the total number of server IOPS as reported by Esxtop by using representative curves for each of the four different servers that were used in the test. The IOPS slowly climb as more users logon and then sharply drops off after the steady state period ends and the users are logged off. The E5-2470 based server has the lowest IOPS because only 100 VMs are started on those servers. The other three servers have similar curves because all have 160 VMs. The IOPS curves are spiky and show that the number of IOPS at any instant of time can vary considerably. The peaks are most likely because of logons. 19 5000 Persistent User Scale out Test with Citrix XenDesktop and Atlantis Computing Figure 17: Esxtop IOPS for Brokerless by using RDP Figure 18 shows the total number storage IOPS as measured by the IBM FlashSystem 840. The write IOPS curve shows the classic Login VSI pattern of gradual building of IOPS (up 12:56am), then a steady state period of 30 minutes (12:56am to 1:26am), and finally a peak for all of the logoffs at the end. The read IOPS are low as Atlantis Computing software is managing most of them out of its in-memory cache. The write IOPS are fairly low, peaking at less than 30,000 IOPS, which is 6 per persistent desktop. Atlantis Computing software is using its data services to compress, de-dupe, and coalesce the write IOPS. Figure 18: FlashSystem storage IOPS for Brokerless using RDP 20 5000 Persistent User Scale out Test with Citrix XenDesktop and Atlantis Computing Figure 19 shows the server latency in milliseconds as reported by Esxtop by using representative curves for each of the four different servers that are used in the test. The average latency is 300 microseconds (us) and is constant throughout the whole test. The latency for the servers with the E5-2470 CPU tends peak higher, but often is not more than 1ms. Figure 19: Esxtop latency for Brokerless by using RDP Figure 20 shows the storage request latency in milliseconds as measured by the IBM FlashSystem 840. The curve shows that the average read latency is less than 200 us and even drops to zero during the steady state phase because all of the read requests are satisfied by the Atlantis Computing cache. The write latency also often is less than 200 us with occasional peaks, which are still less than 1000 us (1 millisecond), except during the 5000 virtual desktop restart. 21 5000 Persistent User Scale out Test with Citrix XenDesktop and Atlantis Computing Figure 20: FlashSystem storage latency for Brokerless by using RDP 5.2 Citrix XenDesktop In this test scenario, the Citrix XenDesktop broker is used and the launcher VMs are connected to the XenDesktop Web Interface. Figure 21 shows the output from LoginVSI with a new logon every 2 seconds, which is half the interval of the brokerless RDP scale out test. Out of 5000 started sessions, 4997 successfully reported back to Login VSI and is a successful run. The average response time is good, with a VSI baseline of 1356 ms. The graphs for minimum and average response times are flat with only a slight increase in the average between the first and last desktop. The graph for the maximum response time increases steadily and only shows the worst case. As measured by Login VSI, the longest time to logon for any session was 16 seconds. 22 5000 Persistent User Scale out Test with Citrix XenDesktop and Atlantis Computing Figure 21: Login VSI performance result for Citrix XenDesktop Figure 22 shows the percentage CPU utilization by using representative curves for each of the four different servers that were used in the test. The utilization slowly climbs as more users logon and then sharply drops off after the steady state period ends and the users are logged off. The E5-2470 based server has the lowest utilization because only 100 VMs are started on those servers. The E5-2670 and E5-2690 CPUs have the highest utilization (95%) compared to the faster E5-2690v2 and all three servers have 160 VMs. 23 5000 Persistent User Scale out Test with Citrix XenDesktop and Atlantis Computing Figure 22: Esxtop CPU utilization for Citrix XenDesktop Figure 23 shows the total number of server IOPS as reported by Esxtop by using representative curves for each of the four different servers that were used in the test. The IOPS slowly climb as more users logon and then sharply drops off after the steady state period ends and the users are logged off. The E5-2470 based server has the lowest IOPS because only 100 VMs are started on those servers. The other three servers have similar curves as all have 160 VMs. The IOPS curves are spiky, which shows that the number of IOPS at any instant of time can vary considerably with the peaks are most likely because of a logon. 24 5000 Persistent User Scale out Test with Citrix XenDesktop and Atlantis Computing Figure 23: Esxtop IOPS for Citrix XenDesktop Figure 24 shows the total number storage IOPS as measured by the IBM FlashSystem 840. The write IOPS curve shows the classic Login VSI pattern of gradual building of IOPS. The steady state period is less discernible in this graph and occurs around 9:15 p.m. The read IOPS are low as Atlantis Computing software is managing most of them out of its in-memory cache. The number of read IOPS increases substantially at logoff. The write IOPS are quite low, peaking at less than 35,000 IOPS, which is 7 IOPS per persistent desktop. Again, Atlantis Computing software is using its data services to compress, de-dupe, and coalesce the write IOPS. Figure 24: FlashSystem storage IOPS for Citrix XenDesktop 25 5000 Persistent User Scale out Test with Citrix XenDesktop and Atlantis Computing Figure 25 shows two successive runs of the 5000 persistent desktop scale out test. Each run shows a similar pattern of IOPS, which culminates with the logoffs and an idle back to a low number. At 10.33 p.m., a reboot of all of the desktops was started and then completed 20 minutes later. In Figure 25, there are jumps in the IOPS log at 7:12 p.m. and 11:47 p.m., which is an artifact of the data collection process on the IBM FlashSystem 840. Figure 25: Two Citrix XenDesktop runs with reboot in between Figure 26 shows the server latency in milliseconds as reported by Esxtop by using representative curves for each of the four different servers that were used in the test. The average latency is 350 microseconds (us) and is fairly constant throughout the whole test. The latency for the servers with the E5-2470 CPU tends peak higher, but is usually not more than 1 ms. Figure 26: Esxtop latency for Citrix XenDesktop 26 5000 Persistent User Scale out Test with Citrix XenDesktop and Atlantis Computing Figure 27 shows the storage request latency in milliseconds as measured by the IBM FlashSystem 840. The curve shows that the average read latency is less than 200 us. The write latency is also less than 250 us and most peaks are below 750 us with occasional peaks to 2.5 ms. Figure 27: FlashSystem storage latency for Citrix XenDesktop 27 5000 Persistent User Scale out Test with Citrix XenDesktop and Atlantis Computing Resources Reference architecture for Lenovo Client Virtualization with Citrix XenDesktop lenovopress.com/tips1278 Atlantis Computing atlantiscomputing.com/products IBM FlashSystem 840 ibm.com/storage/flash VMware vSphere vmware.com/products/datacenter-virtualization/vsphere Citrix XenDesktop citrix.com/products/xendesktop Acknowledgements Thank you to the teams at Atlantis Computing (Mike Carman, Bharath Nagaraj), IBM (Rawley Burbridge), and ITXen (Brad Wasson) for their tireless work on helping with the performance testing. 28 5000 Persistent User Scale out Test with Citrix XenDesktop and Atlantis Computing Trademarks and special notices © Copyright Lenovo 2015. References in this document to Lenovo products or services do not imply that Lenovo intends to make them available in every country. Lenovo, the Lenovo logo, ThinkCentre, ThinkVision, ThinkVantage, ThinkPlus and Rescue and Recovery are trademarks of Lenovo. IBM, the IBM logo, and ibm.com are trademarks or registered trademarks of International Business Machines Corporation in the United States, other countries, or both. Microsoft, Windows, Windows NT, and the Windows logo are trademarks of Microsoft Corporation in the United States, other countries, or both. Intel, Intel Inside (logos), MMX, and Pentium are trademarks of Intel Corporation in the United States, other countries, or both. Other company, product, or service names may be trademarks or service marks of others. Information is provided "AS IS" without warranty of any kind. All customer examples described are presented as illustrations of how those customers have used Lenovo products and the results they may have achieved. Actual environmental costs and performance characteristics may vary by customer. Information concerning non-Lenovo products was obtained from a supplier of these products, published announcement material, or other publicly available sources and does not constitute an endorsement of such products by Lenovo. Sources for non-Lenovo list prices and performance numbers are taken from publicly available information, including vendor announcements and vendor worldwide homepages. Lenovo has not tested these products and cannot confirm the accuracy of performance, capability, or any other claims related to non-Lenovo products. Questions on the capability of non-Lenevo products should be addressed to the supplier of those products. All statements regarding Lenovo future direction and intent are subject to change or withdrawal without notice, and represent goals and objectives only. Contact your local Lenovo office or Lenovo authorized reseller for the full text of the specific Statement of Direction. Some information addresses anticipated future capabilities. Such information is not intended as a definitive statement of a commitment to specific levels of performance, function or delivery schedules with respect to any future products. Such commitments are only made in Lenovo product announcements. The information is presented here to communicate Lenovo’s current investment and development activities as a good faith effort to help with our customers' future planning. Performance is based on measurements and projections using standard Lenovo benchmarks in a controlled environment. The actual throughput or performance that any user will experience will vary depending upon considerations such as the amount of multiprogramming in the user's job stream, the I/O configuration, the storage configuration, and the workload processed. Therefore, no assurance can be given that an individual user will achieve throughput or performance improvements equivalent to the ratios stated here. Photographs shown are of engineering prototypes. Changes may be incorporated in production models. Any references in this information to non-Lenovo websites are provided for convenience only and do not in any manner serve as an endorsement of those websites. The materials at those websites are not part of the materials for this Lenovo product and use of those websites is at your own risk. 29 5000 Persistent User Scale out Test with Citrix XenDesktop and Atlantis Computing
© Copyright 2026