
Download (899Kb)
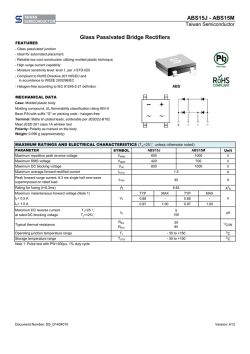
Home
Search
Collections
Journals
About
Contact us
My IOPscience
Bridging in contaminated transformer oil under DC and AC electric field
This content has been downloaded from IOPscience. Please scroll down to see the full text.
2013 J. Phys.: Conf. Ser. 472 012007
(http://iopscience.iop.org/1742-6596/472/1/012007)
View the table of contents for this issue, or go to the journal homepage for more
Download details:
IP Address: 152.78.191.139
This content was downloaded on 29/01/2015 at 15:56
Please note that terms and conditions apply.
Dielectrics 2013
Journal of Physics: Conference Series 472 (2013) 012007
IOP Publishing
doi:10.1088/1742-6596/472/1/012007
Bridging in contaminated transformer oil under DC and AC
electric field.
Shekhar Mahmud*1, George Chen1, Igor O. Golosnoy1, Gordon Wilson2 and Paul
Jarman2
1
University of Southampton, Southampton, SO17 1BJ, UK
2
National Grid, UK
*E-mail: [email protected]
Abstract. There are two experimental set up have been established to investigate the bridging
effect between two electrodes with different potentials under ac and dc voltages. This paper
will explain the full details of the experimental setup and the results. These experiments carried
out on pressboard particles under three different levels of ac and dc voltages. Several
contamination levels have been investigated. Optical images of particle accumulation have
been recorded along with associated conduction current measurement during experiments. At
higher voltages the rate of bridge formation is increased along with an associated current
increase. The major differences between ac and dc bridges are the shapes of the particle
accumulation. The bridge formation rate for ac is slower than dc.
1. Introduction
One of the key components in high voltage transmission and distribution systems are power
transformers and their consistent operation is of utmost importance to energy utility companies and
end users. However, transformer failures in the systems have gathered pace as more transformers are
approaching or exceeding their designed lifetime. Almost 30% of total transformer failures are caused
by insulation/oil contamination which has been revealed by recent analysis [1]. Therefore, it is
essential to understand the failure mechanisms/processes so the proper measures can be taken to
prevent transformer failure and this way we can save the huge cost caused by it in terms of asset loss
and business interruption.
Liquid dielectrics are used as insulation and cooling agent in almost all the high voltage power
transformers. This petroleum based dielectric liquid is called “transformer oil”. One of the major
disadvantages is the transformer oil can be easily contaminated [2, 3]. During packaging, shifting,
storing the transformer oil can be contaminated. During the operation it contacts with metal, iron core
and pressboard insulation inside a transformer. Contaminants such as metal filings or cellulosic
residual can also be formed in the oil, especially for transformers with aged paper insulation. During
normal operation non-uniform fields are present within the transformer. These contaminants tend to
move towards high field regions due to dielectrophoresis (DEP) forces and could form a bridge over a
period of time. The dielectrophoresis phenomenon first introduced by Phol [4] whereby a neutral body
placed in an electric field becomes polarized and is equivalent to an electric dipole. One side of the
dipole has an excess of positive charge and negative charge on the other. Under non-uniform electric
field region, the forces acting on the two ends do not balance and the particles move towards either
Content from this work may be used under the terms of the Creative Commons Attribution 3.0 licence. Any further distribution
of this work must maintain attribution to the author(s) and the title of the work, journal citation and DOI.
Published under licence by IOP Publishing Ltd
1
Dielectrics 2013
Journal of Physics: Conference Series 472 (2013) 012007
IOP Publishing
doi:10.1088/1742-6596/472/1/012007
high or low field region. The bridge may potentially act as a conducting path between two different
potentials within the transformer structure, leading to partial discharges or insulation failure.
Many researchers have studies various aspects of bridging phenomenon in transformer oil, such as,
conduction current, partial discharge, resistivity [5, 6, and 7] etc. Our previous studies were focused on
the effect of particle size under DC electric field [8] and numerical simulation of the bridge in
transformer oil [9]. This paper has particularly concentrated on the different mechanism of particle
accumulation under the influence of DC and AC electric field.
The aim of current work is to distinguish the particle accumulation process in contaminated
transformer oil under the influence of AC and DC high electric field. Two different experiments have
been set up to investigate the bridging effect between two electrodes with different potentials. The
experimental setup and the results have been discussed in subsequent sections. These experiments
have been carried out with pressboard particles under the influence of three different DC (2kV, 7.5kV
and 15kV) and AC (10kV, 15kV and 20kV) voltages. There are several contamination levels of
cellulose particles have been investigated ranging from 0.001% to 0.024% by weight. Optical
microscopic images and conduction current of the bridge formation have been recorded for all the
experiments.
2. Experiments
2.1. Sample tank
We have used a glass built sample tank for all the experiments. The internal volume of the tank is 550
ml. There were two spherical electrodes with the diameter of 13mm placed in the middle of the cell
and they were attached to side walls the of the test cell. The electrodes gap is adjustable via a screw
and it was kept constant at 10 mm for all the experiments.
2.2. Preparations of samples
A new pressboard which normally used in high voltage transformers was rubbed with metal files to
produce the fiber like dust particles. The fibers were categorised in to different sizes using sieves. Four
different sizes of particles were produced, less than 63 µm, 63-150 µm, 150-250 µm and 250-500 µm.
The particles were separated by the fiber width rather than length. We have tested only 150-250 µm
particles under the influence of AC electric field. The contamination levels for the particles were
0.001%, 0.002%, 0.003%, 0.006%, 0.008%, 0.016% and 0.024% by weight.
We have cleaned the sample tank with soap solution in hot water and dried under hot air flow before
starting any test with new particle size. The tank was first rinsed with some clean oil to repeat an
experiment with same size particles and wiped thoroughly with cyclohexene.
We have filled test cell with 300 ml of Gemini X type mineral transformer oil from Nynas to start a
new experiment. The quantity of transformer oil was enough to submerge the electrodes completely.
The contaminants of lowest level was then added to the oil. The sample tank was covered with cling
film to protect from external dust and moisture and it remained covered for the whole period of
experiment apart from adding the next level of contaminants. The sample tank was stirred for 2
minutes prior to every test on a magnetic stirrer which enable us to distribute the particles evenly
thought the transformer oil.
2.3. Experimental Setup
To record the optical images of the bridging, the test cell was placed under a digital camera mounted
stereo microscope. We have positioned the microscope inside an aluminum box which acts as a
Faraday Cage. The camera, Keithley Picoammeter 6485A and multimeter 2001 were controlled from a
computer and the data were also saved on that computer. The high voltage supply were calibrated at
the beginning of the experiments and an external circuitry used to monitor the voltage to ensure supply
voltage is same for every test. Block diagrams of complete experimental setup is shown on figure 1
and 2.
2
Dielectrics 2013
Journal of Physics: Conference Series 472 (2013) 012007
Figure 1. Complete block
experimental setup for DC test [7]
diagram
of
IOP Publishing
doi:10.1088/1742-6596/472/1/012007
Figure 2. Complete block
experimental setup for AC test
diagram
of
2.4. Testing procedure
One of the spherical electrodes was attached to the high voltage power supply and other electrode was
connected to the ground via a Keithley picoammeter 6485 for DC and multimeter 2001 for AC to
measure the conduction current through the gaps. Three different levels of DC (2kV, 7.5kV and 15kV)
and AC (10kV, 15kV and 20kV) high voltages were applied to the samples. The experiments were
conducted until a complete bridge was created or maximum of 25 minutes where there was no bridge.
The digital camera was set to take images in a regular interval during the test to record the images of
particle accumulation. The tests were carried out at room temperatures. The temperatures were kept
within 3 degrees difference for all the DC experiments but the temperatures were not controlled for
AC experiments. Each test was carried out three times for a particular voltage level to observe the
repeatability.
3. Results and Discussion
3.1. Bridge formation with 0.001% contaminants
The particles were moving back and forward between the electrodes as soon as 2kV DC was applied.
They were charging from one electrode and discharging at the other. The pressboard fibers were
started attaching on the electrode surfaces. Longer fibers was attached to the electrodes and then they
elongated towards the other electrode. Small spherical particles started attaching themselves to the
long fibers afterwards. A complete bridge continued to grow in this way. A very thin bridge formed
for 2kV supply after 600s for on figure 3. Applied voltage of 7.5 kV initiated the particles movement
more quickly. Within only 240s A thin bridge were formed. The bridge continued to grow thicker until
600s (figure 3). No change was observed after that. The completed bridge for the bigger particles was
not as thick as for the smaller particles. The particles started to move fiercely after applying 15kV DC.
A thin complete bridge was formed by 70s and it continued to thicken up to 300s. The bridges were
thicker near the electrodes and thinner towards the middle.
The particles were slowly moving after the 10kV AC supply turned on. They started to move towards
the high gradient of electric field region and started attaching themselves to the electrodes slowly
because positive of dielectrophoretic force. This process of attaching to the electrodes were going on
equally to both electrodes. More particles were attached to the electrodes as time elapsed. These
experiments were carried out on several contamination levels i.e. 0.001%, 0.002, 0.003, 0.006%,
0.008%, 0.016% and 0.024%. As the concentration increased the particle accumulations to the
electrodes increased. But they never formed a complete bridge between the two electrodes. Our
experimental result does not align with [6], in which bridging were observed with spherical and
wrapped electrode system in moistened and pressboard fiber concentrated samples under AC electric
3
Dielectrics 2013
Journal of Physics: Conference Series 472 (2013) 012007
IOP Publishing
doi:10.1088/1742-6596/472/1/012007
field under the influence of 6kV and 8 kV AC electric field for spherical and formed wire electrodes
respectively.
Figure 3. Optical microscopic images of
bridging in contaminated transformer oil with
150-250 µm pressboard fiber, concentration level
0.001% under DC [8]
Figure 4. Optical microscopic images of bridging
in contaminated transformer oil with 150-250 µm
pressboard fiber, concentration level 0.001%
under AC
3.2. Bridge formation and conduction current with 0.003% contaminants for DC and 0.024% for AC
The contaminants were started moving slowly between the electrodes after applying 2kV DC electric
field. This movement of particles was due to charging and discharging. A complete thin bridge was
observed after 180s. The bridge grew until 600s for as shown on figure 5. Different branches were
made from one electrode to the other. It took only 10s to form a bridge after 7.5kV applied. The bridge
was thickened until 300s, no change observed after that. The completed bridge for lower voltage was
shallower than higher voltage. The movements of the particle were intensified after applying 15kV. A
thin complete bridge was made within 5s, and thickened up to 60s.
The movement of the particles were intensified with the applied voltage increased from 10kV, 15kV to
20kV AC. The particle accumulations towards the high electric field region were also increased with
the applied voltage. This test with 0.024% contamination had the highest particle attachment to the
electrodes. But no complete bridges were formed between the electrodes.
Figure 5. Microscopic images of bridging in
contaminated transformer oil, concentration level
0.003% under DC [8]
Figure 6. Microscopic images of bridging in
contaminated transformer oil, concentration level
0.024% under AC
4
Dielectrics 2013
Journal of Physics: Conference Series 472 (2013) 012007
IOP Publishing
doi:10.1088/1742-6596/472/1/012007
Conduction currents with contamination levels of 0.001% to 0.004% and 0.001% to 0.024% shown in
the figure 7 and 8 under the influence of 15kV DC and 15kV AC respectively. From the DC current
plot we can observe that the current increased non-linearly with the increment of contamination level
under a fixed voltage. When the contamination level linearly increased from 0.001% to 0.004%, the
conduction current increased from 3, 6, 15, and 23 nano amp which means 2, 5 and 8 times with
respect to lowest contamination level of 0.001%. There was no noticeable change exist in the AC
conduction current. The contamination levels were tested from 0.001% up to 0.024% but as there was
no complete bridge formed, the current also didn’t conducted through the particles.
Figure 7. Conduction current with different
contamination levels under the influence of 15kV
DC electric field.
Figure 8. Conduction current with different
contamination levels under the influence of 15kV
AC electric field.
3.3. Comparison between AC and DC conduction current
The conduction currents of all the contamination levels are summarised in figure 9 for DC and figure
10 for AC. The maximum currents were plotted where the values almost steady. The DC conduction
currents were almost linear with applied voltage of 7.5kV. Though some non-linearity features of the
process can be clearly seen for 15kV but overall we can say that the current increased with the
increment of contamination levels for DC case. Two different mechanism can contribute to the
conduction, namely charging of separate particles by touching the electrodes together with their
migration and formation of the conductive bridge. On the other hand, the conduction currents for AC
were almost constant for all the concentration levels tested. There might be various reasons, there was
no complete bridge formed between the electrodes, the particles were not charging because of
alternating frequency quicker than charging time. It was also reported that the overall conductivity of
the particles and the medium affects under low frequency but the overall permittivity affects by high
frequency.
Figure 9. Conduction current under DC.
Figure 10. Conduction current under AC
5
Dielectrics 2013
Journal of Physics: Conference Series 472 (2013) 012007
IOP Publishing
doi:10.1088/1742-6596/472/1/012007
4. Conclusion
The major difference in particle accumulation under the influence of DC and AC voltage is the shape
of the particles assembly. It can be concluded that at higher DC voltages, the rate of bridge formation
is strongly increased along with an associated current increase. It takes longer time to accumulate the
particles AC electric field compared to DC. The particles are strongly bonded, covered the half of the
electrode surface and slow increase in the middle of the electrode for the AC case. A complete bridge
between the two electrodes is always formed no matter how small is particle concentration level in
transformer oil whereas for AC electric field there was never a case of full bridge formation between
the electrodes even with the concentration level 24 time higher than the DC electric field. Future
studies will include the experiments under DC biased AC electric field, effect of electrode shape and
tests with insulated electrodes to comprehend the dynamics of particle accumulation in transformer oil.
Acknowledgements
Authors would like to thank National Grid and IET Power Academy for sponsoring the project.
References
[1] Sokolov, V. V., 1994. Experience with the refurbishment and life extension of large power
transformers. Minutes of the sixty-first annual conference of doble clients, Sec. 6-4.
[2] Rouse, T. O., 1998. Mineral insulating oil in transformers. Electrical Insulation Magazine,
IEEE 14(3): 6-16.
[3] Danikas, M.G., 1990, Breakdown of transformer oil. Electrical Insulation Magazine, IEEE.
6(5): p. 27-34.
[4] Pohl H. A., 1951, The motion and precipitation of suspensoids in divergent electric fields.
Journal of Applied Physics. 22(7): p. 869-871.
[5] Chen G. and Zuber M. H., 2007, Pre-breakdown characteristics of contaminated power
transformer oil, Electrical Insulation and Dielectric Phenomena, CEIDP 2007. Annual Report Conference on, 2007, pp. 659-662.
[6] K. W. H. Moranda, H. M. Grzesiak, 2003, Dynamics of bridge creating in contaminated oil at
AC voltage and analysis of accompanying partial discharges, XIII International Symposium on
High Voltage Engineering, Netherlands.
[7] J. G. M. Ossowski, H. Moronda and H. Moscicka-Grzesiak, 2003, Oil resistance at different
phases of bridge mechanism development at direct voltage, XIII International Symposium on
High Voltage Engineering, Netherlands.
[8] Mahmud, S., Chen, G., Golosnoy, I. O., Wilson, G. and Jarman, P., 2012, Bridging
phenomenon in contaminated transformer oil. Proceedings of 2012 International Conference on
Condition Monitoring and Diagnosis. 2012 International Conference on Condition Monitoring
and Diagnosis. Piscataway, US, Institute of Electrical and Electronics Engineers, 180-183.
[9] Mahmud, S., Golosnoy, I. O., Chen, G., Wilson, G. and Jarman, P., 2012, Numerical
simulations of bridging phenomena in contaminated transformer oil. Proceedings of 2012 IEEE
Conference on Electrical Insulation and Dielectric Phenomena, Montreal, Canada, 14 - 17 Oct
2012.4pp, 383-386.
6


© Copyright 2026