
white paper
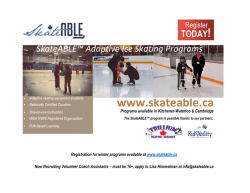
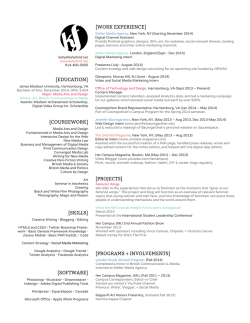
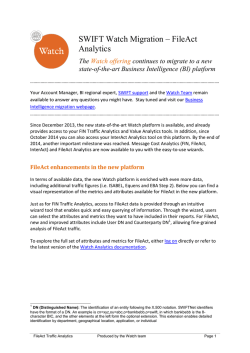
A KNEWTON WHITE PAPER
The Knewton
Platform
A General-Purpose Adaptive
Learning Infrastructure
Authors: Kevin Wilson, Principal Data Scientist and Zack Nichols, Data Scientist
January 2015
www.knewton.com
Table of Contents
1 Introduction . . . . . . . . . . . . . . . . . . . . . . . . . . . . . . . . . . . . . . . . . . . . . . . . . . . . . . . . . 4
1.1 Background . . . . . . . . . . . . . . . . . . . . . . . . . . . . . . . . . . . . . . . . . . . . . . . . . . . . . . . . . 4
1.2 Overview of Knewton’s Approach . . . . . . . . . . . . . . . . . . . . . . . . . . . . . . . . . . . . . . . 6
2 Flexible, Scalable Content Graphing at Knewton . . . . . . . . . . . . . . . . . . 7
3 Measuring Student Knowledge . . . . . . . . . . . . . . . . . . . . . . . . . . . . . . . . . . . . . 9
3.1 Item Response Theory . . . . . . . . . . . . . . . . . . . . . . . . . . . . . . . . . . . . . . . . . . . . . . . . . . 9
3.2 Knewton’s Approach: Generality and Scalability . . . . . . . . . . . . . . . . . . . . . . . . . . 10
3.3 Alternative Approaches: Modeling Mental Processes Instead of Effects . . . . . . . 12
4 The Knewton Inferential Engines . . . . . . . . . . . . . . . . . . . . . . . . . . . . . . . . . . 13
4.1 The Recommendation Engine . . . . . . . . . . . . . . . . . . . . . . . . . . . . . . . . . . . . . . . . . . 13
4.1.1 Example: Modeling Engagement . . . . . . . . . . . . . . . . . . . . . . . . . . . . . . . . . . . . . 13
4.2 The Analytics Engine . . . . . . . . . . . . . . . . . . . . . . . . . . . . . . . . . . . . . . . . . . . . . . . . . 14
4.2.1 Example: Active Time . . . . . . . . . . . . . . . .. . . . . . . . . . . . . . . . . . . . . . . . . . . . . . . . 14
4.2.2 Example: Work Remaining . . . . . . . . . . . . . . . . . . . . . . . . . . . . . . . . . . . . . . . . . . . 15
5 Infrastructure at Scale . . . . . . . . . . . . . . . . . . . . . . . . . . . . . . . . . . . . . . . . . . . . . 17
5.1 The Knewton Architecture . . . . . . . . . . . . . . . . . . . . . . . . . . . . . . . . . . . . . . . . . . . . 17
5.2 Engineering for Reliability . . . . . . . . . . . . . . . . . . . . . . . . . . . . . . . . . . . . . . . . . . . . 18
6 Conclusion . . . . . . . . . . . . . . . . . . . . . . . . . . . . . . . . . . . . . . . . . . . . . . . . . . . . . . . . . . 20
www.knewton.com
2
Abstract
The Knewton platform is a flexible, scalable system for delivering adaptive learning
experiences and predictive analytics across arbitrary collections of content in
different learning environments. Knewton processes student interactions within
learning applications to personalize digital coursework and effectively reinforce class
lessons. Knewton supports the learning process with three core services: personalized
recommendations for students, analytics for teachers and students, and content
insights for application and content creators.
While adaptive tutoring systems are themselves not new, a traditional problem they
face is that they are often bound to a single grouping of content. Even where they
are not, adapting the tutoring system to a new collection of content is an expensive
and time-consuming process. The Knewton platform builds on decades of research
in adaptive tutoring systems, psychometrics, and cognitive learning theory, but also
contains several key innovations that make it possible to quickly and efficiently
integrate with new collections of content. This enables the benefits of adaptive
tutoring to reach far more students across more domains more quickly. One of these
innovations is the Knewton knowledge graph and its associated graphing ontology,
which provides flexible and expressive ways to describe relationships between
content. These expressive relationships are drawn from pedagogical reasoning
and are intended to map easily to human intuition, which allows Knewton and its
partners to quickly graph new content into an information-rich, machine-readable
state. The resulting content graph is then used in conjunction with up-to-the-minute
descriptions of students’ abilities determined by a real-time psychometrics engine to
deliver intelligent, personalized content recommendations and analytics. Knewton
scales these operations by employing a service-oriented architecture, which allows its
inference engines to reliably and efficiently process concurrent activity from tens of
millions of students.
www.knewton.com
3
SECTION 1
Introduction
Knewton provides a set of tools and services that education companies can use to
make their learning applications adaptive. These tools, which include individualized
tutoring, predictive analytics, and student progress reports, are built into a platform
that is focused at a fundamental level on scalability. This includes scalability both in
terms of content areas that Knewton can support and in terms of the amount of data
that Knewton can handle.
Scaling across content domains allows the benefits of adaptive learning and
individualized tutoring to reach a large number of students working on disparate
material. By leveraging large amounts of (anonymized) data, Knewton constantly
refines the accuracy of its models and enhances the usefulness of its technology.
1.1 Background
The Knewton platform is built on decades of research from several interweaving fields,
including psychometrics, cognitive learning theory, and intelligent tutoring systems (ITS).
Interest in what is now called adaptive learning can be traced back at least to
educational research in the 1960s (cf. Smith and Sherwood 1976) and received a
boost when the large positive impact that one-on-one tutoring can have on student
performance was experimentally quantified. For example, one influential study
by Bloom (1984) reported that individual tutors can confer an improvement of two
standard deviations. This dramatic effect provided the motivation for a large body of
work in adaptive tutoring research (reviewed by VanLehn 2011; Evens and Michael
2006): If a human tutor can improve learning outcomes so radically, then many of the
benefits (though likely not all) might be captured by an automated system.
The duration and breadth of research into intelligent tutoring systems is evidence
not just of their utility and promise, but of the difficulty of their construction. Many
well-known tutoring systems, e.g., ALEKS (Doignon and Falmagne 1999), AutoTutor
(Graesser et al. 1999), Andes (Gertner and VanLehn 2000), and Guru (Olney et al.
2012), represent years of laboratory effort, and specialize in one or a few specific
domains of study such as mathematics, physics, and biology. This research has yielded
learning systems with measurable positive effects on student outcomes, as well as
useful insights into learning itself — such as the observation that tutoring systems
that present content in a scaffolded way, where content is structured to build up
www.knewton.com
4
SECTION 1: INTRODUCTION
more complex ideas in stages, have an advantage over those that do not (VanLehn
2011). However, the systems created for this specialized research are not scalable to
the massive amount of content across all educational domains — which limits the
educational domains in which they can be used and, by extension, the number of
students that can benefit from them.
One reason for the difficulty in bringing traditional ITS research to a larger scale is
the problem of modeling student knowledge and understanding (see Graesser et al.
2012, for review). Consider just the problem of handling a wrong answer: There are
a tremendous number of ways to make a mistake, and each way reveals different
information about a student’s misconceptions. This problem is clearly illustrated by Self
(1990), in discussing how to diagnose possible missteps in a simple calculus problem:
If there are m possible transformations (m ≈ 30 in this case), n
mistransformations for each of these (say, n ≈ 5) and up to p steps to
a solution (say, p ≈ 10), then there may be up to [m(n + 1)]p paths to
analyse (about 1024), which is clearly intractable.
The highly undesirable outcomes from failing to address or acknowledge this problem
are illustrated in the case study by Erlwanger (1973), in which a young student learning
from a highly structured (but non-computerized) system for teaching mathematics
developed nonsense rules of computing fractions (rather than a good understanding)
in order to satisfy the teaching system.
The toughness of this problem has led to the development of several different tutoring
system approaches (reviewed by Nwana 1990; Anderson et al. 1990) and useful threads
of research. Some of the most influential of these include the artificial intelligence
and natural language processing approach of Carbonell (1970), the cognitive modeling
approach of Anderson (1996), and the abstract knowledge space mapping of Doignon
and Falmagne (1999). While these approaches were necessary and important steps in
the development of modern intelligent tutoring systems, none were developed with the
intention of bringing the benefits of adaptive learning to as many students across as
many content domains as possible.
www.knewton.com
5
SECTION 1: INTRODUCTION
1.2 Overview of Knewton’s Approach
Figure 1: The structure of Knewton’s platform.
Knewton pairs information about content (via the Knewton knowledge graph (top)) with student response
data (left) to make real-time psychometric inferences about student abilities. These inferences are in turn used
to power predictive analytics on student outcomes (bottom) and to generate personalized recommendations
for what to study next (right). Knewton’s accuracy improves as more data are collected, since Knewton can
use student response information to revise and upgrade the models and parameters used in the analytics and
recommendation systems (bidirectional arrows).
Knewton uses a novel instrument to address the problems of student modeling that
focuses directly on scalability across content: the Knewton knowledge graph (see
Section 2 for more detail).
The Knewton knowledge graph represents arbitrary content in a semantic graph
structure. This structure provides Knewton a way to diagnose student understanding
(and misunderstanding). It can also power intelligent tutoring strategies (reviewed by
Graesser et al. 2012) such as frontier learning (Sleeman and Brown 1982), building on
prerequisites (Gagné 1985), and remediating deep misconceptions (Lesgold et al. 1988).
The Knewton knowledge graph is built using the Knewton adaptive ontology, an
intuitive and flexible set of objects and relationships that are easy to learn, easy to
express content relationships in, and powerful enough to use as a basis for analytics
and adaptive tutoring.
As is illustrated in Figure 1, within the Knewton platform, the Knewton knowledge
graph is used to contextualize student responses for a real-time psychometrics engine.
This engine is in turn used to power a predictive analytics engine and a personalized
recommendation system. The models used in the psychometrics, analytics, and
recommendation systems both adapt to individual students and become more accurate
as more students use the system (Sections 3 and 4).
www.knewton.com
6
SECTION 2
Flexible, Scalable Content
Graphing at Knewton
The Knewton knowledge graph is a novel approach to the problems outlined in Section
1: enabling adaptivity and individually targeted predictive analytics without explicit
detailed cognitive models, and without lengthy and difficult re-implementation (or reinvention) for each educational content area.
The notion of representing content relationships in a graph structure is not new, and
the Knewton knowledge graph builds on previous work (Novak 1990; McAleese 1999;
Doignon and Falmagne 1999; Hwang 2003). However, where the Knewton knowledge
graph innovates is in its flexible and expressive ontology, which allows diverse content to
be easily represented and connected with each other. This makes the Knewton knowledge
graph a core instrument in enabling Knewton’s scalability across content domains.
Elements in the Knewton adaptive ontology consist of modules (pieces of content),
concepts (abstract but intuitive notions of ideas that the content teaches and assesses),
and relationships between these two. Since concepts are abstract, rather than tied to
a particular book or pedagogy, they can be used to describe relationships between any
modules, even those existing in different books, subject areas, or school years.
Types of relationships in the Knewton adaptive ontology include containment (content
or concepts belonging to larger groups), assessment (content providing a view on
student understanding), instruction (content teaching a particular concept), and
prerequisiteness (concepts requiring understanding of earlier concepts).
The content in a typical textbook can be expressed in the Knewton adaptive ontology
in a few weeks of manual effort by a trained subject matter expert. Automated methods
can also assist in generating a knowledge graph by combining content data and student
interaction data. When faced with large content collection, Knewton works with
partners to define and staff a scalable graphing process.
www.knewton.com
7
SECTION 2: FLEXIBLE, SCAL ABLE CONTENT GRAPHING AT KNEWTON
1.1
1.2
10 .1
2.1
3. 1
2.2
32
Figure 2: A representation of the Knewton knowledge graph.
The Knewton knowledge graph allows diverse content to be easily represented and connected with each other.
For example, concepts (circles) are connected by prerequisite relationships (arrows).
As mentioned in Section 1, the Knewton knowledge graph allows us to generate
adaptive recommendations based on pedagogical criteria, such as those reviewed
by Graesser et al. (2012), including frontier learning, building on prerequisites, and
providing remediations.
The Knewton knowledge graph is also a key input in the Knewton predictive analytics
engine. The analytics engine, analogously to the recommendation engine, makes use
of the student psychometrics updates in accordance with the Knewton knowledge
graph. In addition, the analytics engine provides a set of inferential models and userfacing real-time predictions which offer students and instructors a usable summary of
student progress (see Section 4).
www.knewton.com
8
SECTION 3
Measuring Student Knowledge
As mentioned in Sections 1 and 2, Knewton’s first step in providing adaptive
recommendations and analytics is to make psychometric inferences on student
knowledge and abilities. While several psychometric testing approaches exist (PeñaAyala 2014, Lord 1958), the basis for Knewton’s psychometric engine is a popular and
well-studied approach named Item Response Theory (IRT) (covered in the next section).
Knewton also incorporates many of the ideas behind such approaches as multi-concept
models and temporal models of students’ proficiencies.
3.1 Item Response Theory
IRT is a family of models that describes the probability of a student answering a question
correctly as a function of a nonlinear relationship between student ability (θ), item
difficulty (β), and discrimination (α). The nonlinear function (typically a sigmoid) is called
an item response function. This class of models is most closely associated with Frederic M.
Lord, who published a monograph on the subject in 1952 (Lord 1952; Wainer 1983).
(θ)
Figure 3: Typical item response functions.
When the difficulty β is equal to a student’s proficiency θ, the probability that the student will answer correctly
is 0.5. As proficiency becomes much lower than the difficulty, the probability of answering correctly trails off
to 0; as proficiency grows, the probability increases to 1. The discrimination of a question is represented by the
breadth of proficiencies over which that transition occurs.
www.knewton.com
9
SECTION 3: MEASURING STUDENT KNOWLEDGE
Figure 3 gives several examples of item response functions and the probabilities that
students with varying ability levels will correctly answer a question.
Given this specification and data, standard algorithms like gradient ascent and
expectation maximization can be used to estimate item-level parameters and student
proficiencies simultaneously. Students who tend to answer more questions correctly
will have higher proficiencies, and questions which tend to be answered correctly more
frequently will be less difficult.
While IRT is very popular and has a proven track record in psychometric testing,
many common IRT models make assumptions that can be limiting in the context of
adaptive learning. For example, a common assumption is that a student’s proficiency
is constant, or at least that it is being measured at a single instant. This does not match
the expectations of an adaptive learning system, where assessments are continuously
administered over a long period of time in which the student is expected to learn.
Another common limiting assumption in IRT models is that the overall ability of a
student can be condensed into a single parameter. While this assumption might be
reasonable when estimating student abilities in a single summative assessment, it is
much less likely to be true in an adaptive learning environment where students interact
with content across multiple fine-grained concepts.
Modeling these finely grained skills requires extending IRT to support multiple
proficiencies, and providing a way for these proficiencies to interact. This interaction
may be compensatory (where a high ability in any relevant concept can be used to
answer a question), or non-compensatory (where sufficiently high proficiency in every
relevant concept is necessary to answer a concept). Understanding which type of
interaction is relevant at which time has been an active area of research (Reckase and
McKinley 1983b; Reckase 1985) since the introduction of the idea by Rasch (1961).
3.2 Knewton’s Approach: Generality and Scalability
Knewton’s psychometric engine handles both of the abovementioned issues with
traditional IRT’s simplifications. The issue of learning and forgetting is handled by
allowing student proficiencies to change over time. The issue of dealing with multiple
fine-grained concepts is handled by taking advantage of information contained in the
Knewton knowledge graph to understand how proficiency in one concept interacts
with proficiency in others.
www.knewton.com
10
SECTION 3: MEASURING STUDENT KNOWLEDGE
To illustrate Knewton’s approach, consider a sample IRT model that only has a single
difficulty variable βi per question i and a single difficulty variable θs per student s. If
student s answers item i, then those two random variables are linked by a third random
variable rsi, which takes the value correct with probability psi = f(θs – βi) and incorrect with
probability 1 – psi. Here f is an item response function as shown in Figure 3.
Knewton then introduces not just a single parameter θs per student s, but a single
parameter βsc per student s per concept c. Further, each item i gains one parameter per
concept, βic. If a student answered item i, then all the θsc and βic would be linked by a
random variable rsi which takes the value correct with some probability psi and incorrect
with probability 1 – psi. Here psi would be some function of all θsc and βic.
For instance, in the compensatory setting, when a student can understand any
combination of concepts in order to answer a question correctly, the link function
might be
)
(1)
psi = f Σ θsc – βic
c
)
where f is a traditional item response function. The more total proficiency that a
student has gained, the more likely she is to respond correctly to a question.
On the other hand, in the non-compensatory setting, when a student cannot answer a
question without understanding all of a set of concepts, the link function might be
)
)
(2)
psi = Π f θsc – βic ,
c
so that even if she had very high proficiency in one concept, having very low
proficiency in another concept would tend to make her overall chance of correctly
answering a question low (since for any numbers 0 < a, b < 1, ab < a, and ab < b). Or
perhaps the correct representation is something in between — for instance, when two
concepts overlap and can only partially compensate for each other.
Instead of taking this traditional approach, the knowledge graph allows Knewton to
work with concepts which are very fine-grained. The edges in the graph are used to
describe relationships between individual concepts such that it becomes possible to
draw inferences about, for instance, how a student’s proficiency in a prerequisite of a
concept changes, given changes in her proficiency with respect to the original concept.
This and other prior beliefs between a student’s proficiencies allow Knewton to do
Bayesian updates on her proficiencies as she does more work.
www.knewton.com
11
SECTION 3: MEASURING STUDENT KNOWLEDGE
Similarly, Knewton addresses learning by allowing proficiencies to change over time.
The introduction of a set of time-indexed random variables, and appropriate priors,
enables Knewton to model how a student’s proficiency changes over time.
These modifications to the IRT framework, coupled with the knowledge graph and
sufficient student interaction data, enable both productive interpretation of student
interaction data, and tractable real-time inference computation.
3.3 Alternative Approaches: Modeling Mental
Processes Instead of Effects
The previous sections describe how Knewton modifies traditional IRT models by
generalizing some of the assumptions made by Lord’s original model. Still, all of
Knewton’s models make assumptions about how a student’s mental state (e.g., her
proficiency and her engagement) affects her interactions with the world (e.g., her
answers to questions and how long she takes to answer them).
This leads to the question of whether it is possible to model the mental state of a
student more directly. Several researchers have built such frameworks, notably the
ACT-R framework (Anderson 1996; Anderson et al. 2004), which models cognitive
processes directly. However, this model, while expressive and often explanatory, has
required many years of laboratory work to build and refine. To extend this model
for each new domain of knowledge would likely require similar investments and
many years of careful study. As a consequence, such a process does not scale to the
vast amount of content available across all knowledge domains. While many such
implementations are successful in their original subject areas, they have not expanded
to new domains. Instead, Knewton builds models of student behavior, mediated by
the knowledge graph described in Section 2. These models incorporate Knewton’s
estimates of student-specific parameters, whose structural relationships are informed
by the knowledge graph.
www.knewton.com
12
SECTION 4
The Knewton Inferential Engine
After updating its estimates of student knowledge and abilities via the IRT-based
psychometric engine (Section 3), Knewton is able to begin the work of providing
adaptive recommendations and predictive analytics via its inferential engines.
These engines (outlined in Section 1) consist of real-time updating models, each of
which uses information aggregated across the students interacting with Knewton to
better describe each student’s current overall status (e.g., proficiency, engagement, and
work habits), as well as to predict student outcomes and target interventions.
Each of these engines derives a large benefit from increasing quantities of both content
and active students in the Knewton platform. Model accuracy can be dramatically
improved via the additional information (for example, student knowledge can be more
accurately measured if the difficulty of the questions they are responding to is better
estimated), and because model predictions can be more thoroughly tested and calibrated.
4.1 The Recommendation Engine
The recommendation engine consists of models that power the adaptive system behind
Knewton’s recommendation service.
4.1.1 EXAMPLE: MODELING ENGAGEMENT
At a given moment in time, a student’s engagement with a lesson or a piece of
content can influence how much she learns from that experience. For instance, some
research has indicated that boredom is associated with poorer learning outcomes and
a propensity for gaming the system and that confusion is a common state in digital
learning environments (Baker et al. 2010). Knewton incorporates a model of student
engagement to make recommendations as effective as possible.
When a student’s engagement drops, her productivity also tends to drop, sometimes
to the point of ending the session entirely. The data hint that perhaps some content
is more likely to cause a student to quit working than others, and indeed, that is
frequently the case. One might think that content with a high quitting rate should
never be recommended to students. But in certain cases, the content might provide
reasonable instruction, just on a very difficult concept. In these cases, Knewton’s
proficiency models can reveal whether students tend to perform better after having
www.knewton.com
13
SECTION 4: THE KNEWTON INFERENTIAL ENGINE
worked through this particular piece of content, even though it is challenging, and can
use that information to make more informed recommendations.
Knewton’s recommendation engine combines such insights with several other models
in order to produce a final, personalized recommendation.
4.2 The Analytics Engine
In parallel with the recommendation engine, Knewton’s analytics engine provides
real-time inferences for predictive analytics and student reports. Just as with the
recommendation engine, the models in the analytics engine benefit tremendously
from the scale of data collected by Knewton. This is illustrated here with two examples:
the Active Time metric and the Work Remaining metric.
4.2.1 EXAMPLE: ACTIVE TIME
The Active Time metric tracks how much productive time students spend working
with educational materials. While this sounds like a simple task (merely adding up the
amount of time a student spends answering questions on an educational application)
it is in fact more complicated. For example, students may leave learning application
windows open while engaging in other activities, or may answer questions in a rapid,
disinterested way, or may quickly click through multiple choice options in search of the
correct answer if the learning application allows it. In these cases, while the student
technically has spent time on the learning system, it is not active time — time that is
spent engaged in learning.
In order to determine how much of the reported time spent on the learning system
is active for each student, the analytics engine uses an inferential model that takes
advantage of the volume of data available to Knewton.
The inferential model for Active Time is based on a version of collaborative filtering
(Goldberg et al. 1992) that is modified to detect outlier events. Briefly, each interaction
from student s on item i has a duration d(s, i) that is assumed to be a product of a
student-specific rate (rs) and an item length (li), plus a component es, i which represents
deviations from the expected duration due to loss of engagement with the content.
In typical learning data, many students interact with the same item, and a single
student can interact with many different items. The model uses these relationships
by collecting the interaction durations into a sparse matrix D, where entry s, i in the
www.knewton.com
14
SECTION 4: THE KNEWTON INFERENTIAL ENGINE
matrix represents the duration of student s’s interaction with item i. This sparse matrix
is then approximated via a rank-1 estimate E defined as
E = rLT
where r = (r1, r2, … rn) and L = (l1, l2, … lm), so that the deviation between E and D (at the
existing entries of D) is due to non-zero engagement components es, i.
A traditional matrix factorization method might attempt to minimize the discrepancy
quantity Σs, i (d (s, i) - Es, i )2 by finding optimal parameters r and L to explain D. For
student data however, outliers in interaction durations are expected to be common
as students become distracted, click through content hurriedly, or leave their work
open as they do other activities. So instead of using the traditional L 2 norm as above
(which is sensitive to outliers), Active Time uses a simple median calculation to find
the factorized matrix E. While another L p norm where p < 2 could also work, the more
straightforward median calculation has the advantage of efficiency (while maintaining
its robustness to outliers) given the large amount of data that Knewton collects.
Once the parameter vectors r and L are computed, each new interaction duration
that is received can be compared to the predicted duration given the student and item
components. This comparison is used to determine the active time awarded for the
interaction.
This approach allows Knewton to leverage data collected from many students’ activity
across the entire range of content to discover what reasonable response durations are
for the particular student and item in question, and to infer the appropriate active time
during an interaction.
4.2.2 EXAMPLE: WORK REMAINING
The Work Remaining metric predicts how much activity Knewton expects that a
student will have to complete before she is proficient in a content area. While students
might be learning and progressing at a good pace, it can sometimes be unclear how
much progress is left to attain an educational goal or whether that remaining work is
likely to be covered in the time left without any interventions.
The Work Remaining metric uses a version of the IRT model (Section 3) that is able
to gauge how quickly students are gaining proficiency as they work through content.
Since Knewton will often need to predict how quickly a student will be able to learn
a content area before they have actually begun working on it, a form of matrix
www.knewton.com
15
SECTION 4: THE KNEWTON INFERENTIAL ENGINE
completion is again used. Here, for each student s and content area c, there is assumed
to be a quickness parameter qs and a toughness parameter tc that together with an error
term es, c form a prediction for how much practice it takes a student to gain proficiency
in a content area: p(s, c) =qstc + es, c.
As is the case with the Active Time metric (above), the Work Remaining metric assumes
a rank-1 approximation to a matrix P with the form
P = qt
T
where q = (q1, q2, … qn ) and t = (t1, t2, … tn ). The vectors q and t are computed using a
large-scale matrix completion algorithm, which yields a method to estimate how much
instruction and practice a student might require on novel content.
While these estimates (together with estimates of proficiency) are useful for
understanding a student’s progress on the content they are currently working on, by
combining these estimates with the learning paths implied by the Knewton knowledge
graph (Section 2), they can also be used to predict how much instruction and practice a
student will require for a larger group of content, or for educational goals several days
or weeks in the future.
Further, these estimates can be compared with actual outcomes. This is done by
defining a true value as the amount of work (instruction and practice) a student
requires to become proficient and comparing it to the prediction derived from the
model and knowledge graph. Occasionally, students who perform less work than
expected gain proficiency in the content area nonetheless, and students who perform
more work than expected still fail to gain proficiency. By tallying these situations
according to the magnitude of the implied error, Knewton is able to detect bias and
create estimates of the Work Remaining confidence bounds.
www.knewton.com
16
SECTION 5
Infrastructure at Scale
Each of the inferential models included in the psychometrics, recommendation, and
analytics engines benefits from the massive amount of data that Knewton is able to
process. Handling this amount of data requires a modern, scalable architecture that
is sophisticated enough to run complex statistical operations, reliable enough to
keep inferential engines available at all times, and fast enough to perform necessary
calculations in milliseconds.
5.1 The Knewton Architecture
The Knewton infrastructure is built using a service-oriented architecture (Papazoglou
2003), where each service is responsible for solving a modular and well-defined
problem. The services themselves communicate both with each other and with partner
applications through an API to create a flexible and manageable ecosystem.
Figure 4: Knewton’s modular architecture.
Partners send data and make requests to an API layer, which handles issues like authentication and delegates
the request to the proper internal service. Services in the core layer handle basic information such as student
enrollment and content structure (as represented in the Knewton knowledge graph). The core layer services are
responsible for keeping this information current in a data storage layer, and for fetching relevant parts when
requested. The application layer contains the machinery for inferred student metrics and recommendations.
The application layer makes use of the core layer to retrieve necessary information when updating based on
messages from the API.
www.knewton.com
17
SECTION 5: INFRASTRUCTURE AT SCALE
Knewton services are divided into several layers (Figure 4), including a core layer and
an application layer. The core layer communicates to databases and makes relevant
information available to the application layer in a digested and usable form. An
example of a core service is the graph service, which keeps up-to-date information
on content that has been graphed according to the Knewton ontology (Section 2), and
delivers on demand relevant sections of this graph (with version history) to models
running the application layer. Since the entire graph is too big to be easily transferred
between services, the graph service is responsible for communicating with the graph
database, efficiently fetching and returning only the relevant parts of graph data.
The application layer contains the services that are responsible for the inferential
engines described earlier: the psychometrics engine, the recommendation engine, and
the analytics engine. Each of these relies on the data managed by the core service layer
being readily available. Every message received about a student’s interactions with
content involves the concerted effort of each of these services to maintain up-to-theminute accurate recommendations and student analytics.
The arrows in Figure 4 show the order in which data are processed by the Knewton
architecture. Messages are received from partner applications by an API service, which
in turn informs other services of the message as needed. Some messages (e.g., adding
content to the Knewton knowledge graph or enrolling a student into a course) can be
handled by talking to the appropriate core service, which will update the database layer
with the new information. Messages on student activity, however, are handled by the
application services, which in turn request relevant data from the core services and
update their state to reflect the new information and make new inferences available to
the API layer.
5.2 Engineering for Reliability
Since Knewton is responsible for delivering real-time student analytics and personalized
recommendations to many educational partners across the world, its infrastructure
also has to be as reliable as possible. Unfortunately, computing infrastructures have to
contend with power outages, network downtime, hardware failures, and software bugs
— all of which become more likely as the system grows in size.
A service-oriented architecture can help mitigate these barriers to reliability. The
strategy is straightforward: check periodically that each individual service is working
correctly, and if it is not, then alert appropriate parties via e-mail and switch to a
www.knewton.com
18
SECTION 5: INFRASTRUCTURE AT SCALE
backup copy of the service. Since Knewton works in a cloud environment where
starting a service is simple and fast, it can avoid having backup copies running
constantly, and simply start them when necessary. Additionally, single services can
be spread across different data centers, with different machines handling different
availability zones. This allows a temporary service outage to be confined to a single
geographical (or logical) location.
There are some complications with this strategy. For instance, other parts of the system
must be continually made aware of which physical machine is currently handling a
specific service. The solution Knewton employs to solve this problem is called service
discovery, and involves employing a separate service responsible for maintaining a
highly available and reliable table of other services’ addresses (an example is Eureka;
Netflix 2012).
Even with a system that is as robust as possible to problems and outages from power,
network, hardware, and software problems, there is still a chance that data could be
lost. Further, there is the need to warehouse historical data in an accessible and reliable
location for new prototyping and quality assurance work. For these reasons, Knewton
also employs a data warehouse pipeline that is able to copy (anonymized) data from
backups of its databases into more permanent (and convenient) storage (Neokleous 2013).
www.knewton.com
19
SECTION 6
Conclusion
Knewton’s approach to scalability across content, as well as its emphasis on leveraging
large amounts of student data to improve outcomes, represent innovations in the field
of adaptive tutoring. The science and technology built to support these innovations
(including the Knewton knowledge graph, developments in real-time psychometrics
and inferential models, and a scalable platform infrastructure) enable adaptive
tutoring, personalized recommendations, and up-to-date predictions on student
outcomes. As the data available to Knewton increase, and as the requirements of
education continue to evolve, this approach will allow Knewton to continue to grow
both in its ability to scale across content, and its ability to develop new and useful
learning products.
www.knewton.com
20
References
Anderson, J. R. (1996). ACT: A Simple Theory of Complex Cognition. American Psychologist,
51(4):355.
Anderson, J. R., Bothell, D., Byrne, M. D., Douglass, S. A., Lebiere, C., and Qin, Y. (2004). An
Integrated Theory of the Mind. Psychological Review, 111(4):1036–1060.
Anderson, J. R., Boyle, C. F., Corbett, A. T., and Lewis, M. W. (1990). Cognitive Modeling and
Intelligent Tutoring. Artificial Intelligence, 42(1):7–49.
Baker, R. S., D’Mello, S., Rodrigo, M., and Graesser, A. (2010). Better to Be Frustrated than
Bored: The Incidence, Persistence, and Impact of Learners’ Cognitive-Affective States During
Interactions with Three Different Computer-Based Learning Environments. International Journal
of Human-Computer Studies, 68(4):223–241.
Bloom, B. S. (1984). The 2 Sigma Problem: The Search for Methods of Group Instruction as
Effective as One-to-One Tutoring. Educational Researcher, 13(6):4–16.
Carbonell, J. R. (1970). AI in CAI: An Artificial-Intelligence Approach to Computer-Assisted
Instruction. Man-Machine Systems, IEEE Transactions on, 11(4):190–202.
Corbett, A. and Anderson, J. (1995). Knowledge Tracing: Modeling the Acquisition of Procedural
Knowledge. User Modeling and User-Adapted Interaction, 4(4):253–278.
Doignon, J. P. and Falmagne, J. C. (1999). Knowledge Spaces. Springer.
Erlwanger, S. H. (1973). Benny’s Conception of Rules and Answers in IPI Mathematics. Journal of
Children’s Mathematical Behavior, 1(2):7–26.
Evens, M. and Michael, J. (2006). One-on-One Tutoring by Humans and Machines. Computer
Science Department, Illinois Institute of Technology.
Gagné, R. M. (1985). Conditions of Learning. Holt, Rinehart, and Winston, New York, 4 edition.
Gertner, A. S. and VanLehn, K. (2000). Andes: A Coached Problem Solving Environment for
Physics. In Gauthier, G., Frasson, C., and VanLehn, K., editors, Proceedings of the 5th International
Conference on Intelligent Tutoring Systems, volume 1839 of Lecture Notes in Computer Science, pages
133–142, London. Springer-Verlag.
Goldberg, D., Nichols, D., Oki, B. M., and Terry, D. (1992). Using Collaborative Filtering to Weave an
Information Tapestry. Communications of the ACM, 35(12):61–70.
Graesser, A. C., Conley, M. W., and Olney, A. (2012). Intelligent Tutoring Systems. APA Handbook of
Educational Psychology. Washington, DC: American Psychological Association.
www.knewton.com
21
REFERENCES
Graesser, A. C., Wiemer-Hastings, K., Wiemer-Hastings, P., and Kreuz, R. (1999). AutoTutor: A
Simulation of a Human Tutor. Cognitive Systems Research, 1(1):35–51.
Hwang, G.-J. (2003). A Conceptual Map Model for Developing Intelligent Tutoring Systems.
Computers & Education, 40(3):217–235.
Khajah, M. M., Lindsey, R. V., and Mozer, M. C. (2014). Maximizing Students’ Retention via Spaced
Review: Practical Guidance from Computational Models of Memory. Topics in Cognitive Science,
6(1):157–169.
Kolen, M. and Brennan, R. (2004). Test Equating, Scaling, and Linking: Methods and Practices.
Springer, 2 edition.
Lesgold, A., Lajoie, S., Bunzo, M., and Eggan, G. (1988). SHERLOCK: A Coached Practice
Environment for an Electronics Troubleshooting Job. Technical report, DTIC Document.
Lord, F. M. (1952). A Theory of Test Scores. Number 7 in Psychometric Monograph. Psychometric
Corporation.
Lord, F. M. (1956). The Measurement of Growth. Educational and Psychological Measurement,
16:421–437.
McAleese, R. (1999). Concept Mapping: A Critical Review. Innovations in Education and Training
International, 36(4):351–360.
McKinley, R. L. (1983). A Multidimensional Two-Parameter Logistical Latent Trait Model. PhD
thesis, University of Missouri–Columbia.
Neokleous, G. (2013). Cassandra and Hadoop: Introducing the KassandraMRHelper. N Choose K /
Knewton Tech Blog.
Netflix (2012). The Netflix Tech Blog: Netflix Shares Cloud Load Balancing And Failover Tool:
Eureka!
Novak, J. D. (1990). Concept Mapping: A Useful Tool for Science Education. Journal of Research in
Science Teaching, 27(10):937–949.
Nwana, H. S. (1990). Intelligent Tutoring Systems: An Overview. Artificial Intelligence Review,
4(4):251–277.
Olney, A. M., D’Mello, S., Person, N., Cade, W., Hays, P., Williams, C., Lehman, B., and Graesser,
A. (2012). Guru: A Computer Tutor that Models Expert Human Tutors. In Cerri, S. A., Clancey,
W. J., Papadourakis, G., and Panourgia, K., editors, Intelligent Tutoring Systems: 11th International
Conference, pages 256–261, London. Springer.
Papazoglou, M. P. (2003). Service-Oriented Computing: Concepts, Characteristics and Directions.
pages 3–12. IEEE.
www.knewton.com
22
REFERENCES
Rasch, G. (1961). On General Laws and the Meaning of Measurement in Psychology. Proceedings of
the Fourth Berkeley Symposium on Mathematical Statistics and Probability, pages 321–334. University
of California Press.
Reckase, M. D. (1985). The Difficulty of Test Items that Measure More than One Ability. Applied
Psychological Measurement, 9:401–412.
Reckase, M. D. (1997). The Past and Future of Multidimensional Item Response Theory. Applied
Psychological Measurement, 21(1):25–36.
Reckase, M. D. and McKinley, R. L. (1982). The Use of the General Rasch Model with
Multidimensional Item Response Data. Research Report ONR 82-1, The American College Testing
Program.
Reckase, M. D. and McKinley, R. L. (1983a). The Definition of Difficulty and Discrimination for
Multidimensional Item Response Theory Models. Technical report, Office of Naval Research.
Presented at the 67th Annual Meeting of the American Educational Research Association.
Reckase, M. D. and McKinley, R. L. (1983b). Maxlog: A Computer Program for the Estimation of
Parameters of a Multidimensional Logistic Model. Behavior Research Methods and Instrumentation,
15:389–390.
Self, J. A. (1990). Bypassing the Intractable Problem of Student Modelling. Intelligent Tutoring
Systems: At the Crossroads of Artificial Intelligence and Education, pages 107–123.
Sleeman, D. and Brown, J. S. (1982). Intelligent Tutoring Systems. Academic Press, New York.
Smith, S. G. and Sherwood, B. A. (1976). Educational Uses of the PLATO Computer System.
Science, 192(4237):344–352.
Thurstone, L. (1925). A Method of Scaling Educational and Psychological Tests. Journal of
Educational Psychology, 16:433–451.
VanLehn, K. (2011). The Relative Effectiveness of Human Tutoring, Intelligent Tutoring Systems,
and Other Tutoring Systems. Educational Psychologist, 46(4):197–221.
Wainer, H. (1983). Frederic M. Lord: A Biographical Sketch. In Wainer, H. and Messick, S., editors,
Principles of Modern Psychological Measurement: A Festschrift for Frederic M. Lord, pages xv–xvii.
Taylor and Francis.
www.knewton.com
23
The Knewton platform makes it possible for anyone to
build adaptive learning applications. Knewton can enable
personalized recommendations and predictive analytics
for new or existing products.
Interested in working with Knewton?
learn.knewton.com/entry
www.knewton.com
24


© Copyright 2026