
FORECASTS AT A GLANCE
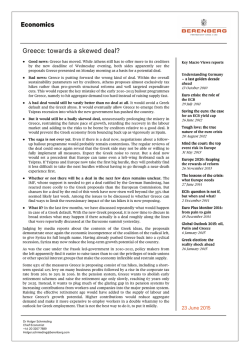
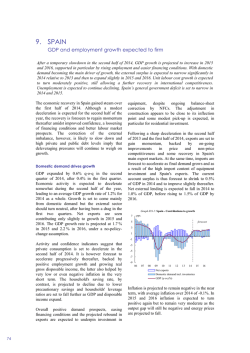
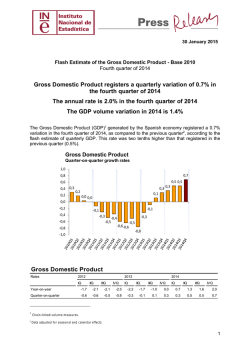
FORECASTS AT A GLANCE
30 January 2015
The boost from cheap oil
CONTENTS
•
Global: Cheap oil helps despite risk of deepening Russian crisis.
•
US: Little austerity, monetary policy gains traction; 3.3% growth.
US: Waiting for wages
2
•
China: Resilient growth slowing gradually to 6.7% in 2016.
China: Gradually slowing
3
•
Japan: Artificial stimulus has faded, future hinges on reforms.
Japan: Will Abe deliver
4
•
Eurozone: Periphery firming, core rebounding but Russia poses a risk.
UK: Strong but caution
5
•
UK: Strong growth, but mind the political risks.
Eurozone: Gradual upturn
6
Germany: Putin shock fades
7
France: Reform Laggard
8
Policy
•
Monetary policy: Fed to hike in July, BoE next year.
Italy: Politics matter
9
•
Central banks: Policy to stay supportive even after hikes begin.
Spain: Reform success
10
•
Fiscal policy: Neutral in Europe and US for 2015.
Portugal: Turnaround
11
Forecast changes
12
Berenberg versus consensus
12
Risks: Two big risks – geopolitics and crises in oil producers such as Russia.
•
Upside: Geopolitical tensions ease fast, global economy accelerates.
•
Downside: Russia gets aggressive; rout in emerging markets.
•
Inflation: Downside.
Forecast changes (see page 12 for more details): after a strong finish in 2014,
we raise out Spain GDP growth forecast for 2015.
World*
US
Japan
China
India
Latin America
Weight
2013
GDP
2014 2015
2016
2013
Inflation
2014 2015
2016
2013
100.0
22.8
6.8
12.2
2.4
7.9
2.4
2.2
1.6
7.7
5.0
2.7
2.4
2.4
0.1
7.4
5.3
1.1
2.8
3.0
1.5
6.7
6.0
1.8
1.5
0.4
2.6
9.5
6.1
1.6
2.7
2.0
8.0
6.0
1.8
0.8
2.7
7.5
5.5
7.4
4.0
4.1
2.6
3.3
0.8
7.0
5.8
1.1
0.2
0.8
1.8
7.3
5.8
Unemployment
2014 2015 2016
6.2
3.6
4.1
5.5
3.4
4.3
4.9
3.4
4.3
2013
-5.8
-9.0
-2.0
-7.2
-3.4
Fiscal balance
2014 2015 2016
-5.5
-7.8
-2.1
-6.9
-3.5
Europe
30.0
0.5
1.2
1.0
1.9
Eurozone
17.3
-0.4
0.8
1.0
1.9
1.3
0.4
-0.3
0.8
12.0 11.6
11.1
10.5
-2.9
-2.6
Germany
4.9
0.2
1.5
1.2
2.3
1.6
0.8
-0.3
1.2
5.2
5.0
4.7
4.4
0.1
0.4
France
3.7
0.4
0.3
0.6
1.4
1.0
0.6
0.0
0.7
10.3
10.2 10.2 10.1
-4.1
-4.4
Italy
2.8
-1.9
-0.4
0.2
1.1
1.3
0.2
-0.1
0.9
12.2
12.8
12.7
12.3
-2.8
-3.0
Spain
1.8
-1.3
1.5
2.2
2.2
1.5
-0.2 -1.0
0.2
26.1 24.5 22.6 20.6 -6.3
-5.7
Portugal
0.3
-1.4
0.8
1.6
2.2
0.4
-0.2 -0.2
0.9
16.4 14.1
12.7
11.7
-4.5
-4.0
Other Western Europe
UK
3.4
1.7
2.6
3.2
3.0
2.6
1.5
0.3
1.6
7.6
6.2
5.3
4.8
-5.7
-5.1
Switzerland
0.9
1.9
1.9
1.2
1.6
-0.2
0.1
-0.7
0.1
3.2
3.2
3.3
3.5
0.2
0.6
Sweden
0.8
1.6
1.7
1.7
2.5
0.0
-0.1
0.5
1.2
8.0
8.0
7.7
7.5
-1.3
-2.0
Other Europe
Russia
2.9
1.3
0.5
-4.0
-1.5
6.8
7.7
13.0
9.0
5.5
5.5
7.0
8.0
-1.3
-1.5
Turkey
1.1
4.1
3.0
3.5
3.7
7.5
9.0
7.0
6.5
9.1
9.5
9.4
9.3
-1.5
-2.3
Unemployment rate: Harmonised definition (ILO/Eurostat); fiscal balance: general government deficit in % of GDP excluding one-off bank support.
*At current exchange rates, not purchasing power parity. PPP estimates give more weight to fast-growing emerging markets and inflate global GDP.
-4.3
-6.5
-2.0
-6.5
-3.5
-4.0
-6.3
-2.0
-6.0
-3.5
-2.7
0.2
-4.5
-2.7
-4.4
-2.9
-2.3
0.2
-3.6
-2.2
-2.9
-2.0
-4.1
0.4
-0.9
-3.0
0.4
-0.3
-3.0
-2.1
-4.0
-2.0
Weights based on IMF World Global Outlook statistics 2013 estimated GDP figures.
Holger Schmieding
Chief Economist
[email protected]
+44 20 3207 7889
Christian Schulz
Senior Economist
[email protected]
+44 20 3207 7878
Robert Wood
Chief UK Economist
[email protected]
+44 20 3207 7822
1
Robert Wood
Chief UK Economist
[email protected]
+44 20 3207 7822
US: waiting for wage growth
Key drivers of forecast
•
•
•
Monetary policy gaining traction
The Fed will not spoil the recovery: Interest rates
will remain very supportive even after the Fed
starts hiking rates gradually in summer 2015.
Private sector goes from strength to strength:
Companies and households have largely repaired
their balance sheets and can spend normally again.
Waiting for wage growth: A gradual pick-up in
response to tightening labour market should give
recovery another kick.
Household debt, % disposable income, lhs
120
Debt service ratio, rhs
•
Upside chance: US consumer boom, a stronger
global recovery, cheap energy boosts real incomes.
•
Downside risks: Higher mortgage rates damage the
recovery, sharp Chinese slowdown, geopolitical
tensions lead to marked global slowdown.
15
14
110
13
100
12
90
11
80
10
70
1995
Risks: Balanced.
•
130
9
1998
2001
2004
2007
2010
2013
Debt on left-hand scale, debt service on right-hand scale. Source: Fed.
Berenberg versus consensus
GDP
Inflation
Unemployment
Inflation: No serious risk, very gradual uptick.
2015
Cons
3.2
0.9
5.4
Ber
3.3
0.2
5.5
Gap
0.1
-0.7
0.1
Ber
3.0
1.8
4.9
2016
Cons
2.8
2.2
5.1
Gap
0.2
-0.4
-0.2
Bloomberg consensus, taken 30 January 2015.
GDP
Private Consumption
Government Consumption
2013
% y/y
2.2
% q/q
%q/q ann.
% y/y
2.4
% q/q
% y/y
-2.0
% q/q
Residential Investment
% y/y
% q/q
Non-Residential Investment % y/y
% q/q
% y/y
Final Dom Demand 1
% q/q
1
% y/y
Net Exports
Stockbuilding 1
Current Account Balance
Industrial Production 2
Unemployment Rate 2
CPI 2
General Govt. Balance 3
General Govt. Debt
Fed Funds Rate 4
Contribution to GDP growth
1
2014
2.4
2015
3.3
2016 1Q14 2Q14 3Q14 4Q14 1Q15 2Q15 3Q15 4Q15 1Q16 2Q16 3Q16 4Q16
1.9
2.6
2.7
2.5
3.7
3.4 2.9
3.0 3.0 3.0 2.9
2.9
3.0
-0.5
1.1
1.2
0.7
0.7
0.8
0.8
0.7
0.7
0.7
0.7
0.7
-2.1
4.6
5.0 2.6
2.8
3.2
3.1
3.0 2.9
2.9
2.9
2.9
2.2
2.4
2.7
2.8
3.2
3.3
3.1
2.7
2.7
2.6
2.6
2.6
2.6
0.3
0.6
0.8
1.0
0.7
0.7
0.7
0.7
0.7
0.7
0.7
0.7
-1.1 -0.7 0.3
0.7
1.2
0.9
0.1
0.9
1.0
1.1
1.2
1.2
1.1
-0.2 0.4
1.1
-0.5 0.2
0.2
0.2
0.3
0.3
0.3
0.3
0.3
2.5
3.1
-0.2
0.8
11.9
1.6
6.9
8.2
3.0
6.1
6.6
6.3
2.0
2.5
3.3
3.1
-0.2
-0.2
-0.1
0.1
0.2
0.0
-410
-2.4
4.3
-458
-2.6
4.0
-477
-2.6
2.9
3.5
-1.3
4.7
0.4
2.0
0.2
-0.1
1.2
2.1
6.8
2.3
2.4
0.9
-0.1
-0.7
0.8
7.6
2.2
2.8
1.0
0.0
2.6
1.0
5.5
0.5
2.8
0.7
-0.5
6.1
2.0
6.6
1.5
3.5
0.8
-0.2
5.9
2.0
6.3
2.0
3.4
0.8
-0.2
7.2
2.0
6.1
2.0
3.2
0.8
-0.4
8.2
2.0
7.4
1.8
3.3
0.8
-0.2
8.2
2.0
7.4
1.5
3.3
0.8
-0.2
8.2
2.0
6.7
1.3
3.1
0.7
-0.1
8.2
2.0
5.9
1.3
3.1
0.7
-0.1
8.2
2.0
5.4
1.3
3.0
0.7
-0.1
-0.4
0.0
-0.3
-102
-0.1
0.3
0.3
-98
0.2
-0.1
0.0
-100
-0.2
0.2
0.2
-110
-0.1
0.5
0.0
-112
0.0
0.1
0.0
-114
0.0
0.2
0.0
-115
0.0
-0.1
0.0
-117
0.0
0.0
0.0
-118
0.0
0.0
0.0
-119
0.0
0.0
0.0
-120
0.0
0.0
0.0
-120
3.3
1.0
4.2
1.4
4.6
1.0
4.9
1.4
4.8
0.9
4.2
0.8
3.9
0.8
3.2
0.8
3.0
0.8
3.0
0.7
2.8
0.6
2.7
0.6
6.6
1.4
6.2
2.1
6.1
1.8
5.8
1.2
5.7
0.3
5.5
-0.2
5.4
0.0
5.2
0.6
5.1
1.4
5.0
1.8
4.9
1.9
4.8
1.9
%
0.25 0.25 0.75 2.00 0.25 0.25 0.25 0.25 0.25 0.25 0.50 0.75
Period averages 3 General government overall balance, IMF Fiscal monitor 4 End of period
1.00
1.25
1.50
2.00
0.2
% q/q
% y/y
0.0
% q/q
USD bn
-400
% of GDP -2.4
% y/y
2.9
% q/q
%
7.4
6.2
5.5
4.9
% y/y
1.5
1.6
0.2
1.8
% of GDP -5.8 -5.5
-4.3
-4.0
% of GDP 104.2 105.6 106.4 105.6
2
2
Christian Schulz
Senior Economist
[email protected]
+44 20 3207 7878
China: gradually slowing
Key drivers of forecast
Controlled slowdown
•
Gradual growth slowdown as China matures, but no
major fluctuations around that trend.
20
•
Authorities have all policy levers: High private
savings, low inflation and huge forex reserves. China
may hit problems, but it can contain them.
15
The ride may get bumpy at times: But China has
plenty of catch-up left. Growth should gradually
trend down but remain strong.
10
•
Real retail sales, yoy %
Risks: Downside for growth and inflation.
•
Upside chance: Strong global recovery boosts
exports. Cheap energy boosts consumer real incomes
and company profits.
5
2000 2002 2004 2006 2008
2010
2012
2014
Three-month moving average. Source: National Bureau of Statistics.
Berenberg versus consensus
•
•
Downside risks: US, EU stumble, domestic policy
mistakes.
Inflation: No serious upside risk.
GDP
Inflation
Unemployment
Ber
7.0
1.8
4.3
2015
Cons
7.0
1.9
4.1
Fiscal balance
-2.0
-2.4
Gap
0.0
-0.1
0.2
0.4
Ber
6.7
2.7
4.3
2016
Cons
6.8
2.5
4.1
-2.0
-2.5
Gap
-0.1
0.2
0.2
0.5
Bloomberg consensus, taken 30 January 2015.
GDP
2013 2014 2015 2016 1Q14 2Q14 3Q14 4Q14 1Q15 2Q15 3Q15 4Q15 1Q16 2Q16 3Q16 4Q16
% y/y
7.4
7.0
6.7
7.4
7.5
7.3
7.3
7.3
7.0
6.8
6.8
6.8
6.7
6.6
6.7
7.7
% q/q
1.5
2.0
1.9
1.5
1.5
1.7
1.7
1.5
1.5
1.6
1.6
1.6
%q/q ann.
6.1
8.2
7.8
6.1
6.1
7.0
7.0
6.1
6.1
6.6
6.6
6.6
Industrial Production
% y/y
9.5
8.3
7.8
7.6
8.8
8.9
8.0
7.6
7.6
7.8
7.8
7.8
7.7
7.7
7.6
7.6
Exports 1
% y/y
7.8
6.0
7.0
7.0
-3.5
4.9
12.9
8.5
7.0
7.0
7.0
7.0
7.0
7.0
7.0
7.0
Imports 1
% y/y
7.3
0.7
5.0
6.5
2.0
1.3
1.2
-1.6
0.4
6.5
6.5
6.5
6.5
6.5
6.5
6.5
Current Account Balance
$ bn
183
% of GDP 0.8
%
4.1
% y/y
2.6
% of GDP -2.0
217
0.9
263
1.0
292
1.0
7.0
73.4
72.2
64.8
18.5
84.9
83.6
76.2
25.7
92.1
90.9
83.5
4.1
2.0
-2.1
4.3
1.8
-2.0
4.3
2.7
-2.0
4.1
2.3
4.1
2.2
4.1
2.0
4.1
1.5
4.2
1.5
4.2
1.7
4.3
1.8
4.3
2.2
4.3
2.6
4.3
2.6
4.3
2.7
4.3
2.7
Unemployment Rate
CPI 2
General Govt. Balance
% of GDP 22.9 20.9 19.3 17.7
General Govt. Debt
1
Growth rates based on monthly value data in USD 2 Period averages
3
Christian Schulz
Senior Economist
[email protected]
+44 20 3207 7878
Japan: will Abe finally deliver?
Key drivers of forecast
Abenomics momentum fading
Big monetary stimulus: Massive asset purchases and
public investment boosted demand in 2013. But the
effect was temporary. Disappointing GDP for 2014
shows the sugar rush has faded.
•
20
2011
2013
0
Lack of reform: Japan needs serious pro-growth
reforms. Abe has made proposals, but a more
dramatic shake-up will be needed.
•
Outlook
10
Confidence still strong: Q3 GDP contraction at odds
with confidence (see chart). Growth should resume,
but not strongly.
•
Tankan index
-10
-20
2010
Risks: To the downside.
•
Upside chance: Having won a fresh mandate, Abe
delivers big reforms. Cheap oil will boost consumer
purchasing power and lower cost of energy imports.
•
Downside risks: Monetary sugar rush wears off, a
huge budget deficit looms and the yen collapses as
Japanese investors dump JGBs. Unlikely for now.
Inflation: BoJ policy boosts inflation expectations.
But weak demand and cheap oil keep inflation low.
•
2012
2014
Large manufacturing enterprises. Source: Bank of Japan.
Berenberg versus consensus
GDP
Inflation
Ber
0.8
0.8
2015
Cons
1.0
1.4
Gap
-0.2
-0.6
Ber
1.5
0.8
2016
Cons
1.4
1.5
Gap
0.1
-0.7
Unemployment
Fiscal balance
3.4
-6.5
3.5
-6.8
-0.1
0.3
3.4
-6.3
3.4
-6.4
0.0
0.0
Bloomberg consensus, taken 30 January 2015.
GDP
Private Consumption
Government Consumption
% y/y
% q/q
%q/q ann.
% y/y
% q/q
% y/y
% q/q
% y/y
2013 2014 2015 2016 1Q14 2Q14 3Q14 4Q14 1Q15 2Q15 3Q15 4Q15 1Q16 2Q16 3Q16 4Q16
0.1
0.8
1.5
2.2 -0.3 -1.2 -0.1
-1.2
1.0
1.9
1.6
1.7
1.5
1.4
1.3
1.6
1.4
-1.7 -0.5
0.7
0.4
0.5
0.4
0.4
0.4
0.3
0.3
0.3
5.8
-6.7 -1.9
2.7
1.5
1.8
1.6
1.6
1.6
1.3
1.3
1.3
3.1
-2.7 -2.7 -2.2 -3.9
1.5
1.6
1.5
1.5
1.3
1.1
1.0
2.0
-1.1
0.1
1.2
1.9
0.3
0.6
0.4
1.9
2.8
0.3
2.4
7.9
3.3
3.7
2.8
2.2
0.0
0.4
1.3
-0.2
0.2
0.4
0.2
% y/y
% q/q
JPY trn
% of GDP
-0.4
-0.1
0.0
0.0
3.2
0.7
3.0
0.6
4.2
0.8
% y/y
% q/q
%
% y/y
-0.6
1.8
0.3
2.1
0.4
2.4
4.0
0.4
3.6
2.7
3.4
0.8
3.4
0.8
General Govt. Debt
% of GDP
% of GDP
-9.0
243
-7.8
244
-6.5
246
-6.3
248
1
2
Private Investment
Public Investment
Final Domestic Demand 1
Net Exports1
Stockbuilding1
Current Account Balance
Industrial Production 2
Unemployment Rate 2
CPI 2
General Govt. Balance
Contribution to GDP growth
% q/q
% y/y
% q/q
% y/y
% q/q
% y/y
% q/q
2.1
0.4
-0.4
10.6
-4.9
0.0
0.3
1.9
0.2
0.4
0.3
-0.7
0.5
0.4
0.1
-0.4
0.3
0.8
0.1
-5.1
0.5
0.6
0.1
1.2
0.4
0.4
0.1
3.2
0.4
0.4
0.1
2.3
0.4
0.4
0.1
2.4
0.2
0.4
0.1
2.4
0.2
0.4
0.1
2.4
0.2
0.4
0.1
2.4
5.5
7.2
-2.7
-5.6
4.9
0.9
-1.4
1.1
1.4
1.5
0.5
1.0
0.5
4.3
1.0
0.6
4.1
0.7
0.6
3.4
0.7
0.6
3.1
0.7
0.6
2.8
0.7
0.6
2.8
0.7
0.6
2.8
0.7
0.6
2.8
0.7
3.9
2.0
-0.6
0.1
-1.1
-3.8
0.0
0.8
-1.6
0.0
0.5
0.1
-1.3
0.6
1.0
0.1
-2.9
0.3
1.0
0.1
1.3
0.4
0.3
0.0
1.7
0.4
0.2
0.0
1.4
0.4
0.2
0.0
1.5
0.4
0.2
0.0
1.3
0.3
0.2
0.0
1.2
0.3
0.2
0.0
1.2
0.3
0.2
0.0
-1.1
-0.6
-0.8
0.7
1.3
0.4
0.0
-0.6
1.6
0.1
0.0
0.6
0.7
0.0
-0.5
-0.6
0.0
0.7
0.0
0.0
1.9
0.0
0.0
0.9
0.0
0.0
-0.2
0.0
0.0
1.0
0.0
0.0
2.2
0.0
0.0
1.2
8.4
3.0
3.6
1.5
2.6
-3.8
3.6
3.6
-1.0
-1.9
3.6
3.3
-1.4
1.4
3.5
2.5
-4.0
0.4
3.4
2.4
0.4
0.6
3.4
0.4
3.0
0.6
3.4
0.2
2.2
0.6
3.4
0.3
2.4
0.6
3.4
0.9
2.4
0.6
3.4
0.8
2.4
0.6
3.4
0.8
2.4
0.6
3.4
0.8
Period averages
4
Robert Wood
Chief UK Economist
[email protected]
+44 20 3207 7822
UK: strong, but near-term caution
Key drivers of forecast
Lost some steam, but hardly at a standstill
•
Gentle
slowing:
Geopolitical
tensions
manufacturing in 2014 H2, slowing growth.
•
Here comes oil: Risks to the downside in the near
term, but oil price fall will boost real incomes and
put fizz back into the recovery this year.
hit
1.5
1.0
0.5
0.0
Policy supportive: We look for the BoE to start
hiking rates in February 2016, but that will proceed
only gradually.
•
-0.5
-1.0
-1.5
Inflation: Heading down close to 0% in the near
term. Sharp fall due to petrol, but weak underlying
pressures will keep inflation low in 2016.
•
-2.0
2000
2003
2006
2009
2012
Average of PMI, BCC and EC surveys mean-variance adjusted to first
estimate of GDP growth. Source: BCC, EC, Markit, ONS, Berenberg.
Risks: Balanced.
•
Upside chance: Strong investment cycle.
•
Downside risks: Consumers retrench again, in
response to rate hike expectations. World growth.
Berenberg versus consensus
Ber
3.2
0.3
5.3
-4.1
GDP
Inflation
Unemployment
Fiscal balance
Politics: Uncertainty about general election May 2015
and potential Brexit significant.
•
Average of business
surveys
GDP growth, % qoq,
first estimate
2015
Cons
2.6
0.9
5.6
-4.2
Gap
0.6
-0.6
-0.3
0.1
Ber
3.0
1.6
4.8
-3.0
2016
Cons
2.4
1.9
5.4
-3.3
Gap
0.6
-0.3
-0.6
0.3
Bloomberg consensus, taken 30 January 2015.
GDP
% y/y
% q/q
%q/q ann.
Private Consumption
Government Consumption
% q/q
% y/y
% q/q
Investment
Final Domestic Demand 1
Net Exports 1
Stockbuilding 1
Current Account Balance
Industrial Production 2
Unemployment Rate 2
CPI 2
General Govt. Balance 3
General Govt Debt
% y/y
% q/q
% y/y
3
BoE Bank Rate 4
1
Contribution to GDP growth
% y/y
% q/q
% y/y
2013 2014 2015 2016 1Q14 2Q14 3Q14 4Q14 1Q15 2Q15 3Q15
2.6
3.2
3.0
2.4
2.6
2.6
2.7
3.0
3.1
3.2
1.7
0.6
0.8
0.7
0.5
0.8
0.9
0.8
2.5
3.3
3.0
2.2
3.4
3.8
3.3
1.7
2.3
3.5
3.0
-0.3
1.0
-0.6
-0.4
3.4
7.4
6.6
8.0
1.5
2.9
3.2
3.2
4Q15
3.3
0.7
2.8
1Q16 2Q16 3Q16 4Q16
3.2
3.0
2.9
3.0
0.7
0.7
0.7
0.7
2.9
2.9
3.0
3.0
1.9
0.6
0.0
2.0
0.6
2.1
2.5
1.0
1.9
2.9
0.8
0.1
3.3
0.9
-0.2
3.7
0.9
-1.2
3.5
0.8
-1.4
3.5
0.7
0.3
3.2
0.7
0.2
3.0
0.7
-0.5
2.9
0.7
-0.6
2.8
0.7
-0.7
0.2
7.9
2.2
1.4
9.1
1.6
0.3
6.8
0.6
-1.8
5.9
1.4
-0.1
5.7
1.9
0.4
5.9
1.8
0.1
7.2
1.9
-0.1
7.8
1.9
-0.1
7.9
2.1
-0.2
8.0
1.9
-0.1
8.1
1.9
-0.2
8.1
1.9
2.4
0.8
-1.4
3.2
0.9
-1.3
3.0
0.8
0.2
2.8
0.4
0.3
3.0
0.9
0.1
3.0
1.0
-0.2
3.2
0.9
-0.1
3.6
0.8
-0.3
3.4
0.8
-0.3
3.2
0.7
-0.2
3.1
0.8
-0.2
3.1
0.8
-0.2
0.0
-0.6
-0.1
-0.2
% q/q
% y/y
% q/q
0.3
0.3
0.0
0.0
0.0
1.4
-0.3
0.3
0.6
-0.4
-0.2
-0.3
0.3
0.1
-0.4
-0.1
-0.1
-0.2
0.0
-0.1
0.2
0.0
-0.1
-0.1
0.0
-0.1
0.0
0.0
-0.1
0.0
0.0
0.0
0.0
0.0
0.0
0.0
0.0
0.0
0.0
0.0
GBP bn
% of GDP
% y/y
-77
-4.5
-0.6
-99
-5.6
1.6
-90
-4.9
1.7
-70
-3.6
2.4
-22
-5.1
2.3
-24
-5.5
1.8
-27
-6.0
1.2
-26
-5.7
1.0
-24
-5.3
0.8
-23
-5.0
1.3
-22
-4.8
2.0
-21
-4.4
2.8
-19
-4.0
2.9
-18
-3.7
2.7
-17
-3.5
2.2
-16
-3.3
1.8
% q/q
%
% y/y
7.6
2.6
6.2
1.5
5.3
0.3
4.8
1.6
0.4
6.8
1.8
0.2
6.3
1.7
0.2
6.0
1.4
0.1
5.8
0.9
0.3
5.6
0.1
0.7
5.4
0.1
0.9
5.2
0.3
0.8
5.1
0.6
0.5
4.9
1.5
0.5
4.8
1.6
0.5
4.7
1.6
0.4
4.7
1.8
% of GDP
% of GDP
-5.7
87.3
-5.1 -4.1
88.4 90.0
-3.0
89.9
0.50 0.50 0.50
1.50
0.50
0.50
0.50
0.50
0.50
0.50
0.50
0.50
0.75
1.00
1.25
1.50
2
3
4
Period averages Maastricht basis End period
5
Holger Schmieding
Chief Economist
[email protected]
+44 20 3207 7878
Eurozone: Putin shock fading
Key drivers of forecast
Signs of stabilisation? Confidence stays above average
Upswing to resume in the core: Putin’s war had
weighed on business confidence and investment in
core Europe since May 2014. The effect is fading.
Core on course to rebound in early 2015.
•
•
Peripheral reform countries reap rewards of their
painful efforts with gains in GDP and employment.
•
Cheaper oil provides a big boost over time.
•
ECB: QE will boost growth.
•
Austerity over: No net fiscal drag in 2015.
•
Fragmentation easing very slowly: Firms’ borrowing
costs diverge as the credit crunch holds back recovery
in parts of the periphery.
3.0
100
1.5
0.0
90
-1.5
Economic sentiment, lhs
80
-3.0
GDP yoy in %, rhs
Inflation: Cheap oil pushes inflation sub-zero, stillhigh unemployment keeps core inflation subdued.
•
4.5
110
Risks: Tilted to the downside in the near term.
•
Upside chance: Geopolitical risks fade fast, bank
stress test ends financial fragmentation quickly.
•
Downside risks: new Russian war or Russian crisis?
70
1995
-4.5
1998
2001
2004 2007
2010
2013
Economic sentiment and yoy change in GDP. Source: European
Commission; Eurostat
Berenberg versus consensus
Ber
1.0
-0.3
11.1
-2.7
GDP
Inflation
Unemployment
Fiscal balance
2015
Cons
1.1
0.2
11.3
-2.4
Gap
-0.1
-0.5
-0.2
-0.3
Ber
1.9
0.8
10.5
-2.3
2016
Cons
1.6
1.2
11.1
-2.2
Gap
0.3
-0.4
-0.5
-0.1
Bloomberg consensus, taken 30 January 2015.
GDP
Private Consumption
Government Consumption
Investment
Final Domestic Demand 1
Net Exports 1
Stockbuilding 1
Current Account Balance
Industrial Production 2
Unemployment rate 2
CPI 2
General Govt. Balance
2013 2014 2015 2016 1Q14 2Q14
% y/y
1.0
1.9
1.1
0.8
-0.4 0.8
% q/q
0.3
0.1
%q/q ann.
1.3
0.3
% y/y
-0.6 0.8
0.9
1.2
0.5
0.7
% q/q
0.2
0.3
% y/y
0.9 0.9
1.4
0.8
0.9
0.2
% q/q
0.1
0.3
% y/y
0.7
3.3
2.2
0.9
-2.4 0.5
% q/q
0.3
-0.7
% y/y
0.8
1.6
0.9
0.8
-0.8 0.7
% q/q
0.2
0.1
% y/y
0.2
0.3
0.2
0.1
0.4 0.2
% q/q
0.0
0.1
% y/y
0.0
-0.1 -0.1 -0.2 -0.2 0.0
% q/q
0.1
-0.1
EUR bn
64
230 255 266 266 65
% of GDP 2.4
2.6
2.7
2.6
% y/y
1.5
0.8
-0.7 0.6 0.6 2.0
% q/q
0.2
0.0
12.0 11.6
0.4
1.3
-2.9 -2.6
90.9 93.0
11.1
-0.3
-2.7
94.1
0.5
1.1
0.3
0.0
0.1
0.9
0.2
-1.0
0.1
1.0
0.2
-1.1
0.2
0.9
0.2
0.1
0.3
0.9
0.3
1.2
0.3
1.0
0.3
2.4
0.3
1.2
0.4
2.9
0.3
1.4
0.4
3.3
0.3
1.5
0.4
3.4
0.3
1.6
0.4
3.5
-0.3
0.8
0.3
0.4
-0.4
0.5
0.0
0.2
0.3
0.5
0.2
0.2
0.5
0.7
0.3
0.2
0.8
0.8
0.4
0.3
0.8
1.2
0.4
0.3
0.8
1.5
0.4
0.3
0.9
1.6
0.4
0.3
0.9
1.7
0.4
0.3
0.9
1.7
0.4
0.3
0.0
-0.4
-0.1
66
0.1
-0.1
0.0
61
0.1
-0.3
0.0
68
0.1
-0.2
0.0
67
0.1
0.0
0.0
69
0.1
0.0
0.0
63
0.1
0.1
0.0
68
0.1
0.1
0.0
67
0.1
0.1
0.0
69
0.1
0.1
0.0
63
0.4
-0.5
-0.2
0.0
-0.4
0.1
0.1
0.4
1.0
0.5
1.5
0.5
2.0
0.5
2.1
0.5
2.1
0.5
2.1
0.5
10.5
0.8
-2.3
93.7
11.8
0.7
11.6
0.6
11.5
0.4
11.5
0.2
11.4
-0.6
11.2
-0.4
11.1
-0.2
10.9
0.2
10.7
0.8
10.6
0.8
10.4
0.8
10.3
0.9
0.25 0.05 0.05 0.05
ECB main refinancing rate 3 %
Contribution to GDP growth 2 Period averages 3 End of period
0.25
0.15
0.05
0.05
0.05
0.05
0.05
0.05
0.05
0.05
0.05
0.05
General Govt. Debt
%
% y/y
% of GDP
% of GDP
3Q14 4Q14 1Q15 2Q15 3Q15 4Q15 1Q16 2Q16 3Q16 4Q16
0.8
0.6
0.5
0.8
1.1
1.5
1.8
2.0
2.0
2.0
0.2
0.1
0.2
0.4
0.5
0.5
0.5
0.5
0.5
0.5
0.6
0.3
0.7
1.5
1.9
1.9
1.9
2.1
2.1
2.1
1.0
1.0
0.9
0.9
0.7
0.9
1.1
1.2
1.2
1.2
1
6
Holger Schmieding
Chief Economist
[email protected]
+44 20 3207 7878
Germany: solid underlying trend, Putin growth pause over
Key drivers of forecast
•
•
Rough patch about to end
Geopolitical risks interrupted upswing: Putin’s war
against Ukraine hit confidence and investment from
spring 2014. In late 2014, confidence started
stabilising, pointing to renewed growth early in 2015.
2
Positive fundamentals: A strong competitive
position, extremely low funding costs and pent-up
demand boost business investment as tensions ease.
0
•
Consumer confidence rising from high level: Strong
employment, rising wages and low inflation support
consumption growth.
•
Neutral
net
trade:
Global
demand
and
competitiveness support exports, but domestic
demand raises imports even slightly more. Shortterm boost from lower euro possible.
1
-1
Ifo expectations
ZEW investor expectations
GfK consumer confidence
-2
-3
Jan 2012 Jul 2012 Jan 2013 Jul 2013 Jan 2014 Jul 2014 Jan 2015
Ifo expectations, ZEW expectations, GfK consumer confidence, in
standard-deviations from the mean. Sources: Ifo, ZEW, GfK
Berenberg versus consensus
•
Inflation: Normal wage growth leads inflation
towards the higher end of the Eurozone range.
Ber
1.2
-0.3
4.7
0.2
2015
Cons
1.3
0.5
n/a
0.1
Gap
-0.1
-0.8
n/a
0.1
•
Upside: A stronger response to extremely low
borrowing costs. Cheap oil, undervalued euro.
GDP
Inflation
Unemployment
Fiscal balance
•
Downside: new Russian war or Russian crisis.
Bloomberg consensus, taken 30 January 2015.
Risks: No longer tilted to downside in the near term.
GDP 1
Ber
2.3
1.2
4.4
0.2
2016
Cons
1.7
1.6
n/a
0.2
Gap
0.6
-0.4
n/a
0.0
2013 2014 2015 2016 1Q14 2Q14 3Q14 4Q14 1Q15 2Q15 3Q15 4Q15 1Q16 2Q16 3Q16 4Q16
0.2
1.5
1.2
2.3
2.3
1.4
1.2
1.0
0.4
0.9
1.5
1.8
2.2
2.4
2.3
2.2
% q/q
0.8
-0.1
0.1
0.3
0.1
0.4
0.6
0.6
0.6
0.6
0.6 0.5
%q/q ann.
3.1 -0.3 0.3
1.1
0.6
1.7
2.5
2.5
2.3
2.2
2.2
2.2
% y/y
Private Consumption
% y/y
Government Consumption
% q/q
% y/y
0.9
1.2
0.7
1.2
Investment
% q/q
% y/y
-0.4
1.6
1.7
1.1
0.6
1.1
1.9
1.6
1.8
1.5
1.4
1.6
1.7
1.7
1.8
1.4
1.5
0.5
0.7
0.1
1.2
0.7
1.2
0.5
1.6
0.3
1.7
0.3
1.5
0.4
1.2
0.4
1.2
0.4
1.3
0.4
1.4
0.4
1.5
0.4
1.6
2.8
0.5
5.1
0.2
7.3
0.4
2.9
0.6
1.2
0.3
-0.2
0.3
-2.8
0.3
-0.3
0.3
1.9
0.3
3.4
0.4
4.7
0.4
5.3
0.4
5.3
0.4
5.3
2.8
-1.8
-0.9
-0.2
0.1
0.7
1.3
1.3
1.3
1.3
1.3
1.3
Final Domestic Demand 2
% q/q
% y/y
% q/q
0.6
1.4
1.3
2.2
2.2
0.9
1.1
-0.2
1.1
0.3
1.3
0.3
0.6
0.2
1.3
0.4
1.5
0.5
1.7
0.5
2.1
0.6
2.3
0.6
2.3
0.6
2.4
0.6
Net Exports 2
% y/y
% q/q
-0.5
0.4
0.0
-0.4
0.2
-0.1
0.2
0.1
0.8
0.2
0.3
0.0
0.2
-0.1
0.1
0.0
-0.2
0.0
-0.2
0.0
-0.2
-0.1
-0.3
-0.1
-0.4
-0.1
-0.5
-0.1
% y/y
0.1
-0.3
-0.2
0.4
Stockbuilding 2
Current Account Balance
% q/q
EUR bn
% of GDP
190
6.7
214
7.4
202
6.7
190
6.1
-0.1
0.1
-0.7
-0.5
-0.4
-0.4
0.2
0.3
0.4
0.4
0.4
0.4
-0.1
52
0.1
51
-0.5
59
0.0
53
0.0
49
0.1
48
0.1
56
0.1
50
0.1
46
0.1
45
0.1
53
0.1
47
Industrial Production 3
% y/y
% q/q
0.1
1.2
1.1
2.4
3.1
0.6
1.2
-0.6
0.5
-0.2
0.2
0.4
-0.2
0.2
1.0
0.6
1.8
0.6
2.0
0.6
2.4
0.6
2.4
0.6
2.4
0.6
2.4
0.6
Unemployment Rate 4
4.7
-0.3
0.2
4.4
1.2
5.1
1.0
5.0
0.9
5.0
0.8
4.9
0.4
4.8
-0.6
4.7
-0.5
4.7
-0.3
4.6
0.1
4.5
1.2
4.4
1.2
4.4
1.3
4.3
1.3
CPI 5
General Govt. Balance
%
% y/y
5.2
1.6
5.0
0.8
% of GDP
General Govt. Debt
% of GDP
0.1
76.9
0.4
74.5
1
5
Calendar-adjusted 2 Contribution to GDP growth
EU-harmonised, period averages
3
72.5
0.2
70.3
Ex construction, s.a., period averages
4
ILO measure, period averages, s.a.
7
Christian Schulz
Senior Economist
[email protected]
+44 20 3207 7878
France: Europe’s reform laggard
Key drivers of forecast
Who is competitive, who is not?
Modest reforms: President Hollande has thrown his
weight behind the reformers. The left-wingers have
been sidelined. But the reforms planned so far are
too timid and leave out the crucial labour market.
•
•
France continues to lag behind: Lack of labour
market flexibility prevents stronger recovery.
•
Inflation: Very low.
160
Spain
150
France
140
130
120
110
Risks: Tilted to downside for growth and inflation.
100
Upside: More reforms could restore business
sentiment and thus investment. France is more
insulated than others from Ukraine impact. Cheap
oil.
•
Downside: Left-wingers within the ruling Socialist
Party could block reform efforts in parliament. Street
protests could bring down the government and
trigger new elections. The far-right Front National is
very strong in the polls.
•
90
2001
2003
2005
2007
2009
2011
2013
France, Spain real exports, 2005 = 100. Source: Eurostat.
Berenberg versus consensus
Ber
0.6
0.0
10.2
-4.5
GDP
Inflation
Unemployment
Fiscal balance
2015
Cons
0.8
0.3
10.4
-4.3
Gap
-0.2
-0.3
-0.2
-0.2
Ber
1.4
0.7
10.1
-3.6
2016
Cons
1.4
1.2
10.2
-3.9
Gap
0.0
-0.5
-0.1
0.3
Bloomberg consensus, taken 30 January 2015.
GDP
Private Consumption
Government Consumption
Investment
Final Domestic Demand 1
Net Exports 1
Stockbuilding 1
Current Account Balance
% y/y
% q/q
%q/q ann.
% y/y
% q/q
% y/y
% q/q
% y/y
% q/q
% y/y
% q/q
% y/y
% q/q
% y/y
% q/q
EUR bn
2013 2014 2015 2016 1Q14 2Q14 3Q14 4Q14 1Q15 2Q15 3Q15 4Q15 1Q16 2Q16 3Q16 4Q16
0.3
0.6
1.4
0.8
0.0
0.4
0.0
0.1
0.5
0.6
1.1
1.4
1.4
1.4
1.3
0.4
0.0 -0.1
0.3
-0.2 0.1
0.3
0.3
0.4
0.4
0.3
0.3
0.3
0.3
0.3
0.7
1.2
2.0
2.0
0.8
0.4
-0.8
-1.7
-0.8
1.3
0.5
0.3
0.4
1.0
0.1
-0.3
-0.1
0.2
-0.2
0.3
0.2
0.1
-28
-1.3
-0.8
-25
-1.2
0.0
-20
-0.9
0.6
-15
-0.7
1.9
10.1
0.7
-3.6
Industrial Production 2
% of GDP
% y/y
% q/q
Unemployment Rate 2
CPI 2
General Govt. Balance
%
% y/y
% of GDP
10.3
1.0
-4.1
10.2
0.6
-4.4
10.2
0.0
-4.5
General Govt. Debt
% of GDP
92.2
96.0
99.0 100.7
1
2
Contribution to GDP growth
0.0
0.2
-0.4
-0.4
0.3
0.3
1.0
0.6
0.2
-0.6
0.1
-0.1
0.5
0.6
0.1
1.1
0.5
0.3
1.4
0.7
0.4
1.5
1.1
0.4
1.5
1.4
0.3
1.2
1.3
0.2
1.2
1.2
0.2
1.2
1.0
0.2
2.1
0.4
-0.4
1.8
0.5
-1.6
2.3
0.8
-2.2
1.8
0.1
-2.5
1.5
0.1
-2.0
1.1
0.1
-1.1
0.4
0.1
-0.3
0.4
0.1
0.4
0.4
0.1
0.9
0.4
0.1
1.3
0.4
0.1
1.5
0.4
0.1
1.5
-0.7
0.5
-0.3
-0.8
0.2
0.1
-0.8
0.4
0.2
-0.3
-0.1
-0.1
-0.2
0.3
0.0
0.0
0.3
0.2
0.2
0.4
0.3
0.4
0.8
0.3
0.4
1.0
0.3
0.4
1.1
0.2
0.4
1.0
0.2
0.4
1.0
0.2
-0.1
-0.1
0.4
-0.5
-0.1
0.3
-0.2
-0.2
0.0
-0.4
-0.1
0.4
-0.3
0.0
0.0
-0.2
0.0
0.1
0.1
0.0
0.1
0.2
0.0
0.1
0.2
0.0
0.1
0.2
0.0
0.1
0.2
0.1
0.1
0.2
0.1
0.1
0.4
-4.9
0.0
-12.8
0.0
-7.1
0.0
-0.6
0.0
-3.6
0.0
-5.1
0.0
-11.6
0.0
0.1
0.0
-1.7
0.0
-1.6
0.0
-9.7
0.0
-2.3
1.8
0.4
-1.1
-1.3
0.0
0.2
-0.8
-0.2
-1.0
0.3
0.8
0.5
1.0
0.5
1.7
0.5
1.9
0.5
1.9
0.5
1.9
0.5
1.9
0.5
10.1
0.9
10.1
0.8
10.3
0.5
10.3
0.3
10.3
-0.1
10.2
0.0
10.2
0.0
10.1
0.2
10.0
0.6
10.0
0.7
9.9
0.7
9.9
0.8
Period averages
8
Christian Schulz
Senior Economist
[email protected]
+44 20 3207 7878
Italy: political opportunities and risks
Key drivers of forecast
Trouble at home, relief abroad
Financial stability: The ECB’s rescue shield cut
Italy’s borrowing costs. Domestic demand fell in
2013, but declines eased in 2014.
•
•
Less austerity: The end of major tax hikes removed
that drag on growth in 2014. But planned 2015 tax
cuts partly shelved to fulfil EU fiscal rules.
•
Politics key: Prime Minister Renzi’s reform agenda is
an opportunity to break Italy’s weak growth trend.
His popularity should help him to implement
change. Serious labour market reform on track.
Businesses waiting: Renzi’s reform agenda supports
confidence, but actual investment is lagging behind.
Renzi needs to deliver.
•
Foreign orders
130
Domestic orders
120
110
100
90
80
2000 2002 2004 2006 2008 2010
Risks: Tilted to the downside for growth.
Ber
0.2
-0.1
12.7
-2.7
2015
Cons
0.4
0.1
12.8
-2.8
Gap
-0.2
-0.2
-0.1
0.1
•
Upside: Serious structural reforms boost potential
growth; the credit crunch eases early. The EU could
grant some fiscal flexibility. Cheap oil.
GDP
Inflation
Unemployment
Fiscal balance
•
Downside: Russian crisis, Greek crisis contagion.
Bloomberg consensus, taken 30 January 2015.
GDP
% y/y
% q/q
Private Consumption
2012
2014
2016
Cons
1.0
0.9
12.6
-2.4
Gap
0.1
0.0
-0.3
0.2
Industrial orders, Italy, 2005 = 100. Source: Istat.
Berenberg versus consensus
Inflation: Very low due to internal devaluation.
•
140
Ber
1.1
0.9
12.3
-2.2
2013 2014 2015 2016 1Q14 2Q14 3Q14 4Q14 1Q15 2Q15 3Q15 4Q15 1Q16 2Q16 3Q16 4Q16
1.1
-0.3 -0.4 -0.5 -0.5 -0.4
0.1
0.5
0.9
1.1
1.1
1.1
1.1
-1.9 -0.4 0.2
0.0 -0.2 -0.1 -0.1
0.1
0.3
0.3
0.3
0.3
0.3
0.3
0.3
%q/q ann.
% y/y
-2.7
% q/q
0.2
0.4
0.7
-0.1
-0.3
0.1
-0.9
0.4
0.2
-0.6
0.4
0.1
-0.5
0.4
0.0
0.2
0.2
0.0
1.1
0.3
0.2
1.1
0.4
0.2
1.1
0.6
0.2
1.3
0.8
0.2
1.0
0.7
0.1
1.0
0.6
0.1
1.0
0.5
0.1
Government Consumption
% y/y
% q/q
-0.7
-0.2
0.2
0.4
-0.3
-0.3
-0.4
0.1
0.2
-0.3
-0.4
0.1
0.0
0.1
0.0
0.1
0.4
0.1
0.4
0.1
0.4
0.1
0.4
0.1
0.4
0.1
0.4
0.1
Investment
% y/y
% q/q
% y/y
-5.4
-2.5
-0.6
1.3
-2.8
-0.3
0.2
0.7
-1.4
-1.1
-0.5
-2.2
-0.8
-0.2
-3.1
-1.0
-0.3
-3.2
-0.4
-0.4
-2.2
0.0
-0.2
-1.2
0.2
0.0
0.1
0.3
0.3
0.8
0.3
0.6
1.2
0.4
0.8
1.3
0.4
0.7
1.4
0.4
0.7
1.4
0.4
0.6
0.9
0.4
0.2
0.3
-0.2
0.4
0.0
0.2
-0.2
0.6
0.0
0.4
0.0
0.3
0.2
0.2
0.2
0.1
0.2
0.2
0.2
0.3
0.1
0.3
0.1
0.3
0.1
0.3
% q/q
% y/y
% q/q
-0.1
-0.5
-0.6
-0.5
0.2
-0.3
-0.1
0.1
-0.4
-0.3
0.1
-0.8
-0.1
-0.1
-0.5
0.0
0.0
-0.4
0.0
0.1
-0.1
0.0
0.1
0.0
0.0
0.1
0.0
0.0
0.1
0.1
0.0
0.1
0.1
0.0
0.1
0.1
0.0
0.1
0.2
0.0
Current Account Balance
EUR bn
% of GDP
16.6
1.0
28.2
1.8
34.2
2.1
40.2
2.5
-0.9
6.2
10.4
12.5
0.6
7.7
11.9
14.0
2.1
9.2
13.4
15.5
Industrial Production 2
% y/y
% q/q
%
-2.8
-0.5
-0.5
1.6
12.2
1.3
-2.8
12.8
0.2
-3.0
12.7
-0.1
-2.7
12.3
0.9
-2.2
1.3
0.4
12.7
0.2
-1.1
12.5
-1.2
-1.1
12.9
-2.4
-0.6
13.2
-2.5
0.2
12.8
-1.1
0.4
12.7
0.4
0.4
12.6
1.4
0.4
12.5
1.6
0.4
12.4
1.6
0.4
12.3
1.6
0.4
12.2
1.6
0.4
12.1
0.5
0.4
-0.1
0.1
-0.3
-0.3
0.0
0.2
0.8
0.8
0.9
1.0
Final Domestic Demand 1
Net Exports
1
Stockbuilding 1
Unemployment Rate 2
CPI 2
General Govt. Balance
% q/q
% y/y
% y/y
% of GDP
General Govt. Debt
% of GDP 127.9 131.0 131.0 129.0
1
2
Contribution to GDP growth
Period averages
9
Christian Schulz
Senior Economist
[email protected]
+44 20 3207 7878
Spain: the poster child for reform
Key drivers of forecast
Spain: the worst is behind it
Very competitive: Wage restraint and labour market
reforms have reduced labour costs, supporting an
export-led recovery.
•
•
Diminishing fiscal drag: While still uncomfortable,
the fiscal position has allowed an easing of austerity.
•
Stabilising domestic demand: As consumer
confidence returns, consumption should grow
solidly.
•
Inflation: Inflation is below the Eurozone average
due to internal devaluation.
Risks: Balanced for growth.
Downside: Fall-out from potential Greek crisis, rise
of anti-austerity movement Podemos on political
scandals, Catalunya independence debate.
•
Change in
unemployment
2003
2005
2007
2009
2011
2013
National definition, 000s, 12m sum. Source: Spanish Labour Ministry.
Upside: Spain less exposed to Ukraine/Russia than
Eurozone core. A sharper fall in borrowing costs
boosts investment. Global growth lifts export
demand. Cheap oil helps.
•
1400
1200
1000
800
600
400
200
0
-200
-400
2001
Berenberg versus consensus
Ber
2.2
-1.0
22.6
-4.4
GDP
Inflation
Unemployment
Fiscal balance
2015
Cons
1.9
-0.2
23.1
-4.6
Gap
0.3
-0.8
-0.5
0.1
Ber
2.2
0.2
20.6
-2.9
2016
Cons
2.0
0.9
21.9
-3.8
Gap
0.2
-0.7
-1.3
0.9
Bloomberg consensus, taken 30 January 2015.
GDP
Private Consumption
Government Consumption
Investment
Final Domestic Demand 1
Net Exports 1
Stockbuilding 1
Current Account Balance
Industrial Production 2
% y/y
% q/q
%q/q ann.
% y/y
% q/q
% y/y
% q/q
% y/y
% q/q
% y/y
% q/q
% y/y
2013 2014 2015 2016 1Q14 2Q14 3Q14 4Q14 1Q15 2Q15 3Q15 4Q15 1Q16 2Q16 3Q16 4Q16
1.5
2.2
2.2
0.8
1.3
1.7
2.1
2.2
2.2
2.2
2.0
2.1
2.2
2.2
2.3
-1.3
0.3
0.5
0.5
0.7
0.5
0.5
0.5
0.5
0.5
0.5
0.6
0.6
1.4
2.1
2.2
2.7
1.8
2.1
2.1
2.1
2.2
2.2
2.4
2.4
-2.3
2.4
2.5
1.6
-2.9
0.8
0.3
0.4
-3.9
2.2
2.5
3.8
-2.7
1.9
2.0
1.7
1.3
-0.6
0.2
0.5
% q/q
% y/y
% q/q
0.1
0.2
0.1
0.0
EUR bn
% of GDP
% y/y
15
1.4
-1.3
-1
-0.1
2.0
-1
-0.1
1.7
-1
-0.1
2.4
% q/q
%
% y/y
26.1
1.5
24.5
-0.2
22.6
-1.0
20.6
0.2
General Govt. Debt
% of GDP
% of GDP
-6.3
92.1
-5.7
96.5
-4.4
97.8
-2.9
98.4
1
2
Unemployment Rate 2
CPI 2
General Govt. Balance
Contribution to GDP growth
1.3
0.6
0.5
2.2
0.9
0.7
2.7
0.8
0.9
3.5
1.1
1.1
3.4
0.5
0.1
2.8
0.4
0.4
2.3
0.4
0.4
1.6
0.4
0.4
1.5
0.4
0.4
1.5
0.4
0.4
1.7
0.5
0.4
1.8
0.5
0.4
1.1
0.2
0.1
-0.1
3.0
1.6
0.1
2.9
1.1
0.1
2.8
0.0
0.1
3.0
0.3
0.1
2.2
0.8
0.1
1.9
0.8
0.1
2.7
0.8
0.1
3.4
1.0
0.1
3.6
1.0
0.1
3.9
1.0
0.1
4.1
1.0
0.9
0.6
-0.4
2.0
0.8
-0.8
2.3
0.7
-0.8
2.7
0.6
-0.6
2.5
0.4
-0.4
2.1
0.4
0.1
1.8
0.4
0.4
1.5
0.4
0.5
1.6
0.4
0.5
1.7
0.4
0.5
1.8
0.5
0.5
1.9
0.5
0.4
-0.1
0.3
-0.1
-0.3
0.2
0.0
-0.2
0.2
0.1
0.0
0.0
0.0
0.1
0.1
0.0
0.1
0.1
0.0
0.2
0.0
0.0
0.2
0.0
0.0
0.1
0.0
0.0
0.1
0.0
0.0
0.1
0.0
0.0
0.1
0.0
0.0
-7.0
-1.1
2.5
4.8
-7.0
-1.1
2.5
4.8
-7.0
-1.1
2.5
4.8
2.5
2.6
1.3
1.6
0.8
1.1
2.2
2.4
2.4
2.4
2.4
2.4
1.4
25.3
0.0
0.3
24.7
0.2
-0.5
24.1
-0.4
0.4
23.8
-0.6
0.6
23.5
-1.2
0.6
22.9
-1.1
0.6
22.3
-1.0
0.6
21.7
-0.7
0.6
21.1
0.0
0.6
20.7
0.1
0.6
20.4
0.2
0.6
20.1
0.4
Period averages
10
Christian Schulz
Senior Economist
[email protected]
+44 20 3207 7878
Portugal: growing out of trouble
Key drivers of forecast
Portugal recovery broadens to domestic demand
Regained competitiveness supports an export- and
investment-led recovery.
•
Consumer confidence (lhs)
Consumption, real, yoy % (rhs)
-20
•
Returning market confidence: Borrowing costs have
fallen to comfortable levels, clean bail-out exit.
-30
•
Stronger neighbour: Neighbouring Spain’s return to
growth is boosting Portugal’s export prospects.
-40
•
Banking trouble: A crisis at a major bank dented
confidence briefly over summer 2014.
-50
•
Inflation: Inflation is below the Eurozone average
due to internal devaluation.
•
GDP: Quarterly data volatile, but moderate recovery
continues.
Upside: Low interest rates ease fiscal pressure.
Cheap oil.
•
Downside: Sizeable austerity in 2014 and 2015.
Constitutional court protects public sector workers,
making adjustment harder for private sector.
GDP
% y/y
% q/q
%q/q ann.
% y/y
% q/q
Private Consumption
Government Consumption
Investment
Final Domestic Demand
1
Net Exports 1
Stockbuilding 1
Current Account Balance
% y/y
% q/q
% y/y
% q/q
% y/y
% q/q
% y/y
% q/q
% y/y
% q/q
EUR bn
0
-2
-4
-60
2005
-6
2008
2011
2014
Confidence on the left-hand axis, consumption on the right-hand axis..
Source: Eurostat.
Berenberg versus consensus
Ber
1.6
-0.2
12.7
-2.9
GDP
Inflation
Unemployment
Fiscal balance
2015
Cons
1.3
0.4
13.1
-3.2
Gap
0.3
-0.6
-0.4
0.3
Ber
2.2
0.9
11.7
-2.0
2016
Cons
1.5
1
12.6
-2.8
Gap
0.7
-0.1
-0.9
0.8
Bloomberg consensus, taken 30 January 2015.
2013 2014 2015 2016 1Q14 2Q14 3Q14 4Q14 1Q15 2Q15 3Q15 4Q15 1Q16 2Q16 3Q16 4Q16
0.8
1.6
2.2
1.0
0.9
1.1
0.4
1.2
1.4
1.7
1.9
2.1
2.2
2.3
2.3
-1.4
-0.4 0.3
0.3
0.3
0.4
0.4
0.5
0.5
0.5
0.6
0.6
0.6
-1.4
2.1
1.4
1.3
-1.9
-0.4
0.4
0.8
-6.3
2.4
3.5
3.6
-2.3
1.6
1.5
1.6
1.0
-1.2
0.3
0.7
0.0
0.5
-0.3
0.0
1.2
0.7
0.8
1.9
1.1
1.0
3.7
2.1
1.1
5.5
3.1
3.7
16.4
0.4
-4.5
14.1
-0.2
-4.0
12.7
-0.2
-2.9
11.7
0.9
-2.0
Industrial Production 2
% of GDP
% y/y
% q/q
Unemployment Rate 2
CPI 2
General Govt. Balance
%
% y/y
% of GDP
General Govt. Debt
% of GDP 128.0 134.0 133.0 130.0
1
2
Contribution to GDP growth
4
2
Risks: Tilted to downside for growth and inflation.
•
6
-1.5
2.1
0.3
1.0
1.8
0.0
1.0
2.7
1.4
1.2
1.9
0.2
1.6
1.8
0.2
1.8
2.0
0.2
2.1
0.9
0.3
2.1
1.0
0.3
2.2
1.1
0.3
2.4
1.3
0.4
2.4
1.4
0.4
2.3
1.5
0.4
-0.3
-0.6
0.6
-0.3
-0.3
3.3
-0.1
-0.4
3.7
-1.0
0.2
1.8
-0.3
0.2
5.0
0.2
0.2
3.8
0.8
0.2
2.4
0.8
0.2
2.9
0.8
0.2
3.5
0.8
0.2
3.6
0.8
0.2
3.6
0.8
0.2
3.4
-2.8
1.4
-0.3
2.0
1.6
0.2
2.3
2.3
1.1
0.4
1.3
0.2
0.3
1.8
0.2
0.8
1.9
0.3
0.9
1.1
0.4
0.9
1.3
0.4
0.9
1.4
0.4
0.9
1.6
0.4
0.9
1.6
0.4
0.7
1.7
0.4
-1.9
-1.7
1.5
-0.7
1.1
0.0
-0.9
-0.9
-0.3
-1.4
0.1
0.6
0.5
0.2
-1.1
-0.4
0.2
0.0
0.6
0.2
0.0
0.7
0.2
0.0
0.6
0.2
0.0
0.6
0.2
0.0
0.7
0.2
0.0
0.7
0.2
0.0
1.6
-0.8
-1.0
0.0
0.0
1.7
0.0
1.0
0.0
-0.3
0.0
0.5
0.0
2.1
0.0
1.5
0.0
0.1
0.0
0.9
0.0
2.6
0.0
1.9
1.2
-2.5
3.4
3.5
1.6
-0.7
-1.9
-2.0
1.5
0.8
-1.0
0.9
0.6
0.9
3.6
0.9
3.7
0.9
3.7
0.9
3.7
0.9
3.7
0.9
15.0
-0.1
14.3
-0.2
13.5
-0.3
13.5
0.0
13.1
-0.4
12.8
-0.3
12.6
-0.2
12.3
0.1
12.0
0.7
11.8
0.8
11.6
0.9
11.4
1.0
Period averages
11
FORECASTS AT A GLANCE
Economics
Forecast changes
•
Spain: 2015 GDP growth from 1.8% to 2.2% and 2016 growth unchanged. Portugal will grow by 1.6% in 2015, up from
1.4% as its major trading partner expands strongly.
Berenberg compared to consensus
GDP
US
China
Japan
UK
EZ
Germany
France
Italy
Spain
Portugal
2015
0.1
0.0
-0.2
0.6
-0.1
-0.1
-0.2
-0.2
0.3
0.3
0.1
0.0
0
-.2
0.6
0
-.1
0
-.1
0
-.2
0
-.2
0.3
0.3
Inflation
2016
0.2
-0.1
0.1
0.6
0.3
0.6
0.0
0.1
0.2
0.7
0.2
0
- .1
0.1
0.6
0.3
0.6
0.0
0.1
0.2
0.7
2015
-0.7
-0.1
-0.6
-0.6
-0.5
-0.8
-0.3
-0.2
-0.8
-0.6
2016
0
-.7
0
-.1
0
-.6
0
-.6
0
-.5
0
-.8
0
-.3
0
-.2
0
-.8
0
-.6
-0.4
0.2
-0.7
-0.3
-0.4
-0.4
-0.5
0.0
-0.7
-0.1
0
-.4
0.2
0
-.7
0
-.3
0
-.4
0
-.4
0
-.5
0.0
0
-.7
0
-.1
Unemployment Rate
2015
2016
0.1
-0.2
0.2
0.2
-0.1
0.0
-0.3
-0.6
-0.2
-0.5
n/a
n/a
-0.2
-0.1
-0.1
-0.3
-0.5
-1.3
-0.4
-0.9
0.1
0
-.2
0.2
0.2
0
- .1
0.0
0
- .3
0
-.6
0
- .2
0
-.5
0
- .2
0
-.1
0
- .1
0
-.3
0
- .5
1
- .3
0
- .4
0
-.9
Govt. Budget Balance
2015
2016
0.0
0.0
0.4
0.5
0.3
0.0
0.1
0.3
-0.3
-0.1
0.1
0.0
-0.2
0.3
0.1
0.2
0.1
0.9
0.3
0.8
0.0
0.0
0.4
0.5
0.3
0.0
0.1
0.3
0
-.3
0
- .1
0.1
0.0
0
-.2
0.3
0.1
0.2
0.1
0.9
0.3
0.8
Table shows difference between Berenberg forecasts and Bloomberg consensus. The bars show graphically whether Berenberg forecasts are stronger (red)
or weaker (blue) than consensus. Bloomberg consensus taken on 30 January 2015. Berenberg Germany unemployment forecasts based on ILO measure,
which is not comparable to consensus figures that are based on the national unemployment definition. Source: Bloomberg, Berenberg
12
FORECASTS AT A GLANCE
Economics
Key financial forecasts
Current1
MidMid -2015
EndEnd -2015
0.00-0.25%
0.05%
0.50%
0.10%
0.00-0.25%
0.05%
0.50%
0.10%
0.75%
0.05%
0.75%
0.10%
1.82%
0.36%
1.47%
2.50%
0.80%
2.30%
2.80%
1.10%
2.60%
1.13
0.75
1.50
118
132
0.99
1.15
0.75
1.54
121
139
1.08
1.20
0.76
1.57
122
146
1.12
Central bank rates
US Fed
ECB
BoE
BoJ
1010-year bond yields
US
Germany
UK
Currencies
EUR-USD
GBP-EUR
GBP-USD
JPY-USD
JPY-EUR
CHF-EUR
1
Taken 23/01/2014 at 3:00pm.
13
FORECASTS AT A GLANCE
Economics
Disclaimer
This document was compiled by the above mentioned authors of the economics department of Joh. Berenberg, Gossler & Co. KG
(hereinafter referred to as “the Bank”),. The Bank has made any effort to carefully research and process all information. The
information has been obtained from sources which we believe to be reliable such as, for example, Thomson Reuters, Bloomberg and
the relevant specialised press. However, we do not assume liability for the correctness and completeness of all information given.
The provided information has not been checked by a third party, especially an independent auditing firm. We explicitly point to the
stated date of preparation. The information given can become incorrect due to passage of time and/or as a result of legal, political,
economic or other changes. We do not assume responsibility to indicate such changes and/or to publish an updated document. The
forecasts contained in this document or other statements on rates of return, capital gains or other accession are the personal
opinion of the author and we do not assume liability for the realisation of these.
This document is only for information purposes. It does not constitute a financial analysis within the meaning of § 34b or § 31 Subs.
2 of the German Securities Trading Act (Wertpapierhandelsgesetz), no investment advice or recommendation to buy financial
instruments. It does not replace consulting regarding legal, tax or financial matters.
Remarks regarding foreign investors
The preparation of this document is subject to regulation by German law. The distribution of this document in other jurisdictions
may be restricted by law, and persons, into whose possession this document comes, should inform themselves about, and observe,
any such restrictions.
United Kingdom
This document is meant exclusively for institutional investors and market professionals, but not for private customers. It is not for
distribution to or the use of private investors or private customers.
United States of America
This document has been prepared exclusively by Joh. Berenberg, Gossler & Co. KG. Although Berenberg Capital Markets LLC, an
affiliate of the Bank and registered US broker-dealer, distributes this document to certain customers, Berenberg Capital Markets LLC
does not provide input into its contents, nor does this document constitute research of Berenberg Capital Markets LLC. In addition, this
document is meant exclusively for institutional investors and market professionals, but not for private customers. It is not for
distribution to or the use of private investors or private customers.
This document is classified as objective for the purposes of FINRA rules. Please contact Berenberg Capital Markets LLC (+1
617.292.8200), if you require additional information.
Copyright
The Bank reserves all the rights in this document. No part of the document or its content may be rewritten, copied, photocopied or
duplicated in any form by any means or redistributed without the Bank’s prior written consent.
© May 2013 Joh. Berenberg, Gossler & Co. KG
14
Contacts: Investment Banking
www.berenberg.com
e-mail: [email protected] / e-mail US: [email protected]
EQUITY RESEARCH
RESEARCH
AEROSPACE & DEFENCE
Andrew Gollan
+44 20 3207 7891
Tom O'Donnell
+44 20 3465 2668
AUTOMOTIVES
Henning Cosman
Adam Hull
Paul Kratz
+44 20 3465 2635
+44 20 3465 2749
+44 20 3465 2678
BANKS
Nick Anderson
Adam Barrass
James Chappell
Carlos Lopez Ramos
Andrew Lowe
Eoin Mullany
Eleni Papoula
+44 20 3207 7838
+44 20 3207 7923
+44 20 3207 7844
+44 20 3465 2627
+44 20 3465 2743
+44 20 3207 7854
+44 20 3465 2741
BEVERAGES
Javier Gonzalez Lastra
Adam Mizrahi
+44 20 3465 2719
+44 20 3465 2653
BUSINESS SERVICES, LEISURE & TRANSPORT
Najet El Kassir
+44 20 3207 7836
Stuart Gordon
+44 20 3207 7858
Simon Mezzanotte
+44 20 3207 7917
Yousuf Mohamed
+44 20 3465 2672
Matthew O'Keeffe
+44 20 3207 7895
Josh Puddle
+44 20 3207 7881
CAPITAL GOODS
Alex Deane
Stephan Klepp
Kai Mueller
Internet www.berenberg.com
CHEMICALS
John Klein
Evgenia Molotova
Jaideep Pandya
CONSTRUCTION
Chris Moore
Robert Muir
Michael Watts
+44 20 3207 7930
+44 20 3465 2664
+44 20 3207 7890
HOUSEHOLD & PERSONAL CARE
Ana Caludi Muldoon
+44 20 3207 7841
Bassel Choughari
+44 20 3465 2675
James Targett
+44 20 3207 7873
+44 20 3465 2737
+44 20 3207 7860
+44 20 3207 7928
INSURANCE
Peter Eliot
Matthew Preston
Sami Taipalus
+44 20 3207 7880
+44 20 3207 7913
+44 20 3207 7866
LUXURY GOODS
Bassel Choughari
Zuzanna Pusz
+44 20 3465 2675
+44 20 3207 7812
MEDIA
Robert Berg
Laura Janssens
Jessica Pok
Sarah Simon
+44 20 3465 2680
+44 20 3465 2639
+44 20 3207 7907
+44 20 3207 7830
DIVERSIFIED FINANCIALS
Pras Jeyanandhan
+44 20 3207 7899
FOOD MANUFACTURING
Fintan Ryan
+44 20 3465 2748
James Targett
+44 20 3207 7873
FOOD RETAIL
Estelle Weingrod
+44 20 3207 7931
GENERAL RETAIL
Bethany Hocking
Michelle Wilson
+44 20 3207 7925
+44 20 3465 2663
HEALTHCARE
Scott Bardo
Alistair Campbell
Graham Doyle
Tom Jones
Louise Pearson
+44 20 3207 7869
+44 20 3207 7876
+44 20 3465 2634
+44 20 3207 7877
+44 20 3465 2747
MID CAP GENERAL
Robert Chantry
Gunnar Cohrs
Sam England
Benjamin May
Virginia Nordback
Anna Patrice
Simona Sarli
Stanislaus von Thurn
und Taxis
+44 20 3207 7861
+44 20 3207 7894
+44 20 3465 2687
+44 20 3465 2667
+44 20 3465 2693
+44 20 3207 7863
+44 20 3207 7834
+44 20 3465 2730
+44 20 3207 7819
+44 20 3465 2681
+44 20 3207 7932
+44 20 3207 7890
REAL ESTATE
Kai Klose
+44 20 3207 7888
TECHNOLOGY
Adnaan Ahmad
Daud Khan
Ali Farid Khwaja
Gal Munda
Tammy Qiu
+44 20 3207 7851
+44 20 3465 2638
+44 20 3207 7852
+44 20 3465 2746
+44 20 3465 2673
TELECOMMUNICATIONS
Wassil El Hebil
+44 20 3207 7862
Usman Ghazi
+44 20 3207 7824
Siyi He
+44 20 3465 2697
Paul Marsch
+44 20 3207 7857
Barry Zeitoune
+44 20 3207 7859
TOBACCO
Erik Bloomquist
+44 20 3207 7870
UTILITIES
Andrew Fisher
Mehul Mahatma
Oliver Salvesen
Lawson Steele
+44 20 3207 7937
+44 20 3465 2698
+44 20 3207 7818
+44 20 3207 7887
ECONOMICS
Holger Schmieding
Christian Schulz
Robert Wood
+44 20 3207 7889
+44 20 3207 7878
+44 20 3207 7822
E-mail: [email protected]
SPECIALIST SALES
BANKS & DIVERSIFIED FINANCIALS
Iro Papadopoulou
+44 20 3207 7924
CONSUMER
Rupert Trotter
+44 20 3207 7815
HEALTHCARE
Frazer Hall
+44 20 3207 7875
INDUSTRIALS
Chris Armstrong
+44 20 3207 7809
INSURANCE
Trevor Moss
+44 20 3207 7893
MEDIA & TELECOMMUNICATIONS
Julia Thannheiser
+44 20 3465 2676
MATERIALS
Jina Zachrisson
+44 20 3207 7879
TECHNOLOGY
Jean Beaubois
+44 20 3207 7835
UTILITIES
Benita Barretto
+44 20 3207 7829
FRANKFURT
Michael Brauburger
Nina Buechs
André Grosskurth
Joerg Wenzel
OIL & GAS
Asad Farid
Jaideep Pandya
+44 20 3465 2631
EQUITY SALES
SALES
BENELUX
Miel Bakker
Susette Mantzel
Alexander Wace
E-mail: [email protected]
+44 20 3207 7808
+49 40 350 60 694
+44 20 3465 2670
SALES (cont.)
LONDON
John von BerenbergConsbruch
Toby Flaux
Karl Hancock
Sean Heath
David Hogg
Ben Hutton
James Matthews
David Mortlock
Richard Payman
George Smibert
Anita Surana
Paul Walker
Alexander Woodgate
PARIS
Alex Chevassus
Dalila Farigoule
Clémence La ClavièrePeyraud
SCANDINAVIA
Marco Weiss
+44 20 3207 7805
+44 20 3465 2745
+44 20 3207 7803
+44 20 3465 2742
+44 20 3465 2628
+44 20 3207 7804
+44 20 3207 7807
+44 20 3207 7850
+44 20 3207 7825
+44 20 3207 7911
+44 20 3207 7855
+44 20 3465 2632
+44 20 3465 2625
+33 1 5844 9512
+33 1 5844 9510
+33 1 5844 9521
+49 40 350 60 719
+49 69 91 30 90 741
+49 69 91 30 90 735
+49 69 91 30 90 734
+49 69 91 30 90 743
SALES (cont.)
ZURICH
Andrea Ferrari
Stephan Hofer
Carsten Kinder
Gianni Lavigna
Jamie Nettleton
Benjamin Stillfried
SALES TRADING
HAMBURG
Sebastian Grünberg
Alexander Heinz
Marc Hosthausen
Gregor Labahn
Patrick Schepelmann
Lars Schwartau
Marvin Schweden
Tim Storm
Philipp Wiechmann
+41 44 283 2020
+41 44 283 2029
+41 44 283 2024
+41 44 283 2038
+41 44 283 2026
+41 44 283 2033
+49 40 350 60 763
+49 40 350 60 359
+49 40 350 60 761
+49 40 350 60 571
+49 40 350 60 559
+49 40 350 60 450
+49 40 350 60 576
+49 40 350 60 415
+49 40 350 60 346
LONDON
Mike Berry
Stewart Cook
Chris McKeand
Simon Messman
Paul Somers
+44 20 3465 2755
+44 20 3465 2752
+44 20 3207 7938
+44 20 3465 2754
+44 20 3465 2753
PARIS
Sylvain Granjoux
+33 1 5844 9509
Zubin Hubner
Jessica London
Emily Mouret
Peter Nichols
Kieran O'Sullivan
Jonathan Saxon
+1 646 445 5572
+1 646 445 7218
+1 415 802 2525
+1 646 445 7204
+1 617 292 8292
+1 646 445 7202
US SALES
BERENBERG CAPITAL MARKETS LLC
Member FINRA & SIPC
ELECTRONIC TRADING
Matthias Führer
+49 40 350 60 597
Julian Winter
+49 40 350 60 463
SOVEREIGN WEALTH FUNDS
Max von Doetinchem
+44 20 3207 7826
CRM
Edwina Lucas
Greg Swallow
+44 20 3207 7908
+44 20 3207 7833
INVESTOR ACCESS
Matthew Chawner
Jennie Jiricny
+44 20 3207 7847
+44 20 3207 7886
EVENTS
Charlotte Kilby
Natalie Meech
Charlotte Reeves
Sarah Weyman
Hannah Whitehead
+44 20 3207 7832
+44 20 3207 7831
+44 20 3465 2671
+44 20 3207 7801
+44 20 3207 7922
E-mail: [email protected]
Colin Andrade
Burr Clark
Julie Doherty
Kelleigh Faldi
Shawna Giust
Andrew Holder
+1 646 445 7214
+1 617 292 8282
+1 617 292 8228
+1 617 292 8288
+1 646 445 7216
+1 617 292 8222
CRM
Laura Cooper
+1 646 445 7201
INVESTOR ACCESS
Olivia Lee
+1 646 445 7212
15


© Copyright 2026