
Computerized Determination of Growth Kinetic Curves and
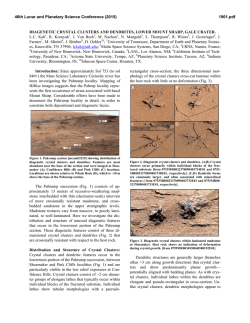
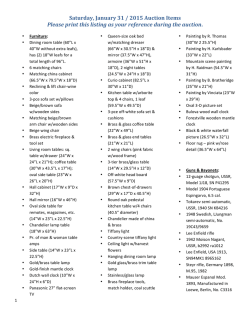
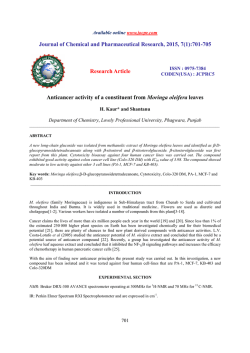
ANALYTICALBIOCHEMISTRY
187,262-267
(1990)
Computerized Determination of Growth Kinetic Curves
and Doubling Times from Cells in Microculture
Herta
Reile,
Institut
fiir
Received
July
Herbert
Pharmazie,
BirnbGck,
Giinther
Sonderforschungsbereich
Bernhardt,
234, Universittit
Sprul3, and Helmut
Regensburg,
D-8400 Regensburg,
Schgnenberger
Federal Republic
of Germany
l&l989
In this paper we describe the microcomputer-aided
determination
of cell proliferation
kinetics
and doubling
times utilizing
a crystal violet assay and a 3-(4,5-dimethylthiazol-2-yl)-2,5-diphenyl-2H-tetrazolium
bromide
assay in microtitration
plates. The analysis
of spectrophotometric
data provides
the doubling
times at any
time of incubation.
Plots of doubling
time versus time of
incubation
give reproducible
information
on the exact
duration
of the logarithmic
growth
phase. This method
is applicable
to anchorage-dependent
as well as anchorage-independent
cells when calorimetric
or fluorometric data are accessible.
o isso
Academic
press, h.
A great problem in the testing of new anticancer drugs
by the cell culture technique is the marked genetic instability of tumor cells (1,2) entailing an extreme clonal
variation (3). This becomes evident with growing numbers of passagesfrom a permanent change of parameters
of cell proliferation like the duration of the lag phase and
of the log period, the doubling time, and the saturation
density (plateau level). For example, Reddel et al. (4) observed such a perpetual decrease of doubling time in subcultures of the human breast cancer cell line T-47-D.
Since drugs can show quite different inhibitory effects
dependent of the growth parameters of a given tumor
cell line, the knowledge of the growth parameters in each
test series is of importance for the experimental reproducibility. Although it is generally postulated that the
exposure of the tumor cells to the drug should occur in
the phase of exponential growth, this demand often does
not meet experimental verification.
Conventionally, mean doubling times are determined
graphically from the mid log phase or calculated from
initial and final cell numbers (5) counted with either a
hemocytometer or an electronic particle counter which
requires removing the cells from their substratum. Either method could lead to severe misinterpretation due
262
Thilo
to practical difficulties in distinguishing the lag phase
from the phase of exponential growth.
In this publication we describe a microcomputer technique which allows the registration of growth curves of
cells in monolayer cultures by large scale spectrophotometric measurement after crystal violet staining’ (6) or
MTT incorporation (7-9) using 96-well microtitration
plates. This method enables the overall growth curve especially the lag phase and the log period to be determined in a more exact way. As a consequence it is also
possible to precisely assessthe doubling time (TAU) at
any time of the experiment. In our opinion a plot of TAU
versus time (t) provides the maximum information
available from cell proliferation experiments.
METHODS
Chemicals.
Reagents (A-grade purity) were obtained
from Merck. Crystal violet and MTT were purchased
from Serva; dimethyl sulfoxide (DMSO) spectrophotometric grade was obtained from Aldrich. Millipore-filtered water was used throughout.
Cell
lines
and
culture
conditions.
MDA-MB-231
(ATCC No. HTB 26), a human adenocarcinoma of the
breast, was maintained in McCoy’s 5A medium (Boehringer) containing L-glutamine, NaHCO, (2.3 g/liter),
gentamycin (50 mg/liter), and 10% NCS (GIBCO) in 75
cm2 flasks (Falcon Plastics 3023) as a monolayer.
The cells were serially passagedweekly following trypsinization using trypsin/EDTA
(Boehringer).
P388DI
(ATCC No. CCL 46), a murine lymphoid neoplasm, was grown in a suspension culture in Dulbecco’s
modified Eagle’s medium (Seromed) containing glucose
’ Abbreviations
used: crystal
violet,
N-hexamethylpararosaniline;
MTT,
3-(4,5-dimethylthiazol-2-yl)-2,5-diphenyl-2~-tetrazolium
mide; DMSO,
dimethyl
sulfoxide;
PBS, phosphate-buffered
OD, optical
density;
PC, personal
computer;
NCS, newborn
rum.
brosaline;
calf se-
0003-2697/90 $3.00
Copyright
0 1990 by Academic Press, Inc.
All rights of reproduction
in any form reserved.
COMPUTERIZED
I
DETERMINATION
Cell
Ii&e: MDA-MB-231
cnItum
conditions:
MCCOY’S
+ 10% NCS
humidlfkd
atmosphere.
37O
(96%
air. 5% coa 1
of cells
In
at defined
C
96well
density
Incubation
Fixation
of cells
with
1% glutaraldehyde
in PBS
for 15 min.
after
varying
times
of incubation.
Storage
under
PBS at 4O C
Staining
of 0.02%
of cells
crystal
Extraction
with
with
violet
a solution
(30 min.)
of bound
70% ethanol
GROWTH
KINETIC
263
CURVES
(I) MDA-MB-231
cells were processed as shown in
Flow Chart 1 by modifying the crystal violet staining
procedure described by Gillies et al. (6).
(II) The proliferation
of P388D1 cells was quantitated
according to a microculture
modification
of the tetrazolium assay (7-9, 11): MTT was prepared as a 1 mg/ml
stock solution in medium and filtered through a 0.22-pm
filter to remove undissolved
dye. At the times indicated
in Fig. 1, 50 ~1 of stock MTT solution was added to all
wells, each containing
100 ~1 of cell suspension.
The
plates were gently shaken and incubated at 37°C for another 1.5 h. Supernatant
removal was accomplished
by
carefully inverting
and blotting the tray; no prior centrifugation
was needed, since the macrophage-like
cells
sedimented and adhered to the substratum.
One hundred microliters
of DMSO was added to all wells to dissolve the formazan crystals.
Cytogenetic analysis.
The cells were grown to about
50% confluence on microscopic
slides. The slides were
prepared as described elsewhere
(12). So that spindle
I
1
Plating
nicmplates
OF
MAIN
stain
MENU
J
I
1
Measurement
of optical
(EL 309 Autoreader.
density
BIOTEK)
I
Computer-aided
data
analysis
DATA
FLOW
violet
dye
sensitivity
CHART
1.
Registration
procedure.
Optical
and reliability.
density
of growth
reading
curves
at 578
using
nm
gives
the
T O FILE
crystal
improved
(4.5 g/liter), NaHCO,
(3.7 g/liter), sodium pyruvate (110
mg/liter),
gentamycin
(50 mg/liter),
and 10% horse serum (Boehringer)
in 75cm2 culture flasks. The cells
were passaged every 3-4 days by 1:40 dilution with fresh
medium.
Both cell lines were grown at 37°C in a humidified atmosphere of 95% air and 5% carbon dioxide.
Mycoplasma
contamination
was monitored by routine
assay techniques
(Hoechst
33.258) (lo), and only mycoplasma-free
cultures were used.
Registration
of growth curves.
The assay was carried
out in flat-bottomed
microtitration
trays (Falcon Plastics 3075). Optical density was read using a Biotek EL
309 Autoreader
(Tecnomara)
at 578 nm (crystal violet)
and 540 nm (MTT).
POLYNOMIAL
LEAST SQUARES
FLOW
CHART
FIT
2.
Analysis
of spectrophotometric
data.
264
REILE
ET
AL.
60
1.5
50
0
0
,0
0
0”
10
B
aloo
0
0
0
60
120
180
"
60
TINE [hrs]
FIG.
1. (A) Calorimetric
measurement
of growth
in
were
unknown,
numbered
upon receipt from the ATCC)
MTT was added to all wells, and after another
1.5 h the
cell line MDA-MB-231
was plated in the 38th passage
medium/well
and were allowed
to attach.
Cell densities
microscope
(320X). At the times indicated,
the cells were
end of the experiment
all trays were stained with crystal
at 578 nm. (B) Plots of the corresponding
doubling
times,
= C Uiti;
(i = 0, 1, . . . , n)
Ui
This polynomial
= regression
180
microtitration
plates. (0) P388D1
leukemia
cells from passage 28 (original
passage
seeded at a density of 8 X 10’ cells/ml
(Coulter
Counter
ZsI). At the times indicated,
plates were developed
and read immediately
at 540 nm. (@) The human breast cancer
from origin at a density
of 12 cells per field of vision. The cells were seeded in 100 ~1
were estimated
by counting
50 fields of vision using a Leitz Diavert
phase-contrast
fixed with 1% glutaraldehyde
in PBS for 15 min and stored under PBS at 4°C. At the
violet simultaneously.
OD was measured
after extraction
of the dye with 70% ethanol
calculated
from the data shown in A, versus time of incubation.
formation
could be inhibited, the slide chambers were
inoculated with Colcemid solution (Serva) to a final concentration
of 0.04 pg/ml and incubated for 3 h at 37°C.
The medium was removed by suction and replaced with
0.075 M KCl. After 30 min of incubation at 37°C an equal
volume of cold, freshly made fixative (absolute methanol/glacial acetic acid, 3/l) was added. This hypotonic/
fixative mixture was removed immediately
and replaced
twice with ice-cold, fresh fixative. The slides were removed from the dish and air-dried.
The chromosomes
were stained for 8 min with 10 ml
Giemsa plus 90 ml of 0.025 M KH,PO,,
pH 6.8.
Computer processing.
Readings from the EL 309 autoreader (Biotek) were transferred
directly to an Olivetti
M24 personal computer, using a program that saved the
OD values on a diskette. The program for data processing is graphed in Flow Chart 2.
Doubling time analysis. Curve fitting of experimental
data is accomplished
by a polynomial regression fit applying the least-squares
method. Optical density is described as a function of time and data points are fitted
to an nth order polynomial
(usually n = 5) represented
by
OD = f(t)
120
TIME [hrs]
coefficients.
is defined in the time interval
of points
observed. Once the polynomial
fit has been performed
the doubling time TAU can easily be calculated at any
time of the interval concerned provided that exponential
growth is observed (13),
TAU
= l/cu
a! = l/in(2)
.d ln(OD)/dt
OD = C aiti,
and hence
TAU
= ln(2).(C
Uit”)/(C
i*oit”-‘);
(i = 0, 1, . . . , n).
ABS (TAU) is plotted versus time. From this plot the
time interval where exponential
growth occurs and the
corresponding
doubling time can easily be determined.
The software for evaluating cell kinetic data was developed in FORTRAN
and PASCAL
and implemented
on
an Olivetti
M24 pc.
RESULTS
Figure 1 illustrates
the growth curves and the corresponding doubling times at any time of incubation
for
an anchorage-dependent
(MDA-MB-231)
cell line and
an anchorage-independent
(P388D,)
cell line. The
curves were registered using two different staining tech-
COMPUTERIZED
#
100
DETERMINATION
,
l
80
T
5
60
*
7
P
3
J
x
40
20
0
0
60
120
180
TINE [hrs]
FIG. 2. Reproducibility
of doubling
time determination
by the crystal violet assay. MDA-MB-231
cells were plated at an approximate
density of 15 cells per field of vision (Leitz Diavert,
320X). The calculated doubling
times from four different
experiments
(all processed
separately)
are plotted
versus time of incubation.
niques:
crystal violet for MDA-MB-231
and MTT for
P388D1. Due to their macrophage-like
properties
(tendency to attach) no centrifugation
step was required in
the case of P388DI cells. A general application
of the
MTT
procedure
to anchorage-independent
cells requires a centrifuge equipped with a rotor capable of accepting multiplates.
Under the given experimental
conditions for both cell
lines the logarithmic
phase covers only a small fraction
of the overall growth curve. In a plot, doubling time
(TAU) versus time of incubation (t) (Fig. lB), exponential growth
is characterized
by a parallelism
of the
graphs with the t-axis. Although
in Fig. 1A the time
points are not equidistant
the calculated doubling times
for the exponential
growth phase are not significantly
affected by closely spaced points at either end of the
curve. A close scattering of data at both ends is required
to separate the log phase from the lag and the plateau
phases where cell proliferation
becomes extremely slow
resulting
in infinite
doubling times. Therefore
only
quantification
of the log phase is of biological significance.
MDA-MB-231
grows exponentially
for about two generations with a doubling time of -34 h, whereas the log
phase for P388DI at the given plating density is restricted to one doubling of the population.
By performing
the doubling time calculations
from
four successive crystal violet processing procedures utilizing MDA-MB-231
cells in the same passage seeded at
comparable plating densities, we encountered
an interassay variation of ~13% (Fig. 2).
OF
GROWTH
KINETIC
265
CURVES
The karyotype
information
presented in Fig. 3 gives
an example for the dramatic variability
of a well-defined
cell line after prolonged culture in vitro following cryopreservation.
Genotypic changes do not only reflect phenotypic characteristics
like morphology, but may also alter cell physiology
as well as cell proliferation,
which
directly affects doubling time (14).
Figure 4 illustrates the alterations
in doubling time as
a result of the number of passages. The doubling times of
MDA-MB-231
cells maintained under constant culture
conditions decreased constantly
with prolonged time in
culture. In the crystal violet assay the cells were seeded
at comparable densities. The doubling times vary enormously over a wide range from x10 h for a late (85th) to
=38 h for a relatively early (35th) passage. The variation most probably arises from the selection of faster
growing subclones from an initially heterogeneous population by frequent and incomplete trypsinization
of the
culture.
It is widely accepted that the initial cell number influences the proliferation
kinetics
of eukaryotic
cells.
This marked influence on doubling time is shown in
Fig. 5.
DISCUSSION
While a variety of techniques (6-10, 15) including an
enzyme immunoassay for estimating small cell numbers
(16) have been described recently for the determination
of parameters for cell proliferation, little interest was focused on the construction and analysis of growth curves
in animal cell culture.
/
25
/
I
I
/
80
90
100
/
n
2ot II
50
60
70
110
185
CHROMISOME NUMBER
FIG. 3.
from origin,
in passage
rethawed.
metaphase
Genetic
instability
of MDA-MB-231
cells. (Cl) 27th passage
(H) 35th passage from origin: The cells were cryopreserved
28 for about 6 months
and then passaged
weekly,
when
For each passage the chromsomes
from 50 well-spread
plates were counted.
266
REILE
It has been common practice to assume that cells exhibit ideal exponential
growth regardless of the diversities of experimental
designs without further verification.
In our opinion the description
of the overall growth
characteristics
with an exact determination
of the lag/
log phases, the doubling time (TAU),
and the plateau
level is absolutely
necessary.
In addition to the characterization
of cell lines (e.g., morphology,
karyotype,
receptor pattern, sensitivity
to antitumor
drugs) the description of the exponential growth phase is a prerequisite for any valuable experimental
setup. Especially, the
investigation
of cell lines underlying
extreme genetic
variability,
e.g., transformed
cells and cancer cells, requires a precise description
and verification
of the parameters concerned. Due to time-consuming
and difficult experimental
procedures
this is usually
not
performed.
The major disadvantage
of the methods described so
far (5, 17, 18) is the production
of mean values rather
than exact values. Due to laborious working techniques
only a few data points are generally obtained. This results in poor graphical estimates which make the separation of the lag/log/plateau
phases of growth curves extremely difficult and unsatisfactory.
In this paper we describe a technique which offers a
number
of advantages
compared
with conventional
methods. This inexpensive,
rapid, and technically
easy
microtitration
assay gives access to large sets of data
thus providing
results of high statistical
significance.
The equipment
necessary
(microplate
reader, PC) is
available in almost every analytical laboratory today.
loo-
80 -
ET
AL.
l
I
I
60
120
TIK
180
[hrs]
FIG.
5. Doubling
time as a function
of initial cell number.
MDAMB-231
cells were plated in passage 39 at different
densities:
(0) 10,
(A) 16, and (m) 36 cells per field of vision (Leitz Diavert,
320X).
Because of the mathematical
representation
of the
data an exact determination
of the log period is guaranteed. TAU as a function of time clearly reveals the duration of the lag and plateau phases. This approach overcomes the major drawback
of graphical methods which
only give a poor estimate of cell kinetics. This method
offers universal applicability
to biological investigations
whenever growth kinetics must be monitored. Its use is
by no way restricted
to calorimetric
measurement.
Its
application can also be extended to turbidimetric,
fluorometric,
radiochemical,
etc., monitoring
techniques.
The only prerequisite
is that a large number of data
which can be digitized are available.
ACKNOWLEDGMENTS
This work was supported
by the Deutsche
Forschungsgemeinschaft
and the “Matthias
Lackas-Stiftung
fiir Krebsforschung.”
Thanks
are
also due to the Fonds der Chemischen
Industrie
for financial
support.
The helpful assistance
of F. Birk in solving data transfer
problems
is
gratefully
acknowledged.
60 -
REFERENCES
1. Whang-Peng,
J., Lee, E. C., Kao-Shan,
Lippman,
M. (1983) J. Natl. Cancer Inst.
2. Yunis, J. J. (1983) Science 221,227-236.
0
60
120
TIE
FIG.
180
[hrs]
4.
Doubling
time as a function
of passage using MDA-MB-231
cells in the (0) 35th, (0) 39th, and (0, n ) 85th passage. (m) The cells
were plated at double density
(ca. 30 cells per field of vision,
Leitz
Diavert,
320X).
C.-S., Seibert,
71,687-695.
K., and
3. Seibert,
K., Shafie,
S. M., Triche,
T. J., Whang-Peng,
J. J.,
O’Brien,
S. J., Toney,
J. H., Huff, K. K., and Lippman,
M. E.
(1983) Cancer Res. 43,2223-2239.
4. Reddel, R. R., Alexander,
I. E., Koga, M., Shine, J., and Sutherland, R. L. (1988) Cancer Res. 48,4340-4347.
5. Reddel, R. R., Murphy,
L. C., Hall, R. E., and Sutherland,
R. L.
(1985) Cancer Res. 46,1525-1531.
COMPUTERIZED
6. Gillies,
R. J., Didier,
N., and Denton,
DETERMINATION
M.
(1986)
Anal.
OF
Biochem.
159,109-113.
7. Mosmann,
8. Denizot,
T. (1983)
F., and Lang,
J. Immunol.
R. (1986)
Methods
J. Immunol.
65,55-63.
Methods
89,
271-
277.
9. Alley, M. C., Scudiero,
D. A., Monks,
A., Hursey,
M. L., Czerwinski, M. J., Fine, D. L., Abbott,
B. J., Mayo,
J. G., Shoemaker,
R. H., and Boyd, M. R. (1988) Cancer Res. 48,589-601.
10. Peters, J. H., Baumgarten,
nale Antikorper:
Herstellung
Springer,
Berlin/Heidelberg/New
H., and Schulze, M. (1985) Monoklound Charakterisierung,
pp. 94-101,
York/Tokyo.
11. Carmichael,
J., DeGraff,
W. G., Gazdar,
A. F., Minna,
Mitchell,
J. B. (1987) Cancer Res. 47,936-942.
J. D., and
GROWTH
KINETIC
CURVES
267
12. Rooney,
D. E., and Czepulkowski
B. H. (1986) in Human
Cytogenetics, A Practical
Approach
(Rooney,
D. E., and Czepulkowski
B. H., Eds.), p. 10, IRL Press, Oxford/Washington,
DC.
13. Griffiths,
B. (1986) in Animal
Cell Culture,
Practical
Approach
(Freshney,
R. I., Ed.), p. 38, IRL Press, Oxford/Washington,
DC.
14. Osborne,
C. K., Hobbs, K., and Trent, J. M. (1987) Breast Cancer
Res. Treat. 9, 111-121.
15. Romijn,
J. C., Verkoelen,
C. F., and Schroeder,
F. H. (1988) Prostate 12,99-110.
16. Faraji-Shadan,
F., and Bowman,
P. D. (1989) Anal. Biochem.
177,259-262.
17. Roper, P. R., and Drewinko,
B. (1976) Cancer Res. 36,2182-2188.
18. Leonessa,
F., Coialbu,
T., and Toma, S. (1986) Anticancer
Res. 6,
1291-1296.


© Copyright 2026