
Resting fluctuations in arterial carbon dioxide
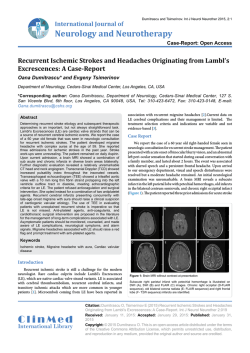
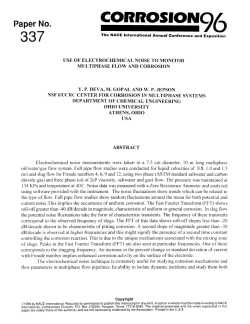
www.elsevier.com/locate/ynimg
NeuroImage 21 (2004) 1652 – 1664
Resting fluctuations in arterial carbon dioxide induce significant low
frequency variations in BOLD signal
Richard G. Wise, a,b,* Kojiro Ide, c,d Marc J. Poulin, c,d and Irene Tracey a,b
a
Centre for Functional Magnetic Resonance Imaging of the Brain (FMRIB), Department of Clinical Neurology, John Radcliffe Hospital,
University of Oxford, Oxford, OX3 9DU, UK
b
Department of Human Anatomy and Genetics, University of Oxford, Oxford, OX1 3QX, UK
c
Department of Physiology and Biophysics, Faculties of Medicine and Kinesiology, University of Calgary, Calgary Alberta, Canada T2N 4N1
d
Department of Clinical Neurosciences, Faculties of Medicine and Kinesiology, University of Calgary, Calgary Alberta, Canada T2N 4N1
Received 26 August 2003; revised 10 November 2003; accepted 21 November 2003
Carbon dioxide is a potent cerebral vasodilator. We have identified a
significant source of low-frequency variation in blood oxygen leveldependent (BOLD) magnetic resonance imaging (MRI) signal at 3 T
arising from spontaneous fluctuations in arterial carbon dioxide level
in volunteers at rest. Fluctuations in the partial pressure of end-tidal
carbon dioxide (PETCO2) of F1.1 mm Hg in the frequency range 0 – 0.05
Hz were observed in a cohort of nine volunteers. Correlating with these
fluctuations were significant generalized grey and white matter BOLD
signal fluctuations. We observed a mean (Fstandard error) regression
coefficient across the group of 0.110 F 0.033% BOLD signal change
per mm Hg CO2 for grey matter and 0.049 F 0.022% per mm Hg in
white matter. PETCO2-related BOLD signal fluctuations showed regional
differences across the grey matter, suggesting variability of the
responsiveness to carbon dioxide at rest. Functional magnetic
resonance imaging (fMRI) results were corroborated by transcranial
Doppler (TCD) ultrasound measurements of the middle cerebral artery
(MCA) blood velocity in a cohort of four volunteers. Significant
PETCO2-correlated fluctuations in MCA blood velocity were observed
with a lag of 6.3 F 1.2 s (mean F standard error) with respect to
PETCO2 changes. This haemodynamic lag was adopted in the analysis of
the BOLD signal. Doppler ultrasound suggests that a component of
low-frequency BOLD signal fluctuations is mediated by CO2-induced
changes in cerebral blood flow (CBF). These fluctuations are a source
of physiological noise and a potentially important confounding factor
in fMRI paradigms that modify breathing. However, they can also be
used for mapping regional vascular responsiveness to CO2.
D 2004 Elsevier Inc. All rights reserved.
Keywords: Carbon dioxide; fMRI; BOLD; Hypercapnia; Transcranial
Doppler ultrasound; Physiological noise
Introduction
Low-frequency fluctuations in the blood oxygen level-dependent (BOLD) signal are important components of noise in func* Corresponding author. Centre for Functional Magnetic Resonance
Imaging of the Brain (FMRIB), Department of Clinical Neurology, John
Radcliffe Hospital, University of Oxford, Oxford, OX3 9DU, UK. Fax:
+44-1865-222717.
E-mail address: [email protected] (R.G. Wise).
Available online on ScienceDirect (www.sciencedirect.com.)
1053-8119/$ - see front matter D 2004 Elsevier Inc. All rights reserved.
doi:10.1016/j.neuroimage.2003.11.025
tional magnetic resonance imaging (fMRI). Where their spectral
characteristics overlap with those of a stimulus paradigm, they are
problematic as they become more difficult to distinguish from the
signal of interest. Certain sources of low-frequency variation in the
BOLD signal have been identified and attempts made to correct
them. These include head motion, and cardiac and respiratory
changes that appear aliased into the fMRI time series (Biswal et al.,
1996).
In addition to such sources of noise, spontaneous low-frequency fluctuations in cerebral BOLD signal have been observed
(Biswal et al., 1995; Kruger and Glover, 2001). These are likely
to arise from haemodynamic and metabolic oscillations, although
their precise physiological origin is unclear. The fluctuations are of
interest for the information that they may yield about the cerebrovasculature. Low-frequency variations in oxygenation, cerebral
blood flow (CBF) and metabolism have been reported and are
reviewed by Obrig et al., (2000) in the same study as they observe
such variations using near infrared spectroscopy. Low frequency
haemodynamic oscillations may reveal autoregulatory mechanisms
of the brain vasculature (Diehl et al., 1995; Hu et al., 1999).
Fluctuations of neuronal origin, leading to BOLD fluctuations,
have also been postulated. Regions believed to be functionally
connected, often termed ‘‘resting-state networks’’, show BOLD
signal and CBF correlations in time in subjects at rest (Biswal et
al., 1997b; Lowe et al., 1998). In this study, we investigate another
source of widespread low frequency BOLD signal variation related
to carbon dioxide.
Carbon dioxide (CO2) in arterial blood is a potent vasodilator.
Hypercapnia arising from breath-holding or from breathing an
elevated concentration of CO2 increases the BOLD signal while
hypocapnia arising from hyperventilation reduces the BOLD signal
(Kastrup et al., 1998, 1999; Rostrup et al., 2000; Stillman et al.,
1995; Vesely et al., 2001). The CBF increase induced by hypercapnia results in increased venous oxyhaemoglobin concentration
and decreased venous deoxyhaemoglobin concentration producing
a longer T2* (Posse et al., 2001). Quantitative studies of cerebrovascular reactivity to CO2 have been performed using a range of
techniques besides MRI, including positron emission tomography
(PET) (Rostrup et al., 2000), 133Xe-washout (Mathew and Wilson,
1988; Olesen et al., 1971) and transcranial Doppler (TCD) ultra-
R.G. Wise et al. / NeuroImage 21 (2004) 1652–1664
sound (Poulin et al., 1998). In studies where volunteers breathed
air enriched with CO2 or hyperventilated, while controlling arterial
oxygen tension (PaO2), the change in middle cerebral artery (MCA)
blood velocity measured using TCD ultrasound was 2 – 5% per mm
Hg change in arterial carbon dioxide (Ide et al., 2003; Poulin et al.,
1996). Changes in MCA blood velocity may be used as an index of
cerebral blood flow under the reasonable assumption of invariant
arterial diameter (Poulin and Robbins, 1996). TCD ultrasound is
noninvasive with the advantage of near-continuous recordings of
blood velocity. At rest, changes in arterial carbon dioxide tension
PaCO2 can be represented by changes in the end-tidal partial
pressure of carbon dioxide (PETCO2) (Robbins et al., 1990; Young
et al., 1991).
Fluctuations in resting PETCO2 have been observed principally in
the range 0 – 0.05 Hz (Modarreszadeh and Bruce, 1994; Van den
Aardweg and Karemaker, 2002). The source of such fluctuations
may be the feedback control of breathing via chemoreflexes
seeking to maintain optimal blood gas parameters. Both fluctuations in arterial blood pressure and low frequency fluctuations in
PETCO2 have been associated with fluctuations in cerebral perfusion
represented by MCA blood velocity, measured using transcranial
Doppler ultrasound (TCD) (Mitsis et al., 2002; Panerai et al.,
2000). Spontaneous variations in PETCO2 have not been seen to
greatly affect arterial blood pressure.
While the effect of changes in PETCO2, induced by respiratory
challenges, on the BOLD signal has been studied, the influence of
spontaneous fluctuations in PETCO2 at rest has not been previously
investigated. Given the sensitivity of cerebral blood flow to carbon
dioxide and the existence of arterial carbon dioxide fluctuations,
we hypothesise that arterial carbon dioxide fluctuations cause
significant low-frequency variations in the BOLD MRI signal at
3 T. We investigated this hypothesis in two ways. We demonstrated
spontaneous fluctuations in end-tidal CO2 in volunteers at rest
during an fMRI scan and compared these with fluctuations in the
BOLD signal at 3 T. We also compared resting fluctuations in
right-sided MCA blood velocity, measured using transcranial
Doppler ultrasound, with fluctuations in end-tidal CO2.
Materials and methods
The procedures performed in this study were approved by the
Oxfordshire Clinical Research Ethics Committee (OxREC) and the
Conjoint Health Research Ethics Board at the University of
Calgary. Volunteers gave informed consent before taking part.
Functional magnetic resonance imaging
Measurements
Nine healthy volunteers (four male) underwent functional MRI
(30 F 7 years, mean F standard deviation). Imaging was performed at 3 T with an Oxford Magnet Technology, 1 m bore
magnet. The magnet was driven by a Varian Unity Inova console.
Gradient-echo echo-planar imaging (EPI) was performed giving
T2* weighting or BOLD contrast (image matrix: 64 64; 3 4mm pixels; echo time (TE): 30 ms).
Each volunteer underwent two fMRI scans of 12.5-min duration. A scan was performed with 24 contiguous axial slices of 6mm thickness covering the whole brain with a flip angle of 90j and
repetition time TR = 3 s. In the second scan, two axial slices of 6mm thickness were acquired. A flip angle of 40j and a TR = 0.25 s
1653
were used to provide better sampling of the respiratory and cardiac
cycles. One slice was positioned superior to the lateral ventricles,
while the other was positioned through the occipital cortex. Only
the superior slice is analysed and presented in this study, the
inferior slice being intended for use in another study. For each
subject, a T1-weighted structural scan (64 contiguous 3-mm axial
slices; in-plane field of view 256 mm, 1 1-mm pixels) was
acquired and used to assist in placing individual subjects’ data into
a common stereotactic space.
Subjects lying supine in the MRI scanner were instructed to
keep their eyes closed during functional scanning and not to fall
asleep. Subjects had at least 15 min at rest in the scanner before the
fMRI time series was acquired. Subjects wore a nasal cannula
through which respired gases were sampled by an MR compatible
patient monitor, incorporating a capnograph (Multigas 9500, MR
Equipment Corp., Bay Shore, NY) situated outside the magnet
room. The capnograph measured the PCO2 in the expirate by
exploiting the infrared absorption spectrum of CO2. The partial
pressure of CO2 was logged at 10-ms intervals using in-house
software (CCARM, FMRIB Centre, Oxford University, UK) and
PETCO2 was calculated for each breath (Matlab, v5, The MathsWorks Inc. Natick, MA). The combined gas transport delay and
dispersion along the sample tube was factored into the analysis of
the CO2 recordings. Subjects wore an MR compatible respiratory
monitor (MR Equipment Corp.) consisting of bellows around the
chest, the internal pressure of which encoded the chest position and
hence the phase of the breathing cycle. Triggers for each scanner
volume acquired were logged in synchrony with physiological
quantities to allow accurate synchronization with fMRI data.
Image analysis
Image analysis to reveal significant PETCO2-related changes in
blood oxygen level-dependent (BOLD) signal was performed on
each subject’s data using the FEAT software (FMRIB Expert
Analysis Tool, v5, http://www.fmrib.ox.ac.uk/fsl, Oxford University, UK) (Smith et al., 2001). Preprocessing steps were applied to
each subject’s time series of fMRI volumes: motion correction
(Bannister and Jenkinson, 2001; Jenkinson and Smith, 2001);
spatial smoothing using a Gaussian kernel of full-width-halfmaximum 5 mm; high-pass temporal filtering (Gaussian-weighted
least squares straight line fitting, with a high-pass filter cut-off of
90 s) and subtraction of the mean of each voxel time-course from
that time-course.
Linear models were constructed to describe the data. The main
covariate of interest was the PETCO2 time series convolved with a
gamma-variate haemodynamic response function of width 6 s and
a mean lag (6.3 s) that was established from TCD ultrasound
measurements of MCA velocity, described below. Hence, the delay
between PETCO2 and blood flow changes observed independently
with the TCD ultrasound was incorporated into the analysis of the
BOLD signal with a physiologically reasonable temporal dispersion. The form of this assumed haemodynamic response is similar
to the CBF impulse response function previously measured using
TCD ultrasound resulting from fluctuations in PETCO2 (Panerai et
al., 2000). Covariates of no interest included in the model were
motion parameters, established from the motion correction procedure during fMRI signal preprocessing, and the bellows-encoded
chest position at the time of each slice acquisition. Chest position
was included to account for signal changes that may arise from
chest movements and respiration (Hu et al., 1995), for example,
susceptibility induced B0-related shifts and intensity changes (Raj
1654
R.G. Wise et al. / NeuroImage 21 (2004) 1652–1664
et al., 2000). Covariates in the model were high-pass filtered in the
same manner as the fMRI data. The PETCO2 time series was
orthogonalised with respect to the covariates of no interest.
Orthogonalisation was achieved by subtracting from the PETCO2
time series that part which relates to the covariates of no interest,
for example, orthogonalisation of vector v1 with respect to vector
v2 gives v1V = v1 (v2 v1) v2 / ||v2||2. This forces the PETCO2 time
series vector in the linear model to be completely independent of
the covariates of no interest, that is, contains no component related
to them. This results in a conservative estimate of the BOLD signal
change related to PETCO2, where PETCO2 fluctuations might correlate
with the low-frequency variation in the head or chest position
through changes in breathing. A less conservative estimate of
PETCO2-related BOLD fluctuations may be made by not orthogonalising with respect to the covariates of no interest.
The fMRI signal was linearly modeled on a voxel by voxel
basis using FMRIB’s improved linear model (FILM) with local
autocorrelation correction (Woolrich et al., 2001). This constitutes
the first level regression analysis. Equivalent models were applied
to the data acquired with TR = 3 s and TR = 0.25 s. The data
acquired with TR = 0.25 s were also down-sampled to TR = 3 s
and modeled in the same manner. For the whole-brain data with
TR = 3 s, regression coefficients at each image voxel were
transformed to Z statistics indicating the statistical significance of
the PETCO2-related BOLD signal change. The significance threshold at the voxel level was chosen at Z > 2.3. For each resulting
cluster of spatially connected voxels surviving the Z threshold, a
cluster probability threshold of P = 0.01 was applied to the
computed significance of that cluster (Forman et al., 1995; Friston
et al., 1994; Worsley et al., 1992).
Following coregistration of the fMRI volumes and the T1weighted individual structural scan (FMRIB Linear Image Registration Tool) (Jenkinson and Smith, 2001), regions of grey and
white matter were automatically identified from the T1-weighted
scans (FMRIB Automated Segmentation Tool) (Zhang et al.,
2001). Within those regions showing significant PETCO2-related
BOLD signal changes, the R2 statistic between the PETCO2 and
each voxel’s time series was calculated and averaged within the
grey and white matter to estimate the fraction of BOLD signal
variance explained by PETCO2 variability. To provide upper and
lower bounds to the estimate of CO2-related BOLD signal
variability, R2 was calculated for the PETCO2 time series both
without and with orthogonalisation with respect to the covariates
of no interest. Calculation of R2 was also repeated for the spatial
mean BOLD time series for those significant regions of grey and
white matter.
A voxel-wise analysis of the significance of the subjects’
BOLD-PETCO2 regression coefficients was performed across the
group for the whole-brain data acquired with TR = 3 s. This
second-level mixed-effects group analysis (FEAT v5) (Beckmann
et al., 2003; Behrens et al., 2003) was performed using the firstlevel regression results, following the coregistration of each scan to
the standard of the Montreal Neurological Institute (MNI). A
group-representative map of BOLD-PETCO2 regression (reactivity
of the BOLD signal to PETCO2 fluctuations) was calculated in the
second-level analysis and converted to a percentage change in
BOLD signal per mm Hg change in PETCO2 (% DSBOLD/mm Hg).
The significance of the PETCO2-related BOLD signal changes was
displayed as a Z score map. The significance threshold at the voxel
level was chosen at Z > 2.0. For each resulting cluster of spatially
connected voxels surviving the Z threshold, a cluster probability
threshold of P = 0.05 was applied to the computed significance of
that cluster.
To further examine regional differences in BOLD signal reactivity to CO2, a region of interest analysis was performed. For each
subject, the regression coefficient for each image voxel relating
PETCO2 and BOLD signal from the first level analysis was scaled to
% DSBOLD/mm Hg. The mean % DSBOLD/mm Hg was calculated
for the grey and white matter for each subject and a group mean
established and tested for significance across subjects with a onetailed Student’s t test. This was repeated for the three datasets:
whole-brain TR = 3 s, single slice TR = 0.25 s and single slice TR =
0.25 s down-sampled to 3 s. The responsiveness to carbon dioxide
within different regions of the grey matter was investigated further
using whole-brain data acquired with TR = 3 s. The following grey
matter regions of interest were defined using the standard brain of
the MNI: thalamus, striatum, cerebellum, insular cortex, frontal
cortex, sensory cortex (primary and secondary combined), occipital
cortex, temporal cortex and posterior parietal cortex. For each
region, the left and right sides of the brain were pooled as no
laterality difference was expected. The regional mean % DSBOLD/
mm Hg was calculated for each subject. Group mean values were
tested for significance across subjects with one-tailed Student’s t
test. A repeated measures (within subject) analysis of variance was
also performed with a main effect of grey matter region.
The sensitivity of measured PETCO2-related BOLD signal
changes to changes in temporal filtering was investigated using
the whole-brain TR = 3 s data. The fMRI signal preprocessing
steps described above were repeated using temporal filtering with a
high-pass filter cut-off of 30 s and also with no temporal filtering,
for comparison with the 90-s high-pass filter cut-off. Regional
mean grey matter and mean white matter fMRI time series were
calculated for each subject and regressed, using FILM, against the
equivalently filtered (orthogonalised) PETCO2 time series employing
the haemodynamic lag of 6.3 s. The significance (Z scores) of the
regression was compared among filters of 30 s, 90 s and no
filtering using two-tailed t tests.
Transcranial Doppler (TCD) ultrasound
Measurements
Three healthy male volunteers and one female volunteer (27 F
3 years, mean F standard deviation) were examined. The laboratory in which TCD ultrasound measurements were made was at a
mild altitude of 1103 m (barometric pressure: approximately 660
mm Hg) compared to the fMRI scanner. Subjects lay supine and at
rest for at least 15 min before TCD ultrasound measurements
began. Backscattered Doppler signals from the MCA were measured by using a 2-MHz pulsed Doppler ultrasound system (TC22,
SciMed, Bristol, UK). The MCA was identified by an insonation
pathway through the right temporal window just above the zygomatic arch by using search techniques described previously (Poulin
et al., 1996). The position and insonation angle of the TCD probe
were adjusted to provide Doppler spectra of the MCA with
maximal reflected power. The maximum frequency of Doppler
shift, namely, peak velocity (Vp), was taken as the primary index of
CBF (Poulin and Robbins, 1996) and was recorded every 10 ms.
TCD recordings were made for 30 min while subjects breathed
air through a mouthpiece with the nose occluded by a nose clip.
Subjects were instructed to remain at rest with their eyes closed and
not to fall asleep. Respired gas was analysed by a mass spectrometer (AMIS 2000, Innovision, Odense, Denmark). PCO2 was
R.G. Wise et al. / NeuroImage 21 (2004) 1652–1664
1655
recorded every 10 ms and PETCO2 was identified for each breath
using dedicated software (BreatheM v2.07, University Laboratory
of Physiology, Oxford, UK). Respiratory flow direction and timing
information were measured with a turbine volume transducer
(VMM-400, Interface Associates, CA, USA).
Analysis
Vp was averaged over each heartbeat to give the beat-by-beat
values (V¯p). The beat-by-beat (V¯p) and breath-by-breath (PETCO2)
data were cross-correlated. This established the time difference at
which PETCO2 correlated best with V¯p and hence the lag of DV¯p
after DPETCO2. PETCO2 and V¯p were resampled into 3-s time
periods to enable comparable analyses of both TCD data and
fMRI data acquired with a TR = 3 s. TCD velocity data were
normalised to the session mean value (V¯p % of mean).
TCD velocity data were analysed in the same manner as the
fMRI time series to enable fair comparison among the modalities.
The PETCO2 and V¯p signals were high-pass filtered to remove lowfrequency drifts. The PETCO2 waveform was convolved with the
gamma-variate haemodynamic response function with mean lag
(6.3 s) equal to the group mean lag between PETCO2 and V¯p,
described above. Linear regression was performed between the
resulting V¯p and PETCO2 waveforms (Woolrich et al., 2001). The
significance of the regression was established for each subject
(one-tailed test generating a Z score, converted to a P value).
Results
Fluctuations in end-tidal carbon dioxide (PETCO2)
Fig. 1 illustrates a time series of PETCO2 during a TCD
ultrasound session and corresponding normalised beat-averaged
TCD – MCA blood velocity. Fig. 2a shows PETCO2 from a volunteer recorded at rest in the MRI scanner. The PETCO2 fluctuations
lie principally in the frequency range 0 – 0.05 Hz (Fig. 2b). This is
the frequency range in which many behavioural fMRI paradigms
lie. The Nyquist sampling frequency limit for PETCO2 is approximately 0.1 Hz assuming a breathing period of 5 s. Fluctuations of
order F1 mm Hg (coefficient of variation: approximately 3%) in
PETCO2 were observed in volunteers at rest in the MRI scanner and
during TCD ultrasound (Table 1). The baseline PETCO2 level was
significantly lower during TCD ultrasound. This is explained by
Fig. 2. (a) End-tidal partial pressure of carbon dioxide (PETCO2) recorded
breath-by-breath from a typical volunteer during an fMRI session lasting
12.5 min. (b) Power spectrum of the PETCO2 recording shown in panel (a)
following high-pass (90 s) temporal filtering.
the higher altitude at which these measurements were made, in
comparison to the fMRI scans. Unpaired, two-tailed t tests
indicated that there was no significant difference between the
standard deviation of PETCO2 within session for the TCD measurements and the fMRI scans. The difference in altitude caused no
difference in the degree of PETCO2 fluctuation and was therefore
Fig. 1. End-tidal partial pressure of the carbon dioxide (PETCO2) recorded breath-by-breath from one volunteer and normalised beat-by-beat mean peak velocity
(V¯p %) in the MCA measured using transcranial Doppler ultrasound. For clarity of display, 10 min of the 30-min acquisition is shown. PETCO2 and V¯p are
displayed without the temporal filtering described in Materials and methods. The subject shows a significant regression between PETCO2 and V¯p (P < 0.01).
1656
R.G. Wise et al. / NeuroImage 21 (2004) 1652–1664
Table 1
End-tidal carbon dioxide (PETCO2) during middle cerebral artery transcranial
Doppler ultrasound and fMRI
MCA TCD
ultrasound
(n = 4)
fMRI
TR = 3 s
(n = 9)
fMRI
TR = 0.25 s
(n = 9)
Mean PETCO2 F standard error 36.2 F 1.38* 42.6 F 0.80 42.5 F 0.55
across cohort (mm Hg)
Mean PETCO2 standard deviation 1.17
1.06
1.14
within session (mm Hg)
Mean coefficient of
3.2%
2.5%
2.7%
variation within session
* P <0.01, significantly different from PETCO2 during fMRI scans with TR =
3 and 0.25 s (two-tailed Student’s t test).
unlikely to influence any PETCO2-related fluctuations in cerebral
haemodynamics.
Fluctuations in MCA blood velocity
The group mean (Fstandard error), temporal-mean peak velocity (V¯p) of blood in the MCA was 64.5 F 7.7 cm/s. The mean
coefficient of variation of V¯p in time across the group was 4.9%.
The correlation between normalised MCA blood velocity (V¯p%)
and PETCO2 is qualitatively apparent in Fig. 1. Cross-correlation
between PETCO2 and V¯p indicated that the resting changes in V¯p
lagged the changes in PETCO2 by 6.3 F 1.2 s (group mean F
standard error). Incorporating this response lag of the blood
velocity, the linear regression between filtered PETCO2 and V¯p
signal was significant in all four subjects (P < 0.01). The group
mean blood velocity CO2 regression coefficient across the group is
given in Table 2. This was significantly greater than zero, indicating that changes in PETCO2 at rest are positively associated with
increases in MCA blood velocity.
Fluctuations in BOLD signal
The mean grey matter and white matter BOLD contrast time
series from one subject is shown in Fig. 3 for the acquisition with
TR = 3 s and also TR = 0.25 s, along with the corresponding
PETCO2 waveform. Data are plotted after temporal filtering as
described above. The correspondence between low-frequency
fluctuations in the grey and white matter is clear. For TR = 3 s
(Figs. 3a – c) and TR = 0.25 s (Figs. 3d – f), the association, for the
volunteer shown, between PETCO2 and BOLD signal is apparent.
The high frequency noise, likely to arise largely from respiratory
and cardiac cycles, is apparent in the data acquired with TR = 0.25
s (Figs. 3d and e). In the data acquired with TR = 3.0 s (Figs. 3a
and b), these noise components would be aliased to low frequencies. Fig. 3 therefore suggests that the low-frequency signal
fluctuations apparently related to PETCO2 fluctuations do not arise
from aliased cardiac or respiratory noise sources. Further evidence
for this is the lack of significant difference in the BOLD sensitivity
to PETCO2 fluctuations (mean regression coefficients, Table 2)
calculated from the single slice data acquired with TR = 0.25 s
and the same datasets down-sampled to TR = 3 s, in which the high
frequency noise sources would be expected to appear at low
frequency.
In both the fMRI data acquired with flip angle 90j and TR = 3 s,
and flip angle 40j and TR = 0.25 s, there is a positive regression
between the PETCO2 and BOLD signal that is significant across the
group (Table 2). The PETCO2 effect on the BOLD signal is larger in
grey matter than white matter (P < 0.01, paired one-tailed t test for
both TR = 3 and 0.25 s). The PETCO2 effect on the BOLD signal
also tends to be larger, although not significantly, for the single
slice acquired superior to the lateral ventricles with TR = 0.25 s,
than for the brain as a whole with TR = 3 s. This difference may
arise from regional variations in vascular properties, for example,
density, reactivity and latency of reactivity to CO2 and from inflow brightening effects which would be greater at TR = 0.25 s
than 3 s.
Within the grey matter, the group mean of the standard
deviation of the BOLD time-course in each voxel was 1.07%,
while in white matter this was 0.65%, indicating greater noise in
grey than white matter. The group mean of the temporal standard
deviation of the fitted (orthogonalised) PETCO2-related signal
change was 0.094% in grey matter, while in white matter this
was 0.055%. The magnitude of the PETCO2-related signal fluctuations is therefore approximately 8 – 9% of magnitude of the total
BOLD fluctuations.
Table 3 shows the R2 statistic (square of the correlation
coefficient) for those grey and white matter regions whose BOLD
signal showed a statistically significant regression with PETCO2,
identified from the first-level linear regression analysis. The
fraction of voxels whose BOLD signal fluctuations are related to
PETCO2 is significantly greater for grey matter than white matter
(P < 0.01, paired, one-tailed t test). Mean values of R2 are given for
PETCO2 both orthogonalised and non-orthogonalised with respect to
the covariates of no interest with which PETCO2 might correlate.
These R2 statistics therefore provide an estimate of the lower and
upper bounds, respectively, of the BOLD signal variance that is
explained by PETCO2 fluctuations. Thus R2 was significantly greater
for the non-orthogonalised than the orthogonalised PETCO2 time
series (P < 0.05, paired, one-tailed t test). In those regions showing
a significant PETCO2 effect, the proportion of BOLD signal variation explained by PETCO2 at the voxel level, that is, R2 calculated
Table 2
Regression between normalised middle cerebral artery blood velocity (V¯p) and end-tidal carbon dioxide (PETCO2), and BOLD fMRI signal and PETCO2
MCA TCD ultrasound
(n = 4) (% DV¯p/mm Hg)
Mean regression coefficient F
standard error across cohort
1.7 F 0.41a
Grey matter
White matter
fMRI TR = 3 s
(n = 9), whole brain
(% DSBOLD/mm Hg)
fMRI TR = 0.25 s
(n = 9), one slice
(% DSBOLD/mm Hg)
fMRI TR = 3 sa
(n = 9), one slice
(% DSBOLD/mm Hg)
0.110 F 0.033**
0.049 F 0.022*
0.137 F 0.034**
0.074 F 0.022**
0.142 F 0.042**
0.075 F 0.023**
Regression coefficients are expressed as fractional percentage changes in blood velocity (DV¯p %) or BOLD signal (DSBOLD %) per mm Hg change in PETCO2.
Regression was performed with a lag of 6.3 s introduced into the PETCO2 waveform, as described in Materials and methods.
Significantly greater than zero indicated by a one-tailed Student’s t test at *P < 0.05 and **P < 0.01.
a
Data derived from single slice TR = 0.25 s time-series, down-sampled to TR = 3 s.
R.G. Wise et al. / NeuroImage 21 (2004) 1652–1664
1657
Fig. 3. Mean grey matter (a) and white matter (b) BOLD signal acquired over the whole brain with TR = 3.0 s from one subject. (c) Panel shows the
corresponding partial pressure of end-tidal carbon dioxide (PETCO2) recorded breath-by-breath from the subject during the fMRI scan. Mean grey matter (d) and
white matter (e) BOLD signal acquired from a single slice superior to the lateral ventricles with TR = 0.25 s from the same subject. (f) Panel shows the
corresponding partial pressure of end-tidal carbon dioxide (PETCO2) recorded breath-by-breath from the subject during the fMRI scan. The data are plotted after
high-pass (90 s) filtering and PETCO2 was convolved with the gamma-variate haemodynamic response function. The subject shows a significant regression
between PETCO2 and mean grey and white matter time-courses for TR = 3 and 0.25 s (P < 0.01, FILM with local autocorrelation correction).
1658
R.G. Wise et al. / NeuroImage 21 (2004) 1652–1664
Table 3
R2 statistic between the PETCO2 and BOLD signal in the fraction of voxels showing a significant PETCO2 regression
Grey matter
White matter
Mean percentage of voxels
showing significant PETCO2
regression
Voxel-wise mean R2
R2 from regional mean BOLD signal
Orthogonalised
Non-orthogonalised
Orthogonalised
Non-orthogonalised
18.5 F 4.2**
13.7 F 3.3
0.047 F 0.008
0.044 F 0.007
0.065 F 0.012z
0.059 F 0.011*
0.157 F 0.017y
0.153 F 0.016y
0.241 F 0.036*,y
0.223 F 0.039*,y
Group mean (n = 9) R2 values are given F standard error for orthogonalised and non-orthogonalised PETCO2 (with respect to motion correction parameters and
chest position) giving estimates of the lower and upper bounds, respectively, of the proportion of BOLD signal variance explained by PETCO2 variation. R2 values
were calculated from the whole brain data (TR = 3 s) only from those regions identified as having a significant PETCO2 regression in the first level regression
analysis of each subject.
Significantly greater percentage of voxels in the grey matter than white matter showing a relationship to PETCO2, indicated by a one-tailed paired Student’s t test
at **P < 0.01.
Significantly greater R2 for non-orthogonalised than for orthogonalised PETCO2, indicated by a one-tailed paired Student’s t test at *P < 0.05 and zP < 0.01.
Significantly greater R2 for regional mean BOLD signal than from a voxel-wise mean of R2, indicated by a one-tailed paired Student’s t test at yP < 0.001.
voxel by voxel and then averaged over space, is up to 6.5%.
However, when the voxel time series is spatially averaged and then
correlated with PETCO2, up to 24% of the regional time series
variance is explained by PETCO2 (difference significant at P <
0.001, paired, one-tailed t test).
Regional BOLD signal sensitivity to carbon dioxide
Fig. 4a illustrates the group-representative regional distribution
of PETCO2-related BOLD signal fluctuations, while Fig. 4b illustrates the statistical significance of these PETCO2-related BOLD
fluctuations. The coloured regions of Fig. 4b are those in which
the signal variations related to the PETCO2 are significant in comparison to the other noise processes contributing to BOLD signal
fluctuations. The PETCO2-related BOLD fluctuations are concentrated primarily in the grey matter as suggested by the regression
coefficients for grey and white matter (Table 2). The significant
regions of BOLD fluctuation are widespread and bilaterally symmetric but with the most significant changes concentrated in the
occipital, parietal and temporal lobes as well as in the cingulate
cortex.
The regional differences in the sensitivity of the grey matter
BOLD signal to PETCO2 fluctuations are further illustrated in Fig. 5.
For the PETCO2-haemodynamic response model assumed for this
study, the BOLD signal response to CO2 was significantly greater
than zero at the significance level P < 0.05 for grey matter in the
cerebellum, insular cortex, frontal cortex, sensory cortex and also
in white matter, and greater than zero at the significance level P <
0.01 for grey matter in the occipital cortex, temporal cortex and
posterior parietal cortex (one-tailed t test across the group). The
repeated measures analysis of variance of the regression coefficients showed a significant (P < 0.01) within subject effect of the
grey matter region. The white matter was excluded from the
comparison as this had already been shown to be significantly
different from the grey matter. The resting PETCO2 fluctuations
therefore reveal the differential sensitivity of grey matter regions to
CO2. Post hoc t tests (one-way, uncorrected for multiple comparisons) showed differences at the level of P V 0.01 between the
cerebellum and temporal cortex, between posterior parietal cortex
and sensory cortex, between thalamus and frontal cortex and
between the striatum and insular cortex, frontal cortex, occipital
cortex, temporal cortex and posterior parietal cortex. The temporal,
occipital and parietal cortices show the greatest sensitivity to
PETCO2 fluctuations which is consistent with Fig. 4b.
There was no significant difference among the Z scores for the
regression with PETCO2 for the three different levels of high-pass
Fig. 4. (a) Percentage of BOLD signal change per unit of fluctuation in PETCO2 mapped across sagittal, coronal and axial brain sections: group representative
map from the second level analysis (n = 9). The red lines indicate the edges of the brain derived from the MNI standard brain. (b) Group map of statistical
significance (mixed-effects analysis) of regression between BOLD and PETCO2 (PETCO2-related signal changes). Significant regions are displayed with a
threshold of Z > 2.0 and with a cluster probability threshold applied of P < 0.05 superimposed upon the group-mean structural scan.
R.G. Wise et al. / NeuroImage 21 (2004) 1652–1664
Fig. 5. Percentage of BOLD signal change per unit fluctuation in PETCO2 in
a range of grey matter brain regions and in white matter. Error bars indicate
the standard error of the mean. *P < 0.05 and **P < 0.01 for a one-tailed t
test comparing the mean for each region to zero. Abbreviations for the
regions are: th, thalamus; st, striatum; cb, cerebellum; in, insular cortex; fr,
frontal cortex; sn, sensory cortex; oc, occipital cortex; te, temporal cortex;
pp, posterior parietal cortex; and wm, white matter. Regions from the left
and right sides of the brain are combined. A repeated measures one-way
analysis of variance showed a significant (P < 0.01) within subject effect of
grey matter region.
filtering: 30 s cut-off, a 90 s cut-off or no temporal filtering (P >
0.05, two tailed paired t tests). This was the case for both grey and
white matter fMRI time series. The influence of different haemodynamic response delays on the regression was examined using the
90-s filtered fMRI data from one subject. The regional mean grey
and white matter signals were regressed, using FILM, against the
(orthogonalised) PETCO2 time series using a range of different
haemodynamic response delays. In grey and white matter, the
regression was significant (Z > 2.3, P < 0.01) for delays between
approximately 3 and 13 s with the maximum significance at a delay
of 8 s for grey matter and 7 s for white matter. These are close to
the 6.3 s established from TCD ultrasound that was adopted in the
fMRI analysis.
Discussion
Reactivity to CO2
The data presented suggest that spontaneous fluctuations in
arterial PCO2 cause BOLD signal fluctuations at a level that is
detectable and significant. This is consistent with the potent vasodilatory effects of carbon dioxide and the corresponding increases
in CBF and CBV that an increase in carbon dioxide produces
(Grubb et al., 1974). Our transcranial Doppler ultrasound measurements of MCA blood velocity provide independent corroboration
of the MRI BOLD results and confirm the existence of CO2-related
fluctuations in cerebral blood flow. The estimated delay of CBF
changes following spontaneous changes in PETCO2 of 6.3 s would
consist of the transport delay of blood from the lungs to the brain
and the time for the vasculature to respond. This independently
measured time lag of the vascular response was successfully
adopted for identifying the PETCO2-related BOLD fluctuations.
1659
The delay time is in broad agreement with previous measurements
of approximately 5 – 10 s (Mitsis et al., 2002; Panerai et al., 2000)
for PETCO2 fluctuations. It is also in broad agreement with the
delays observed in CO2 challenges during TCD ultrasound (Poulin
et al., 1996) and during BOLD contrast fMRI (Posse et al., 1997;
Rostrup et al., 2000).
The reactivity of TCD-measured MCA blood velocity to
changes in PETCO2 (Table 2) is similar to that from the previous
study of PETCO2 fluctuations (approximately 2%/mm Hg after a lag
of 6 s; Panerai et al., 2000) and slightly lower than values obtained
during ‘‘steady-state’’ CO2 challenges (approximately 2 – 5%/mm
Hg; Poulin et al., 1996) (Ide et al., 2003). Previous MRI investigations of hypo- or hypercapnia and BOLD contrast have
revealed steady-state BOLD – PETCO2 reactivity in the range of
0.1 – 0.4%/mm Hg in grey matter and approximately 0.1%/mm
Hg in white matter at 1.5 T (Posse et al., 1997, 2001; Rostrup et al.,
2000). From resting fluctuations we estimated similar values for
the grey and white matter (Table 2 and Fig. 5) at 3 T. However, by
analogy with activation studies, we might expect a larger BOLD
reactivity to CO2 at 3 T compared to 1.5 T. The observed TCDMCA CBF and BOLD reactivity to CO2 from resting fluctuations
may be slightly lower than compared to previous steady-state
challenges for two reasons. The blood flow reactivity to CO2 is
lower around the normal resting PETCO2 (i.e., eucapnia) than during
hypercapnia. The fluctuations in PETCO2 are dynamic and there is a
finite time constant with which the cerebral vasculature responds to
CO2 (Panerai et al., 2000; Poulin et al., 1996). Changes in CBF are
therefore unlikely to come into equilibrium with PaCO2 during
transient fluctuations.
Regional differences in reactivity
PETCO2-related BOLD signal fluctuations were significantly
larger in the grey matter than in the white matter. This is likely
to reflect differences in metabolic activity, vascular regulation and
capillary density. The white matter has a lower blood volume and
metabolic activity than the cortical grey matter. There is also
evidence that the rate at which BOLD signal changes take place
in the white matter is slower than in the grey matter (Rostrup et al.,
2000), although a longer delay was not seen in the example given
in the present study. We observed regional differences in the
reactivity of the BOLD signal to CO2 in the grey matter (Figs. 4
and 5). This may also reflect regional differences in metabolic
activity and vascular regulation. A major influence is likely to be
resting values of cerebral blood volume (CBV) and regional
microvascular anatomy (Bandettini and Wong, 1997; Boxerman
et al., 1995a,b). For example, the relatively high BOLD signal
changes observed in the visual cortex during functional activation
could be partly attributable to the microvascular anatomy of the
region, known to contain a high concentration of venules (Davis et
al., 1998). There may also be regional differences in the biochemical mechanisms causing vessel dilation as well as a potentially
small effect at TR = 3 s (Speck and Hennig, 1998) of regional
differences in blood flow causing different levels of inflow
brightening through an apparent rise in T1 relaxation. This may
contribute to the slightly higher BOLD reactivity observed for the
data acquired with TR = 0.25 s than that acquired with TR = 3 s.
Consistent with our results, Rostrup et al. (2000) found the
temporal and occipital grey matter to have a large BOLD signal
change in response to a CO2 challenge, Posse et al. (1997) found
greatest sensitivity to hypocapnia in the frontal, occipital and
1660
R.G. Wise et al. / NeuroImage 21 (2004) 1652–1664
parietal regions and Kastrup et al. (1999) found larger BOLD
sensitivity to breath-hold in sensory-motor and visual areas than
frontal areas but reported, in contrast to the present study, even
greater sensitivity in the cerebellum. Regional variability of reactivity may differ across studies because of the differing source and
temporal nature of the CO2 variation and the field strength at which
measurements were performed. Most previous reports have used
sustained CO2 challenges at 1.5 T.
In agreement with our results, the responsiveness compared to
cortical grey matter was reported by Kastrup et al., (1999) to be
low in the basal ganglia and by Posse et al., (1997) to be low in
striatum and thalamus. In our study, the apparent lower sensitivity,
although not statistically significant, of thalamic and striatal
regions compared to white matter and the comparatively low
sensitivity in the cerebellum (Kastrup et al., 1999) may be partly
attributable to partial volume errors with the white matter. Furthermore, our study was designed to make use of the single delay
time (6.3 s) between changes in PETCO2 and BOLD signal that was
estimated from MCA TCD ultrasound measurements of CBF
velocity. We used this independent data to inform our BOLD
signal analysis without reference to the BOLD signal itself to
identify the haemodynamic delay. These independent data
strengthen the conclusion that PETCO2 fluctuation is a source of
BOLD fluctuation. Regional differences in the delay or form of the
haemodynamic response to CO2, both within and between regions,
may contribute to apparent differences in the BOLD sensitivity to
CO2. This is unlikely to explain all regional differences as previous
studies with hypercapnia challenges of comparatively long duration have also revealed regional differences in CO2 sensitivity
(Kastrup et al., 1999). Regional values for the delay of response to
hypocapnia in the range of 5 – 12 s have been suggested by Posse et
al., (1997). This is consistent with the haemodynamic delay for the
BOLD signal in our example volunteer and that used in our study
as a whole.
The magnitude of a BOLD signal change depends upon DT2*,
T2* and the echo time (TE). The largest signal changes occur when
TE c T2*. T2* may differ across anatomical regions as a result of
through-slice dephasing effects arising from field gradients due to
susceptibility changes. The regional differences in response to CO2
may, in part, also result from variation in T2* across the brain. A
single TE of 30 ms was used in this study as a compromise for
BOLD sensitivity between brain areas with a longer TE (Wansapura et al., 1999) and shorter TE due to susceptibility gradients, for
example, orbitofrontal areas (Deichmann et al., 2002; GornoTempini et al., 2002). However, a single TE is therefore unlikely
to provide optimal BOLD signal change sensitivity across all brain
regions. The present study did not map T2*, which depends in part
on the shim during a particular session and imaging parameters
such as slice thickness. Mapping of T2* in each subject using a
multiecho sequence and comparing the PETCO2-related signal
changes at different TEs would reveal the optimal TE for each
region (Kruger and Glover, 2001; Kruger et al., 2001; Posse et al.,
1999; Speck and Hennig, 1998; Wansapura et al., 1999). At 3 T,
Clare et al. (2001) demonstrated this by determining optimal TEs
in auditory and motor cortices to fall between 30 and 45 ms, and
between 25 and 30 ms for the visual cortex, albeit from coronal
image slices of 10-mm thickness. Differences in baseline T2* are
unlikely to explain all of the regional differences in BOLD
sensitivity because for a particular T2*, the variation of BOLD
sensitivity with TE is relatively flat around the optimal value
(Deichmann et al., 2002). Furthermore, we observed adjacent
regions, expected to have a similar T2*, for example, occipital
grey and white matter (Wansapura et al., 1999), that appear to have
a considerably different responsiveness to CO2 (Fig. 4).
PETCO2 variation as a source of BOLD fluctuations
Previous studies of respiratory physiology have documented
temporal fluctuations in PETCO2 (Lenfant, 1967) as those observed in this study but have not related them to low-frequency
MRI BOLD signal fluctuations. The fluctuations in PETCO2 are
likely to be the result of spontaneous noise in the respiratory
system that is then filtered by the chemoreflex and influenced
by the feedback control of breathing and associated fluctuations
in ventilation. Adding to noise in the respiratory system could
be sighs and changes in CO2 production or cardiac output
(Modarreszadeh and Bruce, 1994; Van den Aardweg and Karemaker, 2002).
The mild altitude (1103 m) at which the TCD measurements
were made, compared to the fMRI measurements nearer sea level,
may decrease the mean level of PETCO2 recorded from volunteers.
However, it is not expected to substantially influence the sensitivity
of CBF velocity to PETCO2 changes, although the effect of longterm exposure to mild altitude remains to be fully investigated, as
discussed by Ide et al. (2003).
It is unlikely that the observed low-frequency BOLD signal
changes result from the effects of chest motion, susceptibility
changes during breathing or cardiac pulsatility. PETCO2 fluctuations
tend to lie in the range 0 – 0.05 Hz, while respiration lies in the
range 0.1 – 0.3 Hz and cardiac cycle is between 0.5 and 2 Hz. These
effects, aliased in the data acquired with TR = 3 s, would not be
aliased when TR = 0.25 s as they would be adequately sampled in
time. The CO2-related low-frequency fluctuations are still observed
in the BOLD signal even when TR = 0.25 s. The regression
coefficients between BOLD signal change and PETCO2, for both
grey and white matter, show no significant difference when derived
from data sampled with TR = 0.25 s and data down-sampled to 3.0
s. Hence, the effects of the respiratory or cardiac cycles and the
changes in PETCO2 appear separable by the different frequencies at
which they occur. Furthermore, to reduce the potential confounding effects of the respiratory cycle and changes in ventilation, the
chest position was encoded using bellows and included in the
general linear model regression analysis as a covariate of no
interest.
Changes in the arterial partial pressure of oxygen (PaO2) are
unlikely to cause the observed BOLD signal fluctuations through
changes in oxygen saturation. In resting humans, PETCO2 and PETO2
fluctuate in antiphase. PETO2 was not measured during fMRI
scanning in this study. However, compared to PaCO2, cerebral
blood flow is relatively insensitive to small changes in PaO2 around
the normal level (Gupta et al., 1997). Fluctuations in PaO2 are
therefore much less likely to cause significant CBF fluctuations.
Within the normal range of PaO2, arterial oxygen saturation is
insensitive to small changes in PaO2; hence, the BOLD signal is
likely to be only slightly affected. In addition, PaO2 fluctuations
opposite in direction to PETCO2 would drive the BOLD signal in the
opposite direction to the PETCO2 change.
Other sources of low frequency BOLD fluctuations
There is evidence of spatially correlated, low-frequency oscillations from other sources besides carbon dioxide. Fluctuations of
R.G. Wise et al. / NeuroImage 21 (2004) 1652–1664
neuronal, metabolic and vascular origin have been suggested
(Elwell et al., 1999; Hudetz et al., 1998; Obrig et al., 2000). The
relative influence of these fluctuations on the BOLD signal is still
to be quantified. Vascular fluctuations include oscillations of
intracranial pressure and cerebral blood flow velocity (CBFV)
with a frequency of 0.008 – 0.05 Hz, known as B waves (Lundberg,
1960). These spontaneous CBFV fluctuations are thought to be
caused by changes in blood vessel diameter (Diehl et al., 1991;
Mautner-Huppert et al., 1989; Newell et al., 1992). These may be
triggered by an autonomic brainstem rhythm from centres in the
midbrain and pons via innervation of the small intracranial pial
vessels that are involved in cerebral vascular control (Edvinsson et
al., 1983; Reinhard et al., 1979; Venes, 1979). The oscillations
associated with B waves have been investigated using TCD to
measure CBFV (Diehl et al., 1997; Hu et al., 1999; Sliwka et al.,
2001; Steinmeier et al., 1996) and more recently using MRI
measurement of cerebral blood flow and CSF flow (Strik et al.,
2002). M or Mayer waves are changes in systemic arterial blood
pressure in the range of 0.05 – 0.15 Hz that create fluctuations of
the same frequency in the intracranial arterial CBFV. These
correlate with discharges of sympathetic neurons (Fernandez and
Perl, 1965) and have also recently been observed using MRI (Strik
et al., 2002).
A component of the low-frequency fluctuations in the BOLD
signal has been ascribed to changes in neuronal activity in
functionally connected regions, often termed resting state networks
(Biswal et al., 1995, 1997b; Lowe et al., 1998). Studies have
identified locations where the BOLD signal correlates significantly
with the signal time-course from a functionally specialized seed
region. Correlations typically identify equivalent regions in opposite hemispheres involved in common tasks, for example, motor
cortices. The frequency spectrum of the observed CO2 fluctuations
and hence the corresponding BOLD fluctuations is very similar to
that observed in studies of resting state networks (0 – 0.1 Hz).
Given the hemispheric symmetry of observed PETCO2-related
fluctuations and their long-range spatial correlations, these may
yield an alternative or partial explanation for such observed
regional correlations. Such regions, by their symmetry, would be
expected to have a similar haemodynamic response and reactivity
to changes in PaCO2. Furthermore, Biswal et al. (1997a) reported
that hypercapnia reversibly reduces the apparent functional connectivity in humans. This was interpreted as an effect of hypercapnia on the vascular response to low-frequency fluctuations in
brain activity such as those arising from neuronal activity. However, the effect of mild to moderate hypercapnia has been shown in
most studies to have no effect on the BOLD response to neuronal
activity or to increase it. An alternative explanation for the
apparent changes in observed distant correlations could be conceived through an effect of hypercapnia on the variability of
PETCO2 and hence BOLD signal.
Significance of PETCO2-related BOLD fluctuations
The PETCO2-related BOLD signal fluctuations are statistically
significant across approximately 19% of grey matter and 14% of
white matter (Table 3). The BOLD signal variance associated
with PETCO2 fluctuations is significant with respect to the residual
error variance in the regions shown in the statistical maps in Fig.
4b. Furthermore, the fluctuations are significantly greater than
zero on average across the grey and white matter. The typical
PETCO2 fluctuation of approximately F1 mm Hg leads to grey
1661
matter BOLD signal fluctuation of up to F0.2% at 3 T in
posterior parietal regions (Fig. 5). The overlap of the power
spectrum of the fluctuations with most fMRI paradigms suggests
that they may be a notable source of unmodeled noise in fMRI
experiments. The proportion of the high-pass filtered BOLD
signal variance attributable to PETCO2 fluctuations appears small
at the voxel level at 4 – 7% in those regions significantly affected
(Table 3). The upper and lower bounds were estimated from the
PETCO2 time series being orthogonalised or not with respect to
chest position and head motion parameters. Nevertheless, a
reduction of BOLD variance of this level in activation studies
would be welcome in those regions and is comparatively easily
achieved with a simple recording of PETCO2 and the inclusion of
this in a linear model. Interestingly, when the BOLD signal is
averaged over significantly affected regions of the grey or white
matter, the proportion of the time series variance explained by
PETCO2 rises substantially to almost one quarter, showing it is an
important source of global signal fluctuation. This results from
the spatially coherent nature of the BOLD signal response to
hyper- or hypocapnia. PETCO2-related fluctuations are therefore
more coherent over space relative to some other sources of
BOLD signal noise. Different degrees of high-pass temporal
filtering of the fMRI signal and PETCO2 against which it was
regressed had no significant influence on the correlation between
them, suggesting a similar frequency structure in the resting fMRI
and PETCO2 signals. There is a spread of PETCO2-related BOLD
signal fluctuations observed among volunteers which may explain
a proportion of the intersubject differences in time series noise in
fMRI.
We would expect the magnitude of PETCO2-related BOLD signal
fluctuations to increase with increasing B0 field strength in a
similar manner to BOLD signal changes arising from activation
(Gati et al., 1997), because both are thought to arise principally
from the same physiological phenomenon, namely a decrease in
R2* associated with an increase in blood flow. As a source of
physiological noise, the fluctuations are likely to be more important at 3 T than at 1.5 T, for example, because they depend on
BOLD signal strength and therefore become a larger fraction of the
total noise at 3 T than at 1.5 T (Kruger and Glover, 2001; Kruger et
al., 2001). The corollary of this is that the higher field strength,
notwithstanding the additional susceptibility artifacts, would provide more sensitive measurements of the cerebrovascular response
to CO2 through resting fluctuations. Additional experiments at 1.5
T, for example, would be needed to quantify the field strength
dependence of the fluctuations as a source of noise and their utility
as a physiological investigation tool.
The effect of changes in baseline CBF on task-related BOLD
contrast has been previously investigated using hypercapnic and
hypocapnic stimuli. The conclusions of such studies have been
mixed. While some have found increased task-related BOLD
signal changes during hypercapnia (Kemna and Posse, 2001; Posse
et al., 2001), others have found no change (Corfield et al., 2001) or
a decreased response (Bandettini and Wong, 1997; Cohen et al.,
2002). Hypercapnia-induced changes in the form of neuronally
initiated haemodynamic response have also been reported (Cohen
et al., 2002; Kemna and Posse, 2001). If there is a modulation of
task-induced BOLD contrast by PaCO2, then the influence of resting
fluctuations in PaCO2 should not be ignored. It may represent a
significant source of intertrial variability in the magnitude of the
BOLD response during a given imaging session and between
sessions.
1662
R.G. Wise et al. / NeuroImage 21 (2004) 1652–1664
The most important undesirable consequence of the observed
low-frequency signal fluctuations is their potential confounding
effect in interpreting fMRI experiments. A stimulus paradigm
which induces a transient change in the rate or depth of breathing
would result in a PETCO2-related change in CBF that could occur at
a similar time to the BOLD response relating to the stimulus of
primary interest and hence confound the interpretation of that
response. The PETCO2-related effect would either be modulation
of task-induced BOLD contrast or changes in ‘‘baseline’’ BOLD
signal that could be misinterpreted as changes in ‘‘activation’’.
Paradigms that modify the subject’s state of arousal, for example,
through cognitive tasks, anxiety or pain, may be particularly prone
to this problem. The effects of pharmacological agents in modifying PETCO2 through changes in arousal and hence breathing or
directly affecting breathing control, for example, opiates, should
not be ignored.
In summary
We have identified a significant component of low-frequency
BOLD signal fluctuation that appears to arise from resting changes
in arterial PCO2. The relative contribution to BOLD signal changes
compared with autoregulatory processes at rest (Diehl et al., 1998;
Panerai et al., 2000), such as blood pressure fluctuation, and other
haemodynamic and metabolic oscillations as well as their interactions, requires further investigation. BOLD signal fluctuations
that correlate with PETCO2 have been shown to be useful in
examining regional haemodynamic characteristics at rest without
the need for a potentially interfering or disruptive hypercapnic or
hypocapnic challenge. Furthermore, PETCO2-related fluctuations are
a source of regionally inhomogeneous noise and may also be an
important experimental confound during functional paradigms that
may affect breathing patterns.
Acknowledgments
We acknowledge the generous support of The Wellcome Trust
(RGW, Advanced Training Fellowship grant code 067037/Z/02/Z),
UK Medical Research Council and Higher Education Funding
Council (IT) and the Alberta Heritage Foundation for Medical
Research (AHFMR), the Canadian Institutes of Health Research
(CIHR) and the Heart and Stroke Foundation of Alberta, NWT and
Nunavut. MJP is a CIHR New Investigator and AHFMR Medical
Scholar. KI is a AHFMR postdoctoral fellow. We extend our
thanks to Professor PA Robbins and Professor P Jezzard of the
University of Oxford for informative discussions.
References
Bandettini, P.A., Wong, E.C., 1997. A hypercapnia-based normalization
method for improved spatial localization of human brain activation with
fMRI. NMR Biomed. 10, 197 – 203.
Bannister, P.R., Jenkinson, M., 2001. Robust affine motion correction in
fMRI time series. NeuroImage 13, S70.
Beckmann, C.F., Jenkinson, M., Smith, S., 2003. General multi-level linear
modelling for group analysis in fMRI. NeuroImage 20, 1052 – 1063.
Behrens, T., Woolrich, M., Smith, S., 2003. Multi-subject null hypothesis
testing using a fully Bayesian framework: theory. NeuroImage 19,
S986.
Biswal, B., Yetkin, F.Z., Haughton, V.M., Hyde, J.S., 1995. Functional
connectivity in the motor cortex of resting human brain using echoplanar MRI. Magn. Reson. Med. 34, 537 – 541.
Biswal, B., DeYoe, A.E., Hyde, J.S., 1996. Reduction of physiological
fluctuations in fMRI using digital filters. Magn. Reson. Med. 35,
107 – 113.
Biswal, B., Hudetz, A.G., Yetkin, F.Z., Haughton, V.M., Hyde, J.S., 1997a.
Hypercapnia reversibly suppresses low-frequency fluctuations in the
human motor cortex during rest using echo-planar MRI. J. Cereb. Blood
Flow Metab. 17, 301 – 308.
Biswal, B.B., Van Kylen, J., Hyde, J.S., 1997b. Simultaneous assessment
of flow BOLD signals in resting-state functional connectivity maps.
NMR Biomed. 10, 165 – 170.
Boxerman, J.L., Bandettini, P.A., Kwong, K.K., Baker, J.R., Davis, T.L.,
Rosen, B.R., Weisskoff, R.M., 1995a. The intravascular contribution to
fMRI signal change: Monte Carlo modeling diffusion-weighted studies
in vivo. Magn. Reson. Med. 34, 4 – 10.
Boxerman, J.L., Hamberg, L.M., Rosen, B.R., Weisskoff, R.M., 1995b.
MR contrast due to intravascular magnetic susceptibility perturbations.
Magn. Reson. Med. 34, 555 – 566.
Clare, S., Francis, S., Morris, P.G., Bowtell, R., 2001. Single-shot T2*
measurement to establish optimum echo time for fMRI: studies of the
visual, motor, auditory cortices at 3.0 T. Magn. Reson. Med. 45,
930 – 933.
Cohen, E.R., Ugurbil, K., Kim, S.G., 2002. Effect of basal conditions on
the magnitude dynamics of the blood oxygenation level-dependent
fMRI response. J. Cereb. Blood Flow Metab. 22, 1042 – 1053.
Corfield, D.R., Murphy, K., Josephs, O., Adams, L., Turner, R., 2001. Does
hypercapnia-induced cerebral vasodilation modulate the hemodynamic
response to neural activation? NeuroImage 13, 1207 – 1211.
Davis, T.L., Kwong, K.K., Weisskoff, R.M., Rosen, B.R., 1998. Calibrated
functional MRI: mapping the dynamics of oxidative metabolism. Proc.
Natl. Acad. Sci. U. S. A. 95, 1834 – 1839.
Deichmann, R., Josephs, O., Hutton, C., Corfield, D.R., Turner, R., 2002.
Compensation of susceptibility-induced BOLD sensitivity losses in
echo-planar fMRI imaging. NeuroImage 15, 120 – 135.
Diehl, R.R., Diehl, B., Sitzer, M., Hennerici, M., 1991. Spontaneous oscillations in cerebral blood flow velocity in normal humans in patients
with carotid artery disease. Neurosci. Lett. 127, 5 – 8.
Diehl, R.R., Linden, D., Lucke, D., Berlit, P., 1995. Phase relationship
between cerebral blood flow velocity blood pressure. A clinical test
of autoregulation. Stroke 26, 1801 – 1804.
Diehl, B., Diehl, R.R., Stodieck, S.R., Ringelstein, E.B., 1997. Spontaneous oscillations in cerebral blood flow velocities in middle cerebral arteries in control subjects and patients with epilepsy. Stroke 28,
2457 – 2459.
Diehl, R.R., Linden, D., Lucke, D., Berlit, P., 1998. Spontaneous blood
pressure oscillations cerebral autoregulation. Clinic. Auton. Res. 8,
7 – 12.
Edvinsson, L., Degueurce, A., Duverger, D., MacKenzie, E.T., Scatton, B.,
1983. Central serotonergic nerves project to the pial vessels of the brain.
Nature 306, 55 – 57.
Elwell, C.E., Springett, R., Hillman, E., Delpy, D.T., 1999. Oscillations in
cerebral haemodynamics. Implications for functional activation studies.
Adv. Exp. Med. Biol. 471, 57 – 65.
Fernandez, D.M., Perl, E.R., 1965. Sympathetic activity the systemic circulation in the spinal cat. J. Physiol. 181, 82 – 102.
Forman, S.D., Cohen, J.D., Fitzgerald, M., Eddy, W.F., Mintun, M.A., Noll,
D.C., 1995. Improved assessment of significant activation in functional
magnetic resonance imaging (fMRI): use of a cluster-size threshold.
Magn. Reson. Med. 33, 636 – 647.
Friston, K.J., Worsley, K.J., Frackowiak, R.S., Maziotta, J.C., Evans, A.C.,
1994. Assessing the significance of focal activations using their spatial
extent. Hum. Brain Mapp. 1, 214 – 220.
Gati, J.S., Menon, R.S., Ugurbil, K., Rutt, B.K., 1997. Experimental determination of the BOLD field strength dependence in vessels tissue.
Magn. Reson. Med. 38, 296 – 302.
Gorno-Tempini, M.L., Hutton, C., Josephs, O., Deichmann, R., Price, C.,
R.G. Wise et al. / NeuroImage 21 (2004) 1652–1664
Turner, R., 2002. Echo time dependence of BOLD contrast susceptibility artifacts. NeuroImage 15, 136 – 142.
Grubb Jr., R.L., Raichle, M.E., Eichling, J.O., Ter Pogossian, M.M., 1974.
The effects of changes in PaCO2 on cerebral blood volume, blood flow,
vascular mean transit time. Stroke 5, 630 – 639.
Gupta, A.K., Menon, D.K., Czosnyka, M., Smielewski, P., Jones, J.G.,
1997. Thresholds for hypoxic cerebral vasodilation in volunteers.
Anesth. Analg. 85, 817 – 820.
Hu, X., Le, T.H., Parrish, T., Erhard, P., 1995. Retrospective estimation and
correction of physiological fluctuation in functional MRI. Magn. Reson.
Med. 34, 201 – 212.
Hu, H.H., Kuo, T.B., Wong, W.J., Luk, Y.O., Chern, C.M., Hsu, L.C.,
Sheng, W.Y., 1999. Transfer function analysis of cerebral hemodynamics in patients with carotid stenosis. J. Cereb. Blood Flow Metab.
19, 460 – 465.
Hudetz, A.G., Biswal, B.B., Shen, H., Lauer, K.K., Kampine, J.P., 1998.
Spontaneous fluctuations in cerebral oxygen supply. An introduction.
Adv. Exp. Med. Biol. 454, 551 – 559.
Ide, K., Eliasziw, M., Poulin, M.J., 2003. The relationship between middle
cerebral artery blood velocity end-tidal PaCO2 in the hypocapnic – hypercapnic range in humans. J. Appl. Physiol. 95, 129 – 137.
Jenkinson, M., Smith, S., 2001. A global optimisation method for robust
affine registration of brain images. Med. Image Anal. 5, 143 – 156.
Kastrup, A., Li, T.Q., Takahashi, A., Glover, G.H., Moseley, M.E., 1998.
Functional magnetic resonance imaging of regional cerebral blood oxygenation changes during breath holding. Stroke 29, 2641 – 2645.
Kastrup, A., Kruger, G., Glover, G.H., Neumann-Haefelin, T., Moseley,
M.E., 1999. Regional variability of cerebral blood oxygenation response to hypercapnia. NeuroImage 10, 675 – 681.
Kemna, L.J., Posse, S., 2001. Effect of respiratory CO2 changes on the
temporal dynamics of the hemodynamic response in functional MR
imaging. NeuroImage 14, 642 – 649.
Kruger, G., Glover, G.H., 2001. Physiological noise in oxygenation-sensitive magnetic resonance imaging. Magn. Reson. Med. 46, 631 – 637.
Kruger, G., Kastrup, A., Glover, G.H., 2001. Neuroimaging at 1.5 T 3.0 T:
comparison of oxygenation-sensitive magnetic resonance imaging.
Magn. Reson. Med. 45, 595 – 604.
Lenfant, C., 1967. Time-dependent variations of pulmonary gas exchange
in normal man at rest. J. Appl. Physiol. 22, 675 – 684.
Lowe, M.J., Mock, B.J., Sorenson, J.A., 1998. Functional connectivity in
single and multislice echoplanar imaging using resting-state fluctuations. NeuroImage 7, 119 – 132.
Lundberg, N., 1960. Continuous recording and control of ventricular
fluid pressure in neurosurgical practice. Acta Psychiatr. Scand. 36,
1 – 193.
Mathew, R.J., Wilson, W.H., 1988. Cerebral blood flow changes induced
by CO2 in anxiety. Psychiatry Res. 23, 285 – 294.
Mautner-Huppert, D., Haberl, R.L., Dirnagl, U., Villringer, A., Schmiedek,
P., Einhaupl, K., 1989. B-waves in healthy persons. Neurol. Res. 11,
194 – 196.
Mitsis, G.D., Poulin, M.J., Robbins, P.A., Marrett, S., 2002. Nonlinear
multivariate analysis of dynamic cerebral blood flow regulation in
humans. Proceedings of the Second Joint EMBS/BMES Conference
(Houston TX, USA), vol. 2, pp. 1341 – 1342.
Modarreszadeh, M., Bruce, E.N., 1994. Ventilatory variability induced
by spontaneous variations of PaCO2 in humans. J. Appl. Physiol. 76,
2765 – 2775.
Newell, D.W., Aaslid, R., Stooss, R., Reulen, H.J., 1992. The relationship
of blood flow velocity fluctuations to intracranial pressure B waves.
J. Neurosurg. 76, 415 – 421.
Obrig, H., Neufang, M., Wenzel, R., Kohl, M., Steinbrink, J., Einhaupl,
A., Villringer, A., 2000. Spontaneous low frequency oscillations of
cerebral hemodynamics and metabolism in human adults. NeuroImage
12, 623 – 639.
Olesen, J., Paulson, O.B., Lassen, N.A., 1971. Regional cerebral blood
flow in man determined by the initial slope of the clearance of intraarterially injected 133Xe. Stroke 2, 519 – 540.
1663
Panerai, R.B., Simpson, D.M., Deverson, S.T., Mahony, P., Hayes, P.,
Evans, D.H., 2000. Multivariate dynamic analysis of cerebral blood
flow regulation in humans. IEEE Trans. Biomed. Eng. 47, 419 – 423.
Posse, S., Olthoff, U., Weckesser, M., Jancke, L., Muller-Gartner, H.W.,
Dager, S.R., 1997. Regional dynamic signal changes during controlled
hyperventilation assessed with blood oxygen level-dependent functional
MR imaging. Am. J. Neuroradiol. 18, 1763 – 1770.
Posse, S., Wiese, S., Gembris, D., Mathiak, K., Kessler, C., GrosseRuyken, M.L., Elghahwagi, B., Richards, T., Dager, S.R., Kiselev,
V.G., 1999. Enhancement of BOLD-contrast sensitivity by single-shot
multi-echo functional MR imaging. Magn. Reson. Med. 42, 87 – 97.
Posse, S., Kemna, L.J., Elghahwagi, B., Wiese, S., Kiselev, V.G., 2001.
Effect of graded hypo- and hypercapnia on fMRI contrast in visual
cortex: quantification of T2* changes by multiecho EPI. Magn. Reson.
Med. 46, 264 – 271.
Poulin, M.J., Robbins, P.A., 1996. Indexes of flow and cross-sectional area
of the middle cerebral artery using Doppler ultrasound during hypoxia
and hypercapnia in humans. Stroke 27, 2244 – 2250.
Poulin, M.J., Liang, P.J., Robbins, P.A., 1996. Dynamics of the cerebral
blood flow response to step changes in end-tidal PCO2 and PO2 in
humans. J. Appl. Physiol. 81, 1084 – 1095.
Poulin, M.J., Liang, P.J., Robbins, P.A., 1998. Fast and slow components of
cerebral blood flow response to step decreases in end-tidal PCO2 in
humans. J. Appl. Physiol. 85, 388 – 397.
Raj, D., Paley, D.P., Anderson, A.W., Kennan, R.P., Gore, J.C., 2000. A
model for susceptibility artefacts from respiration in functional echoplanar magnetic resonance imaging. Phys. Med. Biol. 45, 3809 – 3820.
Reinhard Jr., J.F., Liebmann, J.E., Schlosberg, A.J., Moskowitz,
M.A., 1979. Serotonin neurons project to small blood vessels in
the brain. Science 206, 85 – 87.
Robbins, P.A., Conway, J., Cunningham, D.A., Khamnei, S., Paterson,
D.J., 1990. A comparison of indirect methods for continuous estimation of arterial PCO2 in men. J. Appl. Physiol. 68, 1727 – 1731.
Rostrup, E., Law, I., Blinkenberg, M., Larsson, H.B., Born, A.P., Holm, S.,
Paulson, O.B., 2000. Regional differences in the CBF and BOLD
responses to hypercapnia: a combined PET fMRI study. NeuroImage
11, 87 – 97.
Sliwka, U., Harscher, S., Diehl, R.R., van Schayck, R., Niesen, W.D.,
Weiller, C., 2001. Spontaneous oscillations in cerebral blood flow velocity give evidence of different autonomic dysfunctions in various
types of headache. Headache 41, 157 – 163.
Smith, S., Bannister, P.R., Beckmann, C., Brady, J.M., Clare, S., Flitney,
D., Hansen, P., Jenkinson, M., Leibovici, D., Ripley, B., Woolrich, M.,
Zhang, Y., 2001. FSL: new tools for functional and structural brain
image analysis. NeuroImage 13, S249.
Speck, O., Hennig, J., 1998. Functional imaging by I0- T2*-parameter
mapping using multi-image EPI. Magn. Reson. Med. 40, 243 – 248.
Steinmeier, R., Bauhuf, C., Hubner, U., Bauer, R.D., Fahlbusch, R.,
Laumer, R., Bondar, I., 1996. Slow rhythmic oscillations of blood
pressure, intracranial pressure, microcirculation, and cerebral oxygenation. Dynamic interrelation and time course in humans. Stroke 27,
2236 – 2243.
Stillman, A.E., Hu, X., Jerosch-Herold, M., 1995. Functional MRI of brain
during breath holding at 4 T. Magn. Reson. Imaging 13, 893 – 897.
Strik, C., Klose, U., Kiefer, C., Grodd, W., 2002. Slow rhythmic oscillations in intracranial CSF and blood flow: registered by MRI. Acta
Neurochir., Suppl. 81, 139 – 142.
Van den Aardweg, J.G., Karemaker, J.M., 2002. Influence of chemoreflexes on respiratory variability in healthy subjects. Am. J. Respir. Crit.
Care Med. 165, 1041 – 1047.
Venes, J.L., 1979. B waves—A reflection of cardiorespiratory or cerebral
nervous systems rhythm? Child Brain 5, 352 – 360.
Vesely, A., Sasano, H., Volgyesi, G., Somogyi, R., Tesler, J., Fedorko, L.,
Grynspan, J., Crawley, A., Fisher, J.A., Mikulis, D., 2001. MRI mapping of cerebrovascular reactivity using square wave changes in endtidal PCO2. Magn. Reson. Med. 45, 1011 – 1013.
Wansapura, J.P., Holland, S.K., Dunn, R.S., Ball Jr., W.S., 1999. NMR
1664
R.G. Wise et al. / NeuroImage 21 (2004) 1652–1664
relaxation times in the human brain at 3.0 Tesla. J. Magn. Reson.
Imaging 9, 531 – 538.
Woolrich, M., Ripley, B., Brady, J.M., Smith, S., 2001. Temporal autocorrelation in univariate linear modelling of fMRI data. NeuroImage 14,
1370 – 1386.
Worsley, K.J., Evans, A.C., Marrett, S., Neelin, P., 1992. A three-dimensional statistical analysis for CBF activation studies in human brain.
J. Cereb. Blood Flow Metab. 12, 900 – 918.
Young, W.L., Prohovnik, I., Ornstein, E., Ostapkovich, N., Matteo, R.S.,
1991. Cerebral blood flow reactivity to changes in carbon dioxide calculated using end-tidal versus arterial tensions. J. Cereb. Blood Flow
Metab. 11, 1031 – 1035.
Zhang, Y., Brady, M., Smith, S., 2001. Segmentation of brain MR
images through a hidden Markov random field model and the
expectation-maximization algorithm. IEEE Trans. Med. Imag. 20,
45 – 57.


© Copyright 2026