
EXPERIMENTS ON LUNAR CORE COMPOSITION - USRA
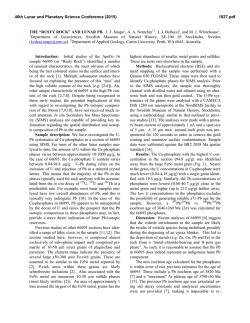
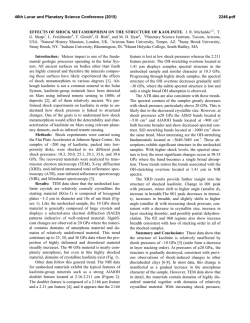
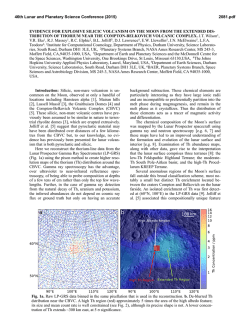
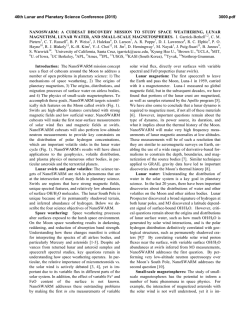
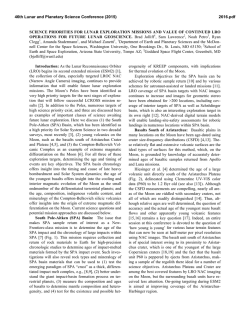
46th Lunar and Planetary Science Conference (2015)
2285.pdf
EXPERIMENTS ON LUNAR CORE COMPOSITION: PHASE EQUILIBRIUM ANALYSIS OF A
MULTI-ELEMENT (Fe-Ni-S-C) SYSTEM. B.M. Go1, K. Righter2, L. Danielson3, K. Pando3, 1University
of Chicago, Department of Geophysical Sciences, 5801 S. Ellis Ave., Chicago, IL 60637
([email protected]); 2Mailcode KT, NASA Johnson Space Center, 2101 NASA Pkwy, Houston, TX
77058; 3Jacobs JETS, NASA Johnson Space Center, 2101 NASA Pkwy, Houston, TX 77058.
Introduction: Previous geochemical and geophysical experiments have proposed the presence of
a small, metallic lunar core, but its composition is
still being investigated [1-3]. Knowledge of core
composition can have a significant effect on understanding the thermal history of the Moon, the conditions surrounding the liquid-solid or liquid-liquid
field, and siderophile element partitioning between
mantle and core. However, experiments on complex
bulk core compositions are very limited. One limitation comes from numerous studies that have only
considered two or three element systems such as
Fe-S or Fe-C [4-6], which do not supply a comprehensive understanding for complex systems such
as Fe-Ni-S-Si-C. Recent geophysical data suggests
the presence of up to 6% lighter elements [12]. Reassessments of Apollo seismological analyses and
samples have also shown the need to acquire more
data for a broader range of pressures, temperatures,
and compositions [20]. This study considers a complex multi-element system (Fe-Ni-S-C) for a relevant pressure and temperature range to the Moon’s
core conditions.
Experimental and Analytical Approach: The
bulk composition was calculated using S and C geochemical analyses of trapped melts in Apollo samples [7-9]. Knowledge of the concentration of S and
C in these melts gives the mantle concentration of
these elements [7-9]. Metal/silicate partition coefficients (D = wt% in metal / wt% in silicate) for
these elements, DS and DC, are calculated using
oxygen fugacity, lunar core temperature and pressure, degree of melt polymerization, and mole fractions of S and C [10-11]. Combining the mantle
concentration with D(metal/silicate) results allowed
for calculation of core S and C contents. The bulk
composition was prepared by mechanical mixing of
90% Fe, 9% Ni, 0.5% C, and 0.375%S by weight
from Fe, Ni, C, and FeS reagent grade powders.
Experiments were carried out under conditions
of temperatures ranging from 1473K to 1973K and
pressures from 1 GPa to 5 GPa. The composition
was placed in MgO capsules so that minimal reaction between capsule and metal could occur. For
experiments at 1 and 3 GPa, samples were placed
in a piston cylinder apparatus using graphite furnaces and 10 mm or 13 mm BaCO3 cell assemblies
under a constant pressure of 1 GPa or 3 GPa. For
experiments at 5 GPa, samples were placed in a
14/8 assembly and performed on the 800-ton multianvil press.
Samples were carbon-coated and then analyzed
for Fe, Ni, and S composition using a Cameca
SX100 electron microprobe. Beam conditions consisted of a 30-µm or 50-µm diameter beam with a 15
kV accelerating voltage and a 20 nA sample current.
The microprobe was standardized to metallic standards (troilite, Ni-metal, and Ni515). All runs at 1
and 3 GPa gave consistent concentration values with
average totals of 99-100%, and backscattered electron images were acquired of different quenched
phases. Carbon abundance was not yet measured in
these experiments.
Run
T(K)
P(GPa)
Phases
S%
Go 1.12
Go 1.13
Go 1.14
Go 1.15
Go 1.16
Go 3.13
Go π
Go 3.15
Go 3.16
Go 3.17
1473
1573
1673
1773
1873
1573
1673
1773
1873
1973
1
1
1
1
1
3
3
3
3
3
2 sol
1 sol + 1 liq
1 sol + 1 liq
1 sol + 1 liq
2 liq
1 sol + 1 liq
1 sol + 1 liq
1 sol + 1 liq
1 liq
1 liq
0.02, 0.02
0.04, 31.2
0.04, 9.0
0.03, 2.9
0 .2 , 0 .4
0.06, 14.1
0.02, 2.6
0.02, 0.4
0 .4
0 .3
Table 1 Piston cylinder experiments shown, including
phases found under an optical microscope and S wt%.
Results: For this composition, the liquidus
was found to occur between 1773K and 1873K. At
1 GPa, the liquid coexisting with the solid FeNi
metal has 2.9 wt% S at 1773 K, and as temperature
decreases the liquid become more S-rich with 31.2
wt% at 1573 K (Table 1). Figure 1 shows a
backscattered electron image of the solid and liquid phases at 1 GPa. At 3 GPa, the liquid contains
0.4 wt% S at 1773 K and decreases to 14.1 wt% at
1573 K. The two liquid phase only found in one
sample is probably not likely because it is inconsistent with [6] and is possibly a result of being
along the cool end of a thermal gradient. The
46th Lunar and Planetary Science Conference (2015)
two-solid field in Go 1.12 is probably due to lack
of homogeneous mixing in this subsolidus sample.
30 µm
MgO Capsule
Liquid Phase
Solid Phase
2285.pdf
of thermal models available [18-19], we considered [17]. When combined with our results, a solid
inner core (and therefore initiation of a dynamo)
may have been possible in the earliest history of
the Moon (~4.2 Ga ago), in agreement with [16].
Future Work: Carbon measurements still need to
be completed on these samples in order to further
understand the phase equilibria of this composition.
Multi-anvil experiments at 5 GPa are required to
have a more complete data set. More studies on geochemically plausible core compositions with varying S, C, and Si are necessary to further constrain
the core composition and evaluate the geophysical
and geochemical data.
Figure 1 Sample Go 1.14 (1673K and 1 GPa) backscattered
electron (BSE) image. Shown is MgO capsule (black), Ferich solid phase (gray), and S-rich liquid phase (gray with
black dendrites).
Discussion: Depending on the thermal model
used, the pressure (4.5 GPa – 5 GPa) and temperature (1600K – 1875K) conditions close to the lunar core can vary, which would result in different
core structure and phases.
One lunar core structure includes the presence
of one liquid phase, at temperatures above the
liquidus. A second possible structure includes the
presence of a liquid phase and a solid phase, just
below the liquidus. This is consistent with recent
seismic data and geochemical modeling that suggest the presence of a solid inner and fluid outer core, containing less than 6% of lighter elements
and being sulfur rich [12], and the growing evidence for a partially liquid core, such as from recent magnetic measurements [15, 16].
There have been many studies on a lunar core
dynamo that may have caused a magnetic field at
least 3.6 Ga ago through the previous presence of a
growing inner core or convecting liquid core [1719]. [20] found a core dynamo consistent with
paleomagnetic data with a very high S wt% of
about 6-8%. This would require at least 500 ppm
of S in the mantle, which is not the case as
shown by trapped melts in Apollo samples and
partition coefficient data on S concentrations [8,
11]. Using a temperature vs. time graph [17] for
our composition, we can find the lunar core dynamo’s starting point by analyzing the Moon’s
cooling history (Fig. 2). While there are a number
Figure 2 Displayed is a core-mantle boundary (modeled as
similar to the core temperature) Temperature vs Time
graph of the lunar core based on [17]. The arrow shows the
point where the lunar core dynamo may have started once the
core of this composition began to solidify at ~4.2 Ga.
References: [1] Righter, K. (2002) Icarus 158, 113. [2] Runcorn, S.K. (1995) GCA 60, No. 7, 12051208. [3] Newsom, H.E. (1984) Eos Trans. AGU,
65, 22, 369-370. [4] Li, J. et al., (2001) EPSL 193,
3-4, 509-514. [5] Buono, A. et al., (2011) GCA 75,
2072-2087. [6] Dasgupta, R. et al., (2009) GCA 73
6678-6691. [7] Wetzel. D.T. et al., (2013) PNAS
110, 20, 8010-8013. [8] Bombardieri, D.J. et al.,
(2005) Meteoritics, 40, 5, 679-693. [9] Wetzel, D.T.
et al., (2014) LPSC XLV, 2238. [10] Chi, H. et al.,
(2014) GCA 139, 447-471. [11] Boujibar, A. et al.,
(2014) EPSL 391, 42-54. [12] Weber, R.C. et al.,
(2011) Science 331, 309-312. [13] Fei, Y. et al.,
(2000) Am. Mineral, 85, 1830-1833. [14] Deng, L. et
al., (2013) GCA 114, 220-233. [15] Williams, J. et
al., (2001) JGR 106, 27933-27968. [16] GarrickBethell, I. et al., (2009) Science 323, 356-359. [17]
Konrad, W. et al., (1997) Adv. Sp. Res. 19, 10, 15111521. [18] Spohn, T. et al., (2001) Icarus 149, 5465. [19] Hess, P.C. et al., (1995) EPSL 134, 501514. [20] Righter, K. et al., (2014) LPSC XLV,
2111.
© Copyright 2026