
View the 2015 sheep industry projections document here
Australian sheep Industry projections 2015 Australian sheep industry projections 2015 Authors: Ben Thomas and Rebecca Matthews For more information call MLA on 02 9463 9372 Published by Meat & Livestock Australia Ltd February 2015 © Meat & Livestock Australia Ltd, 2015 ISSN 1329-2994 While endeavouring to ensure that the information contained in this publication is correct, MLA makes no representation as to, and accepts no liability for, the accuracy of such information including, but not limited to, the forecasts. i MLA’s Market information & Industry insights – Australian sheep industry projections 2015 Contents Introduction ................................................................ 1 European Union ........................................................ 21 Key assumptions ........................................................ 2 Japan ........................................................................ 22 Situation and outlook 2015–2019 ................................. 3 Other ........................................................................ 23 Australian sheep flock ................................................. 4 Lamb slaughter ........................................................... 5 Malaysia ............................................................................. 23 Papua New Guinea ............................................................ 23 Singapore ........................................................................... 23 Sheep slaughter .......................................................... 6 Live exports .............................................................. 24 Lamb and mutton production and carcase weights ... 7 Competitor summary – New Zealand ....................... 25 Lamb farm income ..................................................... 8 Statistical appendices ............................................... 26 2015 demand outlook ................................................. 9 Appendix 1 – Mutton 20x10 ............................................ 27-28 Appendix 2 – Lamb 20x10 ............................................. 29-30 Lamb exports ........................................................... 10 Mutton exports .......................................................... 11 Sources and acknowledgements ............................. 31 Acronyms ................................................................. 32 Australian market .................................................. 12-13 Middle East and North Africa (MENA) ................... 14-15 United States ............................................................ 16 China .................................................................... 17-18 Hong Kong ............................................................... 19 Taiwan ...................................................................... 20 MLA’s Market information & Industry insights – Australian sheep industry projections 2015 ii Contents List of Figures Figure 1 Figure 2 Figure 3 Figure 4 Figure 5 Figure 6 Figure 7 Figure 8 Figure 9 Figure 10 Figure 11 Figure 12 Figure 13 Figure 14 Figure 15 Figure 16 Figure 17 Figure 18 Figure 19 Figure 20 Figure 21 Figure 22 Figure 23 Figure 24 Figure 25 Figure 26 Figure 27 Figure 28 Figure 29 iii Australian rainfall 1 January 2014 to 31 December 2014 ......................... 2 Australian rainfall outlook – February to April 2015 ................................... 2 A$ against US$ ............................................................................................... 2 Australian sheep flock ................................................................................... 4 Ewe flock size intentions .............................................................................. 4 Australian lamb slaughter ............................................................................. 5 Monthly Australian lamb slaughter .............................................................. 5 Quarterly lamb slaughter and saleyard price ............................................ 5 Australian sheep slaughter ........................................................................... 6 Australian monthly sheep slaughter ........................................................... 6 Quarterly sheep slaughter and saleyard prices ........................................ 6 Lamb production and carcase weight ....................................................... 7 Mutton production and carcase weight .................................................... 7 Quarterly lamb production ........................................................................... 7 Australian slaughter lamb farm income ..................................................... 8 National sheep and lamb saleyard prices and average farm sale receipts .................................................................................................... 8 Australian lamb exports ................................................................................ 9 Mutton exports and domestic utilisation ................................................... 9 Domestic lamb utilisation ............................................................................ 12 Australian retail meat prices ....................................................................... 12 Australian retail fresh meat shares ............................................................ 13 Australian annual sheepmeat expenditure ............................................. 13 Lamb exports to the Middle East .............................................................. 14 Lamb exports to the Middle East by cut - 2014 ..................................... 14 Mutton exports to the Middle East ........................................................... 15 Mutton exports to the Middle East - by market ..................................... 15 Lamb exports to the US ............................................................................. 16 Lamb exports to the US by cut - 2014 ..................................................... 16 Mutton exports to the US ........................................................................... 16 Figure 30 Figure 31 Figure 32 Figure 33 Figure 34 Figure 35 Figure 36 Figure 37 Figure 38 Figure 39 Figure 40 Figure 41 Figure 42 Figure 43 Figure 44 Figure 45 Figure 46 Figure 47 Lamb exports to China ............................................................................... 17 Lamb exports to China by cut - 2014 ...................................................... 17 Mutton exports to China ............................................................................ 18 Mutton exports to China by cut - 2014 .................................................... 18 Lamb exports to Greater China ................................................................ 19 Mutton exports to Greater China ............................................................. 19 Sheepmeat exports to EU ......................................................................... 21 Lamb exports to EU by cut - 2014 ............................................................ 21 NZ sheepmeat exports to the EU ............................................................. 21 Australian lamb exports to Japan ............................................................ 22 Australian mutton exports to Japan ........................................................ 22 Hokkaido foreign tourists and nationality ................................................ 22 Lamb exports to other markets ............................................................... 23 Mutton exports to other markets ............................................................ 23 Australian live sheep exports .................................................................... 24 NZ monthly lamb slaughter ....................................................................... 25 NZ lamb exports ......................................................................................... 25 Sheepmeat export volume Aus v NZ ...................................................... 25 List of Tables Table 1 Table 2 Table 3 Table 4 Table 5 Situation and outlook for the Australian sheepmeat industry ................... 3 Australian exports of lamb ............................................................................ 10 Australian exports of mutton ......................................................................... 11 Australian live sheep exports ....................................................................... 24 Australian mutton exports to top 20 destinations and major regions by the 10 main cuts ................................................................... 27-28 Table 6 Australian lamb exports to top 20 destinations and major regions by the 10 main cuts ................................................................... 29-30 MLA’s Market information & Industry insights – Australian sheep industry projections 2015 Introduction The Australian sheep industry is set to continue moving through a transitional phase over the coming years, from a Merino focused industry to one even more concentrated on producing prime lambs. Real lamb prices over the past decade have encouraged the Demand from the US, Middle East and China is likely to transition, which, although volatile, have been slowly remain particularly strong, while the smaller markets of trending higher. Given the very strong demand for Australian Japan, South East Asia and the EU will continue as lamb, especially in growing international markets, prices are important markets to the Australian industry. likely to remain strong throughout 2015, and over the remainder of the projection period. Mutton slaughter, production and exports are anticipated to decline this year, with reasons very similar to those for lamb. Lamb slaughter has been making stepped increases for the In contrast to lamb however, the recovery and increase in past 15 years, with 20 million lambs likely to become the production is not forecast to be as aggressive, largely due to new low, as the prime lamb transition continues, and as our intentions for flock rebuilding. breeding ewes become more efficient. This has been exemplified by the recent improvements in national average marking rates. Live sheep exports are set to build on the momentum from 2013 and 2014, with another year-on-year increase expected in 2015, largely assisted by demand from the A significant drop in production is expected in 2015 – albeit Middle East. This trend is likely to continue for the remainder when compared to a record year – yet this is likely to test of the projection period (to 2019), assuming uninterupted market willingness to maintain higher prices. Looking further market access. forward to 2018, lamb production will increase again, driven by higher slaughter, coupled with slightly heavier carcases. Overall, the outlook for the Australian sheep and lamb industry is very positive for 2015, especially considering that Lamb exports are anticipated to contract year-on-year, production is forecast to decline, while demand is set to underpinned by the tighter production, although with remain as strong. increased lamb supplies forecast towards the end of the projection period, exports will recover rather quickly. While supplies will be lower in the short-term, the forecast weaker A$ will assist trade. Meat & Livestock Australia’s Market Information MLA produces a wide range of market information publications, which can be accessed for the latest news, analysis and statistics for the Australian red meat and livestock industry. From MLA Livestock Market Officers at saleyards each day, through to annual forecast and statistical compilations, the provision of timely, accurate and continuous market information is a key service provided to MLA members and stakeholders. All of MLA’s market information publications, including the Australian sheep Industry Projections 2015, are available at www.mla.com.au, or through a direct email service. If you would like to contact MLA’s Market Information Service, please email [email protected], or call (02) 9463 9372. MLA’s Market information & Industry insights – Australian sheep industry projections 2015 1 Key assumptions As part of MLA’s annual sheep and lamb industry projections, a series of “key assumptions” need to be outlined. After persistent hot and dry conditions during 2014 – Overall, economic conditions are expected to improve officially Australia’s third-warmest year on record – a in 2015 as the global recovery continues. However, slow phase-out of drought is expected to occur weaker than expected global activity during 2014 has throughout 2015. While the pace of the seasonal seen the IMF’s global growth projection for 2015 improvements will vary, overall, ‘average’ conditions lowered to 3.8%. The strongest rebound is expected in have been assumed for the majority of Australia’s sheep the US and South East Asia, while growth in the EU and and lamb producing regions. Japan will be moderate. China will continue on its The Bureau of Meteorology’s latest three month rainfall outlook indicates that conditions for February – April will Figure 2 Australian rainfall outlook February to April 2015 Chance of exceeding the median rainfall Legend 55-60% chance 50-55% chance 45-50% chance 40-45% chance 35-40% chance Below 35% chance upward trajectory, albeit at a slower rate as it moves towards a more sustainable growth path. Source: Australian Bureau of Meteorology be moderate for much of the eastern states, while conditions in WA are likely to be drier than average. This comes after widespread summer rainfall activity across much of the eastern states, providing producers with some short-term relief leading into autumn. The A$ to average lower against the US dollar in 2015, trading between 80-82US¢. Despite averaging 90US¢ in 2014 (down 7% year-on-year), the Reserve Bank of Australia indicated that the A$ remains above Figure 1 Australian rainfall 1 January 2014 - 31 December 2014 Legend Highest on record Very much above average Above average Average Below average Very much below average Lowest on record 1.2 A$/US$ 1.1 1 0.9 0.8 0.7 0.6 estimations of its fundamental value and “further 0.5 exchange rate depreciation was likely to be needed to achieve balanced growth in the economy”, with some Figure 3 A$ against US$ 0.4 0 Source: Australian Bureau of Meteorology 1 2 3 Source: Infoscan, CME 4 5 6 7 8 9 10 11 12 13 14 15f 16f 17f f = forecast chance of easing monetary policy in coming months. 2014 – officially Australia’s third-warmest year on record 2 MLA’s Market information & Industry insights – Australian sheep industry projections 2015 Situation and outlook 2015–2019 Table 1 Situation and outlook for the Australian sheepmeat industry % change on 2014 f 2017 f 2018 f 2019 f % change on 2014 f 71,508 72,799 73,241 73,850 3.1% 0.7% 1.8% 0.6% 0.8% -14.0% 3.5% 7,332 21,220 7,900 22,217 8,500 22,800 -13.9% 1.8% 23.4 21.9 0.4% 0.5% 23.5 22.0 23.6 22.1 23.6 22.2 -2.9% 1.5% -29.7% -11.9% 146 449 -13.6% 4.0% 172 467 186 490 205 506 -14.6% 3.3% 2,421 5.3% 2,600 7.4% 2,800 2,900 3,000 30.4% 186 136 -27.0% 111 -18.2% 137 152 169 -9.0% 206 236 164 -30.8% 140 -14.5% 165 178 198 -16.2% 214 237 202 -14.7% 214 5.9% 227 238 250 5.5% 0.0% 251 5.9% 266 279 293 3.9% 6 14.7% 8 8 8 120.8% 2011 2012 2013 2014 2015 f Sheep & lamb numbers ('000 head) at June 30 73,099 74,700 74,000 71,630 71,000 percentage change -5.8% 2.2% -0.9% -3.2% -0.9% Slaughterings ('000 head) sheep lamb 4,933 17,793 6,063 20,009 9,614 21,886 9,877 22,400 7,237 19,800 -26.7% -11.6% 6,224 20,500 Avg carcase weight (kg) sheep lamb 23.2 22.1 23.1 22.2 22.5 21.5 24.3 21.9 23.3 21.8 -4.1% -0.3% Production ('000 tonnes carcase weight) mutton lamb 114 393 140 443 217 470 240 490 169 432 Sheep exports ('000 head) 2458 2,279 1,973 2,300 Exports ('000 tonnes)* mutton shipped weight 82 107 172 carcase weight 108 134 shipped weight 160 189 lamb carcase weight 193 222 250 282 237 6 11 4 5 36.7% 2016 f % change on 2015 f Domestic utilisation ('000 tonnes carcase weight) mutton kg/capita lamb kg/capita Source: ABS, DA, MLA forecasts 6 0.3 0.2 0.5 0.2 0.2 34.7% 0.2 12.9% 0.3 0.3 0.3 103.5% 200 222 220 208 194 -6.8% 198 2.1% 201 211 213 2.3% 8.9 9.7 9.5 8.9 7.9 -11% 8.0 0.8% 8.0 7.8 7.7 -13.4% f = forecast (in italics) * excl. canned/miscellaneous MLA’s Market information & Industry insights – Australian sheep industry projections 2015 3 Australian sheep flock ByJune 2015, the Australian sheep flock is forecast to decline 0.9% on year-ago levels, to 71 million head. MLA and AWI wool and sheepmeat survey in October 2014 clearly demonstrate that, despite the challenging The total flock has been contracting over the past seasonal conditions, the intent across all states is to couple of years, primarily attributed to consistently high maintain flocks in 2015. The October survey highlights lamb and sheep slaughter throughout 2013 and 2014 – a transition away from Merino to Merino joining, towards when large parts of the key sheep producing regions joining Merino ewes to other breed rams – particularly in were challenged by drought. Producer flock intention information collected in the NSW, Victoria and WA. Producer feedback and survey results suggest that there has been a greater intent to turn lambs off earlier across the eastern states, particularly during the second half of 2014, as seasonal conditions have been against holding lambs on. Despite the season, marking rates over winter and spring across the eastern states were encouraging. In WA, the late spring rain kicked the Through to 2019, the Australian sheep flock is expected to slowly increase, to almost 74 million head. The gradual flock expansion is based on the assumption of “average” seasonal conditions across key sheep producing regions, with the drought anticipated to phase out during 2015. market along, following a very dry winter, which was reflected in the increase in marking rates. In fact, results from the MLA and AWI wool and sheepmeat survey illustrate that since 2010-11 the national Merino and non-Merino marking rates have Figure 4 Australian sheep flock 200 Figure 5 Ewe flock size intentions increase million head maintain decrease 100% 80% 150 been consistently higher than throughout the previous decade. This is likely attributed to a combination of genetic advances, improved management of breeding 60% 100 40% 50 ewes and lambs, and better seasonal conditions in some areas. 20% 0 91 93 95 97 98 01 03 05 07 09 11 13 15f 17f 19f Source: ABS, MLA forecasts 4 MLA’s Market information & Industry insights – Australian sheep industry projections 2015 0% Oct-12 31 March until 1999, 30 June from 2000 f = forecast Feb-13 Jun-13 Oct-13 Source: MLA and AWI wool and sheepmeat surveys Feb-14 Jun-14 Oct-14 Lamb slaughter Lamb slaughter in 2015 is forecast to decline 12% year- With the assumption of a phasing out of drought in 2015 Figure 6 Australian lamb slaughter on-year, to 19.8 million head, after what were two and the intention of producers to maintain their breeding consecutive years of record lamb slaughter. In 2013, ewe flock size going forward (MLA/AWI wool and Australia killed a record number of lambs, almost 21.9 sheepmeat survey), lamb slaughter is expected to 20 million head, and 2014 is estimated (final figures decline, as producers hold onto more lambs to replace 15 released in February) to have surpassed the previous culled ewes. Furthermore, as a result of the breeding record, at 22.4 million head. High slaughter was the ewe flock falling over the past twelve months, fewer result of three consecutive years of flock expansion, lambs are expected to come through the system in 5 followed by two years of ‘below average’ rainfall in the 2015. 0 key lamb producing regions. Merino ewes to non-Merino sires, is likely to see annual at elevated levels, with January through to March lamb slaughter reach a new platform of 20 million head throughput above year-ago levels. ‘Above average’ over the coming years. saw lamb slaughter fall below 2013 levels – albeit still historically high. However, ‘below average’ rainfall was recorded across all south-eastern Australia in the second half of 2014, as El Niño-like conditions set in, and, subsequently, July through to October slaughter million head 10 96 However, an increasing intent from producers to join In 2014, monthly lamb slaughter commenced the year autumn rainfall across SA, Victoria and southern NSW 25 01 02 04 06 08 10 12 14e 16f 18f e = estimate, f = forecast Figure 7 Monthly Australian lamb slaughter 2200 The reduced breeding ewe flock is expected to impact lamb slaughter through to 2016, while thereafter, with 98 Source: ABS, MLA forecasts '000 head 2012 2013 2014 2000 the assumption of average seasonal conditions, lamb 1800 slaughter is expected to recover and reach 22.8 million 1600 head by 2019. 1400 1200 was above 2013 levels. 1000 J F M A M J J A S O N D Source: ABS Figure 8 Quarterly lamb slaughter and saleyard price 7 million head lamb slaughter A¢/kg cwt 700 average trade lamb price 6 600 5 500 4 400 3 300 2 200 1 100 0 0 2004 2005 2006 2007 2008 2009 2010 2011 2012 2013 2014 2015f Source: ABS, MLA forecasts, MLA’s NLRS MLA’s Market information & Industry insights – Australian sheep industry projections 2015 f = forecast 5 Sheep slaughter Over the long-term, sheep slaughter has been trending downwards in line with the declining flock, and falling to 2014 encouraged producers to offload sheep, with a base of 4.9 million head in 2010 when the flock mutton averaging 311¢/kg cwt, 4% above the five-year bottomed out at 68 million head. However, sheep average and 55% above 2013 levels. slaughter increased in 2013 and again in 2014, following two years of ‘below average’ rainfall across most wool Rain across the eastern states in December and beginning of January has brought some relief, especially and lamb producing regions. In 2014 sheep slaughter is in NSW, but has also been a hindrance in spoiling what expected to reach 9.9 million head, up 3% year-on-year dry feed there was on the ground. With many producers and the highest annual kill since 2008. Meanwhile, high saleyard prices received throughout intending to increase their breeding ewe flock and the Hot and dry conditions persisted across much of the assumption of average seasonal conditions going country over the spring of 2013 and summer of 2013- forward, sheep slaughter is expected to contract 27% 14, and deteriorating feed conditions pressured year-on-year, to 7.2 million head in 2015. producers to cull older sheep. Some respite came with good rain in southern regions in the autumn of 2014 and sheep slaughter eased year-on-year. However, dry conditions returned in the second half of 2014, as El Niño-like conditions set in, and sheep slaughter picked Sheep slaughter is forecast to contract for a second year to 6.2 million head in 2016, before rising to 8.5 million head by 2019 – but this is still 14% below 2014 levels, echoing the long-term impact through the system of high slaughter in 2013 and 2014. up again, averaging higher year-on-year in September, October and November. Figure 9 Australian sheep slaughter 20 Figure 11 Quarterly sheep slaughter and saleyard prices Figure 10 Australian monthly sheep slaughter million head 1200 '000 head 2012 2013 2014 5 sheep slaughter 1000 15 A¢/kg cwt million head 500 average sheep price 4 400 3 300 400 2 200 200 1 100 800 10 600 5 0 0 96 98 01 Source: ABS, MLA forecasts 6 02 04 06 08 10 12 14e 16f 18f e = estimate, f = forecast 0 0 J F M A M J J A Source: ABS MLA’s Market information & Industry insights – Australian sheep industry projections 2015 S O N D 2004 2005 2006 2007 2008 2009 2010 2011 2012 2013 2014 2015f Source: ABS, MLA forecasts, MLA’s NLRS f = forecast Lamb and mutton production and carcase weights In 2015, Australian lamb production is forecast to decline 12% year-on-year, to 431,600 tonnes cwt. The reduction in production is underpinned by a The average national sheep carcase weight is projected to be 4.1% lower than year-ago levels, at 23.3kg/head Figure 13 Mutton production and carcase weight 500 '000 tonnes cwt production cwt. Looking out to 2019, the national average carcase considerable contraction in lamb numbers and turnoff weight is expected to increase slightly each year, expected this year, following on from two back-to-back stabilising at 23.6kg/head cwt from 2018 onwards. kg/head 29 carcase weight 400 27 25 300 23 years of very high lamb slaughter. 200 Seasonal conditions throughout 2014, particularly in the 100 21 19 17 latter half of the year, were very challenging across the 0 majority of sheep producing regions in the eastern 15 91 93 95 97 99 01 03 05 07 09 11 13 15f 17f 19f Source: ABS, MLA forecasts states, with deteriorating feed and water stocks f = forecast pressuring producers to turn lambs off earlier. Following a very dry winter in 2014 in WA, lamb carcase weights reportedly averaged slightly lower towards the end of the year, although supplies remained solid. Survey Figure 12 Lamb production and carcase weight 600 '000 tonnes cwt production Figure 14 Quarterly lamb production kg/head 500 results suggest that, over the summer months of 201415, the number of lambs expected to be sold was 7% higher than the same period the previous year. 25 20 23 10 400 21 300 -10 -20 Looking forward from 2015, lamb production is 17 0 15 -30 91 93 95 97 99 Source: ABS, MLA forecasts 01 03 05 07 09 11 13 15f 17f 19f f = forecast f 15 20 ec 5f D 1 20 p Se 15f 20 n f Ju 15 20 ar 5 M 1 20 ec 4 D 1 20 p Se 14 20 n Ju 1 4 20 ar 3 M 1 20 ec 3 D 1 20 p Se 13 20 n Ju 1 3 20 ar 2 M 1 20 ec 2 D 1 20 p Se 12 20 n Ju 1 2 20 ar the average national lamb carcase weight is forecast to 100 M to 506,000 tonnes cwt in 2019. In line with production, 0 19 200 expected to steadily increase over the next few years, % year-on-year change carcase weight Source: ABS, MLA forecasts f = forecast rise gradually from 21.8kg/head cwt in 2015 to 22.2kg/ head cwt in 2019. Similar to lamb, Australian mutton production is expected to contract sharply during 2015, after a surge in drought-driven sheep slaughter in 2014. Production is forecast to fall 29.7%, or 71,200 tonnes cwt, year-on- Lamb production is expected to steadily increase over the next few years year, to 168,600 tonnes cwt. MLA’s Market information & Industry insights – Australian sheep industry projections 2015 7 Lamb farm income The Australian Bureau of Agricultural and Resource On the back of improved prices, resulting from south- The largest average cash cost in 2013-14 was again Economics and Sciences (ABARES) produce an annual eastern Australia having a very wet autumn, lamb sale fertiliser, increasing slightly, to $54,000, followed by the report, commissioned by MLA, to assess the financial receipts in 2013-14 increased 6% year-on-year, to cost of repairs and maintenance ($39,000), interest performance of typical slaughter lamb producing farms $85,000, while sheep sale receipts increased 14% to payments ($39,000), sprays ($37,000) and fuel, oil and across Australia. The full report can be found at: $30,000. National saleyard trade lamb prices in 2013-14 lubricants ($36,000). The one major cost rise was http://www.mla.com.au/files/d50a6df3-8798-4100- increased 23% year-on-year, averaging 483¢/kg cwt, fodder, increasing 20%, to $10,000, as a result 84ce-a39300acd8cd/Financial-performance-of- and heavy lamb prices increased 26%, averaging 502¢/ increased fodder purchases in northern NSW. slaughter-lamb-producing-farms-2011-12-to-2013- kg cwt. Sheep prices followed a similar trend, 14.pdf. increasing 38% year-on-year, to average 267¢/kg cwt for the year. After easing in 2012-13, average slaughter in 2013-14 After ‘below average’ rainfall during the second half of 2014, and high sheep and lamb turn-off, supplies are expected to remain tight going forward. In addition, Average farm crop receipts were estimated to have strong international demand is expected to continue, a figure close to the record high levels of 2001-02 and increased 11% to $339,000, supported by increased supporting prices and farm cash incomes in the 2010-11, in real terms. The improvement in farm cash winter crop production in South Australia, WA and medium-term. income was driven by increased lamb, sheep and crop southern NSW. While wool prices improved slightly, sale receipts. Wool and beef cattle receipts remained reduced quantities saw wool sale receipts remain close similar to year-ago levels and cash costs remained to the previous financial year, at $77,000. Average beef mostly unchanged. cattle receipts were unchanged on $42,000, with lamb farm cash incomes increased 24% to $193,000 – increased sale volumes offsetting lower prices. 2013-14 Average Slaughter Lamb Farm Cash Incomes WA – up 78% to $366,000 per farm SA – up 33% to $244,000 per farm NSW – up 8% to $144,000 per farm Tasmania – down 3% to $131,000 per farm 8 250 $'000 (2013-14 dollars) 200 Figure 16 National sheep and lamb saleyard prices and average farm sale receipts 700 farm cash income farm business profit 600 150 100 50 $'000 (2013-14 dollars) A¢/kg cwt (2013-14 dollars) Trade lamb price (LHS) Sheep price (LHS) Lamb sale receipts (RHS) Sheep sale receipts (RHS) 140 120 500 100 400 80 300 60 200 40 100 20 0 -50 -100 99 -150 93-94 0 0 95-96 Source: ABARES 97-98 99-00 01-02 03-04 05-06 07-08 financial year MLA’s Market information & Industry insights – Australian sheep industry projections 2015 9-10 11-12 13-14e e = estimate 00 01 02 03 04 05 06 07 08 09 g n i d n e r a e y l a i c n a n i f Victoria – up 5% to $138,000 per farm Figure 15 Australian slaughter lamb farm income Source: MLA's NLRS, ABARES 10 11 12 13 14 2015 demand outlook In response to a forecast decline in lamb slaughter and By 2019, Australian lamb exports are anticipated to lift production in 2015, Australian lamb exports are back to 250,000 tonnes swt, underpinned by a gradually expected to decline 15% year-on-year, to 202,000 increasing proportion of lamb production exported. tonnes swt – albeit, coming from what was a record export year. The domestic market is likely to remain stretched by the strength of global demand, driven by the increasing middle class in developing markets, improved market access to China in particular, and the projected Figure 17 Australian lamb exports 300 weakening A$. '000 tonnes swt 250 Domestic utilisation is anticipated to decline from accounting for over 50% of production for the years 200 prior to 2012, to 43% in 2019. This has been a long 150 term-trend, whereby the growth in production has been 100 absorbed by the international markets, rather than a 50 marked increase in domestic consumption. 0 95 97 99 01 03 05 07 09 11 13 15f 17f 19f f = forecast Source: DA, MLA forecasts Similarly, Australian mutton exports in 2015 are anticipated to contract significantly, largely the result of a substantial reduction in sheep slaughter, following what were two very high years. Exports are expected to Figure 18 Mutton exports and domestic utilisation 400 decline 27% year-on-year, to 136,000 tonnes swt – '000 tonnes cwt export albeit, coming off what was the highest volume in 20 domestic utilisation 350 years. 300 250 200 Mutton exports are likely to continue to account for over 95% of production for the coming five years, with 150 169,000 tonnes swt forecast for 2019. 100 50 0 95 97 99 01 Source: DA, ABS, MLA forecasts 03 05 07 09 11 13e 15f 17f e = estimate, f = forecast MLA’s Market information & Industry insights – Australian sheep industry projections 2015 9 Lamb exports Table 2 Australian exports of lamb ('000 tonnes shipped weight) 2009 2010 2011 2012 2013 2014 % change 46.5 39.5 39.4 42.1 45.6 53.5 17% US 38.3 34.1 34.3 36.7 39.2 46.2 18% - Canada 5.1 3.7 3.9 4.7 5.6 6.2 11% - Mexico 3.1 1.8 1.2 0.8 0.8 1.0 26% Middle East 35.9 36.7 34.9 51.8 59.8 64.2 7% Greater China 25.7 25.8 29.6 34.6 48.9 53.0 8% - China 13.9 15.7 21.2 29.5 39.5 38.8 -2% - Hong Kong 10.4 8.1 6.2 3.5 7.5 10.6 41% - Taiwan 1.4 2.0 2.1 1.6 1.8 3.6 94% South East Asia 6.2 7.6 8.9 8.7 9.7 11.5 18% Japan 8.3 7.7 7.4 7.7 7.7 10.1 32% South Korea 1.2 2.1 2.7 3.0 3.2 4.8 52% EU 13.7 12.0 13.0 12.1 11.7 14.0 20% Other Europe 2.2 2.1 2.2 1.9 1.6 2.1 31% Pacific 11.2 9.5 10.9 14.0 13.3 10.7 -19% South Africa 2.9 3.0 3.2 2.0 1.8 1.4 -22% Other Africa/Mauritius 6.6 4.0 3.4 5.7 4.4 4.8 10% Other 4.6 5.6 4.5 5.0 6.0 6.7 11% Total 165.0 155.5 160.0 188.6 213.7 236.9 11% To: North America Source: DA Pacific = PNG, New Zealand & Pacific Islands Other Europe = Eastern Europe and Western Europe other than EU South East Asia = Indonesia, Singapore, Philippines, Malaysia and Thailand 10 MLA’s Market information & Industry insights – Australian sheep industry projections 2015 Mutton exports Table 3 Australian exports of mutton ('000 tonnes shipped weight) 2009 2010 2011 2012 2013 2014 % change Middle East 51.9 42.9 39.5 46.7 40.9 52.8 29% Greater China 17.2 11.7 9.2 22.1 71.2 60.5 -15% - China 8.5 6.7 5.1 16.4 57.9 50.1 -14% - Hong Kong 1.0 0.8 0.5 0.9 6.6 2.4 -64% - Taiwan 7.7 4.2 3.6 4.9 6.6 8.1 22% 14.6 12.6 9.0 11.7 19.0 25.7 35% Japan 5.6 3.8 4.5 3.2 3.8 5.1 35% South Korea 0.7 1.0 1.0 1.0 1.0 1.3 29% 17.9 11.7 6.1 8.1 12.2 17.9 47% 10.8 8.7 4.5 7.5 8.7 13.3 52% - Mexico 4.2 1.0 0.2 0.4 2.9 3.7 28% - Other North America 3.0 2.0 1.3 1.3 0.6 1.0 71% EU 5.4 4.9 3.5 3.7 5.0 4.7 -5% Other Europe 5.5 4.5 3.2 4.5 4.7 3.8 -20% Pacific 5.5 1.6 2.0 1.0 2.5 3.3 34% South Africa 4.4 1.6 1.9 1.3 1.2 0.9 -27% Other Africa/Mauritius 4.2 2.2 1.6 1.6 4.8 2.2 -54% Other 1.0 0.6 0.7 1.9 2.6 7.7 195% Total 134.0 99.1 82.2 106.7 172.0 186.0 8% To: South East Asia North America - US Source: DA Pacific = PNG, New Zealand & Pacific Islands Other North America = Canada and the Caribbean Other Europe = CIS, Eastern Europe and Western Europe other than EU South East Asia = Indonesia, Singapore, Philippines, Malaysia and Thailand MLA’s Market information & Industry insights – Australian sheep industry projections 2015 11 Australian market Strengths Trend Weaknesses Figure 20 Australian retail meat prices* Overall, economic conditions are expected to improve The A$ has depreciated 7% in 2014, averaging 90US¢, 1800 in 2015 as the global recovery continues. However, providing, among other factors, a huge boost to beef 1600 weaker-than-expected global activity during 2014 has exports. The exchange rate is assumed to remain at its 1400 seen the IMF’s global growth projection for 2015 current level throughout 2015, trading between 80US¢ 1200 lowered to 3.8%. Australia is expected to average and 82US¢. 1000 annual GDP increases of 3% between 2015 and 2019, up from an average growth rate of 2.7% between 2010 and 2014 (International Monetary Fund – IMF). consumer price index (CPI) only rising 3% in the June quarter 2014 year-on-year and 2.3% on the September volatile to the economic environment with concerns 600 The lower consumer confidence is largely attributed to households, industry and government adjusting to the quarter 2014 (latest available). 800 current spending decisions than in the past. Inflation in Australia remained relatively low, with the declining mining investment, the weaker Australian Over the calendar year-to-November, total fresh lamb dollar and tight fiscal policy. These factors are inevitably retail value remained steady (up 0.8%) compared to the impacting confidence, spending and investment by same period in 2013, while volume declined 1.5% consumers and business. (Nielsen – HomeScan). Lamb accounted for 12% of total meat purchased for the same period. Fresh meat remained a driver for retailer choice in 2014, however, dropped from first position in 2013 to the third position of the top ten drivers (Advantage Shopper Tracker). Figure 19 Domestic lamb utilisation 300 According to Foodservice Industry Foresight (FIF) less people are dining out (59% in June 2014 vs. 57% in '000 tonnes cwt November 2014) and in some instances foodservice operators are serving smaller meat portion sizes to keep 250 menu prices in check. 200 150 100 50 0 91 93 95 97 99 Source: ABS, ABARES, MLA forecasts 12 01 03 05 07 09 11 13 15f beef Australian consumer confidence remains lower and about the economy having a greater influence on 17f f = forecast MLA’s Market information & Industry insights – Australian sheep industry projections 2015 A¢/kg retail weight lamb chicken pork 400 2000 2001 2002 2003 2004 2005 2006 2007 2008 2009 2010 2011 2012 2013 2014* Source: ABS * = subject to revision Australian market Trend Opportunities The Australian population grew 1.6% during the year ended 30 June 2014, to 23.5 million people (Australian Bureau Statistics). The growth has two main components: natural increase and net overseas migration, however, with population projections for Australia indicating the ageing population will continue. The composition of the Australian population is changing, therefore re-shaping Australia’s food preferences. Our palates have changed from a predominantly Anglo taste profile to incorporating more Mediterranean flavours. In recent times this changed again to include more Asian and Arab/Persian flavours (where lamb is traditionally consumed). Figure 21 Australian retail fresh meat shares Purchase value Foodservice Industry Foresight (FIF) measures how operators believe their business will perform in the next Figure 22 Australian annual sheepmeat expenditure MAT 29/11/2014 Purchase volume Chicken 26.8% hotels/motels. Mutton 80 Beef 36.5% Beef 36.9% data available), the highest confidence were amongst accounts for 70% of total meat volume) followed by $/capita Lamb Chicken 33.3% six months. According to the August 2014 results (latest quick service restaurant chains (where chicken 100 60 40 Lamb 13.2% Veal 0.9% other 1.6% Turkey 1.0% Seafood 9.1% Pork 10.8% Lamb 11.7% other 1.8% Source: Nielsen Homescan data Pork 10.1% Veal 0.6% Turkey 1.1% Seafood 4.5% 20 0 91 92 93 94 95 96 97 98 99 00 01 02 03 04 05 06 07 08 09 10 11 12 13 14 Source: ABS, MLA estimates Note: year ending 30 June Threats Retail lamb prices averaged $13.06/kg during the first three quarters of 2014, up 4% on the previous year, the result of the higher lamb prices registered throughout the year and the strong overseas demand, especially from the US and China. The Bottom Line Lamb consumed in the Australian market is expected to fall 6.8% year-on-year in 2015, to 194,000 tonnes cwt, following the fall registered in 2014. Despite lamb’s niche position in the Australian market, the major challenges in 2015 are the expected decline on supply and continued strong demand from exports markets – forecast to take 55.5% of total production. MLA’s Market information & Industry insights – Australian sheep industry projections 2015 13 Middle East and North Africa (MENA) Strengths Weaknesses General General 70 the region, with relationships built over many years, and especially with issues relating to chilled lamb shelf-life, 40 a reputation as a reliable and safe supplier. which are working on being resolved. TBTs in the 30 Middle East are estimated to cost Australia $480 million Wide range of destinations for Australian lamb, mutton per year (across all red meat). and wealthier Gulf countries. and potential changes to customs procedures. protein in a cultural sense. Lamb Lamb Traders can be very sensitive to price movements, other 3.3% rack 3.1% forequarter 4.4% Mutton Source: DA Over the past few years, there has generally been a declining supply of mutton (with 2014 a significant exception), and increasing demand from other markets, especially China, which is making it more difficult to secure longer-term contracts. Pellentesque auctor tellus, highly knowledgeable aboutsuscipit the product. sit amet pulvinar massa semper ut. Donec bibendum tellus vel ullamcorper lobortis. Ut quis augue pulvinar, blandit tellus. 14 carcase 70.1% sources of lamb or mutton. styles similar to those seen in Australian supermarkets, strong supply chains in place and a consumer that is Figure 24 Lamb exports to the Middle East by cut - 2014 Sharp spikes in price will cause them to look for other to whole carcases for the wet market trade; from retail eget ante. Pellentesque auctor suscipit tellus, sit amet pulvinar massa Mutton semper ut. Donec bibendum tellus vel lobortis. Utis quis Theullamcorper Middle East (collectively) one ofaugue the twopulvinar, major markets for Australian mutton – along with China – with blandit tellus. 95 96 97 98 99 00 01 02 03 04 05 06 07 08 09 10 11 12 13 14 Source: DA particularly at the cheaper end of the product range. the whole carcase, from racks for high-end foodservice, viverra workers. 10 0 There is potential for regional safety and stability issues specific to the region, including certification for Halal relatively high, and sheepmeat is a preferred source of Turpis justo, consequat sedforviverra quis, to cheaper cuts and offal products expatriate 20 to appear at short notice, and there are access issues Populations and income growth across the region is The lamb cuts exported to the Middle East come from '000 tonnes swt 60 50 and live sheep exports, but concentrated in more stable Figure 23 Lamb exports to the Middle East There are still many technical barriers to trade (TBTs), Australia has a long history of supplying sheepmeat into Trend MLA’s Market information & Industry insights – Australian sheep industry projections 2015 leg 11.3% shoulder 7.9% Middle East and North Africa (MENA) Opportunities Threats Figure 25 Mutton exports to the Middle East 60 Lamb General In well-established markets, particularly Gulf countries 40 like the UAE, Jordan, Bahrain and Qatar, there is still become an issue in some countries, reducing the 30 strong growth in the high-end sector that exporters reserves of sovereign funds and confidence in-country. 20 Dubai is expected to build over 100 new hotels by the end of the decade, and is hosting the World Expo 2020. 10 Lamb 0 The main threat to ongoing high exports of lamb to the Qatar will be hosting the 2022 FIFA World Cup. There Middle East is the expected drop in Australia’s supply. will also be an increase in demand for protein for the The flip side to this is that the unit price of lamb should large numbers of construction workers expected for remain high, particularly in supply chains involved in these projects. high-end foodservice and retail. Forecast lower supplies of lamb mean that exporters Mutton may have to diversify their product offerings to high- value consumers. This has the potential to widen the product base when supplies increase again in future. '000 tonnes swt 50 The extended run of low oil prices has the potential to could look to exploit. Trend 95 96 97 98 99 00 01 02 03 04 05 06 07 08 09 10 11 12 13 14 Source: DA Figure 26 Mutton exports to the Middle East - by market 20 '000 tonnes swt 2013 2014 15 Live sheep imported to the Middle East from east Africa and India tend to compete with Australian mutton in 10 5 some sectors and are generally cheaper. This is likely to Mutton develop further as Australia’s mutton supply falls this year. The large construction boom that is expected over the 0 i ud a Sa abi r A E UA O m an w Ku t ai t yp Eg Q ar at an rd Jo el ra Is n Ira Source: DA next few years will increase the size of the labour force, which is a large consumer of Australian (and other) mutton. The Bottom Line Exports of both lamb and mutton to the Middle East are expected to fall, in line with lower Australian lamb and sheep slaughter. While there are sectors of the Middle East that are more resistant to the impact of a likely increase in sheepmeat prices, some sectors, particularly lower cost buyers, will look to find alternate sources of lamb, mutton and live sheep or other meats if Australian sheepmeat prices rise too much. MLA’s Market information & Industry insights – Australian sheep industry projections 2015 15 United States Trend Strengths 50 there is a large proportion of chilled lamb that is shipped consume much lamb, but are ‘adventurous eaters’ or 40 to the US, and cuts tend to be higher value, including ‘foodies’, who want to try new flavours. Lamb often fits legs, racks, shortloins, shanks, and shoulders. well into this, either as a standalone, or with foreign 20 A large proportion of the lamb that is exported is sold at 10 foundation for the lamb trade to the US to remain strong foodservice, with simple-to-cook cuts generally sold at 0 in the future. retail. With improvements in consumer knowledge of the meals. Figure 28 Lamb exports to the US by cut - 2014 lamb. leg 32.1% Threats Weaknesses pork, and poultry. increase in 2014. Generally reliant on small sections of the country – however; these sections have tended to be the better performing regions, economically, which assists with US consumers do not buy lamb or have never tried it. shank 8.7% shortloin 10.1% is a need for lobbying and relationship management to ensure smooth passage of the lamb and mutton trade. consumption on this relatively expensive protein. Growing the market can be difficult, as around a third of Source: DA carcase 4.5% shoulder 10.9% rack 11.6% The US sheep industry has seen Australia and New Zealand as a threat to their viability in the past, so there other 0.6% manufacturing 2.1% in a drop in lamb exports to the US, after a large Lamb tends to be much more expensive than the main assorted primals 19.4% The large drop in Australian lamb and mutton production that is forecast for 2014 is expected to result competitive meats consumed in the US, including beef, 95 96 97 98 99 00 01 02 03 04 05 06 07 08 09 10 11 12 13 14 Source: DA product, other cuts have potential to grow as home There are peak consumption periods for lamb in spring coincide with periods of high turn-off for Australian '000 tonnes swt 30 cuisines. The long-term relationships built between Australian (especially around Easter) and Christmas, which tend to Figure 27 Lamb exports to the US There are some sections of the community that do not Large volume, high value market for Australian lamb – exporters and US importers and end-users lay a good Opportunities Figure 29 Mutton exports to the US 25 The Bottom Line '000 tonnes swt 20 15 The US is expected to remain one of Australia’s largest export markets by volume (depending on strength of China), and the largest by value in 2015, although volumes will drop as a result of lower Australian lamb production. 16 MLA’s Market information & Industry insights – Australian sheep industry projections 2015 10 5 0 95 96 97 98 99 00 01 02 03 04 05 06 07 08 09 10 11 12 13 14 Source: DA China Trend Strengths Huge population, with 1.36 billion people. China’s most popular sheepmeat cuisine, hot pot, uses Opportunities breast and flap. The capability of the Australian industry to supply lamb and mutton breast and flap in large bring diversity to Chinese foodservice, including distribution channel for Australian mutton, increasingly Muslim-based and high-value Western-style cuisines. busy consumer lifestyles create an opportunity for Australian mutton to move into value-added and While the Chinese sheep flock is forecast to increase convenient forms over the medium-term. will continue to add value to the Australian sheep number combined) in response to prices, the industry. In 2014, 58% of Australian lamb breast and dominance of small operations in this industry will expected to see a rise in demand for New Year flap and 79% of Australian mutton breast and flap was reportedly see limited gains in productivity over the celebrations. The coming few months will reveal how delivered to China. short-to medium-term well the market is stocked, given the peak consumption Concerns over food safety violation to pork and poultry The most common Chinese sheep breeds do not deliver in recent years will continue to assist demand for high meat yield. Many species, such as the Xinjiang fat- sheepmeat. tail, deposit a large amount of fat in the body in order to meet nutritional demands during harsh winters and cold China consistently ranked the single largest market of Widespread preference for sheepmeat, traditionally in 2015 is the Chinese “year of the sheep”, which is season is during winter and spring. Figure 30 Lamb exports to China 50 springs. Australian lamb is appealing to Chinese 40 consumers. 30 While much of 2015 will continue to see the import tariff 20 the medium to long-term benefits of the ChAFTA is expected to bring Australia to a level-playing field with Weaknesses Sheepmeat consumption is the lowest compared with '000 tonnes swt on Australian lamb and mutton remain at the 2014 level, the northern regions. New Zealand lamb. The Chinese do not differentiate between mutton and lamb, and reportedly have no preference for taste or major protein sources, at 2.88kg per capita, per annum. While retail markets in China continued to be the main moderately (to 290 million head – GIRA sheep and goat past four years. quantities to the expanding Chinese foodservice sector Australian mutton, both volume and value terms for the The expanding Chinese middle class and migration will 10 0 95 96 97 98 99 00 01 02 03 04 05 06 07 08 09 10 11 12 13 14 Source: DA Figure 31 Lamb exports to China by cut - 2014 flavour between the two. Usage of mutton breast and Australian mutton demand is heavily influenced by the flap at foodservice is similar to that of lamb breast and availability of Chinese mutton supply, which in 2014 was flap, for the popular hot pot. high, resulting in competition against imported product. other 5% breast & flap 61% neck 7% Also as a result of the undifferentiated perception towards lamb and mutton, China procures relatively manufacturing 18% higher value mutton cuts before opting for lamb. For example, mutton rack exports to China have increased significantly, which has been assisted by the growing Source: DA shoulder 9% Western-style foodservice demand. MLA’s Market information & Industry insights – Australian sheep industry projections 2015 17 China Trend Threats Local lamb and mutton prices are relatively competitive compared with imported product. 50 is strong, mostly associated with freshness (MLA Global 40 Figure 33 Mutton exports to China by cut - 2014 '000 tonnes swt breast & flap 37% other 8% 30 New Zealand remained a major competitor to Australia 20 in China in 2014, and is likely to remain as competitive 10 in 2015, particularly with their tariff advantages. 60 Local consumer perceptions towards domestic product Consumer Research). Figure 32 Mutton exports to China shoulder 5% manufacturing 3% leg 8% 0 95 96 97 98 99 00 01 02 03 04 05 06 07 08 09 10 11 12 13 14 The ongoing competition from China’s domestic Source: DA Source: DA carcase 38% production. The Bottom Line Despite the ongoing strong demand, Australian lamb exports to China are expected to decline slightly in volume. Despite this, the value of lamb exports is expected to offset the fall in volume. Australian mutton exports to China will feel the impact from reduced Australian production in 2015, which combined with competition from local sheepmeat production, is likely to see a yearon-year reduction in exports. The strong market fundamentals, do however, place China in good stead for sustained Australian sheepmeat demand. 18 MLA’s Market information & Industry insights – Australian sheep industry projections 2015 Hong Kong Trend Strengths Geographically and culturally close to China, combined Threats Hong Kong imports sheepmeat from 16 countries, with being one of the better business operating ranging from large specialised suppliers such as environments in Asia, means that in sheepmeat Australia and New Zealand, to smaller suppliers in consumption in Hong Kong foodservice and modern Europe, South America and the US. During January to grocery set to continue leading the premium food dining November 2014, while Australian lamb exporters trends in the region. increased focus on the US market, the UK emerged as the third largest supplier of sheepmeat to Hong Kong, Weaknesses Recent street protests have had a short-term impact on the Hong Kong economy, with growth expected to register 2.7% for 2015, potentially impacting high-end with 12% market share. While UK sheepmeat will continue to be supplied to the main EU markets, the weaker Euro, strong demand from Hong Kong and an expected slight increase in sheepmeat production in the UK will continue to facilitate competition against Australian product over the short-term. dining. Opportunities Figure 35 Mutton exports to Greater China 80 '000 tonnes swt China The longer-term will continue to see the Hong Kong foodservice sector benefit from tourism, with increasing visitors arriving in Hong Kong and spending on food Hong Kong Taiwan 60 40 and luxury goods. 20 Figure 34 Lamb exports to Greater China 60 '000 tonnes swt China Hong Kong 0 95 96 97 98 99 00 01 02 03 04 05 06 07 08 09 10 11 12 13 14 Source: DA Taiwan 50 40 The Bottom Line 30 20 Sheepmeat exports to Hong Kong are expected to decline in 2015, amid expectations on reduced supply from Australia. 10 0 95 96 97 98 99 00 01 02 03 04 05 06 07 08 09 10 11 12 13 14 Source: DA MLA’s Market information & Industry insights – Australian sheep industry projections 2015 19 Taiwan Trend Strengths Possessing similar cultural beliefs to China about eating Retailers continue to announce expansion plans, Threats New Zealand is the major competitor for Australian red meat, sheepmeat is a highly valued protein, and providing opportunities for Australian value added sheepmeat in Taiwan. While New Zealand was focused often used in foodservice in traditional Taiwanese hot sheepmeat products to further penetrate the retail level. on the US and Chinese market in 2014, Australia pots. Opportunities Taiwan registered the highest growth in foreign tourist Relatively high consumer incomes (GDP per capita US$ arrivals in the world in the first half of 2014 (27%), with 21,618) in Taiwan will continue to encourage consumers the tourism market playing a critical role in the towards high-end fine dining. foodservice sector. Dynamic tourism sector that promotes consumption of sheepmeat at foodservice. became the main imported sheepmeat supplier. However, market share will continue to fluctuate over the short-term, with Taiwan sheepmeat imports continuing to face competition from major markets in the US, China and the Middle East. The majority of lamb exports to Taiwan have been trimmings. The opportunity to expand the cut profile to meet Taiwanese foodservice requirements should add Weaknesses value to the overall sheepmeat industry. While there is an aging population, there is an Similar to beef, Taiwan sheepmeat consumption is opportunity for products to cater for that market dependent on imports, which have not increased segment, with small-sized packed and prepared meals. significantly over the past five years. Competition from traditionally consumed proteins such as pork and poultry. The aging Taiwanese population will have an implication on how sheepmeat will be eaten in the medium-term. The Bottom Line Sheepmeat exports to Taiwan are expected to decline in 2015, amid expectation on reduced supply from Australia. 20 MLA’s Market information & Industry insights – Australian sheep industry projections 2015 European Union Trend Strengths Sheepmeat exports to the EU increased 12% in 2014, Opportunities relatively tight throughout 2015. For the year ending 14,043 tonnes swt. In contrast, mutton exports were September 2015, NZ lamb slaughter is forecast to fall subdued, with shipments down 5% year-on-year, at 3.3% on the previous year, to 19.5 million head – largely 4,716 tonnes swt. The United Kingdom remained the due to a greater number of hoggets retained. Lamb major destination, followed by France. slaughter is also forecast to decrease 2.6% for the 2014-15 season, to 357,100 tonnes cwt (Beef + Lamb New Zealand). calendar year allocated quota (19,186 tonnes cwe) before year end in 2014, with exports at 30 November at 19,130 with GDP growth forecast at 2.7% in 2015. Figure 37 Lamb exports to EU by cut - 2014 boneless loin 1.5% chump 6.6% manufacturing 4.2% rack 0.3% EU sheepmeat production is expected to remain stable. The A$ weakened significantly against both the Euro Interestingly, live and meat exports are increasing, and British pound throughout 2014, assisting the price especially to Libya for live animals and Hong Kong for competitiveness of Australian product. meat (EU Commission). Australian sheepmeat exports to the EU are limited by a mutton The UK economy, Australia’s largest lamb and mutton market in the region is expected to continue growing, Weaknesses lamb 95 96 97 98 99 00 01 02 03 04 05 06 07 08 09 10 11 12 13 14 production and strong demand from other markets for 24 22 20 18 16 14 12 10 8 6 4 2 0 Source: DA cwe, or 99.7% of the quota. Reduced New Zealand NZ product, assisted Australian shipments in 2014. '000 tonnes swt Encouragingly, NZ production is anticipated to remain to 18,759 tonnes swt, with lamb shipments up 20%, at Interestingly, sheepmeat exports to the EU filled the Figure 36 Sheepmeat exports to EU leg 60.9% shank 24.6% Threats Despite the decline in NZ lamb production expected for 19,176 tonne carcase weight equivalent (cwe) Tariff Rate 2015, NZ has a distinct advantage within the EU market, Quota (TRQ). In-quota shipments do not incur any duty, dominating the Tariff Rate Quota (TRQ) allocation, with while out of quota shipments incur a 12.8% and 902- 228,254 tonnes cwe (80% of the total). Figure 38 - NZ sheepmeat exports to the EU 200 3,118€/tonne duty (depending on the product).The sheepmeat TRQ includes lamb, mutton and goatmeat. other 2.0% Source: DA '000 tonnes swt UK France Germany Belgium Netherlands others 150 100 The Bottom Line 50 Australian lamb and mutton exports to the EU are expected to remain steady in 2015, with its allocated quota forecast to be filled. The tight Australian supply forecast for 2015, combined with the quota, are likely to constrain further growth. 0 10 20 11 20 Source: Statistics New Zealand/GTA 12 20 * 14 20 13 20 *Jan to Oct period MLA’s Market information & Industry insights – Australian sheep industry projections 2015 21 Japan Trend Strengths Small but steady market with established users Tight supplies from New Zealand (Australia’s major (Genghis Khan sheepmeat barbecue restaurants), with competitor in the market). Anecdotally, more end users high proportion of chilled lamb shipments. have become familiar and loyal to Australian lamb, after switching from the NZ product. Besides increased supplies from Australia, the Figure 39 Australian lamb exports to Japan 14 A$/kg '000 tonnes swt Chilled (LHS) Frozen (LHS) average value (RHS) 12 10 8 10 8 6 The Japanese government has a strong commitment to 6 4 tourism in Hokkaido (major sheepmeat consumption promote tourism, as the market moves towards the 4 region in Japan) assisted strong growth in sheepmeat 2020 Tokyo Olympics. International tourists – 2 exports to Japan during 2014. particularly from China and South East Asia – are major 0 improving economy and recovery of international Opportunities customers of Genghis Khan restaurants in Hokkaido, Average export values ($/kg) also improved year-on- 0 00 01 02 03 04 05 06 07 08 09 Source: DA, GTA 10 11 12 13 14 2014 value = Jan to Nov average along with locals and Japanese tourists. year, proving the market’s ability to keep up with increasing world red meat prices. 2 Slow but gradual penetration of lamb menus to mid-tohigh class restaurants, and a diversification of lamb recipes. Weaknesses Figure 40 Australian mutton exports to Japan 12 '000 tonnes swt Chilled (LHS) A$/kg Frozen (LHS) average value (RHS) 8 10 6 Fragile economy – the ‘Abenomics’ has brought a Threats weakening currency and rising inflation, while there has been no steady increases in household income. Aging and declining population – by 2024, almost one in three people will be over 65 years old, with total Sheepmeat is not considered as a major protein in Japan, and its consumption volume is still limited at around 200 grams per person (in comparison with 6kg of beef, and 12kg of pork and chicken). 4 weakening of the Japanese Yen could limited Japanese 2 ability to procure. 0 4 2 0 00 01 02 03 04 05 06 07 08 09 Source: DA, GTA The Bottom Line Australian lamb export volumes to Japan during 2015 are likely to ease from 2014, largely impacted by reduced supplies from Australia. The market’s ability to cope with stronger prices will continue to be tested in 2015, on the back of ongoing strong buying from the US, the Middle East and China. 22 6 Anticipated tight Australian supplies, and further population declining 4% from 2014, to 121 million. 8 MLA’s Market information & Industry insights – Australian sheep industry projections 2015 10 11 12 13 14 2014 value = Jan to Nov average Figure 41 Hokkaido foreign tourists and nationality 1600 '000 people China Korea Taiwan Hong Kong Australia 2014 estimate 1400 1200 1000 800 600 400 200 0 00 01 02 03 04 Source: Hokkaido Government, MLA. 05 06 07 08 09 10 11 12 13 14* 2014* = estimate based on Q1 number and growth % Other Malaysia Papua New Guinea Singapore In 2014, 7,389 tonnes swt of lamb was shipped to Singapore received 2,124 tonnes swt of lamb in 2014, Malaysia, up 18% year-on-year and 53% above the 9,033 tonnes swt, back 28% on 2013 and 17% below up 47% year-on-year and 30% above the five-year five-year average. The majority of product was frozen the five-year average. More than two thirds of product average. Leg shipments (688 tonnes swt) were the shoulder (5,137 tonnes swt), followed by frozen carcase was frozen breast and flap (6,315 tonnes swt), while largest export segment, followed by whole carcases (978 tonnes swt) and frozen leg (483 tonnes swt). frozen shoulder (1,094 tonnes swt) and neck (920 (307 tonnes swt). tonnes swt) were also valuable exports. Mutton shipments to Malaysia were 15,939 tonnes swt Mutton shipments also increased to 9,052 tonnes swt Primarily frozen breast and flap, and partially offsetting for the year, up 22% year-on-year and 45% above the more than double the five-year average. Over half the the reduced volume of lamb was 3,135 tonnes swt of five-year average. Frozen carcase shipments (4,170 total shipments were made up of frozen carcase orders mutton was exported in 2014, up 28% year-on-year and tonnes swt) made up the bulk of exports, with frozen leg (8,421 tonnes swt), while frozen manufacturing (3,116 36% above the five-year average. (2,882 tonnes swt) and manufacturing (1,354 tonnes over the twelve-month period, up 43% year-on-year and tonnes swt) and frozen shoulder (2,711 tonnes swt) also accounted for significant portions. Lamb shipments in 2014 to Papua New Guinea came to swt) also making up significant amounts. As Papua New Guinea enters into a phase of economic growth, following the development of the country’s While the population of about 5.5 million is expected to With GDP growth forecast to outstrip the increase in natural resources, Business Monitor International has grow at an average rate of 2%, between 2014 and 2020, population – GDP (US$) is forecast to grow from $329 forecast GDP (US$) to more than double from $16 GDP (US$) is forecast to grow at 8% (Business Monitor billion in 2014, to $557 billion by 2020, and the billion in 2014 to $38 billion by 2020. While stability is International), putting upward pressure on incomes and population is forecast to grow from 30 million in 2014 to not guaranteed in the country of almost 7.5 million supporting demand for Australian lamb and mutton almost 33 million by 2020 (Business Monitor people, the impacts of economic growth will support exports. International) – rising incomes and an expanding middle demand for Australian lamb and mutton exports. class are expected to keep demand for Australian lamb and mutton exports strong. Figure 42 Mutton exports to other markets 30 Figure 43 Lamb exports to other markets '000 tonnes swt Papua New Guinea Malaysia Singapore 25 25 '000 tonnes swt Papua New Guinea Malaysia Singapore 20 20 15 15 10 10 5 5 0 0 94 95 96 97 98 99 00 01 02 03 04 05 06 07 08 09 10 11 12 13 14 Source: DA The Bottom Line Although expected to grow in GDP and population over the medium-term, demand from Australia’s smaller markets will be constrained by tight Australian supplies and the stretch for rising incomes to meet increasing international meat prices. 94 95 96 97 98 99 00 01 02 03 04 05 06 07 08 09 10 11 12 13 14 Source: DA MLA’s Market information & Industry insights – Australian sheep industry projections 2015 23 Live exports Summary Markets During 2014, WA dominated the live sheep trade, accounting for 83% of the total live sheep exports, which was steady year-on-year, while SA, second largest in volume, accounted for 13%. Of the WA ports, Fremantle was the most active, averaging 156,164 head per month, up 20,000 head on the previous year. Kuwait was the largest market for 2014, accounting for just over 706,000 head in the eleven months to November – and likely to remain the primary market again in 2015. Qatar was also a busy market in 2014, with approximately 474,000 head shipped, down slightly from the previous year, although still a valuable customer. Jordan imported 274,000 Australian sheep in 2014, also down slightly from year-ago levels, yet remaining an important market for exporters. Interestingly, to the three largest markets, shipments declined from the corresponding time frame in the previous year. However, this was offset by a large increase to a number of other markets, including Bahrain, Israel, Egypt, Oman and the UAE. Going forward, strong demand is anticipated from not only the larger markets, but also the growing countries and recently re-opened markets, adding important value to the Australian sheep industry. Australian live sheep exports during 2014 are estimated to have increased 17% from the previous year, to 2.3 million head. A further increase is expected for 2015, to 2.4 million head. Shipments are anticipated to continue edging higher, largely in response to growing international demand, particularly from the Middle East, where there is strong sheepmeat demand, especially during religious festivals. Assuming uninterrupted trade, live sheep exports are forecast to increase to 3 million head by 2019 – up significantly from the 2014 volume, yet still well below the numbers from one decade-ago. Table 4 Australian live sheep exports (head) 2013 2014e % change 2009 2010 2011 2012 Kuwait 948,271 1,076,455 956,725 706,644 876,004 800,000 -9% Qatar 352,695 321,415 395,728 531,894 560,762 570,000 2% Bahrain 747,827 535,731 354,450 249,741 0 280,000 - Turkey 0 215,038 352,352 245,147 120 0 - Jordan 470,511 265,986 217,067 327,960 287,792 320,000 11% Israel 23,400 42,000 56,600 64,007 54,164 95,125 76% Oman 289,223 69,073 41,025 19,892 58,476 61,646 5% UAE 130,312 78,748 37,385 33,211 99,795 140,000 40% Saudi Arabia 576,147 262,500 24,000 69,000 0 0 Other 29,223 101,625 23,145 31,120 36,260 33,229 -8% Total 3,567,609 2,968,571 2,458,477 2,278,616 1,973,373 2,300,000 17% To: Source: ABS, MLA forecasts 24 - e = estimate based on 11 months data Figure 44 Australian live sheep exports 8 million sheep and lambs 7 6 5 4 3 2 1 0 97 98 99 00 01 Source: ABS, MLA forecasts MLA’s Market information & Industry insights – Australian sheep industry projections 2015 02 03 04 05 06 07 08 09 10 11 12 13 14e 15f 16f 17f 18f e = estimate, f = forecast Competitor summary – New Zealand The New Zealand (NZ) sheep flock, at June 2014, had For the year ending September 2015, lamb slaughter is declined 3.2% year-on-year, to 29.8 million head. Sheep forecast to fall 3.3% on the previous year, to 19.5 million numbers in the North Island were back 2.4%, at 14.6 head – largely due to a greater number of hoggets million head, the result of two consecutive seasons retained. The decline in slaughter, however, is not affected by drought, while the South Island flock expected to be offset by an increase in the average decreased 3.9%, to 15.2 million head, primarily due to carcase weight, with lamb production forecast to land use change for dairy conversions. decrease 2.6% for the 2014-15 season, to 357,100 tonnes cwt. The NZ lamb crop in spring 2014 was estimated to be stable on the previous year, at 25.6 million head, Following high mutton slaughter levels throughout 2013- reflective of good seasonal conditions which were 14 due to dry conditions and dairy expansion, slaughter somewhat offset by a decline in the breeding ewe flock is forecast to tighten 21% in 2014-15, to 3.3 million due to dairy expansion. From scanning results earlier in head. the season, the national lambing percentage was expected to lift 1.5% in 2014-15 – although seasonal conditions during the spring lambing period would be a key determinant in the final lamb crop. NZ lamb exports are forecast 2.6% lower in 2014-15, compared to the previous year, at 297,000 tonnes swt. Despite the smaller volume, the average FOB value of total lamb shipments is expected to rise 6.2% year-onyear, reflecting strengthening market prices and a depreciating NZ dollar. Source: Beef and Lamb New Zealand Figure 45 NZ monthly lamb slaughter 1400 Figure 47 Sheepmeat export volume Aus v NZ Figure 46 NZ lamb exports '000 head 140 2012 2013 2014 '000 tonnes swt 2013 120 1200 2014 60 600 40 400 0 200 EU 0 J F Source: Statistics NZ M A M J J A S O N D New Zealand 450 20 400 Australia 500 80 800 '000 tonnes cwe 550 100 1000 600 U S e dl id M Source: Beef + Lamb New Zealand st Ea C na hi C a ad an O er th 350 300 2000 2004 2008 2012 2016 2020 Source: FAO-OECD MLA’s Market information & Industry insights – Australian sheep industry projections 2015 25 Statistical appendices 26 MLA’s Market information & Industry insights – Australian sheep industry projections 2015 Appendix 1 – Mutton 20x10 Table 5 Australian mutton exports to top 20 destinations and major regions by the 10 main cuts – continued on next page Total (All Cuts) Carcase Leg Manufacturing 2014 tonnage Net change % change 2014 tonnage Net change % change 2014 tonnage World Total 18 5 , 9 9 2 13 , 9 4 7 8% 83,060 1, 0 5 9 1% 33,203 4,766 17 % 17 , 3 6 1 2,431 16 % 23,892 3 , 115 15 % CHINA 50,064 - 7,825 - 14 % 19 , 2 5 8 - 7,768 - 29% 4,239 - 2 , 15 2 - 34% 1, 3 7 0 - 596 - 30% 18 , 7 5 9 2,483 15 % SAUDI ARABIA 18 , 5 3 8 5,777 45% 7,483 2,605 53% 5,072 2,352 86% 2 , 8 13 4 11 17 % - 11 - 10 0 % MALAYSIA 15 , 9 3 9 4,804 43% 8,421 2,964 54% 1, 2 7 0 480 6 1% 3 , 116 50 2% 4 3 428% USA 13 , 2 7 3 4,526 52% 8,756 3,568 69% 2,565 840 49% 75 55 288% 0 0 DUBAI 12 , 3 5 6 2,466 25% 6,860 1, 10 0 19 % 3,901 1, 13 6 4 1% 19 6 74 60% 7 -5 - 4 1% 9,052 1, 6 5 1 22% 4,409 531 14 % 2,950 648 28% 1, 3 5 4 425 46% 0 -1 - 64% TAIWAN 8 , 10 3 1, 4 5 3 22% 1, 5 7 1 - 570 - 27% 81 - 25 - 23% 3,537 1, 3 9 2 65% 1, 4 0 3 522 59% OMAN 6,772 1, 3 14 24% 5,424 1, 10 1 25% 1, 2 9 5 208 19 % KUWAIT 5,751 775 16 % 3,974 793 25% 953 245 35% 368 - 16 9 - 3 1% 0 JAPAN 5 , 116 1, 3 2 9 35% 18 1 80 80% 1, 6 5 9 495 43% 1, 6 3 0 203 14 % 0 UNITED KINGDOM 4,271 41 1% 3,786 291 8% 49 - 264 - 84% 0 Destination SINGAPORE 0 Net change % change 2014 tonnage Breast & flap Net change % change 2014 tonnage 0 Net change % change 0 MEXICO 3 , 7 14 8 19 28% 1, 3 4 5 477 55% 5 5 EGYPT 3,623 1, 2 0 1 50% 1, 6 18 832 10 6 % 785 263 50% RUSSIAN FEDERATION 3,253 - 563 - 15 % 751 - 240 - 24% 1, 5 4 8 10 1% 95 - 97 PAPUA NEW GUINEA 3 , 13 5 677 28% 5 - 10 - 69% 9 - 46 - 83% 12 5 38 MOROCCO 2,860 91 3% 2,835 66 2% 25 25 QATAR 2,720 758 39% 1, 8 6 9 561 43% 620 10 3 20% 20 5 29% HONG KONG 2,368 - 4,273 - 64% 1, 6 2 9 - 3 , 3 19 - 67% 14 8 - 3 15 - 68% 13 - 17 - 56% 297 - 5 14 - 63% 1, 7 11 651 6 1% 0 - 118 - 10 0 % 333 18 3 12 2 % 750 333 80% 17 - 24 - 59% MAURITIUS 0 0 0 10 2 -5 - 4% - 50% 2 - 10 - 83% 43% 2,567 555 28% 0 0 0 1, 6 8 5 - 1, 5 4 9 - 48% 1, 5 6 0 - 1, 4 2 8 - 48% 8 2 30% 21 21 -9 - 10 0 % Middle East 52,831 11, 9 2 0 29% 2 9 , 6 17 7 , 119 32% 12 , 8 6 1 3,987 45% 3,472 396 13 % 2 15 22 11% SE Asia 25,679 6 , 7 10 35% 13 , 2 2 3 3,667 38% 4,332 1, 112 35% 4,559 5 16 13 % 4 3 14 1% VIETNAM Source: Department of Agriculture MLA’s Market information & Industry insights – Australian sheep industry projections 2015 27 Appendix 1 – Mutton 20x10 Table 5 Australian mutton exports to top 20 destinations and major regions by the 10 main cuts – from previous page Shoulder Destination 2014 tonnage Bone-in loin Backstrap % change 2014 tonnage Net change % change 2014 tonnage Net % change change 2014 tonnage 784 13 2% 3,097 75 2% 2 , 117 229 - 40 - 15 % 2 Net change Shank Rack % change 2014 tonnage Net change % change 2014 Net tonnage change % change 265 14 % 2,824 431 18 % 3,096 793 34% - 205 - 99% 766 48 7% 1, 6 3 4 1, 13 8 230% World Total 12 , 5 9 6 760 6% CHINA 2,352 - 1, 0 3 9 - 3 1% 0 SAUDI ARABIA 2,025 535 36% -5 - 10 0 % 842 - 79 - 9% 9 5 13 2 % 92 21 29% 84 17 26% MALAYSIA 2 , 7 11 1, 2 6 3 87% - 29 - 60% 49 - 11 - 19 % 10 0 4 5% 19 2 115 14 7 % 18 - 32 - 64% USA 1, 5 3 6 114 8% 0 -6 - 10 0 % 4 4 5 2 64% 291 - 29 - 9% 30 7 28% DUBAI 10 4 -5 - 5% 86 57 19 7 % 75 50 19 9 % 19 - 39 - 68% 262 65 33% 608 - 18 - 3% SINGAPORE 36 29 395% 0 48 2 5% 16 5 24 17 % 18 6 52% 20 4 24% 0 - 10 0 % - 79 692 321 86% 3 -7 - 67% 2 14 15 1 236% 389 - 284 - 42% 19 12 16 6 % 0 2 -4 - 68% 1 -4 - 8 1% 29 9 49% KUWAIT 14 - 12 1 - 90% JAPAN 77 -7 - 8% TAIWAN OMAN 1 335 RUSSIAN FEDERATION 741 - 18 6 17 % - 20% PAPUA NEW GUINEA 12 7 27 26% 0 EGYPT MOROCCO 0 QATAR 0 524 -2 - 10 0 % 10 -5 - 34% -1 - 10 0 % 99 80 423% 115 - 91 - 44% -4 - 8 1% 16 11 2 7 1% 1, 4 3 3 539 60% 89 17 24% 9 1 12 % -3 - 10 0 % 5 - 34 - 87% - 44 - 10 0 % 56 12 % 0 7 0 -6 - 45% 0 0 483 56 13 % 68 - 65 - 49% 86 16 23% 0 0 8 8 0 0 0 16 85 8008% -3 0 0 19 52% -1 118 71 - 24% 0 0 57 16 16 - 10 0 % 1 - 15 6 15 0 % 493 208 13 - 10 0 % 2 15 15 16 -3 - 17 % 1 - 13 - 96% 0 29 11 64% - 10 0 % 0 -1 - 75% 73% 0 0 - 72% -8 - 38% 5 - 17 - 78% 7 10 % 52 - 94 - 64% 0 - 21 - 99% 1 1 Middle East 2 , 18 2 16 1 8% 752 245 48% 1, 4 7 3 - 12 1 - 8% 84 - 20 - 19 % 556 14 9 37% 881 - 60 - 6% SE Asia 2,765 1, 3 0 6 90% 20 - 29 - 60% 12 0 2 1% 266 29 12 % 226 13 7 15 3 % 58 - 27 - 32% VIETNAM - 56% - 28 2 - 10 0 % 0 - 63 0 0 16 0 2 MAURITIUS 50 0 -1 HONG KONG 3 - 10 0 % 0 2,295 MEXICO 20 0 UNITED KINGDOM 28 Net change Forequarter 0 0 MLA’s Market information & Industry insights – Australian sheep industry projections 2015 Appendix 2 – Lamb 20x10 Table 6 Australian lamb exports to top 20 destinations and major regions by the 10 main cuts – continued on next page Total (All Cuts) Breast & flap 2014 tonnage Net change % change 2014 tonnage Net change 236,908 23,194 11% 42,290 USA 4 6 , 19 4 7 , 0 14 18 % 15 CHINA 38,842 - 693 - 2% DUBAI 15 , 0 9 7 1, 8 7 6 JORDAN 14 , 4 0 8 BAHRAIN 11, 9 7 3 HONG KONG 10 , 6 0 1 3,062 4 1% UNITED KINGDOM 10 , 5 6 1 1, 4 3 7 16 % JAPAN 10 , 12 7 2,430 32% QATAR 10 , 0 7 8 4,059 67% PAPUA NEW GUINEA 9,033 - 3,448 MALAYSIA 7,389 CANADA 6 , 19 1 Destination World Total Leg Shoulder % change 2014 tonnage 3,134 8% 38,587 8,407 28% 34,774 4,233 14% 18,056 2,568 17% 11 266% 14,818 2,545 2 1% 5,046 1, 0 0 8 25% 976 291 42% 23,659 3,327 16 % 57 - 439 - 89% 3,323 - 3,378 - 50% 7,009 1, 12 4 19 % 14 % 3 1 40% 2,861 465 19 % 1,792 28 2% 24 22 972% 1, 6 6 7 13 % 0 0 1,236.0 590 9 1% 1,732 239 16 % 23 - 229 - 9 1% - 1, 3 7 8 - 10 % 0 9 5 12 1% 0 - 25 - 10 0 % - 15 - 10 0 % 5,489 Net change % change 2014 tonnage Manufacturing Net change % change 2014 tonnage Net change % change 1, 7 9 9 49% 383 19 6 10 5 % 256 - 60 - 19 % 2,716 1, 3 8 9 10 5 % -1 - 10 0 % 6,295 1, 8 8 3 43% 23 8 52% 527 - 1, 13 8 - 68% 8 -2 - 16 % 678 13 7 25% 5,915 2 , 18 7 59% 2,413 - 37 - 2% 367 92 34% 94 1 1% 17 1 5% - 28% 6,315 - 2,576 - 29% 284 - 83 - 23% 1,094 - 21 - 2% 187 - 16 4 - 47% 1, 13 3 18 % 17 - 10 - 37% 541 -7 - 1% 5,139 1, 111 28% 68 - 42 - 38% 628 11% 0 0 2,724 484 22% 635 17 1 37% 142 7 5% 0 SAUDI ARABIA 5 , 12 6 1, 3 4 3 36% -1 - 10 0 % 2,094 747 55% 768 375 95% 41 - 45 - 53% SOUTH KOREA 4,837 1, 6 6 2 52% 1,123 532 90% 125 44 54% 2,162 697 48% 689 17 9 35% TAIWAN 3,553 1, 7 19 94% 324 18 7 13 7 % 57 54 15 5 5 % 312 35 13 % 2,387 1, 2 7 8 115 % KUWAIT 3,203 - 947 - 23% 0 32 - 21 - 40% - 82 - 10 0 % 176 - 15 4 - 47% ABU DHABI 2,382 - 12 0 - 5% 0 132 - 31 - 19 % 86 - 33 - 28% 0 1,764 657 59% 1 1 688 234 52% 253 62 33% 429 203 89% 192 62 48% 0 47 47 20 6 FRANCE 2 , 14 8 751 54% SINGAPORE 2 , 12 4 674 47% SWITZERLAND 2 , 10 3 507 32% Middle East 64,249 4,472 7% 62 26 75% 7,260 2 , 15 6 42% 280 - 421 - 60% 5,064 601 0% SE Asia 11, 4 5 8 1, 7 2 5 18 % 228 16 2 249% 1,703 44 3% 158 - 47 - 23% 5,712 1, 2 6 2 0% 183 16 9 117 5 % 0 4 1% 0 Source: Department of Agriculture MLA’s Market information & Industry insights – Australian sheep industry projections 2015 29 Appendix 2 – Lamb 20x10 Table 6 Australian lamb exports to top 20 destinations and major regions by the 10 main cuts – from previous page Carcase Forequarter 2014 tonnage Net change % change 2014 tonnage Net change % change 2014 tonnage 59,486 -1,098 -2% 11,500 1,837 19% 3,584 1,237 11,048 954 9% 5,366 1, 3 5 2 34% 0 0 CHINA 634 - 1, 9 5 6 - 76% 219 14 4 19 2 % 484 409 DUBAI 8,649 944 12 % 999 259 35% 108 2,308 Destination World Total USA Shortloin Net % change change % change 2014 tonnage Net change % change 6,834 1,236 22% 10,710 991 10% 6,195 217 4% 4,653 9 12 24% 4,036 - 73 - 2% 0 0 18 4 6 % 546% 15 10 18 3 % 174 -9 - 5% 2,860 81 3% 51 90% 72 4 6% 400 62 18 % 1 -4 - 76% 760 49% 3 2 14 3 % 89 15 2 1% 48 38 396% 1 1 18 4 % 53% 8,912 267 3% 41 - 32 - 44% BAHRAIN - 1, 3 4 3 - 10 % 6 0 - 8% 110 - 735 - 87% 395 - 11 - 3% 2 2 0 - 88 - 10 0 % JAPAN 168 31 23% 747 115 18 % QATAR 9,292 3,905 73% 218 35 18 18 4302% 17 5 988 264 36% 164 - 30 - 16 % 37 - 36 - 49% 783 60 8% SAUDI ARABIA 1,073 38 4% 430 10 0 30% 99 53 SOUTH KOREA 3 0 1% 194 74 6 1% 44 28 TAIWAN 38 - 26 - 4 1% 41 2 5% 0 0 KUWAIT 2,853 - 638 - 18 % 39 - 77 - 66% 58 36 16 1% ABU DHABI 2,154 - 34 - 2% 7 -9 - 57% - 12 - 10 0 % UNITED KINGDOM PAPUA NEW GUINEA MALAYSIA CANADA FRANCE SINGAPORE 0 0 307 19 0 SWITZERLAND Middle East SE Asia 6% Neck Net change 11,957 0 0 Shank 2014 tonnage JORDAN HONG KONG 30 Rack 0 0 - 7% 0 30 10 52% 65 7 13 % 63 62 10 6 0 0 % 2,890 522 22% 45 2 6% 31 -3 - 8% 2014 Net tonnage change % change 0 1,055 402 62% 0 23 -4 - 16 % 19 % 17 9 112 % 0 0 14 0 4 % 9 1 9% 46% 26 7 38% 29 - 28 - 49% 72 28 - 13 - 10 0 % 65 35 115 % 265 1,348 94 8% 451 115 % 0 -5 - 96% 158 62 64% 18 4 % 8 6 3 16 % 210 12 0 13 2 % 22 4 22% 8 8 15 5 7 0 % 307 19 5 17 6 % 2 - 30 - 93% 0 -1 - 73% 4 -5 - 54% 40 -4 - 9% -2 - 10 0 % 0 0 220 53 32% 338 9 3% 14 14 0 4 4 2308% 0 63% 920 - 524 - 36% - 2 13 - 45% 49 12 33% - 12 3 - 2 1% 0 0 3 2 93% 333 49 17 % 8 1% 163 9 6% 0 - 10 0 % 80 52 18 5 % 0 0 210 94 0 0 0 0 0 0 1 1 985% 0 45,030 600 1% 2,003 290 17 % 2,803 876 45% 87 9 12 % 734 15 5 27% 134 61 83% 1,567 358 30% 871 4 0% 5 - 16 - 76% 315 116 58% 566 - 19 2 - 25% 68 - 14 - 17 % MLA’s Market information & Industry insights – Australian sheep industry projections 2015 Sources and acknowledgements This document was produced and compiled by Meat & Livestock Australia (MLA), with the help of industry participants in the annual cattle projections workshop. Baseline forecasts were also provided by the Centre for International Economics’ Global Meat Industries (GMI) model. The sources listed below are also duly acknowledged for the provision of statistical, analytical and forecast information used in this document. Advantage Shopper Tracker China Customs Bureau Millward Brown Agriculture and Livestock Industry Corporation (ALIC), Japan Department of Agriculture (DA), Australia Ministry of Agriculture, Fisheries and Forestry (MAFF), Japan EU Comission Australian Bureau of Agricultural and Resource Economics and Sciences (ABARES) Eurostat Australian Bureau of Meteorology (BOM) Food and Agriculture Organisation (FAO) – United Nations Australian Bureau of Statistics (ABS) Copyright of ABS data resides with the Commonwealth of Australia. Used with permission Food Industry Foresight (FIF) Reserve Bank of Australia (RBA) Frost and Sullivan Roy Morgan Australian Wool Exchange (AWEX) Global Trade Atlas (Australia) Statistics NZ Australian Wool Innovation (AWI) Hong Kong Customs and Statistics Department Steiner Consulting Group, USA Australian Wool Production Forecasting Committee (AWPFC) IMA Asia The Economic Service – Beef + Lamb New Zealand Infoscan NZ United States Department of Agriculture (USDA) International Monetary Fund (IMF) United States Department of Commerce Business Monitor International (BMI) Japan's Nissei Research Institute Weeks Consulting Services Centre for International Economics (CIE) Japan Foodservice Association World Bank Chicago Mercantile Exchange Japan Chain Stores Association Beef + Lamb New Zealand (formerly Meat & Wool New Zealand) Ministry of Finance, Japan Nielsen Homescan NZ Ministry of Foreign Affairs and Trade MLA’s Market information & Industry insights – Australian sheep industry projections 2015 31 Acronyms AANZFT A – AANZFTA ASEAN-Australia-New Zealand FTA GT A TA – Global Trade Atlas ABARES – Australian Bureau of Agricultural and Resource Economics and Sciences IMF – International Monetary Fund JAEP A JAEPA – Japan-Australia Economic Partnership Agreement ABS – Australian Bureau of Statistics JFY – Japanese fiscal year (April to March) ASEAN – Association of South East Asian Nations lwt – Liveweight AWPFC – Australian Wool Production Forecasting Committee MENA – Middle East North Africa BMI – Business Monitor International MLA – Meat & Livestock Australia ChAFT A ChAFTA – China-Australia Free Trade Agreement NLRS – National Livestock Reporting Service (Meat & Livestock Australia) CIE – Centre for International Economics NZ – New Zealand PNG – Papua New Guinea CIF – Cost insurance and freight (export price at destination) CIS – Commonwealth of Independent States CME C ME – Chicago Mercantile Exchange cwt – Carcase weight DA – Department of Agriculture, Australia D FFA AT – Department of Foreign Affairs and Trade EMI – Eastern Market Indicator (wool price) EP A PA – Economic Partnership Agreement ESCAS – Exporter Supply Chain Assurance System EU – European Union FA S – Free alongside ship (export price before departure) FA O – Food and Agriculture Organisation (United Nations) FOB – Free on board ship (export price loaded on ship before departure) FT A TA – Free Trade Agreement 32 RBA – Reserve Bank of Australia SEA – South East Asia swt – Shipped weight TPP – Trans Pacific Partnership TRQ – Tariff Rate Quota UAE – United Arab Emirates UK – United Kingdom US – United States USDA – United States Department of Agriculture WTO – World Trade Organization MLA’s Market information & Industry insights – Australian sheep industry projections 2015 Notes MLA’s Market information & Industry insights – Australian sheep industry projections 2015 33 Meat & Livestock Australia Level 1, 40 Mount St North Sydney NSW 2060 Phone: 02 9463 9333 Fax: 02 9463 9393 Free call: 1800 023 100 (Australia only) Email: [email protected] www.mla.com.au

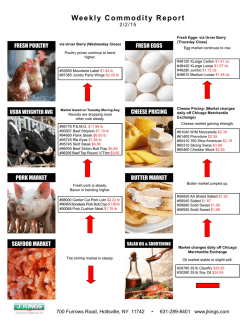


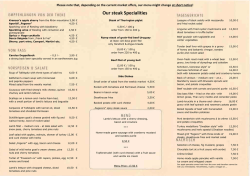

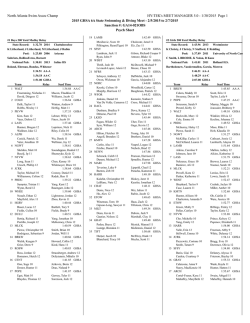
© Copyright 2026