
Company Report
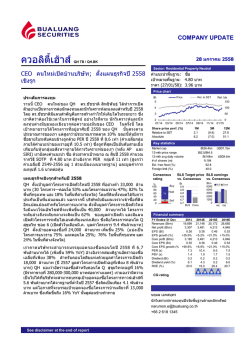
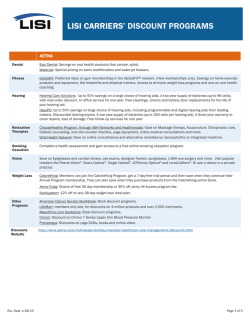
Friday, January 30, 2015
China Merchants Securities (HK) Co., Ltd.
Hong Kong Equity Research
Company Report
KWG Property (1813 HK)
John So
+852 3189 6357
Key takeaways from meeting with KWG
■
■
[email protected]
We met KWG’s IR head, Linda Wu yesterday
KWG expects to maintain 10-20% contracted sales growth in
2015 and the chairman is actively meeting investors recently which
we think it would help boost market confidence
WHAT’S NEW
■
BUY
We cut FY14-15E earnings by 5-6% but upgraded FY16E by 10%.
Valuation is distressed at 68% disc. to NAV and 3.6x FY15E P/E
Maintain stable GPM and target 10-20% annual growth
Though competition was keen and KWG had to lower some project
selling prices last year, the company was confident that the margin
pressure was not significant through their cautious new land purchases.
We estimate its FY14/15E GPM could be 35.1%/33.5%, not much lower
than the 36.2% in FY13. Looking ahead in 2015, KWG expects it has less
pressure on price cut and it preliminarily targets to have 10-20%
contracted sales growth (our estimate at 15% or RMB23.6bn), based on
10-20% growth in its saleable resource.
In 2015, we believe KWG’s prospect remains robust as it has
accumulated lots of quality land sites over the past two years. As KWG
would keep some Grade A offices for long-term rental purposes, we
slightly revise down FY14/15E core profits by 5%/6% so as to reflect
lower bookings of office projects. We expect KWG to achieve 16%/18%
earnings growth in FY14/15E after the revision. We believe KWG would
keep its 25-30% dividend pay-out ratio and we forecast FY14/15E
dividend yield of 7.6%/8.4%. We estimate the net gearing is about 67% at
FY14E year-end, lower than its peer average at 79%.
Target price unchanged at HK$7.50
Current valuation at 68% discount to NAV and 3.6x FY15E P/E appears
distressed. We believe the market will gain confidence on KWG when it
announces annual results and the chairman meets more investors in
coming March, which could be potential short-term catalysts. We
maintain our 12-month target price at HKD7.5, based on 52% discount to
end-FY14 NAV or equal to 1SD above its 5-year mean.
RMB mn
2012
2013
2014E
2015E
2016E
Revenue
9,676
9,468
12,661
13,702
19,251
-4%
-2%
34%
8%
40%
1,924
2,344
2,723
3,205
4,585
43%
3%
22%
16%
18%
Core EPS (HK$)
0.84
1.02
1.19
1.40
2.00
Net gearing (%)
63%
56%
67%
67%
57%
P/E (core EPS)
6.0x
4.9x
4.2x
3.6x
2.5x
P/B
0.8x
0.6x
0.6x
0.5x
0.4x
3.6%
7.3%
7.6%
8.4%
12.0%
Core profit growth (%)
Dividend yield
Price
HK$4.99
12-month Target Price
(Potential upside)
HK$7.5 (+50%)
Previous
HK$7.5
Price Performance
(%)
1813
80
HSI Index
40
20
0
-20
Jan/14
May/14
Sep/14
Dec/14
Source: Bigdata
%
1813 HK
HSI
1m
0.2
6.5
6m
(12.0)
1.8
12m
31.7
13.2
Industry: Property
Hang Seng Index
HSCEI
Key Data
52-week range (HK$)
Market cap (HK$ mn)
Avg. daily volume (mn)
BVPS (HK$)
Shareholdings Structure
Financials
Core net profit
BUY
60
Sound earnings growth and dividend yield
Revenue growth (%)
Previous
Kong’s Family
Morgan Stanley
Free float
24596
11736
3.46-6.49
14,437
7.71
7.70
60.5%
6.5%
33.0%
Source: Company data, CMS (HK) estimates
To access our research reports on the Bloomberg terminal, type CMHK <GO>
1
2015 年 1 月 30 日(星期五)
公司报告
招商证券(香港)有限公司
合景泰富 (1813 HK)
苏淳德
+852 3189 6357
与公司沟通纪要
■
■
[email protected]
我们昨天与公司的投资者关系总监会面。
公司预计在2015年合同销售将保持10-20%的增长。公司主席近期积极
与投资者见面,我们认为这将有助于提振市场信心。
■
最新变动
我们将2015-15财年的盈利预测调低5-6%,但同时将2016年的预测值
调高10%。目前估值受压,对应3.6倍2015年市盈率,较NAV有68%的折
让。
买入
毛利率保持稳定,合同销售目标增长率为10-20%
股价
尽管在激烈的竞争下,公司去年不得不降低部分项目的售价,公司相信由
于买地谨慎,利润率压力并不大。我们预计公司2014/15财年的毛利率为
35.1%/33.5%,仅略低于2013年度的水平(36.2%)。公司预计2015年降
价的压力将减小,同时基于可供出售资源10-20%的增长率,初步设定合同
销售增长目标为10-20% (我们的预计为+15%或236亿元人民币)
。
HK$7.5 (+50%)
前次目标价
HK$7.5
股价表现
80
我们相信公司2015年前景向好。公司在过去两年积累了大量的优质土地。
由于公司将保留部分甲级写字楼用于长期出租,我们将2014/15财年的核
心利润预测下调5%/6%。调整后,我们预计公司2014/15财年的盈利增长
为 16% /18% 。 我 们 相 信 公 司 将 维 持 25-30% 的 股 息 支 付 率 , 并 预 计
2014/15年度的股息收益率为7.6%/ 8.4%。我们预计2014财年末净负债率
约为67%,低于行业79%的平均水平。
HK$4.99
12个月目标价
(上涨空间)
(%)
良好的盈利增长和股息率
买入
前次评级
1813
HSI Index
60
40
20
0
-20
Jan/14
May/14
Sep/14
Dec/14
资料来源:贝格数据
维持7.50港元的目标价不变
当前估值受压,对应3.6倍的2015财年市盈率,较NAV有68%的折让。我们
相信三月业绩公布及公司高管与更多投资者会面后,市场将重拾对公司的
信心。这些因素均可能是短期的催化剂。基于相对2014财年末NAV 52%的
折让或高于5年平均值1个标准差的水平,我们维持7.50港元的12个月目标
价不变。
%
1813 HK
HSI
行业:房地产
恒生指数
国企指数
1m
0.2
6.5
6m
(12.0)
1.8
12m
31.7
13.2
24596
11736
重要数据
52周股价区间(港元)
港股市值(百万港元)
日均成交量(百万股)
盈利预测及估值
人民币百万元
2012
2013
2014E
2015E
2016E
营业额
9,676
9,468
12,661
13,702
19,251
同比增长 (%)
核心净利润
同比增长 (%)
-4%
-2%
34%
8%
40%
1,924
2,344
2,723
3,205
4,585
3%
22%
16%
18%
43%
核心每股盈利 (港元)
0.84
1.02
1.19
1.40
2.00
净负债率 (%)
63%
56%
67%
67%
57%
市盈率 (核心每股盈利)
6.0x
4.9x
4.2x
3.6x
2.5x
市净率
0.8x
0.6x
0.6x
0.5x
0.4x
股息率
3.6%
7.3%
7.6%
8.4%
12.0%
每股净资产(港元)
主要股东
孔氏家族
Morgan Stanley
自由流通量
3.46-6.49
14,437
7.71
7.70
60.5%
6.5%
33.0%
资料来源:公司资料、招商证券(香港)估计
彭博终端报告下载: CMHK <GO>
2
Friday, January 30, 2015
Focus charts
Figure 1: Discount to NAV Band
Figure 2: Contracted sales
YoY chg
RMB mn
9.0
2SD = 46%discount+
30,000
50%
8.0
+1SD = 53%
discount
Share Price (HKD)
7.0
25,000
40%
20,000
6.0
Mean = 61%
discount
5.0
30%
15,000
-1SD = 69% discount
4.0
20%
10,000
3.0
-2SD = 77%
discount
10%
5,000
2.0
-
1.0
Oct-09 Jan-10 Apr-10 Jul-10 Oct-10 Jan-11 Apr-11 Jul-11 Oct-11 Jan-12 Apr-12 Jul-12 Oct-12 Jan-13 Apr-13 Jul-13 Oct-13 Jan-14 Apr-14 Jul-14 Oct-14 Jan-15
0%
FY12
FY13
FY14
Total
FY15E
FY16E
YoY change
Source: Bloomberg, CMS(HK)
Source: Company data, CMS(HK)
Figure 3: Revenue and profit growth
Figure 4: Net gearing
Net gearing (%)
50%
80%
40%
75%
30%
70%
65%
20%
60%
10%
55%
0%
2012
2013
2014E
2015E
2016E
-10%
50%
45%
Revenue
40%
Recurring net profit
2010
2011
2012
Source: Company data, CMS(HK)
Source: Company data, CMS(HK)
Figure 5: Interest coverage
Figure 6: Landbank (GFA)
2013
2014E
2015E
Tier-3 city,
14%
(x)
3.0
2.5
2.0
Tier-2 city,
35%
1.5
1.0
Tier-1 city,
51%
0.5
2012
2013
2014E
2015E
2016E
Source: CMS(HK)
Source: Company data, CMS(HK)
Note: Operating profit / total interest (including capitalized
portion)
To access our research reports on the Bloomberg terminal, type CMHK <GO>
3
Friday, January 30, 2015
Sector’s valuation
Figure 7: Peer comparison: valuation (Based on market close at 29 January 2015)
Company
Mkt cap 3-mth avg t/o
Discount
(USDm)
(USDmn) NAV (HKD) to NAV (%) P/E Hist (x) P/E FY1 (x) P/E FY2 (x)
Div yld Div yld FY1
Hist (%)
(%)
Net
gearing
Hist (%)
P/B Hist
(x) P/B FY1 (x)
Net
gearing
FY1 (%)
Ticker
Price
33.0
8.0
7.0
6.4
6.0
3.9
1.3
1.2
62.7
84.9
688 HK
22.90
24,146
74.8
28.2
18.8
9.7
8.5
7.6
2.1
2.1
1.7
1.4
28.2
39.3
CR Land
1109 HK
20.20
17,017
35.3
33.0
38.8
12.5
10.0
8.3
2.2
2.1
1.6
1.4
38.8
46.7
Country Garden
2007 HK
3.06
8,033
15.9
5.0
39.2
5.5
5.1
5.1
6.9
5.9
1.1
0.9
64.3
68.6
Ev ergrande
3333 HK
3.20
6,022
12.6
5.3
39.6
4.9
5.3
5.9
16.9
4.7
0.8
0.8
147.6
282.4
Longf or
960 HK
10.12
7,583
4.7
14.6
30.7
7.2
6.4
5.2
2.8
3.1
1.2
1.0
57.9
59.4
Shimao Property
813 HK
16.22
7,266
24.0
27.3
40.6
6.1
5.4
5.2
5.0
5.6
1.1
0.9
57.4
57.6
2202 HK
16.92
23,074
28.8
22.0
23.1
10.0
8.7
7.4
N/A
3.5
2.0
1.7
44.7
40.4
55.7
5.4
6.8
6.8
5.6
5.0
0.6
0.6
63.2
75.8
3383 HK
4.71
2,380
10.9
14.4
67.3
3.3
3.7
3.8
10.1
6.0
0.4
0.4
97.6
106.1
978 HK
1.11
702
1.6
3.3
66.4
9.4
10.6
6.9
1.1
1.0
0.8
0.8
3.7
45.3
81 HK
4.16
1,225
2.4
9.0
53.8
3.4
4.3
3.6
2.6
2.4
0.8
0.7
44.0
64.9
CIFI Holdings
884 HK
1.55
1,205
0.5
3.9
60.3
5.4
3.8
3.2
4.5
5.7
0.9
0.7
67.9
69.8
Franshion Ppt
817 HK
2.26
2,644
3.1
4.5
49.8
4.9
6.3
5.4
4.2
4.5
0.7
0.6
44.9
54.3
3900 HK
6.85
1,909
8.4
18.1
62.2
2.8
5.9
3.7
7.9
3.4
0.5
0.5
71.2
89.3
754 HK
6.87
1,989
0.7
25.0
72.5
5.6
12.3
18.6
N/A
0.0
0.3
N/A
61.6
N/A
Kaisa
1638 HK
1.59
1,053
4.2
2.5
36.4
2.2
2.1
1.8
9.4
10.8
0.4
0.3
70.0
90.0
KWG Property
Large peer average
China Ov erseas
China Vanke Co-H
Mid-and-small peer average
Agile Property
CM Land
COGO
Greentown China
Hopson
1813 HK
4.99
1,896
7.0
15.7
68.2
4.9
4.2
3.6
7.3
7.6
0.6
0.6
56.3
67.0
Poly Property
119 HK
3.64
1,716
13.0
8.1
55.1
4.9
6.7
6.0
6.1
5.2
0.4
0.4
94.4
102.1
Shenzhen Inv estment
604 HK
2.28
1,958
2.4
6.0
62.0
3.9
7.0
6.3
6.6
7.9
0.5
0.4
80.7
N/A
Shui On Land
272 HK
1.76
1,817
1.7
n.a.
n.a.
12.2
15.1
13.4
3.5
3.1
0.3
0.3
76.6
62.0
3377 HK
4.89
4,717
3.3
8.0
38.9
6.7
8.1
7.0
4.8
4.7
0.7
0.7
53.9
54.8
410 HK
5.41
3,629
2.9
8.6
37.1
4.9
10.4
18.4
5.8
5.7
0.6
0.6
18.0
12.5
1918 HK
6.94
3,028
14.9
15.3
54.6
5.2
4.5
3.1
3.5
4.2
1.3
1.0
69.7
71.6
123 HK
1.53
2,448
6.0
3.5
56.3
7.9
6.9
6.5
5.2
5.2
0.5
0.5
47.0
66.9
48.8
6.2
6.9
6.7
5.7
4.7
0.8
0.8
63.1
78.7
Sino Ocean
SOHO China
Sunac
Yuexiu Property
Average
Source: CMS (HK), Bloomberg
Figure 8: KWG’s discount to NAV band
9.0
2SD = 46% discount+
8.0
+1SD = 53%
discount
Share Price (HKD)
7.0
6.0
Mean = 61%
discount
5.0
4.0
-1SD = 69% discount
3.0
-2SD = 77%
discount
2.0
1.0
Oct-09 Jan-10 Apr-10 Jul-10 Oct-10 Jan-11 Apr-11 Jul-11 Oct-11 Jan-12 Apr-12 Jul-12 Oct-12 Jan-13 Apr-13 Jul-13 Oct-13 Jan-14 Apr-14 Jul-14 Oct-14 Jan-15
Source: CMS (HK), Bloomberg
To access our research reports on the Bloomberg terminal, type CMHK <GO>
4
Friday, January 30, 2015
Change in earnings forecasts
Fine-tuned FY14/15E earnings forecast by -5%/-6%
As KWG would keep some Grade A offices for long-term rental purposes, we slightly revise down FY14/15E core
profits by 5%/6% so as to reflect lower bookings of office projects. We estimate KWG to achieve 16%/18% earnings
growth in FY14/15E after the revision.
Upgrade FY16E earnings by 10%. We revise up FY16E profits by 10% mainly because we included the profit
contributions from some of the newly acquired projects in 2014.
Figure 9: Change in P&L forecasts
Original
12,754
(8,281)
4,473
(360)
(874)
(105)
76
1,292
(7)
FY14E
New
12,661
(8,223)
4,438
(360)
(874)
(105)
76
1,183
(7)
chg (%)
-1%
-1%
-1%
0%
0%
0%
0%
-8%
0%
Original
14,033
(9,318)
4,715
(451)
(1,028)
(227)
97
1,898
0
FY15E
New
13,702
(9,118)
4,584
(424)
(967)
(227)
95
1,680
0
chg (%)
-2%
-2%
-3%
-6%
-6%
0%
-2%
-12%
n.a.
Original
18,304
(11,887)
6,417
(519)
(1,182)
(366)
105
1,851
0
FY16E
New
19,251
(12,059)
7,192
(488)
(1,112)
(366)
103
1,771
0
chg (%)
5%
1%
12%
-6%
-6%
0%
-2%
-4%
n.a.
4,494
(1,449)
6
3,052
4,351
(1,436)
6
2,921
-3%
-1%
0%
-4%
5,004
(1,550)
(32)
3,423
4,741
(1,504)
(32)
3,205
-5%
-3%
0%
-6%
6,305
(2,076)
(49)
4,180
7,099
(2,465)
(49)
4,585
13%
19%
0%
10%
Recurring net profit
2,854
2,723
-5%
3,423
3,205
-6%
4,180
4,585
10%
Gross profit margin (%)
Reported net profit margin (%)
Recurring net profit margin (%)
35.1%
23.9%
22.4%
35.1%
23.1%
21.5%
0.0%
-0.9%
-0.9%
33.6%
24.4%
24.4%
33.5%
23.4%
23.4%
-0.1%
-1.0%
-1.0%
35.1%
22.8%
22.8%
37.4%
23.8%
23.8%
2.3%
1.0%
1.0%
(RMB mn)
Revenue
Cost of goods sold
Gross Profit
Selling expense
General & admin expense
Interest Expense
Interest Income
JCE & Associate items
Others
Pre-tax profit
Income tax & LAT
Minority Interests
Reported net profit
Source: CMS (HK)
Figure 10: Profit and Loss Highlights
(RMB mn)
Revenue and GFA sales details
Total GFA delivered (k sqm) (1)
Average selling price booked (RMB psm) (2)
Property sales (1) x (2)
Others
Total Revenue
Gross profit
Profits from JCEs / Asso.
FY12
796
11,715
9,330
346
9,676
3,536
479
FY13
937
9,582
8,977
491
9,468
3,432
884
FY14E
1,003
11,974
12,010
651
12,661
4,438
1,183
FY15E
1,194
10,846
12,950
752
13,702
4,584
1,680
FY16E
1,269
14,481
18,377
874
19,251
7,192
1,771
2,406
1,924
2,750
2,344
2,921
2,723
3,205
3,205
4,585
4,585
12,201
16,268
20,500
23,575
27,111
7,488
1,814
6,109
1,558
7,766
1,535
7,268
1,278
9,089
2,218
YoY changes (In %)
GFA delivered
Average selling price
Revenue
Gross profit
Profits from JCEs / Asso.
Reported net profit
Recurring net profit
Contracted sales
-13.2%
9.6%
-4.4%
-20.9%
n.a.
14.4%
3.5%
6.6%
17.6%
-18.2%
-2.1%
-2.9%
84.6%
14.3%
21.8%
33.3%
7.1%
25.0%
33.7%
29.3%
33.8%
6.2%
16.2%
26.0%
19.0%
-9.4%
8.2%
3.3%
42.0%
9.7%
17.7%
15.0%
6.3%
33.5%
40.5%
56.9%
5.4%
43.1%
43.1%
15.0%
Margin ratios (In %)
Gross margin
Reported net profit margin
Recurring net profit margin
36.5%
24.9%
19.9%
36.2%
29.0%
24.8%
35.1%
23.1%
21.5%
33.5%
23.4%
23.4%
37.4%
23.8%
23.8%
Reported net profit
Recurring net profit
Total contracted sales
Property development cost (RMB psm)
Recurring profit per GFA delivered (RMB psm)
Source: Company, CMS (HK)
To access our research reports on the Bloomberg terminal, type CMHK <GO>
5
Friday, January 30, 2015
Financial Summary
Balance Sheet
Profit & Loss Statement
RMB mn
2012 2013 2014E 2015E 2016E RMB mn
Current Assets
29,699
36,450
42,050
49,785
57,605
Gross Revenue
Cash
4,927
9,414
8,451
8,823
10,902
Cost of goods sold
Restricted cash
1,517
1,444
1,214
1,214
1,214
Gross Profit
3,536
Current receivables
1,316
2,632
2,222
2,222
2,222
Admin exp
(251)
Properties held for sale
3,988
4,036
3,798
4,111
5,775
Selling exp
Properties under development & land prepaid
17,951
18,924
26,365
33,416
37,492
Other current assets
0
0
0
0
0
Non-current assets
19,166
25,140
29,506
28,723
28,035
7,943
9,311
9,601
9,539
9,480
Fixed Assets
Land and properties under development
2012 2013 2014E 2015E 2016E
9,468
12,661
13,702
19,251
(6,140) (6,036)
(8,223)
(9,118)
(12,059)
3,432
4,438
4,584
7,192
(261)
(360)
(424)
(488)
(643)
(753)
(874)
(967)
(1,112)
Finance cost
(69)
(214)
(105)
(227)
(366)
JCE & Associates
479
884
1,183
1,680
1,771
Others
Pre-tax profit
Income tax
9,676
714
616
69
95
103
3,766
3,704
4,351
4,741
7,099
(1,333)
(954)
(1,436)
(1,504)
(2,465)
(27)
0
6
(32)
(49)
1,056
859
849
849
849
Other non-current assets
10,167
14,970
19,056
18,336
17,706
MI
Total assets
48,865
61,590
71,555
78,508
85,641
Reported net profit
2,406
2,750
2,921
3,205
4,585
Current liabilities
35,543
Core profit
1,924
2,344
2,723
3,205
4,585
18,895
24,987
31,491
34,083
Bank and other loans
3,100
3,065
3,653
3,653
3,653
Presales receipts in advance
4,125
5,699
7,029
10,087
10,920
Accounts payable & other payables
5,842
6,086
6,693
6,693
6,693
Core EPS (RMB)
0.66
0.81
0.94
1.11
1.58
Other current liabilities
5,828
10,137
14,116
13,650
14,277
DPS (RMB)
0.15
0.29
0.30
0.33
0.48
Non-current Liabilities
14,616
18,760
20,240
22,240
24,240
Bank and other loans
13,090
17,840
19,304
21,304
23,304
Note: We deduct property revaluations and other exceptional items to
arrive at recurring net profit
1,526
920
936
936
936
Total Liabilities
33,511
43,747
51,731
56,323
59,783
Shareholders' Equity
15,282
17,818
19,806
22,134
25,758
72
25
19
51
100
Others
Minority interests
Ratios
%
2012 2013 2014E 2015E 2016E
Growth (%)
Total equity & Liabilities
48,865
61,590
71,555
78,508
85,641
Note: Total cash includes both cash and restricted cash
-4%
-2%
34%
8%
40%
-21%
-3%
29%
3%
57%
Recurring net profit
3%
22%
16%
18%
43%
PUD and inventory
4%
4%
30%
24%
15%
Contracted sales
7%
33%
26%
15%
15%
Gross profit
Cashflow Statement
RMB mn
Revenue
2012 2013 2014E 2015E 2016E
Operating cashflow
2,811
6,256
8,800
4,853
6,639
Profit before tax
3,766
3,704
4,351
4,741
7,099
Profitability (%)
Working capital chg
2,755
6,855
9,190
5,736
5,167
Gross margin
37%
36%
35%
33%
37%
Tax paid
(1,149)
(548)
(1,659)
(1,970)
(1,838)
Recurring net profit margin
20%
25%
22%
23%
24%
Interest paid
(1,595)
(1,915)
(2,097)
(2,269)
(2,441)
Effective tax rate
35%
26%
33%
32%
35%
(966)
(1,840)
(986)
(1,386)
(1,348)
ROE
13%
14%
14%
15%
19%
Investing cashflow
(3,916)
(6,875)
(10,976)
(5,605)
(5,597)
ROA
4%
4%
4%
4%
6%
Fixed assets additions
(1,017)
(547)
(200)
(100)
(100)
18%
31%
30%
30%
30%
Deposits paid for land purchase
(8,000)
Other operating cashflow
(1,800)
(2,200)
(8,000)
(8,000)
Subsidiary acquisitions / disposals
(218)
(366)
0
0
0
JCE and associates movements
(898)
(3,743)
(2,852)
2,400
2,400
17
(19)
76
95
103
Financing cashflow
2,007
5,126
1,213
1,124
Dividend paid
(637)
(434)
(839)
(876)
Increase/decrease in loans
2,623
5,558
2,052
2,000
2,000
21
2
0
0
0
Other investing cashflow
Other financing cashflow
Cashflows for the year
Cash at the beginning
Exchange difference
Cash at the end
Dividend Pay Out
Liquidity
(1,122)
(600)
(2,252)
(847)
939
Total Debt - Total Equity Ratio
105%
117%
116%
112%
104%
1,038
Net Debt - Total Equity Ratio
63%
56%
67%
67%
57%
(962)
Interest coverage (x)
1.9
1.7
2.1
2.1
3.0
902
4,507
(963)
372
2,080
4,025
4,927
9,414
8,451
8,823
0
(20)
0
0
0
4,927
9,414
8,451
8,823
10,902
Free cashflow (Rmb mn)
Note: we reclassify land capex from operating cashflows into investing cashflows,
which is different from the company’s financial statements.
Source: Company data, CMS (HK) estimates
To access our research reports on the Bloomberg terminal, type CMHK <GO>
6
Friday, January 30, 2015
Investment Ratings
Rating
BUY
Definition
Expected to outperform the market index by >10% over the next 12 months
NEUTRAL
Expected to outperform or underperform the market index by 10% or less over the next 12 months
SELL
Expected to underperform the market index by >10% over the next 12 months
Analyst Disclosure
The analysts primarily responsible for the preparation of all or part of the research report contained herein hereby certify that: (i) the views expressed in this research report accurately reflect the
personal views of each such analyst about the subject securities and issuers; and (ii) no part of the analyst’s compensation was, is, or will be directly or indirectly, related to the specific
recommendations or views expressed in this research report.
Regulatory Disclosure
Please refer to the important disclosures on our website http://www.newone.com.hk/cmshk/en/disclosure.html.
Disclaimer
This document is prepared by China Merchants Securities (HK) Co., Limited (“CMS HK”). CMS HK is a licensed corporation to carry on Type 1 (dealing in securities), Type 2 (dealing in futures),
Type 4 (advising on securities), Type 6 (advising on corporate finance) and Type 9 (asset management) regulated activities under the Securities and Futures Ordinance (Chapter 571). This
document is for information purpose only. Neither the information nor opinion expressed shall be construed, expressly or impl iedly, as an advice, offer or solicitation of an offer, invitation,
advertisement, inducement, recommendation or representation of any kind or form whatsoever to buy or sell any security, financial instrument or any investment or other specific product. The
securities, instruments or strategies discussed in this document may not be suitable for all investors, and certain investors may not be eligible to participate in some or all of them. Certain
services and products are subject to legal restrictions and cannot be offered worldwide on an unrestricted basis and/or may not be eligible for sale to all investors. CMS HK is not registered as a
broker-dealer in the United States and its products and services are not available to U.S. persons except as permitted under SEC Rule 15a-6.
The information and opinions, and associated estimates and forecasts, contained herein have been obtained from or are based on sources believed to be reliable. CMS HK, its holding or
affiliated companies, or any of its or their directors, officers or employees (“CMS Group”) do not represent or warrant, expressly or impliedly, that it is accurate, correct or complete and it should
not be relied upon. CMS Group will not accept any responsibility or liability whatsoever for any use of or reliance upon this document or any of the content thereof. The contents and information
in this document are only current as of the date of their publication and will be subject to change without prior notice. Past performance is not indicative of future performance. Estimates of
future performance are based on assumptions that may not be realized. The analysis contained herein is based on numerous assu mptions. Different assumptions could result in materially
different results. Opinions expressed herein may differ or be contrary to those expressed by other business divisions or other members of CMS Group as a result of using different assumptions
and/or criteria.
This document has been prepared without regard to the individual financial circumstances and investment objectives of the persons who receive it. Use of any information herein shall be at the
sole discretion and risk of the user. Investors are advised to independently evaluate particular investments and strategies, take financial and/or tax advice as to the implications (including tax) of
investing in any of the securities or products mentioned in this document, and make their own investment decisions without relying on this publication.
CMS Group may have a long or short position, make markets, act as principal or agent, or engage in transactions in securities of companies referred to in this document and may also perform
or seek to perform investment banking services or provide advisory or other services for those companies. This document is for the use of intended recipients only and this document may not
be reproduced, distributed or published in whole or in part for any purpose without the prior consent of CMS Group. CMS Group will not be liable for any claims or lawsuits from any third parties
arising from the use or distribution of this document. This document is for distribution only under such circumstances as may be permitted by applicable law. This document is not directed at you
if CMS Group is prohibited or restricted by any legislation or regulation in any jurisdiction from making it available to you. In particular, this document is only made available to certain US
persons to whom CMS Group is permitted to make available according to US securities laws, but cannot otherwise be made available, distributed or transmitted, whether directly or indirectly,
into the US or to any US person. This document also cannot be distributed or transmitted, whether directly or indirectly, into Japan and Canada and not to the general public in the People’s
Republic of China (for the purpose of this document, excluding Hong Kong, Macau and Taiwan).
Hong Kong
China Merchants Securities (HK) Co., Ltd.
Address: 48/F, One Exchange Square, Central, Hong Kong
Tel: +852 3189 6888
Fax: +852 3101 0828
To access our research reports on the Bloomberg terminal, type CMHK <GO>
7


© Copyright 2026