
Temperature-dependent electron paramagnetic resonance
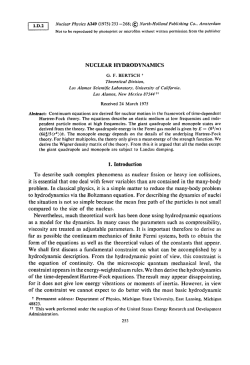
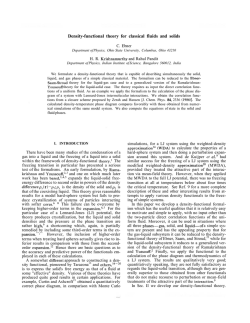
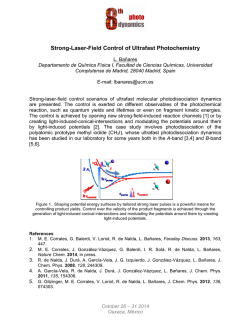
Temperature-dependent electron paramagnetic resonance studies of charge-ordered Nd0.5Ca0.5MnO3 Janhavi P. Joshi, Rajeev Gupta, A. K. Sood, and S. V. Bhat Department of Physics, Indian Institute of Science, Bangalore 560 012, India A. R. Raju and C. N. R. Rao CSIR Centre for Excellence in Chemistry, Jawaharlal Nehru Centre for Advanced Scientific Research, Jakkur P.O., Bangalore 560 064, India We report electron paramagnetic resonance measurements on single crystalline and powder samples of Nd0.5Ca0.5MnO3 across the charge-ordering transition at T coϭ240 K down to the antiferromagnetic ordering transition at T N ϭ140 K. The changes in the linewidth, g-factor and intensity as functions of temperature are studied to understand the nature of spin-dynamics in the system. We explain the observed large decrease in the linewidth from T N to T co in terms of motional narrowing caused by the hopping of the Jahn–Teller polarons yielding an activation energy of E a ϭ0.1 eV. Similar analysis of data on Pr0.6Ca0.4MnO3 published earlier gives E a ϭ0.2 eV. Below T co , the g-value increases continuously suggesting a gradual strengthening of the orbital ordering. We give a qualitative explanation of the maximum in the asymmetry ratio A/B observed at T co and its temperature dependence in single crystal spectra which also supports the model of motional narrowing. I. INTRODUCTION Doped perovskite manganites of the form RE1Ϫx Ax MnO3 where RE is a trivalent rare earth ion such as La3ϩ , Pr3ϩ , and Nd3ϩ , and A is a divalent alkaline earth ion such as Ca2ϩ , Sr2ϩ , and Ba2ϩ are mixed valent systems containing Mn3ϩ and Mn4ϩ . They exhibit a multitude of magnetic, electronic and structural phase transitions as functions of doping level x ͑which controls the Mn3ϩ to Mn4ϩ ratio͒, temperature, magnetic, and electric fields.1–3 The interplay of charge, spin, and orbital degrees of freedom in these systems results in a substantial fragility of the phase boundaries with respect to the varying physical parameters. The dependence of physical properties on the choice of RE and A and their sizes can be quantitatively understood in terms of the tolerance factor t, defined as tϭ ͗ r RE,A͘ ϩr o / ͓ ͱ2( ͗ r Mn͘ ϩr o) ͔ , where ͗ r RE,A͘ is the average ionic radius of the rare earth or the alkaline earth ion, ͗ r Mn͘ is the average ionic radius of the manganese ions, and r o is the oxygen ion radius. For x ϭ0.5 and a certain range of t(Ͼϳ0.975),4 these systems exhibit the much studied phenomenon of colossal magnetoresistance ͑CMR͒. CMR refers to the large negative change in the resistivity of the material on the application of a magnetic field. In zero field these systems show an insulator-tometal transition coincident with a paramagnetic-toferromagnetic transition implicating the connection between the electronic and spin degrees of freedom. For 0.975Ͻt Ͻ0.992, the ferromagnetic metallic state becomes unstable with respect to an insulating, antiferromagnetic, chargeordered ͑CO͒ state ͑e.g., in Nd0.5Sr0.5MnO3 ) below a certain temperature. The CO state consists of real space ordering of Mn3ϩ and Mn4ϩ ions in the material, a phenomenon similar to Wigner crystallization.5 Further, for tр0.975 and 0.3рx р0.7 as in Pr0.6Ca0.4MnO3 and Nd0.5Ca0.5MnO3 , only a transition to a CO state is observed on cooling while the material becomes antiferromagnetic at a further lower temperature. The metallic ferromagnetic ground state of the manganites is understood in terms of Zener’s double exchange ͑DE͒ model.6 – 8 The basic feature of DE is the hopping of a d-hole from Mn4ϩ to Mn3ϩ via the oxygen which can also be looked upon as the transfer of an electron from the Mn3ϩ site to the central oxygen ion and simultaneously the transfer of an electron from the oxygen ion to the Mn4ϩ ion. Since such a transfer is most probable when the spins of the t 2g electrons of the Mn3ϩ ion are aligned with the t 2g spins of the adjacent Mn4ϩ ion, ferromagnetism occurs concommitantly with metallic conduction. Mn3ϩ ions being strong Jahn– Teller ͑J-T͒ ions, the mobile e g electron is also expected to carry the lattice distortion with it making the polaronic contribution to the conduction an important factor as well.9 As far as the CO phenomenon is concerned, one of the possible origins of it is thought to be the strong intersite electronic repulsive interaction normally present in the transition metal based oxides.10 However, the long range Coulomb repulsion alone cannot explain the observed high sensitivity of the CO state to an applied magnetic field because of which the CO state of some systems ‘‘melts’’ into a ferromagnetic metallic state. This result points toward a role for the spins of the carriers as well. Since electron paramagnetic resonance ͑EPR͒ is a powerful probe of spin dynamics, a number of EPR studies have been performed on CMR manganites aimed at understanding the microscopic nature of the interplay between spin and charge degrees of freedom.11–21 EPR results on the CMR materials show some characteristic features. The linewidths (⌬H) are large and show a minimum around the ferromagnetic transition temperature T c , increasing as a function of temperature on either side of it. A considerable amount of controversy exists regarding the interpretation of the ⌬H dependence on T for TϾT c . Seehra et al.,11 in an early study, attributed this behavior to spin-phonon interaction. While this interpretation was questioned in the later reports by other workers,12,16 present consensus seems to be that the linewidths have contributions from two main interactions, J-T distortion mediated crystal-field interactions ͑CF͒ and anisotropic Dzyaloshinsky–Moriya ͑DM͒ exchange interaction. The temperature dependence of the EPR linewidths based on these interactions has been calculated12,16 and the results seem to match the experimental findings quite well. However, Shengelaya et al.21 noticed a close similarity between the temperature dependent increase in the EPR linewidths and the conductivity in these materials and proposed a model based on the hopping of small polarons. The activation energy obtained from the linewidth dependence on temperature turns out to be similar to that obtained from the conductivity measurements. Ivanshin et al.20 indicate that different mechanisms may be operative in different regimes of x and lend support to the model proposed in Ref. 11 for 0.075рx р0.15. In contrast, the only published EPR work on a chargeordered manganite to date is that on Pr0.6Ca0.4MnO3 (PCMO).22 In this work it was found that below the charge-ordering transition temperature T co the linewidth slowly increased with decreasing temperature ͑apart from a significant jump at T co) before saturating at temperatures close to T N . On the high temperature side of T co , the temperature dependence was much weaker over the relatively small temperature range that was covered. In this study from the temperature dependence of the intensity above T co , the ferromagnetic exchange coupling constant was calculated to be 150 K. Further, the EPR g-factor showed the following interesting behavior: ͑1͒ A g-shift opposite to that expected for Mn3ϩ and Mn4ϩ was observed. ͑2͒ Below T co a gradual increase of g was observed with decreasing temperature, which was interpreted to be a signature of gradual strengthening of orbital ordering. ͑3͒ It was noted that the magnitude and the behavior of g were different from those reported for the CMR manganites where a temperature independent gϳ2 was observed. In this work we report the EPR study of Nd0.5Ca0.5MnO3 ͑NCMO͒ in the temperature range 4.2–300 K covering the antiferromagnetic ordering temperature T N and the chargeordering temperature T co . At zero field, NCMO with t ϭ0.930 is an insulator throughout the temperature range with T coϭ240 K and T N ϭ140 K. Below T N an antiferromagnetic phase with complete charge-ordering and orbital ordering is observed. Between T N and T co , the orbital ordering gradually develops as the temperature is lowered from T co to T N . At low fields both the antiferromagnetic phase and the CO phase have small magnetic susceptibility. At higher fields (Ͼ10 T),23 however, a spin-flip transition occurs and the ordering becomes ferromagnetic and the charge ordered state melts. In the present work we offer an explanation for the temperature dependence of the EPR linewidths in charge-ordered manganites including NCMO and PCMO, in terms of ‘‘motional narrowing’’ which we believe is particularly applicable to the behavior between T N and T co . From a qualitative understanding of the temperature dependence of the asymmetry ratio A/B, including the maximum observed at T co , we obtain an order of magnitude estimate of the electron diffusion time and show that it is consistent with the picture of ‘‘motional narrowing.’’ The similarity between the experimental results of PCMO and NCMO shows that the observed features are fingerprints of the CO state. II. EXPERIMENTAL DETAILS The single crystals of NCMO were prepared by the float zone technique. The dc magnetic susceptibility shows a large peak at T coϭ240 K and a relatively smaller peak at T N ϭ140 K.23,24,40 The resistivity which is weakly dependent on temperature for TϾT co shows a strong temperature dependence below T co , increasing by nearly three orders of magnitude from T co to T N . 23,24,40 The EPR experiments were carried out on both single crystal and powder samples using a Bruker X-band spectrometer ͑model 200D͒ equipped with an Oxford Instruments continuous flow cryostat ͑model ESR 900͒. The spectrometer was modified by connecting the X and Y inputs of the chart recorder to a 12 bit A/D converter which in turn is connected to a PC enabling digital data acquisition. With this accessory, for the scanwidth typically used for our experiments, i.e., 6000 G, one could determine the magnetic field to a precision of ϳ3 G. For single crystal study the static magnetic field was kept parallel to the c-axis of the crystal. The temperature was varied from 4.2 K to room temperature ͑accuracy: Ϯ1 K) and the EPR spectra were recorded while warming the sample. For measurements on powder, the powder was dispersed in paraffin wax. While doing experiments on both the single crystal and the powder, a speck of DPPH marker was used to ensure the accurate determination of the g-value of the sample. III. RESULTS AND DISCUSSION Figures 1͑a͒ and 1͑b͒ show the EPR spectra ͓ (d P/dH) vs H] recorded in the temperature range 290 K–180 K for single crystal and powder samples, respectively. Below 180 K the signals were too weak to be analyzed, and below T N no signal was observed. In these signals the sharp signal due to DPPH, used as the field marker, has been digitally subtracted to aid the fitting of the line shapes. As can be seen, the line shapes in the two cases differ significantly. In single crystals we observe a characteristic Dysonian line shape ͓ (A/B)Ͼ1, where A and B are the amplitudes of the low field and high field halves of the signal, respectively͔ while in the powder sample a symmetric Lorentzian line is observed. The asymmetric Dysonian line shapes result from a mixture of the absorptive and dispersive components of the susceptibility, caused by the nonuniform distribution of the microwave electromagnetic field due to the sample size being larger than the skin depth.25,26 Along with this the motion of the paramagnetic centers can also contribute to this asymmetry. Since the lines are very broad both in powder and single crystals, for accurate determination of the various line shape parameters we have fitted the signals to appropriate line shape functions. For the single crystal spectra we used the equation20 FIG. 1. EPR spectra of ͑a͒ single crystal and ͑b͒ powder sample of Nd0.5Ca0.5MnO3 for a few temperatures. The signal from DPPH has been subtracted. The solid line shows the fit of the experimental data to Eqs. ͑1͒ and ͑2͒ for ͑a͒ and ͑b͒, respectively. ͩ ͪ dP d ⌬Hϩ ␣ ͑ HϪH 0 ͒ ⌬Hϩ ␣ ͑ HϩH 0 ͒ ϭ ϩ , ͑1͒ dH dH ͑ HϪH 0 ͒ 2 ϩ⌬H 2 ͑ HϩH 0 ͒ 2 ϩ⌬H 2 where H 0 is the resonance field, ␣ is the fraction of the dispersion component added into the absorption signal, and ⌬H is the linewidth. The use of the two terms in the equation accounting for the clockwise as well as the anticlockwise circularly polarized component of microwave radiation is necessary because of the large width of the signals. The symmetric powder signals ͓Fig. 1͑b͔͒ are fitted to the Lorentzian shape function also incorporating the two terms as follows: ͩ ͪ ⌬H ⌬H d dP ϩ . ͑2͒ ϭ dH dH ͑ HϪH 0 ͒ 2 ϩ⌬H 2 ͑ HϩH 0 ͒ 2 ϩ⌬H 2 As can be seen from Fig. 1, the fits of the signals to the two line shape functions are excellent. The fitting parameters thus obtained are plotted as functions of temperature in Figs. 2 and 4. Figure 3 shows the temperature dependence of the A/B ratio ͑defined in the inset͒, obtained from the fitted line shapes. The g-values have been obtained from the fitted center field values H 0 , taking gϭ2.0036 for DPPH. The linewidths plotted are peak-to-peak line widths calculated from the Lorentzian full widths at half maxima ͑FWHM͒ obtained from the fits using ⌬H pp ϭ(⌬H FWHM / ͱ3). The origin of the EPR signal in manganites has been the subject of some discussion in literature. Normally, Mn3ϩ (3d4 , Sϭ2͒ EPR is difficult to observe because of the large zero field splitting and strong spin-lattice relaxation. However, a tetragonal J-T distortion makes it observable.18 It was recognized that the signals in manganites cannot be due to isolated Mn4ϩ (3d3 , Sϭ3/2͒ ions alone and all the Mn ions present, i.e., of both Mn3ϩ and Mn4ϩ types, were concluded to contribute to the signals. The EPR intensity is expected to be proportional to the dc susceptibility dc of the spins. This is borne out by the inset of Fig. 4͑c͒, where we show the product of the dc magnetization M and temperature T plotted as a function of T ͑adapted from Ref. 24͒. Two peaks are seen in MϫT vs T curve, a large one at T coϭ250 K, and a smaller one at T N ϭ140 K. Interestingly IEPRϫT vs T for the powder sample shown in Fig. 4͑c͒ is seen to follow MϫT vs T closely, indicating the proportionality between dc and IEPR . The temperature dependence of the asymmetry parameter A/B is shown in Fig. 3. The insets of the figure indicate the procedure adopted to determine the ratio A/B. It is clear that one needs to determine the baseline of the signal accurately FIG. 2. Temperature variation of the line shape parameters for the single crystal sample; ͑a͒ peak to peak linewidth ⌬H pp and ͑b͒ g-factor. FIG. 3. Variation of A/B ratio with temperature in single crystal spectra. The insets illustrate the method adopted to calculate the A/B ratio. EPR signals at two different temperatures ͑225 K and 190 K͒ ͑filled circles͒ with different A/B ratios, fitted to the Dysonian line shape of Eq. ͑1͒ ͑the solid line͒ are shown. The fitted signal is extended to a high field (ϳ20 000 and ϳ30 000 G, resp.͒ to obtain the base line. to obtain an accurate value of A/B. However, because of the large width of the signals, it was not possible to experimentally determine the baseline. Therefore, the fitted signal was extended to high values of the magnetic field (ϳ30 000 G) until a nearly horizontal baseline was obtained. Ideally one should observe the baseline on the low field side at the same level as that on the high field side. However, occasionally EPR signals, especially of the Dysonian line shapes,27 exhibit a mismatch between the low field and the high field baselines. Therefore we have joined the high field baseline, obtained from extrapolation, to the zero field value of the fitted signal to determine the overall signal baseline and to calculate the A/B ratio. Obviously this procedure leads to some error in the values of the latter. However, the fact that the trend of the temperature dependence of the ratio including its maximum is correctly reproduced can be seen from the two insets to Fig. 3, one for 225 K and another for 190 K. We have also performed an independent experiment with a thicker sample and verified that the values presented in Fig. 3 are actually lower than those for the thicker sample, thus rendering credence to the arguments to follow. From the plot of A/B vs T shown in Fig. 3 it can be seen that, starting from room temperature to close to T co , the A/B ratio remains essentially constant at a value ϳ2.75. This value, being higher than 2.55 expected for stationary spins27 indicates that the paramagnetic centers are mobile. At T co it undergoes a discontinuous increase to ϳ4. Further cooling results in a continuous decrease as expected from the monotonic increase in the resistivity of the sample. Similar but sharper change in A/B consistent with the sharper jump in resistivity was also observed at T co in PCMO.22 A qualitative understanding of this behavior can be obtained by taking into account the subtleties of the Dyson effect. As discussed by Kodera,27 the A/B ratio depends in a complex manner on various material parameters such as the ratio of the sample thickness to the skin depth ␦ , electron diffusion time through the skin depth T D and the spin–spin relaxation time T 2 . For certain ranges of these parameter values, as shown by him, A/B can go through a maximum ͑Figs. 8 and 10 of Ref. 27͒. In NCMO and PCMO, the transition to the CO state results in values of ␦ ͑through the changes in ) which, along with the values of T D and T 2 , make the A/B go through a maximum. Referring again to the analysis by Kodera, a peak value of FIG. 4. Temperature variation of the Lorentzian line shape parameters for the powder sample. ͑a͒ Peak-to-peak linewidth, ͑b͒ g-factor, ͑c͒ intensity times the temperature. The inset of ͑c͒ shows the product of magnetization M for Hʈ c and temperature T plotted as a function of T ͑adapted from Ref. 24͒. A/B of ϳ4 with in the range of 2–3 ͑which is reasonable for our sample size of ϳ1 mm, and of ϳ1 ⍀ cm 40 just below Tco) implies a value in the range of 1–5 for (T D /T 2 ) 1/2 ͑Fig. 5 of Ref. 27͒ where T 2 ϭ2/ͱ3(h/g  ⌬H pp ). It is well known that when the motional frequencies become comparable to the strength of the broadening interactions ͑expressed in frequency units͒, ‘‘motional narrowing’’ of the linewidth occurs. Thus the fact that T D is of the same order of magnitude as T 2 provides additional support to the model of ‘‘motional narrowing’’ to be discussed next. Figures 2͑a͒ and 4͑a͒ show the temperature dependence of the linewidth in the single crystal and the powder samples, respectively. It is noted that starting from room temperature down to T co , the linewidth decreases very slowly with temperature below which it increases with decreasing temperature, by a factor of 2 over the temperature range from 230 K to 160 K. We note that this increase in the linewidth is different from the behavior in CMR manganites. The ⌬H(T) in the latter has been the subject of some controversy in the literature.15,28,29 While in the ceramic and thin film samples ⌬H diverged after reaching a minimum at T min (ϳ1.1 T c where T C is the ferromagnetic transition temperature͒, in asgrown single crystal samples ⌬H remained independent of T below T c . The same exhibited an increase in ⌬H with decreasing T when the surface was polished to create craters of size 3– 8 m. Dominguez et al.28 attributed the increase in ⌬H below T c in ceramic and thin film samples to chemical and magnetic inhomogeneities. Rivadulla et al.,15,29 showed that the demagnetization fields arising from pores in polycrystalline samples and surface polished single crystals are responsible for the increase in ⌬H. The systems studied by these authors differ from our samples in one important respect. They are in the long range ferromagnetically ordered state whereas we are concerned with the charge-ordered state. Indeed it was found29 that ⌬H͑T͒ for T ϾTmin was proportional to magnetization M͑T͒ in these materials whereas in our systems, while ⌬H increases with decreasing T, the magnetization shows a nonmonotonic behavior, decreasing with decreasing T for most of the temperature range T N ϽTϽT co. Two questions are interesting in this context: ͑1͒ What is the origin of the linewidth? ͑2͒ What is the mechanism that narrows down the signal while going from T N to T co? Huber13 argues that in CMR manganites for TϾT c , the exchange narrowed dipolar linewidths must be orders of magnitude smaller than the observed values and therefore the dipolar interaction cannot be the cause of the linewidths. The magnitude and the temperature dependence of ⌬H then could be qualitatively explained with the assumption that the linewidth arises due to the anisotropic crystal-field ͑CF͒ effects and the Dzyloshinsky–Moriya ͑DM͒ exchange interactions. While it is likely that for TϾT co in NCMO and other CO manganites, a mechanism similar to that observed for TϾT c in CMR manganites is operative, it is clearly different for TϽT co since the T dependence is quite the opposite. Moreover, the alternate arrangement of Mn3ϩ and Mn4ϩ ions obtained in the CO state could lead to ‘‘exchange broadening’’ due to hetero-spin dipolar interaction instead of the ‘‘exchange narrowing’’ observed for homo-spin dipolar interaction.30 Keeping in mind the fact that the CO state culminates into an antiferromagnetically ordered state at T N , we now compare our results with EPR results of other antiferromagnetic materials in their paramagnetic state ͑i.e., for TϾT N ͒. A number of such studies have been reported starting with the early work of Burgiel and Strandberg31 on MnF2 to the more recent work on CuO by Monod et al.32 Both three-dimensional pseudocubic antiferromagnets ͑AFs͒, such as RbMnF3 , and two-dimensional AFs, such as K2 MnF4 , have been studied.33–38 A common feature of EPR in all these materials is that approaching T N from above ⌬H gradually decreases until close to T N where it quite sharply diverges. Thus, quite interestingly in the paramagentic phases of both antiferromagnetic and ferromagnetic systems the EPR linewidth decreases as the temperature is decreased toward the transition temperature. Our results on NCMO and on the previously reported PCMO show that the behavior in CO systems is exactly opposite; ⌬H decreasing as the temperature is increased above T N . In the same temperature range, the resistivity also decreases due to the activated hopping of the charge carriers viz. the Jahn–Teller polarons. The hopping motion of these Jahn–Teller polarons involves the hopping of e g electrons with its associated spin from one site (Mn3ϩ ) to another site (Mn4ϩ ). This random motion of the magnetic moments can lead to ‘‘motional narrowing’’ of the linewidth as suggested by Huber13 in a slightly different context. An analogy can be drawn between this situation and the motion of the ions in fast ionic conductors where the NMR linewidth which is the result of intermolecular dipolar interaction decreasing with increasing temperature due to an increase in ionic conductivity. This is a result of the ‘‘motional narrowing’’ of the NMR linewidths. We believe that the narrowing of the EPR signals in the CO manganites can be understood along similar lines, the hopping of the e g electrons leading to the averaging out of the interactions between the Mn3ϩ and Mn4ϩ magnetic moments such as the DM interaction. The motion can also decrease the effect of the crystal-field distortion on the linewidth. In the discussion of ‘‘motional narrowing’’ in NMR, the fluctuations which have significant spectral density around the frequency corresponding to the strength of the broadening interaction are known to have the maximum effect in averaging out the interaction. Assuming an exponential decay of the corresponding correlation function a semi empirical formula39 FIG. 5. ln c vs 1/T for ͑a͒ Nd0.5Ca0.5MnO3 and ͑b͒ Pr0.6Ca0.4MnO3 , obtained from Eq. ͑3͒. The solid lines are fits to the Arrhenius equation. ␦ 2 ϭ ␦ Љ0 2 ϩ ␦ Ј0 2 2 tanϪ1 ͑ ␣ ␦ c ͒ , ͑3͒ where ␦ is the linewidth of the signal, ␦ 0Љ is the residual linewidth, ␦ 0Ј is the rigid lattice linewidth, ␣ is a factor of the order of unity, and c is the correlation time, is used to describe the process of linewidth decrease with increase in temperature and to extract the corresponding correlation times. We have carried out similar exercise in the analysis of the linewidths of NCMO and PCMO single crystal data ͑data taken from Ref. 22͒. While qualitatively the ‘‘motional narrowing’’ is a reasonable explanation for the temperature dependence of the linewidth between T N and T co , one is faced with some problems in the quantitative analysis of the same. Because, as we see from Fig. 2͑a͒, the linewidth has not reached its ‘‘rigid lattice’’ value, the process being preempted by the occurrence of the transition to the antiferromagnetic state. We have therefore taken the largest width just above T N as the ‘‘rigid lattice’’ linewidth ␦ 0Ј and the smallest width below T co as the residual width ␦ Љ0 . Thus the rigid lattice linewidth and the residual linewidths are taken to be 3124 and 1208 G, respectively, for NCMO and 2773 and 1587 G, respectively, for PCMO. In Figs. 5͑a͒ and 5͑b͒ we present the results of c dependence on temperature for NCMO and PCMO single crystals. Assuming an Arrhenius dependence of c on T of the form c ϭ 0 e (Ea/k B T) , where k B is the Boltzmann constant, we estimate the activation energy E a to be 0.1 eV and 0.2 eV for NCMO and PCMO, respectively, which are close to the values obtained from other experiments. For example, Vogt et al.,40 obtain E a ϭ0.12 eV from -T measurements on NCMO. Similarly a value of 0.2 eV is obtained for the E a of PCMO.41 In view of the approximations made regarding the rigid lattice and residual linewidths, our values of E a should be taken only as approximate. By varying the two linewidths by about 5%, we find that E a also changes by about 10%. Even then, the fact that our values are of similar magnitudes as those obtained from other experiments points toward the essential correctness of the approach. Figure 4͑b͒ shows the temperature dependence of the g-factor in the powder sample. The behavior closely follows that observed in PCMO earlier by us. Both the unexpected positive g-shift and an increase in the g-value as the temperature is decreased are observed in NCMO as well. Since in the powder sample it is expected that the internal field effects are averaged out, we believe that the observed variation of g with temperature is intrinsic to the sample. This can possibly be explained by the changes in the spin-orbit coupling constant consequent to the orbital ordering. The effective g-value for a paramagnetic center is given by g effϭg(1 Ϯ(k/⌬)) where ⌬ is the crystal-field splitting and k is the spin-orbit coupling constant. The gradual build up of orbital ordering taking place when the temperature is decreased from T co to T N can change the spin-orbit coupling as well as the crystal-field splitting which can give rise to the observed increase in the g-value. As mentioned in Sec. I, in manganites charge, spin, lattice, and orbital degrees of freedom are intercoupled and the result of any experimental measurement may reflect contributions from more than one of these parameters. For example, it may be possible that the changing nature of the magnetic fluctuations, i.e., from antiferromagnetic to ferromagnetic as the temperature is varied from T N to T CO , could lead to the observed decrease in ⌬H and g. However, we note that while ⌬H and g decrease monotonically with increasing T in a manner analogous to the behavior of resistivity, magnetization shows a nonmonotonic behavior. Further, the lattice constants of the crystal are shown23 to change continuously from T N to T CO such that the distortion of the oxygen octahedra continuously changes. This would lead to a continuous change in the crystal field and therefore in the g-value. Our conclusions related to ⌬H(T) and g͑T͒ should be viewed in the light of this discussion. Now we consider the effects of possible phase segregation in the sample on the temperature dependence of ⌬H and g because it is conceivable that such phase separation can lead to the increase in ⌬H and g with decrease in T. Manganites are known to exhibit submicronscale coexistance of two competing phases, one, a hole-rich ferromagnetic phase and another, a hole-poor antiferromagnetic CO state. For example, Liu et al.,42,43 interpret the results of their optical reflectivity study on Bi1Ϫx Cax MnO3 (xу0.5) as signifying the phase separation behavior in which domains of antiferromagnetic and ferromagnetic order coexist. Uehara et al.,44 provide electron microscopic evidence for phase separation of (La,Pr,Ca)MnO3 into a mixture of insulating and metallic 1 Young-Kook Yoo, Fred Duewer, Haito Yang, Dong Yi, Jing-Wei Li, and X.-D. Xiang, Nature ͑London͒ 406, 704 ͑2000͒. 2 C. N. R. Rao and B. Raveau, Eds., Colossal Magnetoresistance, Charge Ordering and Related Properties of Manganese Oxides ͑World Scientific, Singapore, 1998͒. ferromagnetic regions. However, as amply illustrated in the recent review article by E. Dagotto et al.,45 as yet there is no clear understanding of the cause or nature of the phase separation. In fact, there is some experimental evidence against phase separation. For example, Mukhin et al.,46 interpret the results of antiferromagnetic resonance experiments in La1Ϫx Srx MnO3 as evidence against electronic phase separation. Therefore, since the possibility of occurrence of phase separation sensitively depends on the actual system, the nature of the phase transition, the level of doping, and the rate of cooling,47 it is necessary to examine the actual system being studied from this point of view. NCMO has recently been carefully studied by Millange et al.,23 by neutron diffraction and they find no evidence of any mixed phases for T N ϽTϽT co . Instead, they find as the temperature decreases from T co to T N , ferromagnetic correlations continuously decrease while the antiferromagnetic correlations increase. Based on this result, we feel that the behavior of ⌬H and g in NCMO is not a consequence of phase separation but can be attributed to the charge-ordering at T co and the gradual development of orbital ordering as the sample is cooled from T co to T N . However, further controlled experiments and calculations may be necessary to come to a definite conclusion about this aspect. IV. SUMMARY In summary we report EPR measurements on the chargeordering manganite Nd0.5Ca0.5MnO3 . We observe that various parameters of the EPR signals like linewidth, intensity, asymmetry parameter, and g-value are sensitive functions of temperature and these parameters also mark the charge ordering transition in this material. The observed change in the linewidth in the temperature range below T co can be explained using the semiempirical model of ‘‘motional narrowing.’’ The magnitude and the temperature dependence of the asymmetry ratio A/B support this model. Assuming an Arrhenius dependence of correlation time we estimate the activation energy of electron hopping to be 0.1 eV for NCMO and 0.2 eV for PCMO which are consistent with the results of other measurements. The g variation below T co possibly tracks the gradual strengthening of the orbital ordering and increasing crystal-field effects. ACKNOWLEDGMENTS The authors acknowledge the help of Sachin Parashar in sample preparation. J.P.J. would like to thank CSIR, India for financial support. S.V.B. and A.K.S. thank the Department of Science and Technology for financial support. Y. Tokura, Colossal Magnetoresistive Oxides ͑Gordon and Breach, New York, 2000͒. 4 H. Kuwahara and Y. Tokura, in Colossal Magnetoresistance, Charge Ordering and Related Properties of Manganese Oxides ͑World Scientific, Singapore, 1998͒, p. 219. 3 5 For a recent review, see C. N. R. Rao, A. Arulraj, A. K. Cheetam, and B. Raveau, J. Phys.: Condens. Matter 12, R83 ͑2000͒. 6 C. Zener, Phys. Rev. 82, 403 ͑1951͒. 7 P. W. Anderson and H. Hasegawa, Phys. Rev. 100, 675 ͑1955͒. 8 P. G. de Gennes, Phys. Rev. 118, 141 ͑1960͒. 9 A. J. Millis, P. B. Littlewood, and B. I. Shraiman, Phys. Rev. Lett. 74, 5144 ͑1995͒. 10 S. K. Mishra, R. Pandit, and S. Satpathy, Phys. Rev. B 56, 2316 ͑1997͒. 11 M. S. Seehra, M. M. Ibrahim, V. Suresh Babu, and G. Srinivasan, J. Phys.: Condens. Matter 8, 11 283 ͑1996͒. 12 D. L. Huber, G. Alejandro, A. Caneiro, M. T. Causa, F. Prado, M. Tovar, and S. B. Oseroff, Phys. Rev. B 60, 12 155 ͑1999͒. 13 D. L. Huber, J. Appl. Phys. 83, 6949 ͑1998͒. 14 S. B. Oseroff, M. Torikachvili, J. Singley, S. Ali, S.-W. Cheong, and S. Schultz, Phys. Rev. B 53, 6521 ͑1996͒. 15 F. Rivadulla, M. A. Lopez-Quintela, L. E. Hueso, J. Rivas, M. T. Causa, C. Ramos, R. D. Sanchez, and M. Tovar, Phys. Rev. B 60, 11 922 ͑1999͒. 16 M. T. Causa, M. Tovar, A. Caneiro, F. Prado, G. Ibanez, C. A. Ramos, A. Butera, B. Alascio, X. Obrados, S. Pinol, F. Rivadulla, C. Vazquez-Vazquez, M. A. Lopez-Quintela, J. Rivas, Y. Tokura, and S. B. Oseroff, Phys. Rev. B 58, 3233 ͑1998͒. 17 M. Tovar, G. Alejandro, A. Butera, A. Caneiro, M. T. Causa, F. Prado, and R. D. Sanchez, Phys. Rev. B 60, 10 199 ͑1999͒. 18 A. Shengelaya, G. Zhao, H. Keller, and K. A. Muller, Phys. Rev. Lett. 77, 5296 ͑1996͒. 19 ˙. S. E. Lofland, P. Kim, P. Dahiroc, S. M. Bhagat, S. D. Tyagi, S. G Karabashev, D. A. Shulyatev, A. A. Arsenov, and Y. Mukovskii, Phys. Lett. A 233, 476 ͑1997͒. 20 V. A. Ivanshin, J. Deisenhofer, H.-A. Krug von Nidda, A. Loidl, A. A. Mukhin, A. M. Balbashov, and M. V. Eremin, Phys. Rev. B 61, 6213 ͑2000͒. 21 A. Shengelaya, Guo-Meng Zhao, H. Keller, K. A. Muller, and B. I. Kochelaev, Phys. Rev. B 61, 5888 ͑2000͒. 22 Rajeev Gupta, Janhavi P. Joshi, S. V. Bhat, A. K. Sood, and C. N. R. Rao, J. Phys.: Condens. Matter 12, 6919 ͑2000͒. 23 F. Millange, S. de Brion, and G. Chouteau, Phys. Rev. B 62, 5619 ͑2000͒. 24 P. Murugavel, C. Narayana, A. K. Sood, S. Parashar, A. R. Raju, and C. N. R. Rao, Europhys. Lett. 52, 461 ͑2000͒. Freeman J. Dyson, Phys. Rev. 98, 349 ͑1955͒. 26 George Feher and A. F. Kip, Phys. Rev. 98, 337 ͑1955͒. 27 Hiroshi Kodera, J. Phys. Soc. Jpn. 28, 89 ͑1970͒. 28 M. Dominguez, S. E. Lofland, S. M. Bhagat, A. K. Raychoudhuri, H. L. Ju, T. Venkatesan, and R. L. Green, Solid State Commun. 97, 193 ͑1996͒. 29 F. Rivadulla, L. E. Hueso, C. Jardon, C. Vazquez-Vazquez, M. A. Lopez-Quintela, J. Rivas, M. T. Causa, C. A. Ramos, and R. D. Sanchez, J. Magn. Magn. Mater. 196-197, 470 ͑1999͒. 30 A. Abragam, Principles of Nuclear Magnetic Resonance ͑Clarendon, Oxford, 1961͒, p. 438. 31 J. C. Burgiel and M. W. P. Strandberg, J. Phys. Chem. Solids 26, 865 ͑1965͒. 32 P. Monod, A. A. Stepanov, V. A. Pashchenko, J. P. Vieren, G. Desgardin, and J. Jegoudez, J. Magn. Magn. Mater. 177-181, 739 ͑1998͒. 33 R. P. Gupta, M. S. Seehra, and W. E. Vehse, Phys. Rev. B 5, 92 ͑1972͒. 34 R. P. Gupta and M. S. Seehra, Phys. Lett. A 33, 347 ͑1970͒. 35 J. E. Gulley and V. Jaccarino, Phys. Rev. B 6, 58 ͑1972͒. 36 D. L. Huber and M. S. Seehra, Phys. Lett. A 43, 311 ͑1973͒. 37 P. M. Richards and M. B. Salamon, Phys. Rev. B 9, 32 ͑1973͒. 38 H. van der Vlist, A. F. M. Arts, and H. W. de Wijn, Phys. Rev. B 30, 5000 ͑1984͒. 39 A. Abragam, Principles of Nuclear Magnetic Resonance ͑Clarendon, Oxford, 1961͒, p. 456. 40 T. Vogt, A. K. Cheetham, R. Mahendiran, A. K. Raychaudhuri, R. Mahesh, and C. N. R. Rao, Phys. Rev. B 54, 15 303 ͑1996͒. 41 Ayan Guha, Ph.D. thesis, I.I.Sc., Bangalore, 2000. 42 H. L. Liu, S. L. Cooper, and S.-W. Cheong, Phys. Rev. Lett. 81, 4684 ͑1998͒. 43 Wei Bao, J. D. Axe, C. H. Chen, and S.-W. Cheong, Phys. Rev. Lett. 78, 543 ͑1997͒. 44 M. Uehara, S. Mori, C. H. Chen, and S.-W. Cheong, Nature ͑London͒ 399, 560 ͑1999͒. 45 E. Dagotto, T. Hotta, and A. Moreo, ArXiv: Cond. Matt./0012117. 46 A. A. Mukhin, V. Yu. Ivanov, V. D. Travkin, A. Pimenov, A. Loidl, and A. M. Balbashov, Europhys. Lett. 49, 514 ͑2000͒. 47 M. Uehara and S.-W. Cheong, Europhys. Lett. 52, 674 ͑2000͒. 25
© Copyright 2026