
Singapore Banks
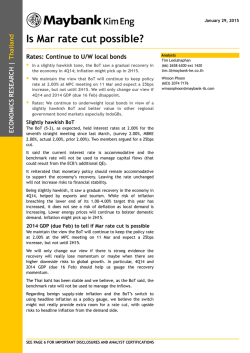
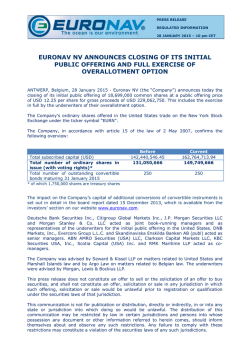
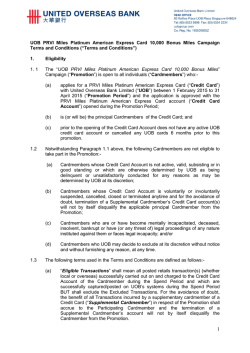
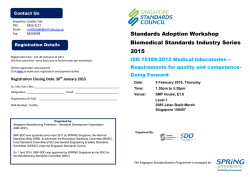
SECTOR RESEARCH | Singapore February 2, 2015 Singapore Banks OVERWEIGHT (Unchanged) Loan softness offset by rising rates Slowdown in loan growth compensated by higher SGD SIBOR. System liquidity may also improve as rates rise. Remain OVERWEIGHT. Catalysts from eventual rise in interest rates & earnings deliveries. DBS still our top pick. Analysts Ng Wee Siang (65) 6231 5838 [email protected] Ng Li Hiang (65) 6231 5840 [email protected] Challenging year for loan growth 2014 proved to be a challenging year for industry loan growth. Growth was weak across the board. Business and consumer loans grew at their slowest in more than four and seven years respectively. Industry domestic banking unit (DBU) loan growth slowed to 5.9% YoY in 2014 from 2013’s +17.0%. General commerce loan growth decelerated the most, to +2.9% from 2013’s +32.3%. This was the sub-sector’s weakest growth since Jan 2010, reflecting a challenging global environment. Unlike the other larger business subsectors, B&C loan growth held up better, at 13.6% in 2014 vs 16.0% in 2013. General commerce loans accounted for 12.8% of DBU loans as at end-December, B&C 17.1%. Consumer loan growth remained lethargic, weighed down by property-market weakness (+6.5% YoY) and fast-shrinking car loans (-19.2% YoY). LDR may start to improve More positively, DBU deposit growth continued to inch up, fractionally. We expect this to continue amid rising short-term interest rates. This suggests DBU LDR may dip slightly this year. We expect our banks’ loan growth to average 9% in 2015 vs an estimated 9.3% for 2014. Given the slowdown locally, there is a risk that our 12% business loan growth projection for 2015 may not be met. General commerce loans could come to the rescue if the global economy strengthens in 2H15. DBS is our top pick. It should be best positioned to take advantage of rising rates. Our second choice is UOB. Stay cautious on OCBC. Peer comparisons Stock Rec Price* TP Upside (SGD) (SGD) (%) FY14E PER (x) FY15E 11.0 10.4 P/BV (x) FY14E ROAE (%) Div. yield (%) FY15E FY14E FY15E FY14E 1.3 1.4 1.2 1.3 11.1 13.0 11.9 12.8 2.9 2.8 FY15E 3.0 2.8 BUY 19.79 23.50 18.7 UOB BUY 23.18 26.70 15.2 12.7 11.1 OCBC HOLD 10.40 10.70 2.9 12.1 10.8 1.3 1.2 12.5 11.9 3.3 3.3 12.0 10.7 1.3 1.2 12.2 12.2 3.0 3.0 DBS Sector average *Share prices as of 30 Jan 2015 Source: Maybank KE SEE PAGE 13 FOR IMPORTANT DISCLOSURES AND ANALYST CERTIFICATIONS Co. Reg No: 198700034E MICA (P) : 099/03/2012 Singapore Banks Data in pictures Industry DBU loans Industry DBU loan growth decelerated to its slowest since Mar 2010 (2014: +5.9%, 2013: +17.0%). Dragged down by business loans (2014: +6.4%, 2013: +22.9), which formed 61.1% of industry loans. Consumer loans (38.9% of industry loans) also grew only 5.1%, down from +9.0% a year ago. Fast losing steam (SGD b) 650 Total DBU loans (LHS) Growth (RHS) 600 (YoY %) 34 28 550 500 22 450 400 16 350 10 300 250 4 200 150 (2) Dec-07 Dec-08 Dec-09 Dec-10 Dec-11 Dec-12 Dec-13 Dec-14 Consumer loans Despite a slight uptick in December, consumer loan growth was near its slowest in more than seven years. This segment was weighed down by persistent contractions in car loans (-19.2% YoY) and share financing (-15.2% YoY). Total industry DBU loans comprise business and consumer loans. Source: Monetary Authority of Singapore Consolidating after a prolonged decline (SGD b) 260 Consumer loans (LHS) Growth (RHS) (YoY %) 22 240 20 220 18 Car loans have been shrinking for 25 months, after MAS re-introduced restrictions on vehicle financing in 2013. 200 Housing loans accounted for 75.0% of DBU consumer loans as at end-December, car loans 3.7% and share financing 0.4%. 140 16 14 180 12 160 10 8 120 6 100 4 2 80 Dec-07 Dec-08 Dec-09 Dec-10 Dec-11 Dec-12 Dec-13 Dec-14 Note: Consumer loans accounted for 38.9% of total industry DBU loans. Source: Monetary Authority of Singapore Housing loans Housing loan growth ticked up to 6.5%. It was 9.6% in 2013. This reflected a weak property market and higher base. We expect the weakness to persist as new property sales are expected to stay tepid this year. Loan drawdowns for newly completed homes should be the only source of growth. Bottoming out? Unlikely as property sales stay lethargic (SGD b) 180 Housing loans (LHS) Growth (RHS) (YoY %) 25 160 20 140 120 15 100 10 80 5 60 Dec-07 Dec-08 Dec-09 Dec-10 Dec-11 Dec-12 Dec-13 Dec-14 Note: Housing loans accounted for 29.2% of total industry DBU loans. Source: Monetary Authority of Singapore February 2, 2015 2 Singapore Banks Business loans Business loan growth decelerated to a 52-month low of 6.4% YoY (2013: +22.9%). The slowdown could be detected in lending to manufacturing (2014: -6.3%, 2013: +16.3%), general commerce (2014: +2.9%, 2013: +32.3%), and financial institutions (2014: +5.9%, 2013: +17.7%). Slowest growth in four years (SGD b) 400 Business loans (LHS) Growth (RHS) 360 (YoY %) 50 40 320 Our 12% business loan growth projection for 2015 appears a tad aggressive. 280 General commerce is the wild card, being highly dependent on Greater China. 200 30 20 240 10 160 0 120 80 (10) Dec-07 Dec-08 Dec-09 Dec-10 Dec-11 Dec-12 Dec-13 Dec-14 Note: Business loans accounted for 61.1 % of total industry DBU loans. Source: Monetary Authority of Singapore Building and construction loans Unlike the other larger business loan subsectors, B&C loan growth held up better, at 13.6% in 2014 vs 16.0% the year before. We expect 10% growth this year, supported by large property and infrastructure projects. Best-performing business loan subsector (SGD b) 110 Bldg & const. loans (LHS) Growth (RHS) (YoY %) 60 100 46 90 80 32 70 60 18 50 40 4 30 20 (10) Dec-07 Dec-08 Dec-09 Dec-10 Dec-11 Dec-12 Dec-13 Dec-14 Note: Building and construction loans formed 17.1% of total industry DBU loans. Source: Monetary Authority of Singapore General commerce loans Among the larger subsectors, general commerce loans eased the most in percentage terms in 2014. Growth slowed to 2.9% YoY from +32.3% in 2013. This was the weakest growth since Jan 2010, reflecting a challenging global environment. Singapore banks have gained market share in USD trade loans after the retreat of European banks from 2008/09. This category is dependent on the health of the global economy, particularly China’s. Dependent on global economy (SGD b) 90 80 General commerce loans (LHS) Growth (RHS) (YoY %) 90 70 70 60 50 40 50 30 10 30 20 (10) (30) 10 Dec-07 Dec-08 Dec-09 Dec-10 Dec-11 Dec-12 Dec-13 Dec-14 Note: General commerce loans accounted for 12.8% of total industry DBU loans. Source: Monetary Authority of Singapore February 2, 2015 3 Singapore Banks Industry deposits (DBU) On a more positive note, DBU deposit growth continued to inch up, albeit marginally. We expect continued growth with short-term interest rates inching higher. Inching up Total DBU deposits (LHS) Growth (RHS) (SGD b) 560 (YoY %) 28 520 24 480 20 440 400 16 360 12 320 8 280 4 240 0 200 160 Dec-04 Dec-06 Dec-08 Dec-10 (4) Dec-14 Dec-12 Source: Monetary Authority of Singapore Industry loan-to-deposit ratio (DBU) DBU LDR remained elevated at 110.5% in Dec 2014. The industry’s net deposit deficit (DBU loans greater than DBU deposits) stood at SGD57.6b. Contrast this with the SGD70b surplus before GFC. On the surface, this suggests very tight system liquidity. Tight system liquidity (SGD b) DBU excess deposits (LHS) LDR (RHS) (%) 115 108 110 88 105 68 100 48 95 28 90 8 85 (12) 80 (32) 75 (52) 70 (72) Dec-06 Dec-08 Dec-10 Dec-12 65 Dec-14 Source: Monetary Authority of Singapore Industry SGD LDR DBU LDR is no longer a good proxy for system SGD LDR. Increasingly, DBU loans are USD trade loans. Stripping these out, SGD LDR was still a comfortable 84.0% as at end-December (2013: 81.3%, 2012: 75.4%), based on our estimates. Based on Sep 2014 data, DBS had the most liquid SGD balance sheet. Its SGD LDR of 77.6% implied a SGD30.8b net deposit surplus. OCBC’s 80.2% suggested a SGD18.6b surplus. UOB’s 95.9% hinted at a SGD4.5b surplus. Remained comfortably low (%) 110 106.5 100 88.3 90 84.0 80 70 72.2 78.8 62.6 60 Dec-96 Dec-99 Dec-02 Dec-05 Dec-08 Dec-11 Dec-14 Source: Monetary Authority of Singapore, Maybank KE February 2, 2015 4 Singapore Banks Industry NIM vs 3M SGD SIBOR We expect 3M SGD SIBOR to rise to 1.0% by end2015 and 2.0% by end-2016, from 0.46% as at end2014 and 0.6% currently. Given 3M SGD SIBOR’s close correlation with industry NIM, albeit with a lag, a rise should lift NIM. Rising short-term rates to boost NIM (%) 2.4 (%) 4.0 Net interest margin (LHS) Avg SIBOR (RHS) 2.3 3.5 2.2 3.0 2.1 2.5 2.0 2.0 1.9 1.5 1.8 1.7 1.0 1.6 0.5 0.0 1.5 3Q04 3Q06 3Q08 3Q10 3Q12 3Q14 Source: DBS, UOB, OCBC, Bloomberg Sector NIM We expect industry NIM to strengthen in 2015, even though it could remain below its 16-year average over the next two years. Our projections could prove conservative as SGD SIBOR started to rise earlier than expected. Earnings upswings for banks can be powerful after several years of depressed NIMs, assuming asset quality remains good. Might have bottomed in 2014 (%) 2.3 2.2 2.10 2.08 2.1 2.0 2.19 2.20 2.19 1.97 1.98 1.96 2.01 1.9 2.06 Mean = 1.95% 1.85 1.78 1.91 1.8 1.83 1.73 1.66 1.7 1.69 1.6 1.5 2000 2002 2004 2006 2008 2010 2012 2014E 2016E Source: Maybank KE February 2, 2015 5 Singapore Banks Figure 1: Investment theses DBS UOB OCBC Target price (SGD) 23.50 Share price* (SGD) 19.79 26.70 23.18 10.70 10.40 Upside (%) 18.7 Rec BUY 15.2 Investment thesis Management’s medium-term strategy of acquiring outfits to plug product gaps should reduce inherent M&A risks. BUY 2.9 HOLD Decent presence in Greater China. In good stead to ride renewed Chinese economic growth. Key beneficiary of higher interest rates, expected in mid-2015, and internationalisation of CNY. Risk to TP: Unexpected departure of key personnel. Catalysts: Consistent earnings deliveries and sharp rise in interest rates. Disciplined and cost-conscious management. With its less-favourable SGD funding profile, it may not be as wellpositioned for rising interest rates as peers. But strong focus on liquidity management. Requires all regional operations to be fully funded in local currencies. Risk to TP: Weakening ability to expand SGD deposits or further jumps in its housing NPLs. Catalysts: Stronger growth in SGD deposits and better housing-loan quality. Integration risks after acquisition of Wing Hang Bank. More volatile earnings from outsized contributions from 87%-owned Great Eastern Holdings. Current management yet to prove itself. Risks to TP: 1) failure to extract operational synergies from Wing Hang Bank; and 2) capital markets stay depressed for longer. Catalysts: Strong pick-up in capital markets and sharp rise in interest rates. *Share prices as of 30 Jan 2015 Source: Maybank KE Figure 2: Sector rolling PER band Figure 3: Sector rolling P/BV band (x) 18.0 (x) 2.1 +1SD = 14.8x +1SD = 1.6x 15.0 Mean = 13.0x 1.6 Mean = 1.4x 12.0 -1SD = 11.2x 1.1 -1SD = 1.2x 9.0 6.0 Dec-05 Dec-08 Source: Bloomberg, Maybank KE February 2, 2015 Dec-11 Dec-14 0.6 Dec-05 Dec-08 Dec-11 Dec-14 Source: Bloomberg, Maybank KE 6 Singapore Banks Figure 4: DBS’s rolling PER band Figure 5: DBS’s rolling P/BV band (x) 18.0 (x) 2.0 1.7 +1SD = 14.6x 15.0 Mean = 12.7x +1SD = 1.5x Mean = 1.3x 1.4 12.0 1.1 -1SD = 10.7x 9.0 6.0 Dec-05 -1SD = 1.1x 0.8 Dec-08 Dec-11 Dec-14 0.5 Dec-05 Dec-08 Dec-11 Source: Bloomberg, Maybank KE Source: Bloomberg, Maybank KE Figure 6: UOB’s rolling PER band Figure 7: UOB’s rolling P/BV band 20.0 (x) 2.2 18.0 2.0 (x) +1SD = 14.6x 14.0 1.6 Mean = 12.7x 12.0 Mean = 1.4x 1.4 1.2 10.0 -1SD = 10.8x -1SD = 1.2x 1.0 8.0 6.0 Dec-05 +1SD = 1.7x 1.8 16.0 0.8 Dec-08 Dec-11 Dec-14 0.6 Dec-05 Dec-08 Dec-11 Source: Bloomberg, Maybank KE Source: Bloomberg, Maybank KE Figure 8: OCBC’s rolling PER band Figure 9: OCBC’s rolling P/BV band (x) 21.0 (x) 2.4 19.0 2.2 1.8 15.0 Mean = 13.9x 13.0 +1SD = 1.7x Mean = 1.5x 1.6 1.4 11.0 1.2 -1SD = 11.9x -1SD = 1.2x 1.0 9.0 0.8 Dec-08 Source: Bloomberg, Maybank KE February 2, 2015 Dec-14 2.0 +1SD = 15.8x 17.0 7.0 Dec-05 Dec-14 Dec-11 Dec-14 0.6 Dec-05 Dec-08 Dec-11 Dec-14 Source: Bloomberg, Maybank KE 7 Singapore Banks Figure 10: Key P&L and balance-sheet data (SGD m) Net interest income DBS UOB OCBC 2010 2011 2012 2013 2014E 2015E 2016E 4,318.0 3,531.9 2,946.9 4,825.0 3,678.0 3,410.4 5,285.0 3,917.0 3,747.7 5,569.0 4,119.8 3,882.8 6,227.5 4,623.3 4,792.9 7,117.2 5,271.1 5,542.4 8,383.2 5,998.7 6,440.1 Fee income DBS UOB OCBC 1,397.0 1,163.3 982.8 1,542.0 1,318.1 1,137.1 1,579.0 1,507.8 1,198.3 1,885.0 1,730.6 1,355.5 2,072.0 1,774.0 1,454.3 2,322.0 1,871.2 1,596.2 2,659.7 2,036.8 1,783.1 Core non-interest income DBS UOB OCBC 2,748.0 2,036.3 2,377.8 2,759.0 2,021.0 2,211.3 2,779.0 2,577.9 2,897.6 3,358.0 2,561.7 2,738.6 3,427.4 2,917.2 3,171.0 3,808.4 2,826.5 3,321.9 4,345.8 3,017.8 3,613.5 Core operating income DBS UOB OCBC 7,066.0 5,568.2 5,324.7 7,584.0 5,698.9 5,621.7 8,064.0 6,495.0 6,645.4 8,927.0 6,681.5 6,621.4 9,654.8 7,540.6 7,963.9 10,925.6 8,097.6 8,864.3 12,729.0 9,016.5 10,053.6 Overhead expenses DBS UOB OCBC 2,925.0 2,257.8 2,253.6 3,303.0 2,450.5 2,429.9 3,614.0 2,747.4 2,694.7 3,918.0 2,898.2 2,783.9 4,254.0 3,170.2 3,250.5 4,654.5 3,365.6 3,587.9 5,123.9 3,577.7 3,925.1 Core pre-provision profit DBS UOB OCBC 3,123.0 3,299.5 3,016.4 4,281.0 3,248.5 3,130.4 4,450.0 3,740.2 3,890.7 5,009.0 3,783.3 3,779.4 5,400.8 4,370.3 4,654.7 6,271.1 4,732.0 5,217.2 7,605.1 5,438.8 6,068.6 911.0 473.8 134.0 722.0 523.2 277.8 417.0 476.4 271.4 770.0 428.9 266.1 674.4 627.5 289.7 849.3 678.4 379.9 981.3 669.6 480.0 Core operating profit DBS UOB OCBC 2,212.0 2,825.6 2,882.3 3,559.0 2,725.3 2,852.6 4,033.0 3,263.8 3,619.3 4,239.0 3,354.4 3,513.4 4,726.4 3,742.8 4,365.0 5,421.9 4,053.6 4,837.3 6,623.8 4,769.2 5,588.6 Core PBT DBS UOB OCBC 2,314.0 2,964.7 2,880.2 3,686.0 2,818.4 2,859.8 4,157.0 3,351.2 3,645.9 4,318.0 3,465.4 3,567.3 4,777.8 3,887.0 4,428.7 5,475.8 4,206.5 4,906.1 6,682.0 4,935.8 5,662.8 Core net profit (net of preference share dividends) DBS 1,616.0 UOB 2,463.9 OCBC 2,163.3 2,972.0 2,337.5 2,133.7 3,343.0 2,803.1 2,734.7 3,485.0 2,889.1 2,677.4 3,851.4 3,288.5 3,378.6 4,473.0 3,508.6 3,800.1 5,556.8 4,128.9 4,406.3 Provisions DBS UOB OCBC Total net loans DBS UOB OCBC 151,698.0 112,439.9 104,989.2 194,275.0 141,191.3 133,556.9 210,519.0 152,929.8 142,376.5 248,654.0 178,856.9 167,854.1 266,059.8 194,954.0 204,782.0 287,344.6 214,449.4 223,212.4 316,079.0 238,038.8 247,765.7 Total assets DBS UOB OCBC 283,710.0 213,778.5 229,282.8 340,847.0 236,957.7 277,757.6 353,033.0 252,899.5 295,943.5 402,008.0 284,229.1 338,448.4 427,776.4 308,905.8 397,085.1 459,303.9 335,799.9 428,218.2 500,845.5 369,274.1 467,688.9 Source: DBS, UOB, OCBC, Maybank KE February 2, 2015 8 Singapore Banks Figure 11: Key ratios – profitability (%) Non-interest income/core operating income DBS UOB OCBC 2010 2011 2012 2013 2014E 2015E 2016E 38.9 36.6 44.7 36.4 35.5 39.3 34.5 39.7 43.6 37.6 38.3 41.4 35.5 38.7 39.8 34.9 34.9 37.5 34.1 33.5 35.9 Fee income/core operating income DBS UOB OCBC 19.8 20.9 18.5 20.3 23.1 20.2 19.6 23.2 18.0 21.1 25.9 20.5 21.5 23.5 18.3 21.3 23.1 18.0 20.9 22.6 17.7 Cost/income DBS UOB OCBC 41.4 40.5 42.3 43.6 43.0 43.2 44.8 42.3 40.6 43.9 43.4 42.0 44.1 42.0 40.8 42.6 41.6 40.5 40.3 39.7 39.0 Cost/average assets DBS UOB OCBC 1.1 1.1 1.1 1.1 1.1 1.0 1.0 1.1 0.9 1.0 1.1 0.9 1.0 1.1 0.9 1.0 1.0 0.9 1.1 1.0 0.9 SP/average net loans DBS UOB OCBC 0.4 0.2 0.1 0.1 0.1 0.1 0.1 0.3 0.1 0.2 0.1 0.1 0.2 0.2 0.1 0.2 0.2 0.1 0.2 0.2 0.1 GP/RWA DBS UOB OCBC 0.8 1.6 1.0 0.9 1.5 0.9 1.0 1.5 1.0 1.0 1.4 1.0 1.0 1.4 1.0 1.0 1.4 1.0 1.0 1.4 1.0 Loan-deposit ratio DBS UOB OCBC 78.3 79.0 85.1 86.2 83.3 86.4 83.1 84.0 86.2 85.0 88.5 85.7 85.0 85.4 85.7 85.0 85.4 85.7 85.0 85.0 85.7 Net loan growth DBS UOB OCBC 16.2 13.3 29.8 28.1 25.6 27.2 8.4 8.3 6.6 18.1 17.0 17.9 7.0 9.0 22.0 8.0 10.0 9.0 10.0 11.0 11.0 Customer deposit growth DBS UOB OCBC 5.6 17.1 22.5 16.3 19.1 25.3 12.5 7.4 6.8 15.3 11.0 18.7 7.0 13.0 22.0 8.0 10.0 9.0 10.0 11.5 11.0 Source: DBS, UOB, OCBC, Maybank KE February 2, 2015 9 Singapore Banks Figure 12: Key ratios – asset quality (%) Gross NPL DBS UOB OCBC 2010 2011 2012 2013 2014E 2015E 2016E 2.1 2.2 1.1 1.5 1.8 1.1 1.3 1.8 0.8 1.2 1.3 0.8 0.9 1.4 0.7 0.8 1.3 0.7 0.8 1.1 0.8 SP/NPLs DBS UOB OCBC 40.0 43.2 27.2 45.0 38.1 21.0 46.3 40.7 25.9 39.2 38.5 17.6 47.0 35.6 19.2 59.0 34.8 18.7 61.2 37.0 20.2 GP/NPLs DBS UOB OCBC 51.3 81.3 90.6 72.7 98.1 84.9 79.6 83.2 115.2 83.2 112.0 115.9 109.5 111.3 127.3 123.2 119.6 120.4 123.2 134.8 114.2 GP/net loans DBS UOB OCBC 0.96 1.53 1.03 0.98 1.38 0.90 0.98 1.27 0.94 0.96 1.28 0.89 0.99 1.34 0.89 0.99 1.38 0.89 0.99 1.38 0.89 99.5 118.9 118.8 126.0 124.3 106.6 141.8 122.2 141.8 135.1 147.3 134.2 150.9 130.5 144.0 175.4 137.9 137.1 178.1 156.0 132.7 Tier 1 DBS UOB OCBC 15.1 15.3 16.3 12.9 13.5 14.4 14.0 14.7 16.6 13.7 13.2 14.5 13.3 13.0 13.8 13.3 11.7 14.6 13.4 11.0 14.5 CAR DBS UOB OCBC 18.4 19.8 17.6 15.8 16.7 15.7 17.1 19.1 18.5 16.3 16.6 16.3 16.0 16.5 15.9 15.9 15.0 16.5 15.8 14.0 16.3 Average lending yields DBS UOB OCBC 2.43 2.95 2.93 2.40 2.94 2.91 2.45 2.97 2.82 2.32 2.71 2.60 2.38 2.67 2.69 2.57 2.85 2.92 3.15 3.36 3.42 Average cost of funds DBS UOB OCBC 0.64 0.89 1.04 0.69 1.05 1.12 0.81 1.13 1.13 0.75 1.03 1.03 0.77 1.01 1.08 0.93 1.21 1.29 1.42 1.69 1.74 Interest spread DBS UOB OCBC 1.79 2.06 1.89 1.71 1.89 1.79 1.64 1.84 1.69 1.57 1.68 1.57 1.61 1.66 1.61 1.64 1.64 1.63 1.73 1.67 1.69 NIM DBS UOB OCBC 1.84 2.09 1.98 1.77 1.92 1.86 1.70 1.87 1.77 1.62 1.72 1.64 1.67 1.70 1.69 1.73 1.73 1.72 1.87 1.79 1.82 Provision coverage DBS UOB OCBC Source: DBS, UOB, OCBC, Maybank KE February 2, 2015 10 Singapore Banks Figure 13: Key valuation summary 2010 2011 2012 2013 2014E 2015E 2016E Cash core EPS (SGD cts) DBS UOB OCBC 67.1 159.7 64.8 121.3 148.5 62.0 135.2 178.0 79.5 140.5 183.3 77.8 155.3 208.6 85.9 180.4 222.6 96.6 224.1 261.9 112.0 Cash core EPS growth (%) DBS UOB OCBC (21.8) 26.5 11.8 80.8 (7.0) (4.3) 11.5 19.9 28.2 3.9 3.0 (2.1) 10.5 13.8 10.4 16.1 6.7 12.5 24.2 17.7 16.0 PER (x) DBS UOB OCBC 29.5 14.5 16.0 16.3 15.6 16.8 14.6 13.0 13.1 14.1 12.6 13.4 12.7 11.1 12.1 11.0 10.4 10.8 8.8 8.9 9.3 P/BV (x) DBS UOB OCBC 1.7 1.9 1.8 1.6 1.8 1.7 1.5 1.6 1.6 1.5 1.5 1.5 1.3 1.4 1.3 1.2 1.3 1.2 1.1 1.2 1.1 P/NTA (x) DBS UOB OCBC 2.1 2.4 2.3 1.9 2.2 2.1 1.8 2.0 1.9 1.7 1.8 1.8 1.6 1.6 1.6 1.4 1.5 1.4 1.3 1.3 1.3 Cash core ROE (%) DBS UOB OCBC 10.1 13.7 12.3 10.7 11.6 11.1 11.0 12.8 12.8 10.7 12.3 11.7 11.1 13.0 12.5 11.9 12.8 11.9 13.5 13.7 12.6 Cash core ROA (%) DBS UOB OCBC 1.0 1.2 1.3 1.0 1.0 1.1 1.0 1.1 1.2 0.9 1.1 1.0 0.9 1.1 1.1 1.0 1.1 1.1 1.2 1.2 1.2 Net dividend yield (%) DBS UOB OCBC 2.8 3.0 2.9 2.8 2.6 2.9 2.8 2.6 3.2 2.9 2.6 3.3 2.9 2.8 3.3 3.0 2.8 3.3 3.2 3.2 3.3 11.48 12.53 5.66 12.21 13.23 6.01 12.98 14.56 6.66 13.63 15.36 6.89 14.72 16.71 7.96 15.95 18.20 8.59 17.58 19.99 9.37 NTA/share (SGD) DBS UOB OCBC 9.41 9.69 4.46 10.17 10.45 4.86 10.99 11.80 5.55 11.64 12.62 5.81 12.76 14.08 6.66 13.99 15.57 7.29 15.62 17.36 8.07 Net DPS (SGD cts) DBS UOB OCBC 56.0 70.0 30.0 56.0 60.0 30.0 56.0 60.0 33.0 58.0 60.0 34.0 58.0 65.0 34.0 60.0 65.0 34.0 64.0 75.0 34.0 Dividend payout ratio (% of cash core earnings - net of preference share dividends) DBS 48.7 43.9 40.9 UOB 43.6 40.4 33.6 OCBC 45.9 48.0 41.4 40.8 32.7 51.9 36.9 31.2 30.8 32.9 29.2 35.2 28.2 28.6 30.4 BVPS (SGD) DBS UOB OCBC Share prices as of 30 Jan 2015 Source: DBS, UOB, OCBC, Maybank KE February 2, 2015 11 Singapore Banks Research Offices REGIONAL HONG KONG / CHINA INDONESIA WONG Chew Hann, CA Regional Head of Institutional Research (603) 2297 8686 [email protected] Howard WONG Head of Research (852) 2268 0648 [email protected] • Oil & Gas - Regional Wilianto IE Head of Research (62) 21 2557 1125 [email protected] • Strategy ONG Seng Yeow Regional Head of Retail Research (65) 6432 1453 [email protected] Alexander LATZER (852) 2268 0647 [email protected] • Metals & Mining – Regional Rahmi MARINA (62) 21 2557 1128 [email protected] • Banking & Finance Jacqueline KO, CFA (852) 2268 0633 [email protected] • Consumer Staples & Durables Aurellia SETIABUDI (62) 21 2953 0785 [email protected] • Property Alexander GARTHOFF Institutional Product Manager (852) 2268 0638 [email protected] ECONOMICS Suhaimi ILIAS Chief Economist Singapore | Malaysia (603) 2297 8682 [email protected] Luz LORENZO Philippines (63) 2 849 8836 [email protected] Tim LEELAHAPHAN Thailand (66) 2658 6300 ext 1420 [email protected] JUNIMAN Chief Economist, BII Indonesia (62) 21 29228888 ext 29682 [email protected] STRATEGY Sadiq Currimbhoy Global Strategist (65) 6231 5836 [email protected] Willie Chan Hong Kong / Regional (852) 2268 0631 [email protected] MALAYSIA WONG Chew Hann, CA Head of Research (603) 2297 8686 [email protected] • Strategy • Construction & Infrastructure Desmond CH’NG, ACA (603) 2297 8680 [email protected] • Banking & Finance LIAW Thong Jung (603) 2297 8688 [email protected] • Oil & Gas - Regional • Shipping ONG Chee Ting, CA (603) 2297 8678 [email protected] • Plantations - Regional Mohshin AZIZ (603) 2297 8692 [email protected] • Aviation - Regional • Petrochem YIN Shao Yang, CPA (603) 2297 8916 [email protected] • Gaming – Regional • Media TAN Chi Wei, CFA (603) 2297 8690 [email protected] • Power • Telcos WONG Wei Sum, CFA (603) 2297 8679 [email protected] • Property & REITs LEE Yen Ling (603) 2297 8691 [email protected] • Building Materials • Glove Producers CHAI Li Shin, CFA (603) 2297 8684 [email protected] • Plantation • Construction & Infrastructure Ivan YAP (603) 2297 8612 [email protected] • Automotive Ka Leong LO, CFA (852) 2268 0630 [email protected] • Consumer Discretionary & Auto Benjamin HO (852) 2268 0632 [email protected] • Consumer & Auto Karen KWAN (852) 2268 0640 [email protected] • Property & REITs Osbert TANG, CFA (86) 21 5096 8370 [email protected] • Transport & Industrials Ricky WK NG, CFA (852) 2268 0689 [email protected] • Utilities & Renewable Energy Steven ST CHAN (852) 2268 0645 [email protected] • Banking & Financials - Regional Warren LAU (852) 2268 0644 [email protected] • Technology – Regional INDIA Jigar SHAH Head of Research (91) 22 6632 2632 [email protected] • Oil & Gas • Automobile • Cement Anubhav GUPTA (91) 22 6623 2605 [email protected] • Metal & Mining • Capital Goods • Property Urmil SHAH (91) 22 6623 2606 [email protected] • Technology • Media Vishal MODI (91) 22 6623 2607 [email protected] • Banking & Financials Abhijeet Kundu (91) 22 6623 2628 [email protected] • Consumer SINGAPORE NG Wee Siang Head of Research (65) 6231 5838 [email protected] • Banking & Finance Gregory YAP (65) 6231 5848 [email protected] • SMID Caps – Regional • Technology & Manufacturing • Telcos Isnaputra ISKANDAR (62) 21 2557 1129 [email protected] • Metals & Mining • Cement Pandu ANUGRAH (62) 21 2557 1137 [email protected] • Infra • Construction • Transport• Telcos Janni ASMAN (62) 21 2953 0784 [email protected] • Cigarette • Healthcare • Retail Adhi Tasmin (62) 21 2557 1209 [email protected] • Plantations PHILIPPINES Luz LORENZO Head of Research (63) 2 849 8836 [email protected] • Strategy • Utilities • Conglomerates • Telcos Lovell SARREAL (63) 2 849 8841 [email protected] • Consumer • Media • Cement Rommel RODRIGO (63) 2 849 8839 [email protected] • Conglomerates • Property • Gaming • Ports/ Logistics Katherine TAN (63) 2 849 8843 [email protected] • Banks • Construction Ramon ADVIENTO (63) 2 849 8845 [email protected] • Mining Michael Bengson (63) 2 849 8840 [email protected] • Conglomerates Jaclyn Jimenez (63) 2 849 8842 [email protected] • Consumer Arabelle Maghirang (63) 2 849 8838 [email protected] • Banks THAILAND YEAK Chee Keong, CFA (65) 6231 5842 [email protected] • Offshore & Marine Maria LAPIZ Head of Institutional Research Dir (66) 2257 0250 | (66) 2658 6300 ext 1399 [email protected] • Consumer • Materials • Ind.Estates Derrick HENG (65) 6231 5843 [email protected] • Transport (Land, Shipping & Aviation) Jesada TECHAHUSDIN, CFA (66) 2658 6300 ext 1394 [email protected] • Financial Services WEI Bin (65) 6231 5844 [email protected] • Commodity • Logistics • S-chips John CHEONG (65) 6231 5845 [email protected] • Small & Mid Caps • Healthcare TRUONG Thanh Hang (65) 6231 5847 [email protected] • Small & Mid Caps Suttatip PEERASUB (66) 2658 6300 ext 1430 [email protected] • Media • Commerce Sutthichai KUMWORACHAI (66) 2658 6300 ext 1400 [email protected] • Energy • Petrochem Termporn TANTIVIVAT (66) 2658 6300 ext 1520 [email protected] • Property Jaroonpan WATTANAWONG (66) 2658 6300 ext 1404 [email protected] • Transportation • Small cap Chatchai JINDARAT (66) 2658 6300 ext 1401 [email protected] • Electronics VIETNAM LE Hong Lien, ACCA Head of Institutional Research (84) 8 44 555 888 x 8181 [email protected] • Strategy • Consumer • Diversified • Utilities THAI Quang Trung, CFA, Deputy Manager, Institutional Research (84) 8 44 555 888 x 8180 [email protected] • Real Estate • Construction • Materials Le Nguyen Nhat Chuyen (84) 8 44 555 888 x 8082 [email protected] • Oil & Gas NGUYEN Thi Ngan Tuyen, Head of Retail Research (84) 8 44 555 888 x 8081 [email protected] • Food & Beverage • Oil&Gas • Banking TRINH Thi Ngoc Diep (84) 4 44 555 888 x 8208 [email protected] • Technology • Utilities • Construction TRUONG Quang Binh (84) 4 44 555 888 x 8087 [email protected] • Rubber plantation • Tyres and Tubes • Oil&Gas PHAM Nhat Bich (84) 8 44 555 888 x 8083 [email protected] • Consumer • Manufacturing • Fishery NGUYEN Thi Sony Tra Mi (84) 8 44 555 888 x 8084 [email protected] • Port operation • Pharmaceutical • Food & Beverage Sittichai DUANGRATTANACHAYA (66) 2658 6300 ext 1393 [email protected] • Services Sector • Transport Sukit UDOMSIRIKUL Head of Retail Research (66) 2658 6300 ext 5090 [email protected] LEE Cheng Hooi Regional Chartist (603) 2297 8694 [email protected] Mayuree CHOWVIKRAN (66) 2658 6300 ext 1440 [email protected] • Strategy February 2, 2015 Surachai PRAMUALCHAROENKIT (66) 2658 6300 ext 1470 [email protected] • Auto • Conmat • Contractor • Steel Kittisorn PRUITIPAT, CFA, FRM (66) 2658 6300 ext 1395 [email protected] • Real Estate • Telcos Kevin WONG (603) 2082 6824 [email protected] • REITs Tee Sze Chiah Head of Retail Research (603) 2297 6858 [email protected] Padon VANNARAT (66) 2658 6300 ext 1450 [email protected] • Strategy 12 Singapore Banks APPENDIX I: TERMS FOR PROVISION OF REPORT, DISCLAIMERS AND DISCLOSURES DISCLAIMERS This research report is prepared for general circulation and for information purposes only and under no circumstances should it be considered or intended as an offer to sell or a solicitation of an offer to buy the securities referred to herein. Investors should note that values of such securities, if any, may fluctuate and that each security’s price or value may rise or fall. Opinions or recommendations contained herein are in form of technical ratings and fundamental ratings. Technical ratings may differ from fundamental ratings as technical valuations apply different methodologies and are purely based on price and volume-related information extracted from the relevant jurisdiction’s stock exchange in the equity analysis. Accordingly, investors’ returns may be less than the original sum invested. Past performance is not necessarily a guide to future performance. This report is not intended to provide personal investment advice and does not take into account the specific investment objectives, the financial situation and the particular needs of persons who may receive or read this report. Investors should therefore seek financial, legal and other advice regarding the appropriateness of investing in any securities or the investment strategies discussed or recommended in this report. The information contained herein has been obtained from sources believed to be reliable but such sources have not been independently verified by Maybank Investment Bank Berhad, its subsidiary and affiliates (collectively, “MKE”) and consequently no representation is made as to the accuracy or completeness of this report by MKE and it should not be relied upon as such. Accordingly, MKE and its officers, directors, associates, connected parties and/or employees (collectively, “Representatives”) shall not be liable for any direct, indirect or consequential losses or damages that may arise from the use or reliance of this report. Any information, opinions or recommendations contained herein are subject to change at any time, without prior notice. This report may contain forward looking statements which are often but not always identified by the use of words such as “anticipate”, “believe”, “estimate”, “intend”, “plan”, “expect”, “forecast”, “predict” and “project” and statements that an event or result “may”, “will”, “can”, “should”, “could” or “might” occur or be achieved and other similar expressions. Such forward looking statements are based on assumptions made and information currently available to us and are subject to certain risks and uncertainties that could cause the actual results to differ materially from those expressed in any forward looking statements. Readers are cautioned not to place undue relevance on these forward-looking statements. MKE expressly disclaims any obligation to update or revise any such forward looking statements to reflect new information, events or circumstances after the date of this publication or to reflect the occurrence of unanticipated events. MKE and its officers, directors and employees, including persons involved in the preparation or issuance of this report, may, to the extent permitted by law, from time to time participate or invest in financing transactions with the issuer(s) of the securities mentioned in this report, perform services for or solicit business from such issuers, and/or have a position or holding, or other material interest, or effect transactions, in such securities or options thereon, or other investments related thereto. In addition, it may make markets in the securities mentioned in the material presented in this report. MKE may, to the extent permitted by law, act upon or use the information presented herein, or the research or analysis on which they are based, before the material is published. One or more directors, officers and/or employees of MKE may be a director of the issuers of the securities mentioned in this report. This report is prepared for the use of MKE’s clients and may not be reproduced, altered in any way, transmitted to, copied or distributed to any other party in whole or in part in any form or manner without the prior express written consent of MKE and MKE and its Representatives accepts no liability whatsoever for the actions of third parties in this respect. This report is not directed to or intended for distribution to or use by any person or entity who is a citizen or resident of or located in any locality, state, country or other jurisdiction where such distribution, publication, availability or use would be contrary to law or regulation. This report is for distribution only under such circumstances as may be permitted by applicable law. The securities described herein may not be eligible for sale in all jurisdictions or to certain categories of investors. Without prejudice to the foregoing, the reader is to note that additional disclaimers, warnings or qualifications may apply based on geographical location of the person or entity receiving this report. Malaysia Opinions or recommendations contained herein are in the form of technical ratings and fundamental ratings. Technical ratings may differ from fundamental ratings as technical valuations apply different methodologies and are purely based on price and volume-related information extracted from Bursa Malaysia Securities Berhad in the equity analysis. Singapore This report has been produced as of the date hereof and the information herein may be subject to change. Maybank Kim Eng Research Pte. Ltd. (“Maybank KERPL”) in Singapore has no obligation to update such information for any recipient. For distribution in Singapore, recipients of this report are to contact Maybank KERPL in Singapore in respect of any matters arising from, or in connection with, this report. If the recipient of this report is not an accredited investor, expert investor or institutional investor (as defined under Section 4A of the Singapore Securities and Futures Act), Maybank KERPL shall be legally liable for the contents of this report, with such liability being limited to the extent (if any) as permitted by law. Thailand The disclosure of the survey result of the Thai Institute of Directors Association (“IOD”) regarding corporate governance is made pursuant to the policy of the Office of the Securities and Exchange Commission. The survey of the IOD is based on the information of a company listed on the Stock Exchange of Thailand and the market for Alternative Investment disclosed to the public and able to be accessed by a general public investor. The result, therefore, is from the perspective of a third party. It is not an evaluation of operation and is not based on inside information. The survey result is as of the date appearing in the Corporate Governance Report of Thai Listed Companies. As a result, the survey may be changed after that date. Maybank Kim Eng Securities (Thailand) Public Company Limited (“MBKET”) does not confirm nor certify the accuracy of such survey result. Except as specifically permitted, no part of this presentation may be reproduced or distributed in any manner without the prior written permission of MBKET. MBKET accepts no liability whatsoever for the actions of third parties in this respect. US This research report prepared by MKE is distributed in the United States (“US”) to Major US Institutional Investors (as defined in Rule 15a-6 under the Securities Exchange Act of 1934, as amended) only by Maybank Kim Eng Securities USA Inc (“Maybank KESUSA”), a broker-dealer registered in the US (registered under Section 15 of the Securities Exchange Act of 1934, as amended). All responsibility for the distribution of this report by Maybank KESUSA in the US shall be borne by Maybank KESUSA. All resulting transactions by a US person or entity should be effected through a registered broker-dealer in the US. This report is not directed at you if MKE is prohibited or restricted by any legislation or regulation in any jurisdiction from making it available to you. You should satisfy yourself before reading it that Maybank KESUSA is permitted to provide research material concerning investments to you under relevant legislation and regulations. UK This document is being distributed by Maybank Kim Eng Securities (London) Ltd (“Maybank KESL”) which is authorized and regulated, by the Financial Services Authority and is for Informational Purposes only. This document is not intended for distribution to anyone defined as a Retail Client under the Financial Services and Markets Act 2000 within the UK. Any inclusion of a third party link is for the recipients convenience only, and that the firm does not take any responsibility for its comments or accuracy, and that access to such links is at the individuals own risk. Nothing in this report should be considered as constituting legal, accounting or tax advice, and that for accurate guidance recipients should consult with their own independent tax advisers. February 2, 2015 13 Singapore Banks DISCLOSURES Legal Entities Disclosures Malaysia: This report is issued and distributed in Malaysia by Maybank Investment Bank Berhad (15938-H) which is a Participating Organization of Bursa Malaysia Berhad and a holder of Capital Markets and Services License issued by the Securities Commission in Malaysia. Singapore: This material is issued and distributed in Singapore by Maybank KERPL (Co. Reg No 197201256N) which is regulated by the Monetary Authority of Singapore. Indonesia: PT Kim Eng Securities (“PTKES”) (Reg. No. KEP-251/PM/1992) is a member of the Indonesia Stock Exchange and is regulated by the BAPEPAM LK. Thailand: MBKET (Reg. No.0107545000314) is a member of the Stock Exchange of Thailand and is regulated by the Ministry of Finance and the Securities and Exchange Commission. Philippines: Maybank ATRKES (Reg. No.01-2004-00019) is a member of the Philippines Stock Exchange and is regulated by the Securities and Exchange Commission. Vietnam: Maybank Kim Eng Securities Limited (License Number: 117/GP-UBCK) is licensed under the State Securities Commission of Vietnam.Hong Kong: KESHK (Central Entity No AAD284) is regulated by the Securities and Futures Commission. India: Kim Eng Securities India Private Limited (“KESI”) is a participant of the National Stock Exchange of India Limited (Reg No: INF/INB 231452435) and the Bombay Stock Exchange (Reg. No. INF/INB 011452431) and is regulated by Securities and Exchange Board of India. KESI is also registered with SEBI as Category 1 Merchant Banker (Reg. No. INM 000011708) US: Maybank KESUSA is a member of/ and is authorized and regulated by the FINRA – Broker ID 27861. UK: Maybank KESL (Reg No 2377538) is authorized and regulated by the Financial Services Authority. Disclosure of Interest Malaysia: MKE and its Representatives may from time to time have positions or be materially interested in the securities referred to herein and may further act as market maker or may have assumed an underwriting commitment or deal with such securities and may also perform or seek to perform investment banking services, advisory and other services for or relating to those companies. Singapore: As of 2 February 2015, Maybank KERPL and the covering analyst do not have any interest in any companies recommended in this research report. Thailand: MBKET may have a business relationship with or may possibly be an issuer of derivative warrants on the securities /companies mentioned in the research report. Therefore, Investors should exercise their own judgment before making any investment decisions. MBKET, its associates, directors, connected parties and/or employees may from time to time have interests and/or underwriting commitments in the securities mentioned in this report. Hong Kong: KESHK may have financial interests in relation to an issuer or a new listing applicant referred to as defined by the requirements under Paragraph 16.5(a) of the Hong Kong Code of Conduct for Persons Licensed by or Registered with the Securities and Futures Commission. As of 2 February 2015, KESHK and the authoring analyst do not have any interest in any companies recommended in this research report. MKE may have, within the last three years, served as manager or co-manager of a public offering of securities for, or currently may make a primary market in issues of, any or all of the entities mentioned in this report or may be providing, or have provided within the previous 12 months, significant advice or investment services in relation to the investment concerned or a related investment and may receive compensation for the services provided from the companies covered in this report. OTHERS Analyst Certification of Independence The views expressed in this research report accurately reflect the analyst’s personal views about any and all of the subject securities or issuers; and no part of the research analyst’s compensation was, is or will be, directly or indirectly, related to the specific recommendations or views expressed in the report. Reminder Structured securities are complex instruments, typically involve a high degree of risk and are intended for sale only to sophisticated investors who are capable of understanding and assuming the risks involved. The market value of any structured security may be affected by changes in economic, financial and political factors (including, but not limited to, spot and forward interest and exchange rates), time to maturity, market conditions and volatility and the credit quality of any issuer or reference issuer. Any investor interested in purchasing a structured product should conduct its own analysis of the product and consult with its own professional advisers as to the risks involved in making such a purchase. No part of this material may be copied, photocopied or duplicated in any form by any means or redistributed without the prior consent of MKE. Ong Seng Yeow | Executive Director, Maybank Kim Eng Research Definition of Ratings Maybank Kim Eng Research uses the following rating system BUY Return is expected to be above 10% in the next 12 months (excluding dividends) HOLD Return is expected to be between - 10% to +10% in the next 12 months (excluding dividends) SELL Return is expected to be below -10% in the next 12 months (excluding dividends) Applicability of Ratings The respective analyst maintains a coverage universe of stocks, the list of which may be adjusted according to needs. Investment ratings are only applicable to the stocks which form part of the coverage universe. Reports on companies which are not part of the coverage do not carry investment ratings as we do not actively follow developments in these companies. February 2, 2015 14 Singapore Banks Malaysia Maybank Investment Bank Berhad (A Participating Organisation of Bursa Malaysia Securities Berhad) 33rd Floor, Menara Maybank, 100 Jalan Tun Perak, 50050 Kuala Lumpur Tel: (603) 2059 1888; Fax: (603) 2078 4194 Stockbroking Business: Level 8, Tower C, Dataran Maybank, No.1, Jalan Maarof 59000 Kuala Lumpur Tel: (603) 2297 8888 Fax: (603) 2282 5136 Philippines Maybank ATR Kim Eng Securities Inc. 17/F, Tower One & Exchange Plaza Ayala Triangle, Ayala Avenue Makati City, Philippines 1200 Tel: (63) 2 849 8888 Fax: (63) 2 848 5738 Singapore Maybank Kim Eng Securities Pte Ltd Maybank Kim Eng Research Pte Ltd 50 North Canal Road Singapore 059304 Tel: (44) 20 7332 0221 Fax: (44) 20 7332 0302 Hong Kong Tel: (62) 21 2557 1188 Fax: (62) 21 2557 1189 Tel: (91) 22 6623 2600 Fax: (91) 22 6623 2604 Thailand Maybank Kim Eng Securities (Thailand) Public Company Limited 999/9 The Offices at Central World, 20th - 21st Floor, Rama 1 Road Pathumwan, Bangkok 10330, Thailand London New York India Vietnam Philippines Tel: (84) 44 555 888 x8079 February 2, 2015 Vietnam Maybank Kim Eng Securities Limited 4A-15+16 Floor Vincom Center Dong Khoi, 72 Le Thanh Ton St. District 1 Ho Chi Minh City, Vietnam Tel : (84) 844 555 888 Fax : (84) 8 38 271 030 Saudi Arabia In association with Anfaal Capital Villa 47, Tujjar Jeddah Prince Mohammed bin Abdulaziz Street P.O. Box 126575 Jeddah 21352 Tel: (966) 2 6068686 Fax: (966) 26068787 North Asia Sales Trading Indonesia [email protected] India Tel: (852) 2268 0800 Fax: (852) 2877 0104 Thailand Tien Nguyen Tel: (212) 688 8886 Fax: (212) 688 3500 Kim Eng Securities India Pvt Ltd 2nd Floor, The International 16, Maharishi Karve Road, Churchgate Station, Mumbai City - 400 020, India Malaysia Andrew Dacey [email protected] Tel: (212) 688 2956 Maybank Kim Eng Securities USA Inc 777 Third Avenue, 21st Floor New York, NY 10017, U.S.A. PT Maybank Kim Eng Securities Plaza Bapindo Citibank Tower 17th Floor Jl Jend. Sudirman Kav. 54-55 Jakarta 12190, Indonesia Alex Tsun [email protected] Tel: (852) 2268 0228 US Toll Free: 1 877 837 7635 Harianto Liong [email protected] Tel: (62) 21 2557 1177 Indonesia New York Kim Eng Securities (HK) Ltd Level 30, Three Pacific Place, 1 Queen’s Road East, Hong Kong Kevin Foy Regional Head Sales Trading [email protected] Tel: (65) 6336-5157 US Toll Free: 1-866-406-7447 Rommel Jacob [email protected] Tel: (603) 2717 5152 Maybank Kim Eng Securities (London) Ltd 5th Floor, Aldermary House 10-15 Queen Street London EC4N 1TX, UK Tel: (65) 6336 9090 Tel: (66) 2 658 6817 (sales) Tel: (66) 2 658 6801 (research) South Asia Sales Trading London Tanasak Krishnasreni [email protected] Tel: (66)2 658 6820 Simon Lovekin [email protected] Tel: (44)-207-626-2828 Manish Modi [email protected] Tel: (91)-22-6623-2601 Keith Roy [email protected] Tel: (63) 2 848-5288 www.maybank-ke.com | www.maybank-keresearch.com 15

© Copyright 2026