Corporate Presentation
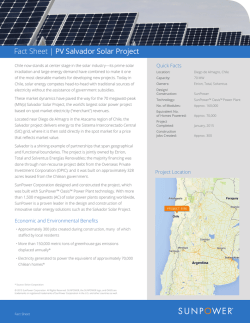
Corporate Presentation January 2015 1 DISCLAIMER These materials and the information contained herein are being presented by Etrion Corporation (the “Company”). By attending a meeting where these materials are presented, or by reading them, you agree to be bound by the following limitations and notifications. These materials are strictly confidential and may not be copied, published, distributed or transmitted. Failure to comply with this restriction may constitute a violation of applicable securities laws. These materials do not constitute or form part of any offer or invitation to sell or issue, or any solicitation of any offer to purchase or subscribe for, any securities, nor shall part, or all, of these materials or their distribution form the basis of, or be relied on in connection with, any contract or investment decision in relation to any securities. These materials do not constitute any form of commitment or recommendation on the part of the Company. These materials do not purport to be all-inclusive or to contain all the information that prospective investors may desire in analyzing and deciding whether or not to hold or transact in the Company’s shares. These materials are not a prospectus or an offer document and has not been prepared, approved or registered in accordance with the Swedish Financial Instruments Trading Act (Sw. lag (1991:980) om handel med finansiella instrument) or any other Swedish or foreign law. Accordingly, these materials have not been subject to review or approval by the Swedish Financial Supervisory Authority or any other Swedish or foreign authority. Recipients of these materials must rely on their own examination of the legal, taxation, financial and other consequences of any possible holding or transaction involving the Company’s shares, including the merits and risks involved. Recipients should not treat the contents of these materials as advice relating to legal, taxation or other matters and are advised to consult their own professional advisors concerning the acquisition, holding or disposal of shares in the Company. The information provided in these materials has either been obtained from the Company or constitutes publicly available material. Although the Company has endeavored to contribute towards giving a correct and complete picture of the Company, neither the Company, the Managers or any of their respective members, advisors, officers or employees nor any other person can be held liable for loss or damage of any kind, whether direct or indirect, arising from use of these materials or their contents or otherwise arising in connection therewith. More specifically, no information in these materials have been independently verified by the Managers or its advisors and the Company, the Managers or any of their respective members, advisors, officers or employees or any other person assume no responsibility whatsoever and makes no representation or warranty, expressed or implied, for the contents of these materials, including its accuracy, completeness or verification for any other statement made or purported to be made by any of them, or on their behalf. These materials as well as any other information provided by or on behalf of the Company shall be governed by Swedish law. Any dispute, controversy or claim arising out of or in connection with such information or related matters shall be finally settled by arbitration in accordance with the Arbitration Rules of the Arbitration Institute of the Stockholm Chamber of Commerce. The place of arbitration shall be Stockholm. FORWARD-LOOKING STATEMENTS This presentation contains certain “forward-looking information”. All statements, other than statements of historical fact, that address activities, events or developments that the Company believes, expects or anticipates will or may occur in the future (including, without limitation, statements relating to: solar electricity revenue which is subject to confirmation of both the applicable Feed-in-Tariff (FiT) to which the Company is entitled by the state-owned company Gestore Servizi Energetici and the applicable spot market price by the local utilities for electricity sales to the national grid and statements relating to the Company’s growth plans; the timing and scope of new solar projects anticipated to be developed by the Company; the Company's intention to pay future dividends; renewable energy production targets of governments in Italy, Chile and Japan and the intention of the Japanese government to take policy actions to encourage renewable energy production; and the revenue, EBITDA and free cash flow anticipated to be provided by the Company's solar projects) constitute forwardlooking information. This forward-looking information reflects the current expectations or beliefs of the Company based on information currently available to the Company as well as certain assumptions including, without limitation, assumptions with respect to: confirmation of the applicable FiT and spot market price for electricity sales; the ability of the Company to acquire and develop additional renewable energy projects; project and financing costs; and anticipated production from the Company's current and future solar projects. Forward-looking information is subject to a number of significant risks and uncertainties and other factors that may cause the actual results of the Company to differ materially from those discussed in the forward-looking information, and even if such actual results are realized or substantially realized, there can be no assurance that they will have the expected consequences to, or effects on the Company. Factors that could cause actual results or events to differ materially from current expectations include, but are not limited to: the lack of confirmation or reduction of the applicable FiT and the spot market price for electricity sales by the designated entities; the risk that governments may alter their stated goals for the growth of renewable energy production and/or fail to implement anticipated incentives for such production; the risk that the Company may not be able to identify and/or acquire additional renewable energy projects on economic terms; uncertainties with respect to the receipt or timing of all applicable permits for the development of additional renewable energy projects; the possibility of project cost overruns; the risk that the Company may not be able to obtain project financing on anticipated terms; the risk of reductions in FiT and spot market prices for electricity; and the possibility that the Company's projects will not produce power at the anticipated levels. Any forward-looking information speaks only as of the date on which it is made and, except as may be required by applicable securities laws, the Company disclaims any intent or obligation to update any forward-looking information, whether as a result of new information, future events or results or otherwise. Although the Company believes that the assumptions inherent in the forward-looking information are reasonable, forwardlooking information is not a guarantee of future performance and accordingly undue reliance should not be put on such information due to the inherent uncertainty therein. Where information in this presentation has been sourced from a third party, the Company confirms that the information has been accurately reproduced and so far as the Company is able to ascertain from information published by that third party, and so far as the Company is aware, no facts have been omitted which would render the reproduced information inaccurate or misleading. These materials and the information contained herein are not an offer of securities for sale in the United States or elsewhere and are not for publication or distribution to persons in the United States (within the meaning of Regulation S under the U.S. Securities Act of 1933, as amended (the Securities Act)). The securities in the Company have not been and will not be registered under the Securities Act and may not be offered or sold in the United States except pursuant to an exemption from the registration requirements of the Securities Act. 2 CORPORATE OVERVIEW 3 THE LUNDIN GROUP Etrion is part of the Lundin Group of Companies, 10 publicly-traded companies in the mining and energy sectors The companies range from exploration stage to advanced development and production, operating in over 30 countries worldwide with a combined market capitalization of over US$11 billion 4 ETRION CORPORATION Company Overview Independent power producer (IPP) that develops, builds, owns and operates ground-based solar photovoltaic (PV) power generation plants in three key markets (Italy, Chile and Japan) Listed on the Toronto Stock Exchange in Canada and the NASDAQ OMX Stockholm exchange in Sweden Installed Capacity / Under Construction - 130 megawatts (MW) operational in Italy and Chile with 34 MW under construction in Japan Development Pipeline - 99 MW in Chile expected to be fullypermitted by Q1-2015 with a target of 66 MW shovel-ready in Japan by 2015 and an additional 200 MW in Japan by 2017 Financial Summary Recent Share Price (TSX/OMX: ETX) Shares Outstanding Lundin Family Ownership Other Director/Management Ownership 5 334.1 million 24.3% 6.7% Revenues 2013A US$53.9 million EBITDA 2013A US$40.3 million Net Debt US$411.5 million Market Capitalization US$119.5 million Enterprise Value US$531.0 million Number of Employees Atacama, Chile – 70 MW Salvador CAD$0.45 / SEK 2.96 Notes: (1) (2) (3) (4) 36 US$ refers to US dollars; CAD$ refers to Canadian dollars; SEK refers to Swedish krona; € refers to euros. ETX share price at closing on January 29, 2015. ETX shares outstanding as of December 31, 2014. Net debt as of December 31, 2014 (unaudited on a cash basis) includes US$97.7 million of cash, US$412.1 million of non-recourse project loans and approximately US$97.1 million of corporate bonds. ETRION AT A GLANCE OPERATIONAL EXCELLENCE PROVEN TECHNOLOGY / TRACK RECORD DIVERSIFIED GROWTH PLATFORM 6 Utility-scale solar projects built using top-tier panel providers and EPC contractors (i.e., SunPower, ABB, Hitachi) Highly experienced management team with long-standing track record in greenfield development, project finance, construction and asset management Revenue regime - FiT revenues complimented by long-term PPAs or spot/merchant pricing Geography - Europe, Asia and South America (markets with high electricity prices, large energy demand and abundant renewable resources or strong mandates to diversify energy mix) Strong track record of forging key strategic partnerships to develop utility-scale solar projects in high-growth geographies: Total S.A. in Chile and Hitachi High-Tech in Japan Flagship renewable energy company in the Lundin Group Potential “YieldCo” structure due to stable cash flows from operating assets, diversified platform and visible future growth Easy separation of operating assets (YieldCo) from development capabilities (DevCo) STRATEGIC PARTNERSHIPS YIELD PLATFORM 60 MW of installed capacity in Italy fully operational since 2011 17 solar power plants in Italy consistently perform above plan with 99.7% availability in 2014 Centralised monitoring system and effective asset management structure improves efficiency and increases production A PROVEN PLAYER IN THE DOWNSTREAM SOLAR MARKET UTILITY-SCALE SOLAR POWER GENERATION Goal: Build, own and operate solar electricity plants at lowest cost per kWh Borgo Piave, Lazio – 3.5 MW Etrion Lazio Atacama, Chile – 70 MW Salvador Montalto, Lazio – 24 MW Cassiopea and 8.8 MW Centauro Competitive Advantages of Solar Power Easy to permit Simplicity Fast to build Economics Competitive at all sizes Easy to operate Low risk High flexibility in location Abundant resources Projects shown are all Etrion solar PV parks and demonstrate the simplicity of ground-based solar technology. 7 Lowest marginal cost DOWNSTREAM PLAYER IN THE SOLAR ENERGY MARKET RAW MATERIALS Raw materials (e.g., polysilicon) required to make wafers and ingots, which in turn are utilized for the construction of solar cells PARTS (MODULES, INVERTERS) Solar cells are then assembled and packaged in order to form solar panels, which are used in the construction of the solar plant SERVICES (ENGINEERING, CONSTRUCTION) Third parties provide different services to the project sponsor such as engineering, procurement and construction (EPC) DEVELOPMENT PROJECT FINANCE Solar facilities are developed in new markets Non-recourse financing is secured from third-party lenders EPC and operations and maintenance (O&M) services are provided by third-party contractors managed by Etrion Renewable assets are owned and operated by Etrion for the life of the project and provide stable long-term cash flows Value chain characteristics: Accelerated cost reductions upstream resulting in new markets reaching grid parity Oversupply of modules and competition are compressing margins upstream Predictable returns downstream for IPPs like Etrion Favourable conditions to secure project financing at attractive terms and long tenors Montalto, Lazio – 24 MW Cassiopea 8 ASSET MANAGEMENT BUSINESS MODEL – KEY DRIVERS Key drivers Rationale REVENUE STABLE REVENUES 1. Long-term contracts 2. Solar irradiation 3. Wholesale prices Premium price for solar electricity generation under long-term contracts (i.e., FiT or PPA) Annual solar irradiation varies less than 10% per year Economic growth increasing power demand and wholesale electricity prices FINANCING COST LOW EQUIPMENT AND OPERATING COSTS 4. Equipment prices 5. Operating costs 6. Debt/equity ratio 7. Cost of debt Cost reduction through increased supply, competition and technological improvements Fixed-price operations and maintenance (O&M) contracts, including preventive and corrective maintenance Guaranteed performance on equipment from manufacturer and engineering, procurement and construction (EPC) contractor GEARING OF PROJECTS Leveraging total project cost with up to 85% of non-recourse project debt Attractive long-term financing (i.e., tenor and interest rate) Long-term interest rate hedging to minimize risk Bond-like cash flow features Locked-in financial parameters during the entire life cycle of the project 9 SOLAR PROJECT CASH FLOW CREATION Example of Solar Project Cash Flow Creation 100% 15% 33% 17% 10% 25% Revenues High solar irradiation that varies less than 10% on an annual basis Large energy demand supporting high wholesale electricity prices FiT, PPA or merchant revenues Operating cost Interest payment Debt repayment Minimal variable operating costs Continuous decrease in equipment prices Guaranteed equipment performance Effective asset management to reduce operating costs Up to 85% of total project cost leveraged through long-term nonrecourse project finance (local, commercial, multilateral or bilateral banks) Long-term interest rate hedges to minimize risk Note: Figures represent an illustrative project in Etrion’s portfolio. Metrics will vary depending on operating jurisdiction. 10 Up to 85% of total project cost leveraged through long-term nonrecourse project finance Self-amortizing debt repayment schedule matching revenues Debt tenor of 15 to 20 years State and local taxes Free Cash Flow to Equity Tax expense off-set by high depreciation and deductibility of interest expenses Optimization of tax structure reducing tax leakage at project and corporate level Stable, predictable bond like cash flows Simple and efficient distributions to shareholders through repayment of shareholder loan interest and principal and/or dividend distributions SOLAR PROJECT VALUE CREATION Example of Leveraged Solar Project Value Creation Notes: (1) Total investment assumes illustrative project in Etrion’s pipeline with 70% leverage. Development fee is received by Etrion at first drawdown following financial close and effectively reduces the required equity. (2) Asset management fee represents annual fee received by Etrion during 20-year contract life. Cash distribution represents cash distributions received by Etrion over 20-year contract life. (3) Residual value represents remaining 10 years of project useful life and includes cash distributions and asset management fees assumed during that period. (4) All numbers undiscounted. 11 STRONG MANAGEMENT TEAM Marco A. Northland (Chief Executive Officer and Director) - has extensive experience leading growth companies. Prior to co-founding Etrion in 2008, he was responsible for establishing and overseeing European operations for SunPower Corporation, a leading U.S. solar energy company, where he secured commitments for several large-scale solar power plants in Spain, Italy, Germany and Portugal. Prior to SunPower, Mr. Northland held executive positions in various technology companies, including AT&T Latin America, FirstCom and Panamsat. Mr. Northland was born in Chile and graduated from the George Washington University with a bachelor’s degree in electrical engineering and a master’s degree in computer science. He also received an MBA from the University of Chicago. Garrett Soden (Interim Chief Financial Officer and Director) - has experience across the natural resources sector in investment banking, government policy and public company management. He has worked with public companies associated with the Lundin family since 2007 and has extensive experience in the international capital markets, including mergers and acquisitions, debt and equity financings and restructurings. Mr. Soden is the Chairman of the Board and former CEO of RusForest AB. He holds a BSc honours degree from the London School of Economics and an MBA from Columbia Business School. Giora Salita (EVP of Business Development & M&A) - has over 15 years of executive experience in the renewable energy, technology and private equity sectors. Prior to joining Etrion in 2012, Mr. Salita was one of the founding members of Sunray Renewable Energy Ltd., a leading solar power developer in Europe and the Middle East that was acquired by SunPower Corporation, a leading U.S. solar energy company, in 2010. Subsequently, Mr. Salita held the position of Vice President Utility Power Plants International at SunPower, where he led the marketing, sales and business development teams responsible for project development, engineering, procurement and construction of utility scale solar parks. Mr. Salita graduated from the Warwick Business School with a bachelor’s degree in management sciences and attended the development program for owners / directors at INSEAD Business School in France. Fernando Alvarez-Bolado (VP of Engineering and Construction) - has over 12 years of experience in the renewable energy sector overseeing the engineering and construction of wind and solar projects throughout Europe. Prior to joining Etrion in 2010, Mr. AlvarezBolado was Senior Project Manager for SunPower Corporation, a leading U.S. solar energy company, responsible for the construction of solar plants throughout Southern Europe. Prior to SunPower, Mr Alvarez-Bolado was Senior Project Manager for Vestas, a world leading manufacturer, seller and installer of wind turbines, where Mr. Alvarez-Bolado was responsible for the construction of over 200 MWp of wind parks. Mr. Alvarez-Bolado graduated from the University of Valladolid, Spain with a bachelor’s degree in electrical engineering and attended the development program for executives at IESE Business School in Spain. 12 EXPERIENCED NON-EXECUTIVE BOARD MEMBERS Ian H. Lundin (Chairman) - co-leads the investment initiatives of the Lundin Group and serves on the board of several Lundin companies, specifically, Chairman of Lundin Petroleum AB. In 1984, he joined the Lundin Group as drilling manager for International Petroleum Corporation (IPC), where he was appointed President and CEO in 1990. In 1998, IPC merged with another Lundin Group company, Sands Petroleum AB to form Lundin Oil AB, the successor company to Lundin Petroleum AB, where Mr. Lundin held the position of CEO. Mr. Lundin graduated from the University of Tulsa in 1982 with a bachelor of science degree in petroleum engineering. Ashley Heppenstall (Director) - has worked with public companies within the Lundin Group since 1993. He served as Finance Director of Lundin Oil AB, a Swedish upstream oil and gas exploration and production company with worldwide operations in the United Kingdom, Malaysia, Libya, Sudan and Papua New Guinea. After Lundin Oil AB was acquired by Talisman Energy in 2001, Mr. Heppenstall was appointed President and Chief Executive Officer of Lundin Petroleum AB, which was spun off to shareholders of Lundin Oil AB. Mr. Heppenstall graduated from the University of Durham with a bachelor‘s degree in mathematics. Tom Dinwoodie (Director) - is a world leading expert in solar power with over 25 years experience in the renewable energy sector. He was the founding member of PowerLight Corporation, a global manufacturer and supplier of solar energy products and services, where he held the position of CEO and Chairman of the Board. In 2007, PowerLight Corporation merged with SunPower Corporation, where Mr. Dinwoodie held the position of CEO for SunPower's Systems division and later Chief Technology Officer. Mr. Dinwoodie is currently Lead Trustee of the Rocky Mountain Institute, a non-profit foundation focused on sustainable energy and resource efficiency. He also serves on the Sierra Club´s Climate Cabinet an environmental organization focused on climate control and responsible use of energy and resources. Aksel Azrac (Director) - is a Co-Founder and Partner of 1875 Finance, a family office in Geneva, Switzerland. Mr. Azrac joined the Baumgartner Papier, where he was in charge of auditing and consulting services. He then joined Paribas bank, where he managed two funds. In 2001, after the merger between BNP and Paribas, Mr. Azrac joined the Ferrier Lullin & Cie bank as portfolio manager where he managed Swiss and foreign private client portfolios. Mr. Azrac studied engineering at the Ecole Polytechnique de Lausanne (EPFL) and business administration at HEC Lausanne, Switzerland. 13 INDUSTRY OVERVIEW 14 GLOBAL SOLAR INSTALLED CAPACITY (2014) Total global solar installed capacity of 195 gigawatts (GW) in 2014 Solar represents less than 4% of global installed power generation capacity Annual solar installation growth projected at close to 60 GW in 2015 Source: Bloomberg New Energy Finance. Note: 2014 installed capacities include solar thermal. Please refer to next slide for further information on projected capacity 2015E-2017E. 15 STRONG OUTLOOK FOR SOLAR PV INDUSTRY Cumulative Solar PV Installed Capacity (GW) Solar PV has experienced significant growth over the past decade and is on the way to becoming a mature and mainstream source of electricity 370 320 European countries have historically dominated the solar PV market due to supporting government policies, but going forward significant growth is expected in Japan, Chile, Brazil, the United States, China, India and Southeast Asia 253 195 145 104 73 44 3 4 5 7 10 16 2003 2004 2005 2006 2007 2008 24 2009 2010 2011 = Projected Growth Source: Bloomberg New Energy Finance. 16 2012 2013 2014 2015E 2016E 2017E ACCELERATED DECREASE IN REQUIRED CAPEX Evolution of Utility-Scale Solar PV Capex (US$ / W) As all-in solar installation costs have fallen significantly in recent years, solar PV is perfectly positioned to capitalize on the significant advantages inherent in the technology $5.85 1.80 Solar is now competitive with retail power prices in several markets, supporting long-term sustainable growth of future demand Reductions in all-in installation costs are projected to continue, further improving the competitiveness of solar PV $4.18 $3.41 1.69 1.46 4.05 $2.65 1.30 2.49 $1.61 $1.58 0.86 0.87 0.75 0.71 0.62 2012 2013 2014 1.95 $1.45 0.83 1.35 2008 2009 Source: Bloomberg New Energy Finance and Etrion estimates. 17 2010 2011 Module EPC (excl. Module) ASSET OVERVIEW 18 ETRION’S GLOBAL PLATFORM Geographic diversification across Italy, Chile and Japan Revenue diversification across FiT, PPAs and spot (merchant) pricing Etrion is constantly evaluating new opportunities in high-growth regions 19 COUNTRY SNAPSHOT ITALY CHILE JAPAN S&P: BBBMoody’s: Baa2 Fitch: BBB+ S&P: AAMoody’s: Aa3 Fitch: A+ S&P: AAMoody’s: A1 Fitch: A+ 10-Year Bond Yield 1.88% 4.29% 0.28% Inter-annual CPI (Dec-2014) 0.2% 4.7% 2.3% Corporate Income Tax Rate 31.4% 20.0% 35.6% (previous 20-year FiT) (1) PPA or Spot Sovereign Credit Rating Auction mechanism or Spot (plus ERNC(2), CER(3) and Capacity Payments(4)) (¥32 / US$0.32 / kWh) National Solar PV Target 17% of total energy consumption to come from renewable sources by 2020 20% of total electricity generation from renewable sources by 2025 28 gigawatts (GW) by 2020 / 25-35% renewable energy by 2030 Average Solar Irradiation 1,750 kWh/kWp 2,800 kWh/kWp 1,050 kWh/kWp Average Electricity Price €0.06/kWh / US$0.08/kWh SING(6): US$0.10/kWh SIC(6): US$0.17/kWh ¥17 / US$0.17 / kWh Solar PV Revenue Scheme 20-year FiT(5) Notes: (1) The Italian FIT scheme applies to applications made for PV projects between February 2013 and December 2016. (2) Chile’s Renewable and Non-Conventional Energy (ERNC) law requires generating companies to have at least 5% of the total energy supplied derived from renewable energy sources. Renewable companies can sell these attributes. ERNC revenues account for approximately 10% of the total revenues. (3) Certified Emission Reductions (CER) provides an additional revenue set-out in the Kyoto Protocal applicable to renewable energy generators in developing countries. CER revenues account for approximately 1% of the total revenues. (4) Capacity payments are made by the system operator to electricity generators based on their expected contribution during peak demand. Capacity payments account for approximately 6% of the total revenues. (5) The Japan FiT scheme shown here applies to applications made for solar PV projects between April 1, 2014, and March 31, 2015. (6) Chile’s electricity market is divided into two main networks: the Sistema Interconectado Norte Grande (SING) in northern Chile and the Sistema Interconectado Central (SIC) in central Chile. The two networks are not yet connected. 20 ITALY: OPERATING ASSETS 21 ITALIAN POWER MARKET Overview Italy is a leading producer of electricity from renewable energy sources, and it is one of the largest producers of solar energy in the world The solar PV sector has historically been the dominant renewable energy technology due to the Italian solar Feed-in-Tariff (“FiT”) program and Italy’s strong solar irradiation In 2005, the Italian government introduced a 20-year FiT system in order to encourage expansion of solar energy Solar PV plants located in the south of Italy achieve a very high level of utilization - over 1,500 hours per year In 2013, Italy met its goal for installed solar PV capacity and stopped the FiT program for new solar projects. In 2014, Italy reduced FiT revenues for existing projects by 6-8% starting January 1, 2015 Italy – Installed Capacity by Source 2013 7% 1% 7% 9% 46% 116 GW 15% Gas Source: Terna, ENI. 22 Solar 16% Hydro Coal Wind Oil Geothermal Annual Solar Irradiation ITALIAN OPERATING ASSETS Project MW Cassiopea (Montalto, Lazio) 24.0 Helios ITA-3 (Brindisi/Mesagne, Puglia) 10.0 Centauro (Montalto, Lazio) 8.8 Helios ITA (Brindisi/Mesagne, Puglia) 6.4 Etrion Lazio (Borgo Piave/Rio Martino, Lazio) 5.3 SVE (Matino/Oria/Ruffano, Puglia) 3.0 Sagittario (Nettuno, Lazio) 2.6 Total Operational 60.1 17 power plants with predictable revenues and cash flow 20-year FiT contract with 16 years remaining on average Expected to produce more than 100 million kWh of electricity per year Notes: (1) All projects are owned 100% by Etrion. (2) Power plant capacity is shown in MW on a direct current basis, also referred to as megawatt-peak (MWp). 23 Central monitoring system provides real-time visibility into plant performance (scalable platform for growth) 99.7% availability in 2014 CHILE: OPERATING ASSETS AND PIPELINE 24 CHILEAN POWER MARKET Overview In 2013, Chile had 18 GW of total installed power capacity, of which large hydro and natural gas made up more than 50% Chile – Installed Capacity by Source 2013 17% Wind 2% 21% Renewables accounted for approximately 8% of installed capacity, with solar power at less than 1% 8% Small Hydro 4% 18 GW Electricity market is divided into 4 networks; Etrion’s projects are located in the SIC (Project Salvador) and SING (Aguas Blancas) areas De-regulated market whereby electricity generators can enter into bilateral agreements (denominated in US$) directly with industrial clients Biomass & Waste 2% Solar < 1% 24% 30% Oil & Other Fossil Renewables Large Hydro Natural Gas Source: Bloomberg New Energy Finance. Market Validation Key drivers for success: Solar has reached levelized cost of energy (LCOE), meaning it can compete with other sources of energy Abundant renewable resources (i.e. attractive solar irradiation) High wholesale electricity prices Available long-term, low-cost financing Increasing energy demand 25 Consistent with Etrion’s business model and track record of success Coal PROJECT SALVADOR – TOTAL/ETRION PARTNERSHIP SALVADOR (70 MW) Atacama, Chile – 70 MW Salvador Project Details 70 MW completed several months ahead of schedule and under budget Capacity 70 (49 net) MW Irradiation Yield 2,916 kWh/kWp Revenue Stream Merchant project in the SIC (spot market pricing with ability to secure future PPAs) Production 200 (140 net) GWh/year Land Government concession Start of Construction Q4-2013 End of Construction Q4-2014 Notes: (1) Etrion acquired a 70% interest in the project with an equity contribution of approximately US$42 million. Following payback of the equity contribution, Etrion’s ownership will decrease to 50.01%. After 20 years of operations, Etrion’s ownership will decrease to zero. (2) Notice to proceed with construction was given to SunPower in December 2013, and the project was completed in November 2014. 26 CHILEAN SOLAR PIPELINE # COUNTRY REGION PROJECT NAME CONTRACT REGIME SITES MW STATUS PROBABILITY OWNERSHIP SHOVEL-READY - Land concession decree signed. - Environmental impact assessment received. 1 Chile SING (Northern) Aguas Blancas 2B Merchant + PPA 1 24 - Interconnection contract under advanced negotiations. P75 100% Q1-2015 P50 100% Q1-2015 P50 100% Q1-2015 P50 100% Q1-2015 - PPA contract under advanced negotiations. - Mining rights secured. - Land concession decree signed. 2 Chile SING (Northern) Aguas Blancas 2C Merchant + PPA 1 16 - Environmental impact assessment received. - Interconnection contract agreed. - Mining rights secured. - Land concession decree expected in Q1-2015. 3 Chile SING (Northern) Aguas Blancas 2A Merchant + PPA 1 32 - Environmental impact assessment received. - Interconnection contract agreed. - Mining rights secured. - Land concession decree signed. 4 Chile SIC (Central) Las Luces I Merchant + PPA 1 27 - Environmental impact assessment received. - Interconnection contract under advanced negotiations. - PPA negotiations started. 4 99 Etrion’s advanced project development pipeline in Chile includes 99 MW Construction start dates will depend on ability to secure PPAs and project financing 27 JAPAN: ASSETS UNDER CONSTRUCTION AND DEVELOPMENT 28 JAPANESE POWER MARKET Overview 1% Japan is one of the largest solar PV markets in the world today with 25.9 GW of installed capacity in 2014 Japan – Installed Capacity by Source 2013 10% Relatively low-risk jurisdiction with an attractive solar FiT program (¥40 / US$0.40, ¥36 / US$0.36 or ¥32 / US$0.32 per kWh for projects secured 2012-2014) and low financing costs The government plans to increase power supply from renewable sources to 25-35% by 2030 Japan is the third largest solar market in the world, representing approximately 23% of global solar market growth, or 11 GW, in 2014 Japan has a national solar power target of 28 GW by 2020 2% 1% 0.3 % 200 GW The Japanese government has instituted a strong mandate to increase the use of renewable energy in Japan’s energy mix in order to reduce the country’s reliance on nuclear power 7% 21% 23% 34% Nuclear Geothermal Solar Gas Hydro Oil Biomass Coal Wind Source: Bloomberg New Energy Finance. Market Validation Stable revenues (through attractive FiT regime) Strong local partner (Hitachi High-Tech) Investment grade country with AA- rating (per Standard & Poor’s) Availability of long-term financing at competitive rates Fast developing solar PV market with strong government support Japanese expansion plans are consistent with Etrion’s business model and proven track record of success 29 HITACHI HIGH-TECH/ETRION PARTNERSHIP SHIZUKUISHI MITO Capacity 24.7 (21.5 net) MW 9.3 (8.1 net) MW Irradiation Yield 1,047 kWh/kWp 1,118 kWh/kWp Revenue Stream FiT (paid in JPY): JPY 40 (US$0.40)/kWh Term: 20 years FiT (paid in JPY): JPY 40 (US$0.40)/kWh Term: 20 years Production 25.6 (22.2 net) GWh/year 10.3 (9.0 net) GWh/year Total Project Cost US$89 million (US$77.3 million net) US$34.1 million (US$29.7 million net) Revenue US$10.2 million (US$8.9 million net) US$4.1 million (US$3.6 million net) EBITDA US$7.4 million (US$6.4 million net) US$3.2 million (US$2.8 million net) Land Leased from individual landowner Leased from individual landowner Start of Construction Q4-2014 Q4-2014 Completion of Construction Q3-2016(3) Q3-2015 34 MW fully-funded and under construction Notes: (1) Etrion has entered into a development agreement with Hitachi High-Tech, a subsidiary of Hitachi, Ltd, for the development, finance, construction, ownership and operation of utility-scale solar power plants in Japan. Etrion owns approximately 87% of the projects, and Hitachi High-Tech owns approximately 13%. An exchange rate of US$/JPY 100 has been used. (2) Revenue and EBITDA projections represent the first full year of operations. (3) Shizukuishi will connect through the Tohoku Electric Power Co., Inc. utility, which requires up to 29 months for grid connection. However, construction may be accelerated. 30 JAPANESE SOLAR PIPELINE # COUNTRY REGION PROJECT NAME South Greenfield Project 1 CONTRACT REGIME SITES MW STATUS PROBABILITY OWNERSHIP SHOVEL-READY - Project secured. 1 Japan FiT 1 24 - FiT secured. P50 85% Q1-2016 P50 85% Q4-2015 P50 85% H2-2015 P25 85% H2-2015 - Land contract secured. - Project exclusivity secured. 2 Japan South Brownfield Project 1 FiT 1 50 - FiT secured. - Land contract secured. - Grid impact studies completed. - Project under advanced negotiations. 3 Japan Central Brownfield Project 2 FiT 1 14 - FiT secured. - Land contract secured. - Grid impact studies completed. - Project exclusivity secured. 4 Japan North Brownfield Project 3 FiT 1 50 - FiT in progress. - Land contract secured. - Grid impact studies are in progress. 4 138 Etrion and Hitachi High-Tech on track to meet target of having at least 100 MW under construction or shovel-ready by 2015 in Japan Etrion and Hitachi High-Tech expect to have an additional 200 MW under construction or shovel-ready by 2017 in Japan 31 SUMMARY 32 OVERALL PROJECT PORTFOLIO – POTENTIAL GROWTH Net Installed Capacity Evolution MW 56.1 300 293+ (3) (2) Almost 5x growth in installed capacity 250 27 72 200 150 21.5 49 (1) 8.1 (2) (2) 100 60 al Vi si b To t Ja pa n as -L Ch ile Ta rg Lu c et 20 15 es ca s -A gu as -S hi zu ku Bl an ish i ito Ja pa n -M Ja pa n Ch ile Notes: Ch i le -S al I ta ly va do r 0 le 50 (1) Etrion’s initial 70% net capacity in 70 MW project. (2) Etrion’s 85-87% net capacity in Japanese projects. Etrion’s target with Hitachi High-Tech is to have at least 100 MW shovel-ready or under construction by 2015 and a total of 300 MW by 2017. (3) These projects represent Etrion’s potential organic growth plan; pipeline shown here may be replaced by other projects within the next 12 months. 33 Operating Under Construction Under Development CONCLUSION Attractive returns in downstream solar power generation sector Global Platform Well positioned to expand within Europe, Asia and the Americas Systems in place to effectively manage operations across multiple jurisdictions Proven ability to secure high-return projects and attract strong partners (Total, Hitachi High-Tech) Solid Capital Structure Non-recourse project finance from banks with 70-85% leverage Corporate bonds (e.g., recent EUR 80 million senior secured bond listed in Oslo with April 2019 maturity) Lundin family financial support (e.g., US$42 million unsecured bridge facility repaid January 2014) Canadian and Swedish stock exchange listings (e.g., recent US$80 million private placement) Strong Management Operational know-how with over 300 MW of solar parks built in major EU markets and in Chile Track record in corporate/project finance, as well as mergers and acquisitions Extensive experience building successful international businesses Multicultural, multilingual team of approximately 35 employees Yield Plus Growth Plan Yield – clear path to declare dividends with stable revenue and EBITDA Diversity – in terms of geography (Italy/Chile/Japan) and contract regime (FiT/PPA/Merchant) Critical mass – gaining scale in terms of MW, EBITDA, market cap and trading volume Growth – almost doubled installed capacity in 2014 with large pipeline for future growth 34 APPENDIX 35 ETRION EQUITY RESEARCH COVERAGE Broker Location Date of Last Report Target Price (CAD) Target Price (SEK) Recommendation 1 ABG Sundal Collier Stockholm August 11, 2014 $0.60 3.8 Buy 2 Cormark Securities Toronto November 11, 2014 $0.80 5.2 Buy 3 Jacob Securities Toronto November 28, 2014 $0.64 4.2 Hold 4 National Bank Financial Toronto January 14, 2015 $0.55 3.7 Sector Perform 5 Paradigm Capital Toronto November 7, 2014 $0.80 5.2 Buy 6 Pareto Securities Stockholm January 28, 2015 $0.71 4.7 Buy 7 Swedbank Oslo December 16, 2014 $0.56 3.7 Buy Consensus $0.67 4.4 Note: The target prices and recommendations set forth above represent the views of the authors of the applicable reports and not those of Etrion. Readers are encouraged to review the full text of the reports, which are available through the above brokers. The foreign exchange rate is as of the report date. 36 Contact Details Etrion Corporation Rue de la Rôtisserie 1 1204 Geneva Switzerland Phone: +41 22 715 20 90 Email: [email protected] Website: www.etrion.com 37
© Copyright 2026
