
Overnight Report - Thebe Stockbroking
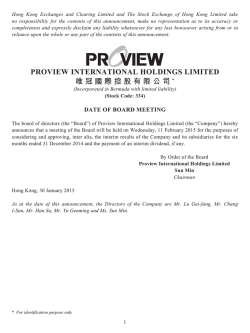
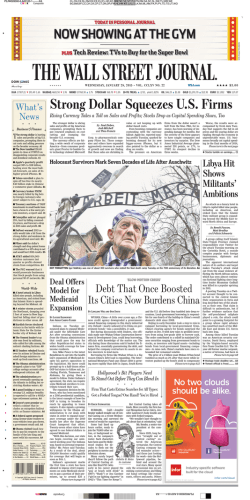
Overnight Report
06 February 2015
Compiled by Azwidovhi Tshishonga (Trainee Analyst), moderated by Henry Flint (Head of Research)
The Overnight Report is compiled from various sources, including I-Net BFA, Bloomberg, Reuters, Business Day, Moneyweb, Cordros Capital and JSE SENS.
SOUTH AFRICA
The JSE closed slightly firmer in quiet trade on Thursday as platinum stocks
recovered, despite a softer platinum price, and Sasol retreated on the stronger
rand. At 5pm the JSE All Share Index was up 0.11% at 51,688.7, and the blue-chip
Top 40 had gained 0.09%.
•
We expect the South African market to open marginally higher (0.2%) as importers
benefit from a stronger rand. The rand strengthened against the dollar after
reports showed the US trade balance deficit widened while expectations were for
an improvement.
•
Volumes are expected to remain low ahead of US non-farm payrolls and will take
direction from the data following better than expected jobless claims yesterday.
Crude oil, platinum and gold prices are trading higher, which lead BHP Billiton up
0.6% in Australia.
•
Yields on South African government bonds inched up, with the benchmark paper
due in 2026 adding 1.5 basis points to 7.35%.
•
This morning as at 07h03 in Johannesburg, the rand was trading at R11.31/$,
R12.97/€ and R17.33/£ respectively.
WEST AFRICA – NIGERIA
•
The NSE ASI closed at 30,200.97points, while market capitalisation decreased by
N121.36billion to close at N10.08trillion.
•
The naira depreciated against all of the currency pairs tracked. It depreciated
against the dollar to trade at N193.00/$. The naira also depreciated against the
pound and euro to trade at N295.22/£ and N221.57/€ respectively.
EUROPE
•
•
US
The Stoxx Europe 600 Index added 0.1% to 372.51 at the close of trading.
•
The Standard & Poor’s 500 Index added 1% to 2,062.52 at 4 p.m. in New York. The
Dow Jones Industrial Average rose 211.86 points, or 1.2%, to 17,884.88.
JSE share price moves
All prices are correct as of 22:58:22 5 Feb 2015
WINNERS
DIAMONDCP
LOSERS
11.11%
EHSV
9.06%
JASCO
-20.00%
ROCKWELL
-10.20%
-10.16%
DENEB
8.82%
KIBO
ATLATSA
8.80%
RANGOLD
-7.92%
LIBHOLD11
8.49%
OANDO
-7.61%
JSE trading volumes
All prices are correct as of 22:58:22 5 Feb 2015
REDEFINE
9,752,849
0.18%
STEINHOFF
9,036,284
0.46%
ACCENT
9,001,911
-6.00%
NETCARE
5,612,941
2.28%
ELLIES
5,549,551
-6.43%
JSE trading statistics
Value of shares traded (R'M)
22311.791
ASIA
Volume of shares traded (M)
269.63
•
The MSCI Asia Pacific Index rose 0.4% to 142.14 as of 9:01 a.m. in Tokyo.
COMMODITIES
Number of Deals
222634
•
Gold steadied ahead of crucial U.S. employment data, but was set to post its
biggest weekly loss in almost two months after steep gains at the start of the year.
Up deals
254
Down deals
227
Flat deals
405
Source: I-Net BFA
Dow Jones
JSE All-Share
54000
18900
52000
18200
50000
17500
48000
16800
46000
16100
44000
15400
14700
42000
40000
02/01/14
03/03/14
02/05/14
01/07/14
30/08/14
29/10/14
28/12/14
14000
02/01/14
13/03/14
22/05/14
31/07/14
09/10/14
18/12/14
Today’s economic data releases
Local time
08h00
08h00
09h00
15h30
15h30
Source: Bloomberg
Country
SA
SA
GE
US
US
Indicator
Gross Reserves
Net Reserves
Industrial Production SA (m/m)
Change in Nonfarm Payrolls
Unemployment Rate
Period
Jan
Jan
Dec
Jan
Jan
Relevance
High
High
Low
Medium
Medium
Previous
$49.10B
-$42.73B
-0.1%
252K
5.6%
Consensus Forecast
$48.89B
-$42.61B
0.4%
230K
5.6%
SOUTH AFRICA
The JSE closed slightly firmer in quiet trade on Thursday as platinum stocks recovered, despite a softer platinum price, and Sasol retreated on the stronger rand.
Brent crude rose $1.57 to $55.73 a barrel in the late afternoon, having fallen more than a dollar intraday earlier and settling 5.5% lower on Wednesday. At 5pm
the all share was up 0.11% at 51,688.7, and the blue-chip top 40 had gained 0.09%. Platinum led the gainers, firming 4.42% and industrials added 0.44%. Banks
were down 1.32% and the gold index lost 1.06%. Resources were 0.79% down. After dropping nearly 6% in early trade, Sasol closed 3.94% lower at R450.54.
Lonmin led the bigger platinum players, firming 7.63% to R32.16. Anglo American Platinum gained 4.61% to R388 and Impala Platinum was 3.88% higher at
R81.60. Industrial conglomerate Remgro advanced 0.99% to R272.50. Naspers recovered 1.2% to R1,698.44. Among banks Standard Bank closed 3.28% lower at
R153.11 and Nedbank lost 1.19% to R256.72. Retailer Shoprite firmed 2.74% to R181.85 and Pick n Pay gained 1.97% to R57.06. Among property counters,
Growthpoint added 1.03% to R29.50, while Resilient was up 0.74% to R89, just below previous record levels. Spur Corporation took a breather, dropping 1.28%
to R38.50 after a strong run earlier in the week.
WEST AFRICA – NIGERIA
The three consecutive gaining sessions came to a halt as evident declines in the Sectoral indices' posed a drag on the market. The NSE ASI closed at
30,200.97points, while Market Capitalization decreased by N121.36billion to close at N10.08trillion. The decline reduced the market's Year-To-Date loss to
12.86%. The Insurance index emerged the only sectoral index gainer recording a 0.46% increase. On the other hand, the Banking and Consumer Goods indices
fell by 2.08% and 1.35% respectively while the Industrial Goods and Oil/Gas index also dropped by 0.46% and 0.42% respectively. Market breadth worsened, as
19 gainers and 32 laggards were recorded. Volume traded increased by 2.46 % to 477.49million shares, valued at N3, 962billion and traded in 4,417 deals.
The naira depreciated against all of the currency pairs tracked. It depreciated against the dollar to trade at N193.00/$. The naira also depreciated against the
pound and euro to trade at N295.22/£ and N221.57/€ respectively.
EUROPE
Stocks in Europe closed at their highest level in more than seven years. Greek shares fell amid concern over talks between the nation’s government and
European leaders. The Stoxx Europe 600 Index added 0.1% to 372.51 at the close of trading, erasing intraday losses of as much as 0.6% as energy shares
advanced. The ECB restricted loans to Greece, a decision that will raise financing costs for the nation’s banks and increase oversight by policy makers. The Greek
ASE Index slid 3.4% as lenders slumped. Following the ECB’s move, the government in Athens held onto demands to end austerity. German Finance Minister said
after a meeting with his Greek counterpart that they “agreed to disagree,” signaling no compromise. Optimism that Greece’s new government will soften its
anti-austerity stance had sent the Stoxx 600 higher earlier this week, with the ASE posting its biggest three-day rally since 1991. The Stoxx 600 has surged 8.8%
this year after the ECB announced a bond-buying plan that included sovereign bonds. The volume of Stoxx 600 shares changing hands was 5.3% greater than the
30-day average, data compiled by Bloomberg show.
“The consequences of the current turmoil in Greece are extremely important,” said Pierre Mouton, who helps oversee $8 billion at Notz, Stucki & Cie. in Geneva.
“Greece puts itself at the extreme of the spectrum, while the ECB stands at the opposite. Now it’s bargaining time and they should get closer as time goes by.”
US
U.S. stocks climbed, with benchmark indexes erasing declines for the year, as oil resumed a rebound and Pfizer Inc. announced a $17 billion deal. Denbury
Resources Inc. and Noble Corp. jumped more than 3.7% as oil climbed 4.7%. Pfizer added 2.9% as it agreed to buy Hospira Inc., the biggest provider of injectable
drugs and infusion technology. Hospira jumped 35%. The Standard & Poor’s 500 Index added 1% to 2,062.52 at 4 p.m. in New York. The Dow Jones Industrial
Average rose 211.86 points, or 1.2%, to 17,884.88. The Russell 2000 Index surged 1.5%. About 7 billion shares traded hands on U.S. exchanges Thursday, 3.2%
more than the three-month average. The S&P 500 fell 0.4% yesterday, following the biggest two-day rally in almost a month, as stocks gave up gains in the final
30 minutes after the European Central Bank tightened its rules on lending to Greek banks and oil retreated.
“Right now it’s earnings, Greece and M&A,” Krishna Memani, the New York-based chief investment officer at Oppenheimer Funds Inc., said by phone. “It’s more
about the corporate outlook in the U.S. remaining good and the realization that while the Greek issue is important, it will eventually be resolved.”
ASIA
Asian stocks followed U.S. equities higher, with the regional benchmark index extending its weekly advance, as materials and energy shares gained amid higher
oil prices. The MSCI Asia Pacific Index rose 0.4% to 142.14 as of 9:01 a.m. in Tokyo, heading for a 1.3% increase this week after the Reserve Bank of Australia cut
interest rates to a record low and China reduced banks’ reserve ratios. The European Central Bank will allow its Greek counterpart to provide as much as 59.5
billion euros ($68 billion) in emergency funding for lenders, a euro-area central-bank official familiar with the decision said. West Texas Intermediate crude
futures climbed as much as 2% today after rising 4.2% yesterday. Japan’s Topix index added 0.8%. South Korea’s Kospi index slid 0.2%. Australia’s S&P/ASX 200
Index increased 0.4%. Markets in Hong Kong and China have yet to open, while New Zealand is closed for a holiday. The Shanghai Composite Index retreated 1.2
yesterday after rallying as much as 2.4%, as the cut in banks’ reserve-ratio requirements failed to soothe investors’ concern that the economic slowdown is
deepening.
“Greece is still an issue but investors are choosing to focus on the positives,” Tony Farnham, a strategist at Paterson Securities in Sydney, said by phone. “There
would probably be a compromise, whether extending the repayment period on Greek debt or cutting interest rates. There’s further upside in equities given the
wave of global monetary easing by central banks.”
GOVERNMENT BONDS
Yields on South African government bonds inched up, with the benchmark paper due in 2026 adding 1.5 basis points to 7.35%.
Treasuries held onto Wednesday’s gains as Greece lost a source of funding, spurring demand for the relative safety of U.S. debt. Benchmark notes were little
changed as the European Central Bank restricted loans to Greece’s financial system, raising pressure on the country’s new government to accept German-led
austerity demands to stay in the euro region. Treasuries are attractive even after this year’s plunge in yields because they still pay more than bonds in other
countries, according to CIBC World Markets Corp. The yield on the 10-year Treasury was little changed at 1.76% as of 9:05 a.m. in London, according to
Bloomberg Bond Trader data. The 2.25% note due in November 2024 was at 104 12/32. U.S. benchmark 10-year notes yield 82 basis points more than the
average among their equivalent-maturity Group-of-Seven counterparts, data compiled by Bloomberg show. While the premium has narrowed from more than
1percentage point in December, it’s still more than the average of four basis points for the past five years. A basis point is 0.01percentage point.
“That’s the big issue,” said Kazuaki Oh’e, a debt salesman at CIBC World Markets Japan Inc. in Tokyo, referring to Greece’s debt negotiations. “It’s a flight to
quality.”
FOREIGN EXCHANGE
South Africa's rand took advantage of disappointing unemployment figures from the United States and demand for emerging market assets to climb to its
highest in two-months against the dollar on Thursday. At one stage the rand gained over 2% before pulling back slightly, and by 1602 GMT had firmed 1.9% to
11.2750 per dollar, making it the second biggest gainer against the greenback in a basket of 20 emerging market currencies monitored by Reuters. Only the
Russian rouble, cheered by a rebound in global oil prices, had gained more against the dollar on the day. On its way to its largest daily gain in 2015, the rand
shrugged-off an announcement by power-utility Eskom that it was cutting a tenth of its electricity supply - its biggest power cuts this year - due to five failed
generators. Selling on the dollar was triggered after the number Americans filing new claims for unemployment rose, albeit less than expected, keeping dollar on
the back foot as bets on when the U.S. Federal Reserve will raise rates continued to swing.
Australia’s dollar advanced after the central bank kept its outlook for inflation within its target band. New Zealand’s dollar rose for a fifth day. The Aussie headed
for its biggest weekly gain in a month even as the Reserve Bank of Australia in its quarterly statement lowered its forecasts for core prices and growth in 2015 by
a quarter percentage point each. The euro was poised for its biggest weekly advance in 16 months as a European Central Bank official said Greek banks will have
access to emergency funding. A gauge of the dollar headed for its worst week in 18 months before the release of U.S. payrolls data. The Australian dollar
advanced 0.4% to 78.27 U.S. cents as of 1:38 p.m. in Tokyo, extending this week’s gain to 0.9%, the most since the period ended Jan. 9. New Zealand’s currency
climbed 0.4% to 74.22 cents. The euro fell 0.1% to $1.1470 and slid 0.3% to 134.52 yen. The dollar dropped 0.2% to 117.27 yen. The Aussie may eventually climb
above 80 cents, according to CBA’s Grace. That would be the highest level since Jan. 28.
“The economic growth forecasts were only revised down very marginally,” said Richard Grace, chief currency and rates strategist and head of international
economics at Commonwealth Bank of Australia. “It’s about the minimum you can revise them down, and that’s why the market -- which was short Aussie going
into the announcement -- flipped higher.” A short position is a bet an asset’s price will decline.
COMMODITIES
Gold steadied ahead of crucial U.S. employment data, but was set to post its biggest weekly loss in almost two months after steep gains at the start of the year.
A strong U.S. jobs number for January would strengthen expectations for the Federal Reserve to hike interest rates by mid-year, denting the appeal of noninterest yielding assets such as gold. But weaker data could buoy bullion prices. U.S. nonfarm payrolls are forecast to have increased by 234,000 last month after
rising by 252,000 in December, according to a Reuters poll of economists. That would be the 12th straight month of job gains above 200,000, the longest streak
since 1994. Spot gold was nearly flat at $1,264.55 an ounce by 0149 GMT. The metal has lost 1.4% so far this week, which would be its largest fall since the week
ended Dec. 19. Gold gained 8.4% in January, its biggest monthly rise in three years, helped by a sharp slowdown in U.S. fourth-quarter economic growth. U.S.
gold for April delivery edged up 0.2% to $1,265.20 an ounce. Amid market expectations of still strong U.S. jobs creation in January, the data is unlikely to be a
game changer, Mizuho Bank said, citing wild swings in oil prices as potentially the main variable in the Fed's interest rate plan. The gold market was also keeping
one eye on Greece where increased uncertainty this week has supported prices.
"For one, stubborn downside in inflation and an elevated U.S. dollar because of easing elsewhere could stall the Fed's rate hike plans," the bank said in a note.
"This is more so if evidence of shale activity slowdown with discernible impact on jobs creation starts to come through."
London copper edged up on Friday ahead of U.S. jobs data and was set to notch up its biggest weekly gain in more than two years, riding in the slipstream of a
rebound in crude oil prices. A rise in oil prices tends to trigger copper purchases for buyers of commodity index funds. The copper market is seen as very short,
raising the risk of a ferocious short-covering rally. But physical demand is weak ahead of the Lunar New Year in China, with consumers reluctant to stock up and
ample supply expected in the world's top user of metals. Most industry sources therefore expect any price strength to prove short-lived ahead of the holiday,
which starts on Feb. 19. U.S. crude rose as much as $1 in early Asian trade on Friday, continuing a rebound from near-six-year lows plumbed last week. Threemonth copper on the London Metal Exchange edged up 0.2% to $5,729 a tonne by 0248 GMT, after closing a touch firmer in the previous session. The price was
set to finish the week up 4.2%, which would be its biggest weekly gain since September 2012. The most traded April copper contract on the Shanghai Futures
Exchange climbed 0.9% to 41,560 yuan ($6,660) a tonne.
"Copper's bounce accompanied a bounce in the oil price. Clearly there is some correlation, so I would say it's more of trading game than a fundamental game,"
said analyst Joel Crane of Morgan Stanley in Melbourne."Copper has had a good short-covering bounce from lows, and the market is running out of steam," said
a trader in Hong Kong.
ENERGY
Oil headed for a second weekly advance amid the highest trading volatility in almost six years. Futures rose for a second day in New York and have gained 6%
this week. The CBOE Crude Oil Volatility Index, which measures price fluctuations using options of the U.S. Oil Fund, ended at 63.14 on Thursday, the most since
April 2009. The United Steelworkers union, which went on strike at nine U.S. oil plants on Feb. 1, plans to resume bargaining with Royal Dutch Shell Plc next
week after rejecting a sixth offer for a new labor contract for 30,000 workers. Oil snapped its biggest four-day rally since January 2009 on Wednesday after U.S.
government data showed crude stockpiles in the world’s largest consumer surged to the highest level in more than three decades. Saudi Arabia cut prices for
March exports to Asia to the lowest in at least 14 years, signaling OPEC’s largest producer may continue to fight for market share. West Texas Intermediate for
March delivery climbed as much as $1, or 2%, to $51.48 a barrel in electronic trading on the New York Mercantile Exchange and was at $51.14 at 12:26 p.m.
Singapore time. The contract advanced $2.03 to $50.48 on Thursday. Total volume was about 5% above the 100-day average. Futures are down 4% this year.
“There’s a big debate as to whether the market should focus on the current bearish supply situation versus signs that may change,” Phil Flynn, a senior market
analyst at the Price Futures Group in Chicago, said by e-mail. Capital spending reductions by companies and the idling of drill rigs signal “there could be a change
in the air,” he said.
Key Indicators
115
Indices 2014
Last/Close
Daily
Move
Week
Month
YTD
12 month
%
%
%
%
0.29%
14.44%
110
Points%
105
Global Markets
100
95
Dow Jones
90
S&P 500
2062.52
1.03%
2.04%
0.02%
0.21%
16.30%
85
02/01/14 23/03/14 11/06/14 30/08/14 18/11/14
Nasdaq
4765.10
1.03%
1.74%
0.61%
0.81%
17.45%
FTSE 100
DAX
6865.93
10905.41
0.09%
-0.05%
0.81%
1.56%
4.50%
10.85%
4.86%
11.68%
4.69%
17.81%
4703.30
0.15%
1.55%
10.40%
10.61%
12.30%
JSE All Share
FTSE 100
Dow Jones
HangSeng
CAC 40
17884.88
1.20%
2.69%
-0.13%
Gold $
1420
Hang-Seng
24765.49
0.35%
0.69%
3.90%
3.80%
15.60%
1380
Nikkei225
17504.62
-0.98%
-0.58%
1.97%
10.03%
23.66%
Australia
5765.50
0.55%
4.22%
7.58%
6.47%
12.01%
1340
1300
1260
South African Market
1220
All Share
51688.70
0.11%
1.46%
4.22%
4.38%
14.90%
1180
Top-40
45450.89
0.09%
1.52%
4.08%
4.01%
12.32%
1549.13
-1.06%
4.80%
17.19%
37.73%
19.96%
37.33
4.42%
10.07%
8.63%
8.79%
-22.72%
1140
Gold
1100
02/01/14 23/03/14 11/06/14 30/08/14 18/11/14
Platinum
Banks
75944.40
-1.32%
-0.43%
3.38%
5.19%
47.96%
1590
Industrial
72684.59
0.44%
0.29%
2.66%
3.63%
23.61%
1520
Financial
16351.93
-0.16%
0.55%
5.17%
5.48%
38.66%
Resources
43865.96
-0.79%
6.57%
8.02%
5.01%
-17.99%
56.57
4.45%
15.14%
11.01%
0.27%
-47.22%
1263.75
-0.43%
-0.92%
4.75%
6.71%
0.42%
Platinum $
1450
1380
Commodities
1310
1240
Brent Futures $
1170
Gold $
1100
02/01/14 23/03/14 11/06/14 30/08/14 18/11/14
Copper $
5708.00
0.00%
5.89%
-8.39%
-9.53%
-19.71%
Platinum $
1254.00
1.07%
2.66%
2.94%
4.28%
-8.91%
Iron Ore $
61.64
-1.50%
-13.37%
-10.74%
-10.99%
-53.92%
USDZAR
11.29
-1.68%
-2.22%
-2.46%
-2.69%
2.32%
6.8
EURZAR
12.94
-0.38%
-1.09%
-5.17%
-7.85%
-13.70%
6.6
GBPZAR
17.28
-0.76%
-0.69%
-1.03%
-3.27%
-4.02%
6.4
EURUSD
1.15
1.36%
1.21%
-2.72%
-4.42%
-15.61%
7.6
R159
7.4
Currencies
7.2
7.0
6.2
6.0
02/01/14 23/03/14 11/06/14 30/08/14 18/11/14
USDGBP
0.65
-0.96%
-1.61%
-1.55%
0.03%
6.50%
GBPEUR
1.34
-0.41%
0.40%
4.39%
4.61%
11.23%
6.10
-2.40%
-2.40%
-3.94%
-3.94%
6.09%
Bonds/Rates
US 10yr
3.2
NCD 3-month
R157
6.15
0.00%
1.65%
-3.00%
-7.17%
-13.26%
2.8
ALBI
505.49
-0.05%
-1.69%
2.70%
5.07%
18.04%
2.6
GOVI
501.11
-0.05%
-1.57%
2.40%
4.73%
17.25%
1.81
-0.55%
3.43%
-8.59%
-16.59%
-32.96%
3
2.4
US 10yr
2.2
2
1.8
1.6
02/01/14 23/03/14 11/06/14 30/08/14 18/11/14
Source: I-Net BFA
Note:
1) Negative (-) indicates currency depreciation; positive (+) indicates currency appreciation.
2) Negative (-) indicates increase in yields (decrease in price); positive (+) indicates decrease in yields
(increase in price).
Companies – Dividends (Bloomberg)
Company
Code
Last Day to Trade
Ex-div
Dividend Type
Dividend Amount
(cps)
Results Due
Company
Range
21%-27%
250cps-335cps
26%-31%
40%-50%
83%-93%
27%-29%
41%-59%
60cps-80cps
(740cps-905cps)
≥70cps
60%-80%
33%-42%
91%-111%
1030.0cps-1138.4cps
8%-11%
≥30%
34.62%-42.31%
≥45%
≥20%
25%-45%
-
06-February-15
09-February-15
10-February-15
10-February-15
10-February-15
11-February-15
12-February-15
12-February-15
12-February-15
16-February-15
16-February-15
16-February-15
17-February-15
17-February-15
17-February-15
18-February-15
20-February-15
20-February-15
23-February-15
23-February-15
25-February-15
26-February-15
27-February-15
27-February-15
03-March-15
03-March-15
04-March-14
05-March-15
09-March-15
09-March-15
16-March-15
19-March-15
March-15
23-April-15
19-May-15
22-May-15
No companies expected to go ex-div this week.
1)
Based on dividend amount including dividend withholding tax of 15% (g=gross).
Companies - Trading Statements (JSE SENS)
Company
Tower Property Fund Limited
Anglo American Platinum Limited
Rockcastle Global Real Estate Company
Fotress Income Fund Limited
Kumba Iron Ore Limited
Group Five Limited
OneLogix Limited
Glencore PLC
Woolworths Holdings Limited
Jasco Electronics Holdings Limited
Italtile
Distribution and Warehousing Network
SilverBridge Holdings Limited
Silverbridge Holdings Limited
Aveng Limited
RCL Foods Limited
Zurich Insurance Company SA Limited
Delta EMD Limited
Nedbank Limited
Hulamin Limited
Murray & Roberts Limited
Impala Platinum Limited
Letshego Holdings Limited
Pan African Resources PLC
Royal Bafokeng Platinum Limited
Torre Industries Limited
Growthpoint Properties Ltd
Standard Bank Group Limited
AVI Limited
Sasol Limited
Clover Industries Limited
Moneyweb Holdings Limited
African Rainbow Minerals Limited
Interwaste Holdings Limited
Clicks Group Limited
PPC Limited
Compagnie Financière Richemont SA
Date
Reporting
Announced
12-January-15
23-January-14
23-January-15
23-January-15
02-February-15
20-November-14
05-February-14
23-January-15
02-February-15
03-February-15
23-January-15
19-November-15
20-October-14
30-January-15
12-January-15
05-February-15
02-February-15
02-February-15
23-January-15
23-December-14
02-February-15
03-December-14
27-January-15
28-January-15
26-January-15
15-January-15
Period
Interim
Final
Interim
Final
Interim
Interim
Interim
Interim
Interim
Interim
Final
Final
Final
Final
Interim
Final
Interim
Final
Interim
Interim
Interim
Interim
Final
Interim
Interim
Final
Headline EPS
Guidance
Direction
increase
decrease
decrease
decrease
decrease
increase
increase
increase
decrease
increase
decrease
increase
increase
increase/decrease
increase
increase
increase
decrease
increase
decrease
-
Contacts
+27 11 375 1000
[email protected]
Disclosures
This publication has been issued by Thebe Stockbroking Ltd for the information of our clients only. The information contained herein has been obtained from
sources which we believe to be reliable, but is not guaranteed for accuracy or otherwise. All opinions expressed and recommendations made are subject to
change. The information contained herein reflects our opinion and recommendations, but does not constitute a solicitation for transactions in any of the
securities mentioned. We accept no responsibility whatsoever arising from actions taken on the basis of this report or any consequence thereof. Readers are
advised that securities of companies have various degrees of risk and volatility. The reader of this research report makes his/her own independent decisions
regarding any securities or financial instruments.

© Copyright 2026