
ธนาคารกรุงไทยKTB TB / KTB.BK
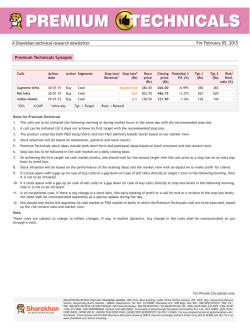
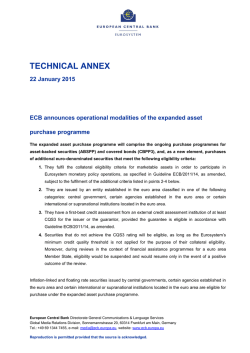
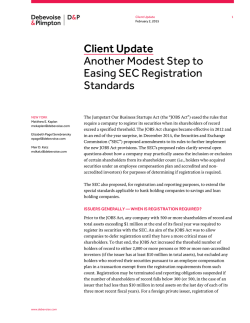
COMPANY UPDATE
ธนาคารกรุงไทย
30 มกราคม 2558
KTB TB / KTB.BK
Sector: Bank Overweight
แนวโน ้มปี 2558 สดใส
้
คาแนะนาพืน
้ ฐาน: ซือ
เป้ าหมายพืน
้ ฐาน : 28.00 บาท
ราคา (29/01/58): 23.00 บาท
Price chart
ประเด็นการลงทุน
เมื่อวานนี้ เราได ้เข ้าร่ วมประชุมนั กวิเคระห์ของ KTB โดยในที่ประชุม
ผู ้บริหารมองว่าแนวโน ้มปี 2558 นั น
้ จะสดใส จากการฟื้ นตัวของเศรษฐกิจ
่ ที่
ซึง่ จากคาแนะนาดังกล่าว ส่งผลให ้เรายังคงประมาณการเติบโตสินเชือ
่ ธุรกิจ SME ขนาดเล็ก
8% สาหรับทัง้ ปี 2558 และปี 2559 หนุนโดยสินเชือ
และสิน เชื่อ รายย่ อ ย เราคาดก าไรปี 2558 ที่ 37 พั น ล ้านบาท (สูง ขึ้น
่ สูงกว่า 8%
11.5% YoY) พร ้อมกันนี้ถ ้าหาก KTB มีการเติบโตสินเชือ
่ ให ้กับดีลควบ
(หนุนโดยโครงการโครงสร ้างพืน
้ ฐานรัฐและการปล่อยสินเชือ
รวมกิจการ) จะมีอพ
ั ไซด์ตอ
่ ประมาณการปี 2558 ของเรา
เป้ าการเติบโตสินเชื่อปี 2558 ทีร
่ ะหว่าง 6-7% หนุ นโดยสินเชือ่
ธุรกิจ SME และรายย่อย
่ ที่ 10.9% YoY สาหรับปี 2557 ซึง่ สูงกว่า
KTB รายงานการเติบโตสินเชือ
ิ เชื่อ
ประมาณการของผู บ
้ ริห ารที่ร ะหว่ า ง 5-7% เนื่ อ งจากมีอุ ป สงค์ส น
จ านวนมากในกลุ่มภาครั ฐและรั ฐวิสาหกิจในไตรมาส 4/57 ธนาคารคาด
่ ปี 2558 จะเติบโต 6-7% หนุนโดยอุปสงค์สน
ิ เชิอ
่ ธุรกิจ SME และ
สินเชือ
รายย่อยเพิม
่ สูงขึน
้ อีกทัง้ ยังตัง้ เป้ าการเติบโตรายได ้ค่าธรรมเนียมที่ 10่ ธุรกิจ SME และรายย่อยมีแนวโน ้ม
12% ให ้สังเกตว่าผู ้บริหารคาดสินเชือ
ิ เชือ
่ บรรษั ทจะเพิ่มสูงขึน
ขยายตัวเป็ นเลขสองหลัก ในขณะทีส
่ น
้ เป็ นเลข
่
หลั กเดียว อย่ างไรก็ ตาม KTB ไม่ ได ้กล่าวถึงรายละเอียดของสินเชือ
สาหรับภาครัฐ/รัฐวิสาหกิจในปี นี้ ดังนั น
้ จะมีอัพไซด์ตอ
่ ประมาณการเติบโต
่ จากสมมติฐานอัตราการเติบโตทางเศรษฐกิจที่ 4.1%
สินเชือ
้ ปี 2558 จะอยูท
สมมติฐานส่วนต่างอต
ั รดาอกเบีย
่ ี่ 2.7% ใกล้เคียง
ก ับปี ทีแ
่ ล้ว
ธนาคารคาดว่าส่วนต่างอั ตราดอกเบี้ยปี 2558 เป็ น 2.7% ทรงตั ว YoY
่ ทีใ่ ห ้ผลตอบแทนสูงมาก
เนื่องจากธนาคารหั นมามุ ้งเน ้นการปล่อยสินเชือ
ิ เชือ
่ ธุรกิจ SME และสินเชือ
่ รายย่อย) เรายังคงประมาณการ
ขึน
้ (ได ้แก่สน
ส่วนต่างอัตราดอกเบีย
้ ที่ 2.76% ทัง้ สาหรับปี 2558 และปี 2559 เนื่องจาก
้ ปี 2558 โดยเราเชือ
่ ว่าอัตรา
ธปท.ยังคงอัตราดอกเบีย
้ คงทีท
่ ี่ 2% จนถึงสิน
ดอกเบีย
้ ขาขึน
้ ในปี 2558 นี้จะสะท ้อนอัพไซด์ต่อส่วนต่างอัตราดอกเบี้ย
และกาไร
้ ูญฯปี 2558 จะลดลง YoY
การตงส
ั้ ารองค่าเผือ
่ หนีส
ถึงแม ้ว่า KTB จะไม่ได ้ให ้รายละเอียดแนวโน ้มการตัง้ สารองค่าเผือ
่ หนี้สญ
ู ฯ
ในปี 2558 แต่ผู ้บริหารคาดว่าจะลดลง เนื่องจากเศรษฐกิจปรับตัวดีขน
ึ้ และ
การตัง้ สารองฯเชิงคุณภาพลดลง ดังนั น
้ เราจะยังคงประมาณการตัง้ สารองฯ
ปี 2558 ไม่เปลีย
่ นแปลงที่ 12.5 พันล ้านบาท ลดลง 8.5% YoY พร ้อมกัน
่ รวมที่ 2.3% ณ
นี้ธนาคารยั งแนะสัดส่วนทีไ่ ม่ก่อให ้เกิดรายได ้ต่อสินเชือ
้ ปี 2558 คงที่ YoY
สิน
Bt
25
23
21
19
17
15
01/14
Price
Rel. to SET
Rel. Idx
150
100
50
0
03/14
05/14
07/14
Share price perf. (%)
Relative to SET
Absolute
09/14
1M
(5.4)
0.4
11/14
01/15
3M
1.2
2.7
12M
9.7
34.5
Key statistics
Market cap
12-mth price range
12-mth avg daily volume
# of shares (m)
Est. free float (%)
Foreign limit (%)
Consensus
rating
%
100
80
60
40
20
0
USD9.8bn
USD29.6m
BLS Target price BLS earnings
vs. Consensus
vs. Consensus
Buy
Bt
29.0
Hold
28.0
83
10
7
Bt321.4bn
Bt16.4/Bt24.5
Bt967m
13,976
44.9
25.0
27.0
Sell
26.0
25.0
1
BLS
Cons.
BLS Cons.
Btm
50000
40000
30000
20000
10000
0
BLS
15E
16E
Financial summary
FY Ended 31 Dec
2013
2014
2015E
2016E
Revenues (Btm)
111,403 118,625 113,922 128,441
Net profit (Btm)
34,511 33,196 37,000 39,000
EPS (Bt)
2.47
2.37
2.65
2.79
EPS grow th (%)
+47.7%
-3.8% +11.5%
+5.4%
Core profit (Btm)
44,262 46,618 48,950 50,950
Core EPS (Bt)
3.17
3.33
3.50
3.64
Core EPS grow th (%) +15.9%
+5.3%
+5.0%
+4.1%
PER (x)
11.3
11.8
10.6
10.0
PABV (x)
1.6
1.4
1.3
1.2
Dividend (Bt)
0.9
1.0
1.1
1.1
Dividend yield (%)
3.8
4.3
4.6
4.9
ROE (%)
17.7
15.1
15.2
14.6
CG rating
คุณสุวัฒน์ บารุงชาติอด
ุ ม
นักวิเคราะห์การลงทุนปั จจัยพืน
้ ฐานด ้านหลักทรัพย์
[email protected]
+66 2 618 1341
See disclaimer at the end of report
Cons.
้
คาดปี 2558 จะมีประสิทธิภาพมากยิง่ ขึน
ผู ้บริหารคาดอัตราผลตอบแทนผู ้ถือหุ ้นปี 2558 อยู่ทป
ี่ ระมาณ 15% (คงที่ YoY) และอัตราส่วน
่ เร็ วขึน
ต ้นทุนต่อรายรั บทีป
่ ระมาณ 45% ซึง่ ถ ้าหากธนาคารสามารถบรรลุการเติบโตสินเชือ
้ และ
รายได ้ค่าธรรมเนียมมากขึน
้ รวมถึงตัง้ สารองค่าเผือ
่ หนี้สญ
ู ฯตา่ กว่าทีเ่ ราประมาณการไว ้ จะส่งผลให ้
มีโอกาสในการปรับเพิม
่ ประมาณการ โครงการโครงสร ้างพืน
้ ฐานของรัฐทีก
่ าลังจะเกิดขึน
้ และการฟื้ น
่ ปรับตัวดีขน
ตัวของการบริโภคในช่วงครึว่ หลังของปี 2558 จะหนุนให ้การปล่อยสินเชือ
ึ้ ให ้สังเกตว่า
เราตัง้ สมมติฐานอัตราผลตอบแทนผู ้ถือหุ ้นปี 2558 ที่ 15.2%
ธนาคารกรุงไทย - 2
KTB : Financial Tables – Year
PROFIT & LOSS (Btm )
Interest income
Interest expense
Net interest incom e
Fee & service income
Total non-interest incom e
Operating income
Operating expenses
Operating profit before provision
Provisioning charges
Operating profit after provision
Exceptional items
Tax
Minority interest
Net profit (loss)
Reported EPS
Fully diluted EPS
Core net profit
Core EPS
PPOP
KEY RATIOS
Revenue Grow th (%)
PPOP Grow th (%)
EPS Grow th (%)
Net Loan Grow th (%)
Cum. LLRs to Net loans (%)
Provision charge to loans (%)
Yield on Average Assets (%)
Cost of Funds (%)
Interest Spread (%)
Net Interest Margin: NIM (%)
Effective tax rate (%)
Asset grow th (%)
BALANCE SHEET (Btm )
Cash & Equivalent
Interbank & securities
Investment in securities
Net Loan & accrued interests
Other assets
Total assets
Deposits
ST debts, REPO & current portion
Long-term debt
Other liabilities
Total liabilities
Paid-up capital
Share premium
Retained earnings
Shareholders equity
Minority interests
Total Liab.&Shareholders' equity
2012
102,245
(43,676)
58,569
17,134
22,976
81,545
(35,343)
46,202
(15,163)
31,039
351.1
(8,024)
0
23,366
1.67
1.67
38,178
2.73
46,202
2013
111,403
(46,921)
64,481
20,293
27,289
91,771
(39,586)
52,185
(12,311)
39,874
2,560.0
(7,923)
0
34,511
2.47
2.47
44,262
3.17
52,185
2014
118,625
(49,323)
69,302
21,150
27,673
96,975
(43,632)
53,343
(13,658)
39,685
235.3
(6,725)
(0)
33,196
2.37
2.37
46,618
3.33
53,343
2015E
113,922
(38,714)
75,209
23,793
30,943
106,152
(48,626)
57,526
(12,500)
45,026
550.0
(8,576)
0
37,000
2.65
2.65
48,950
3.50
57,526
2016E
128,441
(47,030)
81,411
26,281
34,160
115,571
(54,827)
60,744
(12,500)
48,244
550.0
(9,794)
0
39,000
2.79
2.79
50,950
3.64
60,744
23.3
28.9
9.9
6.9
4.1
1.0
4.8
2.1
2.8
2.9
25.6
14.8
10.8
12.9
47.7
11.7
3.8
0.7
4.7
2.0
2.7
2.8
18.7
11.1
5.5
2.2
(3.8)
10.8
3.9
0.7
4.5
1.9
2.6
2.7
16.8
9.3
(1.0)
7.8
11.5
6.6
4.1
0.6
4.0
1.4
2.7
2.8
18.8
5.6
12.2
5.6
5.4
6.7
4.3
0.6
4.3
1.6
2.7
2.8
20.1
8.3
43,705
342,893
301,040
1,480,505
88,349
2,256,492
1,666,961
198,089
146,636
61,956
2,073,642
72,005
1.2
78,739
182,850
0.5
2,256,492
50,690
469,882
241,783
1,653,931
90,547
2,506,833
1,883,781
206,684
133,001
77,276
2,300,742
72,005
20,833.7
106,513
206,090
0
2,506,833
74,588
485,799
262,116
1,832,040
84,808
2,739,351
2,151,641
167,123
104,582
83,851
2,507,198
72,005
20,833.7
126,871
232,153
0
2,739,351
60,000
513,065
282,900
1,953,752
81,936
2,891,653
2,269,982
186,000
123,000
57,500
2,636,482
72,005
20,833.7
149,889
255,171
0
2,891,653
60,000
526,000
380,000
2,083,993
83,060
3,133,053
2,406,180
242,500
140,000
65,001
2,853,681
72,005
20,833.7
174,089
279,371
0
3,133,053
Loan and asset growth
Gross loan growth (%) (LHS)
Asset growth (%) (RHS)
%
20
15
10
5
0
10
11
12
13
14
15E
16E
LDR and loans to deposit+debt
LDR (%)
Loan / (Deposit + Debt)
Loan / (Deposit + Debt - RR)
%
120
110
100
90
80
70
60
10
11
12
13
14
15E
16E
Net interest margin and interest spread
%
NIM (%)
Interest spread (%)
3.0
2.8
2.6
2.4
2.2
2.0
10
11
12
13
14
15E
16E
Loan loss provisioning
Provision charge / Loans (bp)
LLR / Net loans (%)
bp
120
100
80
60
40
20
0
%
5
4
3
2
1
0
10
11
12
13
14
15E 16E
Asset quality
NPLs and reserve against NPLs
Loan loss reserve
Average interest earnings assets
Average interest bearing liabilities
BV per share
ABV per share
NPL amounts
NPL (%)
Equity/loans
Equity/NPLs
60,069
62,829
71,146
80,040
90,044
2,017,465 2,287,113 2,530,495 2,726,534 2,923,853
1,901,855 2,128,538 2,345,007 2,527,840 2,714,581
13.08
12.31
14.74
14.11
16.60
15.60
18.25
17.25
19.98
18.98
60,976
3.74
12.35
299.87
57,927
3.35
12.46
355.78
56,182
2.41
12.67
413.22
53,373
2.26
13.06
478.09
50,704
2.12
13.41
550.98
%
NPL (%) (LHS)
LLR / NPL (%)
6
5
4
3
2
1
0
10
11
12
13
14
%
210
180
150
120
90
60
30
0
15E 16E
Dividend payout
Dividend (Bt)
Payout ratio (%)
Bt/Shr
KEY ASSUMPTIONS (%)
GDP Grow th
Avg Lending Rate/Loan
Avg Funding Cost/Funding Mix
Net Fee Income Grow th
OPEX Grow th
1 Day REPO rate
2012
5.5
6.3
1.8
20.8
6.5
2.8
2013
2.6
6.5
1.8
18.4
12.0
2.3
2014
0.9
6.6
2.0
4.2
10.2
2.0
2015E
4.0
6.8
2.0
12.5
11.4
2.5
2016E
4.4
6.9
2.2
10.5
12.8
2.8
1.0
0.80
0.8
0.6
%
1.12
1.00 1.06
1.2
0.53
0.88
60
50
40
0.62
30
0.4
20
0.2
10
0.0
0
10
11
12
13
14
15E 16E
ธนาคารกรุงไทย - 3
KTB : Financial Tables – Quarter
QUARTERLY PROFIT & LOSS(Btm )
Interest Income
Interest Expense
Net interest income
Fee & service income
Other incom e & MI
Total non-interest income
Operating inc
Operating expenses
Operating profit before provision
Provisioning charges
Operating profit after provision
Exceptional items
Profit before tax
Tax
Minority interest
Net profit (loss)
EPS
Core profit
Core EPS
4Q13
29,858
12,473
17,386
5,324
1,030
6,354
23,740
10,875
12,864
3,110
9,755
3,069
12,824
2,404
0
10,420
0.75
10,460
2.82
1Q14
28,926
12,107
16,820
5,122
1,325
6,448
23,267
11,487
11,780
1,776
10,004
84
10,089
1,791
0
8,297
0.59
11,477
3.82
2Q14
29,388
11,863
17,525
5,308
1,811
7,119
24,644
10,296
14,348
5,365
8,983
179
9,163
1,543
0
7,620
0.55
11,478
4.82
3Q14
29,621
12,132
17,489
5,149
1,724
6,873
24,362
10,314
14,048
2,824
11,224
11
11,235
1,980
0.0000
9,255
0.66
11,479
5.82
4Q14
30,690
13,222
17,468
5,571
1,663
7,234
24,702
11,535
13,167
3,692
9,474
(40)
9,435
1,411
0
8,024
0.57
11,756
5.82
KEY RATIOS
Asset Yield/Avg Assets (%)
Funding Cost (%)
Interest Spread (%)
Net Interest Margin (%)
Fee income/total operating income(%)
BV (Bt)
ROE (%)
ROA (%)
Assets to Equities (X)
Cost to Income (%)
Est CAR (%)
4.9
2.0
2.8
2.9
24.2
14.7
20.6
1.7
12.2
47.9
14.8
4.6
1.9
2.7
2.7
25.2
15.4
15.7
1.3
11.8
52.4
13.3
4.7
1.9
2.8
2.9
26.2
15.2
14.2
1.2
11.7
45.1
13.6
4.7
1.9
2.8
2.9
27.2
16.0
17.0
1.5
11.4
45.6
15.9
4.9
2.3
2.6
2.8
28.2
16.6
14.1
1.2
11.8
50.1
15.7
50,690
448,572
241,783
1,653,931
111,857
2,506,833
1,883,781
200,989
133,001
91,224
2,300,742
71,977
20,833.73
99,312
206,090
0
2,506,833
43,263
398,550
283,555
1,706,847
103,804
2,536,018
1,962,582
270,133
#REF!
91,225
2,320,211
71,977
20,833.73
107,623
215,807
0
2,536,018
44,419
346,150
253,232
1,743,102
101,549
2,488,451
1,867,456
334,845
0
91,226
2,276,167
71,977
20,833.73
102,319
212,284
0
2,488,451
34,999
422,869
262,799
1,731,539
105,122
2,557,329
1,903,139
345,322
0
91,227
2,333,738
71,977
20,833.73
111,667
223,590
0
2,557,329
74,588
485,799
262,116
1,832,040
84,808
2,739,351
2,406,180
167,123
104,582
83,851
2,507,198
72,005
20,833.73
126,871
232,153
0
232,153
4Q13
9.30
73
27
10
14
12.1
1Q14
4.96
72
28
12
9
20.0
2Q14
10.10
71
29
12
2
14.8
3Q14
3.76
72
28
7
2
12.4
4Q14
4.05
71
29
0
5
14.0
QUARTERLY BALANCE SHEET (Btm )
Cash & Equivalent
Interbank & securities
Investment in securities
Net Loan & accrued interests
Other assets
Total assets
Deposits
ST debts, REPO & current portion
Long-term debt
Other liabilities
Total liabilities
Paid-up capital
Share premium
Retained earnings
Shareholders equity
Minority interests
Total Liab.&Shareholders' equity
BANK DATA
Total Income Grow th (%)
NII/Total Income (%)
Non-NII/Total Income (%)
Net Interest Income Grow th (%)
Net Fee Income Grow th (%)
OPEX Grow th (%)
Net loan growth trend
YTD Loan growth (%)
FY Loan growth (%)
%
14
12
10
8
6
4
2
0
2Q13
4Q13
2Q14
4Q14
Privisoining charge (accumulated)
Accum. Provisioning (Bt,m)
% of FY Provision
Bt,m
15,000
75
10,000
7,500
120
100
80
60
40
20
0
100
100
12,500
%
73
52
47
5,000
13
2,500
0
2Q13
4Q13
2Q14
4Q14
Net profit trend (accumulated)
Bt,m
40,000
35,000
30,000
25,000
20,000
15,000
10,000
5,000
0
Accum. Profit (Bt,m)
% of FY Profit
%
100
120
100
80
60
40
20
0
100
76
70
48
44
25
2Q13
4Q13
2Q14
4Q14
Net interest margin
%
FY NIM (%)
NIM (%)
3.0
2.8
2.6
2Q13
4Q13
2Q14
4Q14
Interest spread
FY Interest spread (%)
Interest spread (%)
%
2.85
2.80
2.75
2.70
2.65
2.60
2.55
2.50
2.45
2Q13
4Q13
2Q14
4Q14
Company profile
Krung Thai Bank began operating on March 14, 1966, the result of the merger of the Agricultural Bank Ltd and the Provincial Bank Ltd, with
the Ministry of Finance as its major shareholder. The Vayupak bird, the official seal of the Ministry of Finance, was adopted as the bank’s logo.
The bank ranks second in terms of asset size but ranks first in term of lending size. Presently, the bank has its branch networks of 1,196 offices
nationwide with large ATMs of 8,958.
ธนาคารกรุงไทย - 4
Figure 1: Loan breakdown, YE10 to YE14
Government
Retail
100%
SME
Corporate
11
8
10
30
32
30
20
20
20
35
39
40
40
YE11
YE12
YE13
YE14
19
19
26
26
20
20
35
YE10
80%
60%
40%
20%
0%
Sources: Company data, Bualuang Research estimates
Figure 2 :
NPLs/loans ratio & loan loss cushion, YE06-YE14
NPL ratio (LHS)
%
Expected FY15 NIM at 2.7%
10
3.4 5.9 5.7
5.1
YE14
YE13
End-Sept 13
End-Mar13
YE12
End-Jun 13
FY14
3.8
4Q12
Figure 5 :
Return on equity, FY06-15E
ROE
T1+T2
Tier1
20
15
4Q11
4Q10
4Q09
4Q08
4Q07
4Q06
4Q05
4Q04
4Q03
4Q02
4Q01
4Q00
End-Jun 12
1
4Q99
End-Sept 12
YE11
2
4Q98
End-Mar 12
YE10
YE09
YE08
YE07
3
1997
Tier 2
4
Sources: Company data, Bualuang Research, Bloomberg
Capital adequacy ratio, YE07 to 4Q14
%
5
0
Sources: Company data, Bualuang Research
Figure 4 :
Interest spread, FY97-15E
Loan loss cushion (RHS)
132
140
112115
104
120
96 98
100
71 68 72 74
61
80
45 39 43 49
60
40
9.2 9.5 7.6 6.5 5.3 4.0 3.8 3.5 3.4 3.2 3.0 3.0 2.9 2.6 2.3 20
0
YE06
10
9
8
7
6
5
4
3
2
1
0
Figure 3 :
6.2 4.9 4.8 4.7 4.6
4.7 3.9
17.4
15.7
15.1 15.2
15
12.3 13.1 13.1
12.3
10.7
10
6.5
5
11.4 9.7 10.1 10.0 8.7 10.2 10.0 10.1 10.7 10.2 11.2 11.8
5
Sources: Company data, Bualuang Research
2015E
2014
2013
2012
2011
2010
2009
2008
2007
0
2006
4Q14
3Q14
4Q13
3Q13
2Q13
1Q13
2012
2011
2010
2009
2008
2007
0
Sources: Company data, Bualuang Research
ธนาคารกรุงไทย - 5
Regional Comparisons
Bloomberg
Code
11 HK
2388 HK
DBS SP
UOB SP
MAY MK
CIMB MK
601998 CH
601939 CH
BBRI IJ
BMRI IJ
BBCA IJ
BPI PM
ICICIBC IN
AXSB IN
BAY TB
BBL TB
KBANK TB
KKP TB
KTB TB
SCB TB
TCAP TB
TISCO TB
TMB TB
Hang Seng Bank
BOC Hong Kong
DBS group Holding
UOB
Malayan Bank
CIMB Group Holding Bhd
China Citic Bank
China Construction Bank
Bank Rakyat
Bank Mandiri Tbk PT
Bank Central Asia Tbk PT
Bank of Philippines
ICICI Bank Ltd
Axis Bank Ltd
Bank of Ayudhya
Bangkok Bank
KASIKORNBANK
Kiatnakin Bank
Krung Thai Bank
Siam Commercial Bank
Thanachart Capital
TISCO Financial Group
TMB Bank
Simple average
Price Market Cap
PER (x)
EPS Growth (%)
(US$
equivalent) 2015E 2016E
33,516
15.6
14.0
36,415
11.5
10.5
36,501
12.4
11.4
27,686
11.9
11.3
22,229
12.1
11.5
12,761
11.7
10.5
46,847
7.8
7.2
202,860
6.3
6.0
22,898
10.8
9.5
20,316
13.0
11.3
26,063
19.9
17.4
8,681
21.3
18.1
35,643
16.1
14.5
22,930
19.1
15.5
15,713
28.6
23.4
11,213
8.7
7.6
16,505
10.4
9.3
1,029
9.6
8.9
9,809
8.7
8.2
18,955
10.2
9.3
1,233
7.8
7.1
1,148
7.9
7.3
4,185
13.0
10.9
12.8
11.3
(local curr.)
HKD135.9
HKD26.7
SGD20.0
SGD23.4
MYR8.7
MYR5.5
CNY7.0
CNY5.9
IDR11,700.0
IDR10,975.0
IDR13,325.0
PHP97.5
INR380.3
INR599.5
THB70.00
THB192.50
THB226.00
THB40.00
THB23.00
THB183.00
THB33.50
THB47.00
THB3.14
PER band versus SD (next 12 months)
2015E
47.2
79.6
9.0
7.3
-5.4
-22.0
7.6
7.9
10.8
8.4
16.0
-9.9
23.1
16.9
4.9
15.6
12.7
32.8
11.5
14.4
7.4
11.8
10.1
13.8
PBV (x)
ROE (%)
2016E 2015E 2016E 2015E 2016E 2015E 2016E
12.5
2.3
2.1
15.0
15.7
4.0
4.0
11.6
1.6
1.5
14.7
15.1
4.2
4.5
7.0
1.3
1.2
11.3
11.3
3.0
3.2
4.9
1.4
1.3
12.1
11.6
3.2
3.4
5.6
1.6
1.5
13.4
13.1
5.9
6.2
11.3
1.2
1.2
11.5
11.3
3.6
4.0
8.6
1.3
1.1
17.1
16.5
3.4
3.7
5.2
1.2
1.1
19.9
18.5
5.4
5.6
13.5
2.5
2.1
24.9
23.9
2.5
2.7
15.2
2.5
2.2
20.7
20.5
2.2
2.4
14.0
4.3
3.6
23.4
22.3
1.1
1.3
15.1
2.7
2.5
14.5
14.5
1.7
1.8
11.0
n.a.
n.a.
16.2
16.3
1.4
1.6
21.0
3.2
2.7
18.3
19.8
0.8
0.9
22.2
2.6
2.4
9.2
10.4
1.4
1.7
15.7
1.1
1.0
12.5
13.4
4.7
5.2
11.0
1.7
1.5
19.0
18.4
2.0
2.4
8.6
0.9
0.8
9.3
9.5
5.0
5.5
5.4
1.3
1.2
15.2
14.6
4.6
4.9
9.8
1.9
1.7
20.1
19.6
3.8
4.4
9.1
0.8
0.7
9.7
9.6
4.8
5.2
8.4
1.3
1.2
16.4
16.2
4.7
5.1
19.0
1.8
1.6
13.6
14.4
2.3
2.7
11.6
1.8
1.6
15.6
15.5
3.3
3.6
PBV band versus SD (next 12 months)
x
x
20
2.6
+2.5 SD = 17.17x
16
+1.5 SD = 14.05x
+0.75 SD = 11.72x
12
+3.0 SD = 2.09x
2.1
+2.0 SD = 1.79x
1.6
+1.0 SD = 1.49x
LT-average = 9.38x
8
-1.0 SD = 6.26x
1.1
4
-2.0 SD = 3.15x
0.6
0
YE01
YE03
YE05
YE07
Div Yield (%)
YE09
YE11
YE13
YE15
PER band and share price
LT-average = 1.19x
-1.0 SD = 0.89x
-2.0 SD = 0.58x
0.1
YE01
YE03
YE05
YE07
YE09
YE11
YE13
YE15
PBV band and share price
Bt/share
40
1
15x
40
1 2.1x
35
35
13x
30
11x
25
9x
1.8x
30
1.5x
25
20
1.2x
15
0.9x
10
10
0.6x
5
5
20
7x
15
0
YE03
YE05
YE07
YE09
YE11
YE13
YE15
Foreign holding
%
KTB
Bank
40
22.6
20
0
9/14
YE03
YE05
YE07
YE09
YE11
YE13
YE15
Short selling activities during past four weeks
60
8/14
YE01
10/14
11/14
12/14
1/15
Btm
60
50
40
30
20
10
0
24/12/14
26/12/14
28/12/14
30/12/14
1/1/15
3/1/15
5/1/15
7/1/15
9/1/15
11/1/15
13/1/15
15/1/15
17/1/15
19/1/15
21/1/15
23/1/15
25/1/15
27/1/15
29/1/15
0
YE01
5x
ธนาคารกรุงไทย - 6
Bualuang Securities Public Company Limited
DISCLAIMER
BUALUANG SECURITIES PUBLIC COMPANY LIMITED (BLS) is a subsidiary of BANGKOK BANK PUBLIC COMPANY LIMITED (BBL). This document
is produced based upon sources believed to be reliable but their accuracy, completeness or correctness is not guaranteed. The statements or
expressions of opinion herein were arrived at after due and careful consideration to use as information for investment. Expressions of opinion contained
herein are subject to change without notice. This document is not, and should not be construed as, an offer or the solicitation of an offer to buy or sell
any securities. The use of any information shall be at the sole discretion and risk of the user.
BUALUANG SECURITIES PUBLIC COMPANY LIMITED MAY BE IN RELATIONSHIP WITH THE SECURITIES IN THIS REPORT. “Opinions,
projections and other information contained in this report are based upon sources believed to be accurate including the draft prospectus, but no
responsibility is accepted for any loss occasioned by reliance placed upon the contents hereof. Bualuang Securities Public Company Limited may from
time to time perform investment, advisory or other services for companies mentioned in this report, as well as dealing (as principal or otherwise) in, or
otherwise being interested in, any securities mentioned herein, This report does not constitute a solicitation to buy or sell any securities”. Investors
should carefully read details in the prospectus before making investment decision.
BUALUANG SECURITIES PUBLIC COMPANY LIMITED MAY ACT AS MARKET MAKER AND ISSUER OF DWs, AND ISSUER OF STRUCTURED
NOTES ON THESE SECURITIES. The company may prepare the research reports on those underlying securities. Investors should carefully read the
details of the derivative warrants and structured notes in the prospectus before making investment decisions.
BUALUANG SECURITIES PUBLIC COMPANY LIMITED IS OR MAY BE A UNDERWRITER/CO-UNDERWRITER/JOINT LEAD IN RESPECT OF THE
INITIAL PUBLIC OFFERING (“IPO”) OF SECURITIES.
Lead underwriter/
Underwriter/
Co-underwriter
Financial Advisor
PLANB
PLANB
Score Range
Score Range
Description
90 – 100
Excellent
80 – 89
Very Good
70 – 79
Good
60 – 69
Satisfactory
50 – 59
Below 50
Pass
No logo given
N/A
CORPORATE GOVERMANCE REPORT DISCLAIMER
This research report was prepared by Bualuang Securities Public Company Limited and refers to research prepared by Morgan Stanley. Morgan Stanley
does not warrant or guarantee the accuracy or completeness of its research reports. Morgan Stanley reserves copyright and other proprietary rights in
the material reproduced in this report. Morgan Stanley is under no obligation to inform Bualuang Securities or you if the views or information referred to
or reproduced in this research report change.
Corporate Governance Report disclaimer
The disclosure of the survey result of the Thai Institute of Directors Association (“IOD”) regarding corporate governance is made pursuant to the policy
of the Office of the Securities and Exchange Commission. The survey of the IOD is based on the information of a company listed on the Stock
Exchange of Thailand and the Market for Alternative Investment disclosed to the public and able to be accessed by a general public investor. The
result, therefore, is from the perspective of a third party. It is not an evaluation of operation and is not base on inside information.
The survey result is as of the date appearing in the Corporate Governance Report of Thai Listed Companies. As a result, the survey result may be
changed after that date. Bualuang Securities Public Company Limited does not conform nor certify the accuracy of such survey result.
BUALUANG RESEARCH – RECOMMENDATION FRAMEWORK
STOCK RECOMMENDATIONS
SECTOR RECOMMENDATIONS
BUY: Expected positive total returns of 15% or more over the next 12
months.
HOLD: Expected total returns of between -15% and +15% over the next 12
months.
SELL: Expected negative total returns of 15% or more over the next 12
months.
TRADING BUY: Expected positive total returns of 15% or more over the next
3 months.
OVERWEIGHT: The industry, as defined by the analyst's coverage universe, is
expected to outperform the relevant primary market index over the next 12 months.
NEUTRAL: The industry, as defined by the analyst's coverage universe, is
expected to perform in line with the relevant primary market index over the next 12
months.
UNDERWEIGHT: The industry, as defined by the analyst's coverage universe, is
expected to underperform the relevant primary market index over the next 12
months.
ธนาคารกรุงไทย - 7
© Copyright 2026