
Nitrogen sorption as a tool for the characterisation of
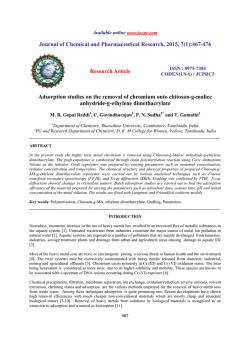
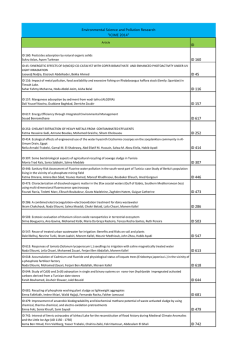
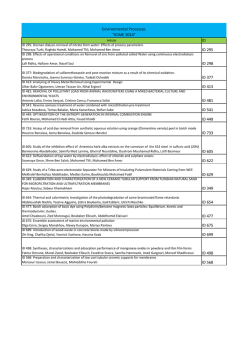
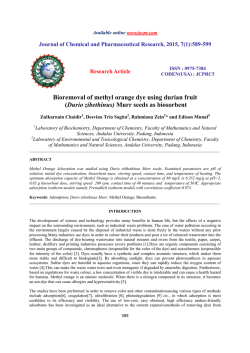
Open Archive Toulouse Archive Ouverte (OATAO)
OATAO is an open access repository that collects the work of Toulouse researchers
and makes it freely available over the web where possible.
This is an author-deposited version published in: http://oatao.univ-toulouse.fr/
Eprints ID: 5571
To link to this article: DOI: 10.1016/j.carbpol.2011.01.040
URL: http://dx.doi.org/10.1016/j.carbpol.2011.01.040
To cite this version:
Robitzer, M. and Tourette, A. and Horga, R. and Valentin, R. and
Boissière, M. and Devoisselle, J. M. and Di Renzo, F. and Quignard, F.
Nitrogen sorption as a tool for the characterisation of polysaccharide
aerogels. (2011) Carbohydrate Polymers, vol. 85 (n° 1). pp. 44-53. ISSN
0144-8617
Any correspondence concerning this service should be sent to the repository
administrator: [email protected]
Nitrogen sorption as a tool for the characterisation of polysaccharide aerogels
M. Robitzer, A. Tourrette 1 , R. Horga, R. Valentin 2 , M. Boissière 3 , J.M. Devoisselle, F. Di Renzo ∗ ,
F. Quignard
Institut Charles Gerhardt Montpellier, UMR 5253 CNRS-UM2-ENSCM-UM1, Matériaux Avancés pour la Catalyse et la Santé, ENSCM, 8 rue Ecole Normale, 34296 Montpellier Cedex 5,
France
Keywords:
Aerogel
Supercritical drying
Comparison plots
Surface polarity
Adsorption enthalpy
Physisorption
Polysaccharides
Alginate
Chitosan
Chitin
Agar
Carrageenan
a b s t r a c t
Supercritically dried aerogels of several polysaccharides (chitin, chitosan, alginate, alginic acid, kcarrageenan, and agar) have been characterised by physisorption of N2 . Surface areas as high as 570 m2 g−1
have been measured. The nature of the functional groups of the polysaccharide significantly influences
the adsorption of N2 on the surface of the aerogel. The net enthalpy of adsorption increases with the
polarity of the surface groups of the polymer, in the order chitin < agar ≤ chitosan < carrageenan < alginic
acid ∼ alginate. The surface area and the mesopore distribution of the aerogels depend both on the dispersion of the parent hydrogel and on the behaviour of each polymer in the drying treatment. Aerogels
which retain the dispersion of the parent hydrogel are mainly macroporous (pores larger than 50 nm)
while materials liable to shrink upon solvent exchange form mesoporous structures.
1. Introduction
The surface properties of biological materials are at the basis
of phenomena like cell adhesion, formation of bacterial films,
and recognition between biological units. Surface polarity is a
major parameter in controlling the adhesion of cells and bacteria
(Absolom et al., 1983; Li & Logan, 2004; van Loosdrecht, Lyklema,
Norde, & Zehnder, 1989), a relevant phenomenon in fields as different as safety of surgical devices, colonisation of biomaterials
(Elbert & Hubbell, 1996; Tirrell, Kokkoli, & Biesalski, 2002), sensitivity of biological sensors (Chu, Hsu, Soma, & Lo, 2009; Disney, Zheng,
Swager, & Seeberger, 2004), membrane fouling (Miura, Watanabe,
& Okabe, 2007), and effectiveness of water and sewage treat-
∗ Corresponding author. Tel.: +33 607508148; fax: +33 467163470.
E-mail address: [email protected] (F. Di Renzo).
1
Present address: CIRIMAT-ENSIACET, 4 allée Emile Monso, BP 44362, 31342
Toulouse, France.
2
Present address: Laboratoire Chimie Agro-Industrielle, UMR 1010 CNRS-INRAENSIACET, Université de Toulouse, 118 Route de Narbonne, 31077 Toulouse Cedex
4, France.
3
Present address: Laboratoire Physicochimie des Polymères et des Interfaces,
Université de Cergy-Pontoise, 5 mail Gay-Lussac, 95031 Neuville-sur-Oise, France.
doi:10.1016/j.carbpol.2011.01.040
ments (Dhoot & Wheatley, 2003; Liu, Yang, & Li, 2007; Simoni,
Bosma, Harms, & Zehnder, 2000; Tufenkji, Dixon, Considine, &
Drummond, 2006). Biological recognition phenomena previously
only attributed to molecular lock-and-key interactions have been
acknowledged to be largely dependent on the adhesion of extended
structures (Cherstvy, Kolomeisky, & Kornyshev, 2008; Leckband,
2001; Mammen, Choi, & Whitesides, 1998). Polysaccharides represent an important component of bacterial capsules and they
play an important role in cell adhesion (Aronson et al., 1979; Lee
et al., 2006; Sadamoto et al., 2004; Schengrund, 2003; Sharon &
Ofek, 2000; Sugita-Konishi et al., 2002). Extracellular polysaccharides usually present complex structures and are seldom available
in amounts large enough to allow physical characterisation by
macroscopic tools. Model systems available in large amount in high
surface area formulations can represent a useful model to study the
surface energetics of complex polysaccharides. Aerogel formulations of gelling polysaccharides could allow the characterisation of
surface polarities by physisorption methods largely used in materials chemistry.
Gelling polysaccharides are natural polyelectrolytes with a high
concentration of hydrophilic functional groups (Dumitriu, 1998;
Stephen, Phillips, & Williams, 2006). For instance, chitosan, the
deacetylated form of chitin, the second most diffused natural
Fig. 1. Repeating modules of gelling polysaccharides.
polysaccharide after cellulose, presents up to 5.8 mmol amino
groups per gram of polymer (Roberts, 1992); alginic acid, a polysaccharide extracted from brown seaweeds, presents up to 5.6 mmol
carboxylic groups per gram of polymer; k-carrageenan, another
seaweed-extracted polysaccharide, presents up to 2.8 mmol sulphate groups per gram of polymer (see Fig. 1 for a representation of
some monomers). In usual hydrogel formulations, most functional
groups interact with an aqueous solution. Polysaccharide hydrogels are able to store up to one hundred times their weight of water,
trapped in a network of hydrophilic fibrils. This property accounts
for their natural occurrence as water reservoirs in plants (Percival
& McDowell, 1967; Walter, 1998) and their application as thickening agents in the food industry (Pilnik & Rombouts, 1985) and drug
carriers or tissue healing agents in the pharmaceutical and personal care industries (Dhoot & Wheatley, 2003; Drury & Mooney,
2003; Peppas, Hilt, Khademhosseini, & Langer, 2006; Ravi Kumar,
Muzzarelli, Sashiwa, & Domb, 2004).
The dispersion of the polysaccharides in the hydrogel is at
the basis of their application as supports for enzymatic catalysis in aqueous phase (Dumitriu & Chornet, 1998; Liu, Becker, &
Neufeld, 2005). The accessibility of their functional groups renders
them effective ion exchangers and complexing agents for remediation (Chassary, Vincent, & Guibal, 2004; Jaafari, Elmaleh, Coma, &
Benkhouja, 2001; Laus, Geremias, Vasconcelos, Laranjeira, & Fávere,
2007). The application of these materials as heterogeneous catalysts in the gas phase has been hampered by the shrinkage of the
hydrogels during drying (Guibal, 2005; Guibal, Vincent, & PeiranoBlondet, 2007; Vincent & Guibal, 2004). In evaporative drying
processes, the tension of the meniscus at the solvent–vapour interface draws together the colloidal units of the gel and brings to the
formation of xerogels with minimal surface area (Di Renzo et al.,
2005; Valentin, Bonelli, Garrone, Di Renzo, & Quignard, 2007).
Alternative drying methods have been tested to retain in the dry
state the dispersion of the parent hydrocolloids. Cryogels obtained
by freeze-drying retain the volume of the parent hydrogel but the
fine structure of samples thicker than a few micrometers is disrupted by the growth of ice crystals inside the material (Casson &
Emery, 1987; Hills et al., 2000). Fast-freezing and pressure-freezing
have allowed to extend the field of application of cryopreservation
to samples of thickness up to one hundred microns but significant structural damages have been observed for larger specimens
(Serp, Mueller, von Stockar, & Marison, 2002a). Drying by evaporation of solvents with low surface tension has allowed to retain
most of the dispersion of polysaccharide gels (White, Budarin, &
Clark, 2008). The best structure preservation results have been
obtained by CO2 supercritical drying, a technique currently used to
preserve the fine structure of gels as different as silica-based adsorbents, insulation materials, optical fibers, polymer membranes or
carbon precursors (Cardea et al., 2009; Pekala, 1989; Pierre &
Pajonk, 2002). Supercritically dried polysaccharide aerogels can
present porosities as high as 98% (Partap, Rehman, Jones, & Darr,
2006; Quignard, Valentin, & Di Renzo, 2008; Valentin et al., 2006).
The formation of aerogels has allowed to characterise the textural properties of the polysaccharide gels by classical physisorption
techniques (Valentin, Molvinger, Quignard, & Di Renzo, 2005;
Valentin, Molvinger, Viton, Domard, & Quignard, 2005). Surface
areas as high as 570 m2 g−1 in the case of alginate and 845 m2 g−1 in
the case of cross-linked chitosan have been reported (Chang, Chen,
& Jiao, 2008; Quignard et al., 2008). Such values of surface area correspond to a significant dispersion of the materials. In the case of
a Ca-alginate aerogel, a surface area of 570 m2 g−1 corresponds to
isolated fibrils of average diameter 4 nm, as calculated further in
this article.
The surface properties of polysaccharide aerogels have been a
quite neglected research subject, despite their obvious interest for
heterogeneous catalysis and as models of biological systems. The IR
monitoring of the chemisorption of probe molecules like ammonia
or deuterated water (Valentin et al., 2006, 2007) has shown that
small reactive molecules penetrate at a significant extent inside
the polysaccharide fibrils and react with most functional groups
of the polymer. The adsorption of less reactive molecules at lower
temperature can bring a different kind of information. The purpose
of this contribution is to study the aerogels of several polysaccharides by classical volumetric techniques in order to find information
about their morphology and the energetics of physisorption at their
surface.
2. Experimental
2.1. Preparation of the samples
2.1.1. Agar beads
A 2% (w/w) agar solution (agarose-D5 Hispanagar) was rapidly
heated at the boiling point in a microwave oven. The polymer solution was transferred to a syringe thermostated at 50 ◦ C and added
dropwise to a cooled water bath.
2.1.2. Alginate beads
Several Na-alginate with different guluronic content were used
and defined as G-X, where X is the percent of guluronic groups: G20 Protanal FMC Biopolymer, G-35 Sigma–Aldrich, G-45 Cecalgum
S500 Sanofi, and G-76 Satialgine SG 800 Systems Bio-Industries.
Sodium alginate was dissolved in distilled water at a concentration
of 2% (w/w). The polymer solution was added dropwise at room
temperature to a stirred MCl2 (Aldrich, M being Ca2+ , Ba2+ , Co2+
or Cu2+ ) solution (0.24 mol L−1 ) or a HCl solution (1 mol L−1 ) using
a syringe with a 0.8 mm diameter needle. The microspheres were
cured in the gelation solution for 15 h.
2.1.3. Carrageenan beads
A 2.5% (w/w) k-carrageenan stock solution was prepared by dispersing k-carrageenan (eucheuma cottonii Sigma 90%) in ultrapure
water at 80 ◦ C for 30 min. The 2.5% stock solution of k-carrageenan
thermostated at 80 ◦ C was dropped into a 0.6 M KCl solution at 5 ◦ C
under stirring using a syringe with a 0.8 mm diameter needle. The
gel beads were aged for 12 h in this solution at 5 ◦ C without stirring
and hence washed with cold water (Sipahigil & Dortunc, 2001).
2.1.4. Squid-pen chitosan beads
An aqueous solution of chitosan from b-chitin (Mahtani
Chitosan PVT, degree of acetylation lower than 5%, as measured by NMR spectroscopy, weight-average molecular weight
Mw = 200 000 g mol−1 , measured by light scattering) was obtained
by dissolving 1 g of chitosan in 100 mL of a solution of acetic acid
0.055 mol L−1 . This solution was dropped into a NaOH solution
(4 mol L−1 ) through a 0.8 mm syringe needle. The beads of chitosan from b-chitin, shorthanded hare as b-chitosan, were stored
in the alkaline solution for 2 h, and then filtered and washed with
water.
2.1.5. Crab-shell chitosan beads
A 2.5% aqueous solution of purified chitosan from a-chitin
(Aldrich, degree of acetylation of 10% as measured by IR spectroscopy, Mw = 700 000 g mol−1 determined by viscosimetry) was
formed by stirring 2 h at room temperature using with the stoichiometric amount of acetic acid with respect to the amount of
NH2 functions. Gelation was obtained by dropping the chitosan
solution into a 4 mol L−1 NaOH solution through a 0.8 mm gauge
syringe needle. The beads of chitosan from a-chitin were left in the
alkaline solution for 2 h, filtered and washed with demineralised
water.
2.1.6. Chitin gel
b-Chitin was obtained by complete reacetylation of squid-pen
chitosan according to a published procedure (Vachoud, Zydowicz,
& Domard, 1997). An aqueous acetic acid (0.5%, w/w) solution of
chitosan (1%, w/w) (100 g) was mixed with ethanol (50 mL) and the
mixture was left to stand overnight for degassing without stirring.
A freshly prepared acetylating solution (6.85 mL ethanol, 0.65 mL
acetic anhydride) was slowly added to 20 g of the aqueous alcoholic
chitosan solution. The mixture was then stirred for 30 s and transferred to a cylindrical mould. The gel was aged 4 h, and washed
twice with ethanol.
2.2. Supercritical drying
To obtain aerogels, the hydrogels were dehydrated by immersion in a series of successive ethanol–water baths of increasing
alcohol concentration (10, 30, 50, 70, 90, and 100%) for 15 min
each (Martinsen, Storrø, & Skjåk-Bræk, 1992). Finally, ethanol was
replaced by liquid CO2 and the microspheres were dried under
supercritical CO2 conditions (74 bars, 31.5 ◦ C) in a Polaron 3100
apparatus. In the case of chitin, the ethanol-washed gel was directly
dried under supercritical CO2 conditions.
2.3. Volumetric experiments
Adsorption–desorption isotherms of nitrogen at 77 K and argon
at 77 and 89 K were registered on a Micromeritics Asap 2010 volumetric apparatus by admitting doses of N2 in a measurement cell.
The aerogel samples were previously outgassed in situ at 323 K
until a 0.4 Pa stable static vacuum was reached. Surface area and
energetical parameter C(BET) were evaluated by the BET method
(Rouquerol, Rouquerol, & Sing, 1999). The net molar energy of
adsorption 1E = Eads − EL , where Eads is the molar adsorption energy
of N2 on the surface and EL is the liquefaction energy of bulk N2
(5.6 kJ mol−1 ), was calculated as 1E = RT ln C(BET). A molecular area
0.162 nm2 for an adsorbed molecule of N2 was assumed in the
calculation of the surface area.
The surface area can provide information on the average diameter D of the fibrils, assumed as cylindrical, by the formula
D = 4000 A−1 −1 , where D is the diameter in nm, A the surface area in m2 g−1 , and the volumic mass in g cm−3 . In the
case of polysaccharides, this evaluation is a crude approximation due to difficulties in determining the correct bulk density of
the fibrils. Most literature values deal with the density of crystallized polymers, likely slightly higher than the bulk density of
the fibril material. These literature values can be accepted as a
first approximation and are 1.15 g cm−3 for agar (Foord & Atkins,
1989), 1.48 for k-carrageenan (Millane, Chandrasekaran, Arnott,
& Dea, 1988), 1.42 for b-chitin (Neville, Parry, & WoodheadGalloway, 1976), and 1.67 for chitosan (Okuyama, Noguchi,
Miyazawa, Yui, & Ogawa, 1997). In the case of alginate, the
literature density of crystalline guluronic acid (1.62 g cm−3 ) and Caguluronate (1.79 g cm−3 ) (Atkins, Nieduszyznski, Mackie, Parker,
& Smolko, 1973; Mackie, Perez, Rizzo, Taravel, & Vignon, 1983)
have been used, as guluronate is the only type of block copolymer of ionotropic alginate for which crystallographic data are
available.
The agreement with the layer-by-layer mechanism of adsorption was evaluated by the ˛S method (Gregg & Sing, 1982). A
composite reference silica isotherm was used, based on adsorption
data for fumed silica Aerosil 200 for ˛S < 0.30 and LiChrospher Si1000 precipitated silica (Jaroniec, Kruk, & Olivier, 1999) for higher
values. Mesopore size was evaluated from the desorption branch
of the isotherm by the DFT method, proved more reliable than
the widely used BJH method (Galarneau, Desplantier, Dutartre,
& Di Renzo, 1999; Neimark & Ravikovitch, 2001). The cylindrical model of mesopore geometry is used for sake of comparison,
due to the lack of suitable models to describe the correlation
between capillary condensation pressure and geometry in an open
network of rods. The total porosity, including macroporosity and
mesoporosity, was evaluated from the volume/mass ratio of the
aerogel.
3. Results
3.1. Texture of the aerogels
The N2 adsorption isotherms for some typical polysaccharide
aerogels are reported in Fig. 2. The low-pressure adsorption step
allows to evaluate the volume of an adsorbed monolayer, from
which the surface area of the sample is calculated. The surface
areas for several typical polysaccharide aerogels are reported in
Table 1.
N2 physisorption isotherms provide information on the area
of the surface but do not provide inequivocal information on the
Fig. 2. N2 adsorption isotherms at 77 K on aerogels of (filled circles) Ca-alginate,
(void lozenges) agar and (void squares) k-carrageenan. Isotherms are shifted by
200 cm3 g−1 .
shape of the surface. A better understanding of the texture of the
solids can be obtained by coupling physisorption data with other
techniques of characterisation, like scanning electron microscopy.
A micrograph of the cross-section of a typical Ca-alginate aerogel
is reported in Fig. 3a and shows an open framework of isolated fibrils with a diameter 5–8 nm and an average length near 200 nm.
Bundles of three or four fibrils are a rare occurrence. The most frequent contact between fibrils is at nodes connecting the ends of
three fibrils. This kind of branching suggests that the fibrils have
been formed as a network and the aerogel is not the result of
the random aggregation of independently formed fibrils. A texture characterised by an open network of fibrils is representative
of most freeze-dried or supercritically dried gels of polysaccharides and other semi-crystalline polymers (Daniel et al., 2005;
Kanzawa, Koreeda, Harada, & Harada, 1989; Kanzawa, Koreeda,
Harada, Okuyama, & Harada, 1990; Quignard et al., 2008; Serp, et al.,
2002a; Serp, Mueller, von Stockar, & Marison, 2002b; Valentin,
Molvinger, Quignard, & Di Renzo, 2005). This kind of texture is also
well known in biological media, for instance for polysaccharide capsules around yeasts and bacteria (Bayer, 1990; Kopecká, Phaff, &
Fleet, 1974).
The fibrillar texture of the solid justifies the use of a simplified
cylindrical model to evaluate the size of the fibrils from the surface area measured by N2 adsorption. The calculated diameters for
cylindrical rods with a surface area equivalent to the polysaccharide micelles are reported in Table 1 and vary from 3 to 4 nm for
the aerogels of the highest surface area to 16 nm for the aerogel
with the lowest surface area. This domain of fibril size is in good
agreement with the results of other techniques, like AFM of supported gels (Decho, 1999; Maurstad, Danielsen, & Stokke, 2003;
Sletmoen, Maurstad, Sikorski, Smestad Paulsen, & Stokke, 2003) or
SAXS (Robitzer, David, Rochas, Di Renzo, & Quignard, 2008).
The shape of the N2 physisorption isotherms provides information on the porosity of the system, albeit not all porosity can be
detected by this technique. For instance, most cavities of the network of fibrils of Fig. 3a are larger than 100 nm. Such cavities are
too wide to be detected by N2 adsorption methods, which are limited to the analysis of mesopores, viz. pores with size between 2
and 50 nm (Sing et al., 1985). The porosity data reported in Table 1
confirm that mesoporosity is only a small fraction of the total porosity of the aerogel (excepted for carrageenan). For most aerogels,
mesopores are representative of the relatively unfrequent zones of
contact between fibrils.
Mesopore size distributions for several polysaccharide aerogels
are reported in Fig. 4. Mesopore size is quite characteristic for the
aerogels of each type of polysaccharide and can be correlated to
parts of the solid in which the distance between secondary units is
Table 1
Typical textural data for polysaccharide aerogels.
Aerogel
Surface area
(m2 g−1 )
k-Carrageenan
Agar
Chitosan from a-chitin
Chitosan from b-chitin
b-Chitin
Alginic acid
Ca-alginate
200
320
330
150
560
390
570
a
Fibril diameter
(nm)
11
11
7
16
5
6
4
Average
mesopore size
(nm)
Mesopore
volume
(cm3 g−1 )
Total porosity
(cm3 g−1 )
% Volume
shrinkage upon
drying
18
36
12
25
20
20
37
0.96
0.23
0.57
0.18
1.24
0.89
1.16
1
7
15
19
16
38
39
95
92
60
51
76a
22
20
Drying shrinkage measured from the alcohol-exchanged form.
Fig. 3. Scanning electron micrographs of cross-sections of (a) Ca-alginate and (b) k-carrageenan aerogels.
Fig. 4. Pore size distributions for aerogels of k-carrageenan (void squares), Ca-alginate (filled circles), alginic acid (void circles), agar (void lozenges), b-chitin (void triangles),
chitosan from a-chitin (filled squares) and chitosan from b-chitin (filled triangles).
smaller than about 50 nm. The scanning electron micrograph of an
alginate gel reported in Fig. 3a shows area of different density in
the distribution of the fibrils. This heterogeneity is reflected in the
mesopore size distribution of the aerogels of alginate or alginic acid
reported in Fig. 4. Such very broad mesopore size distributions, with
no solution of continuity with the domain of macropores (pores
larger than 50 nm) are clearly related to heterogeneities in the gel
density.
A very different pattern is followed by k-carrageenan, a rare
instance of polysaccharide gel which undergoes severe shrinkage upon the supercritical drying procedure (Boissière, Tourrette,
Devoisselle, Di Renzo, & Quignard, 2006). A micrograph of the crosssection of this collapsed gel is shown in Fig. 3b. The solid has a
much more compact aspect than the alginate aerogel of Fig. 3a. A
residual shrunk fibrillar structure is still present, with visible cavities between 10 and 30 nm. The porosity data reported in Tab. 1
indicate that mesoporosity represents the total porosity. The distribution of pore size shown in Fig. 4 is quite narrow and centred
around 18 nm, indicating that the shrinkage of the gel has formed
a uniformly tight network of secondary units.
Another pattern of porosity is observed for agar aerogels, in
which a negligible amount of mesoporosity is observed. This
suggests that, despite the significant shrinkage underwent by
the gel in the drying process, the secondary units of the polymer are uniformly separated at distances higher than the upper
limit detectable by nitrogen adsorption. A similar pattern is also
observed in the aerogels of chitosan formed by deacetylation of
b-chitin. It is interesting to observe that the origin of the chitosan significantly affects the physisorption pattern of the aerogel.
Chitosan formed by deacetylation of a-chitin presents a quite narrow distribution of mesopore size and a mesopore volume which
represents only a small fraction of the total porosity. It is tempting to correlate the adsorption pattern of the aerogels to the
properties of the parent gels. Polymer threads of partially deacetylated chitosan from b-chitin are well isolated in solution, while
chitosan from a-chitin presents both isolated chains and more
organized parts which retain some structure of the parent a-chitin
(Lamarque, Viton, & Domard, 2004). It is possible to correlate the
non-mesoporous part of the chitosan aerogels with a uniform gel
formed from the isolated polymer chains presents in both kinds of
chitosan, whereas the mesoporous parts of the aerogel of chitosan
from a-chitin could correspond to cavities related to a residual
chitin-like organisation. Indeed, chitin aerogel presents a significant mesoporosity well-separated from macroporosity, with a
quite broad distribution of mesopore size.
3.2. Surface properties of the polymers
Comparison plots are widely used to identify the adsorption
mechanisms, especially to differentiate layer-by-layer adsorption
on a surface from condensation in micropores or mesopores
(Lippens & de Boer, 1965). In a comparison plot, the amount
adsorbed on the sample at a given pressure is plotted against the
amount adsorbed at the same pressure on a reference non-porous
adsorbent. In such a graph, a linear correlation between the amount
adsorbed on the sample under investigation and the reference
adsorbent indicates that the adsorption takes place by the same
mechanism on the two surfaces. The slope of the plot corresponds
to the ratio between the surface areas of the two adsorbents. The ˛S
plot is a comparison plot in which the abscissa are normalised on
the amount adsorbed on the reference isotherm at p/p0 = 0.4 (Gregg
& Sing, 1982).
The ˛S plots for several alginate, alginic acid and k-carrageenan
aerogels are reported in Fig. 5. The slopes of the plots largely differ, corresponding to surface areas spanning from 130 m2 g−1 for a
k-carrageenan aerogel to 680 m2 g−1 for a copper alginate aerogel.
The difference in surface area depends both on the preparation of
the parent hydrogel and on the effectiveness of the supercritical
drying procedure. Despite their different slopes, all plots present a
common feature: their extrapolation crosses the volume axis at a
Fig. 5. Comparison plots of the adsorption of N2 at 77 K on (filled circles) ionotropic
alginate, (void circles) alginic acid, and (void squares) carrageenan aerogels. The
lines represent best-fit linear correlations.
Fig. 6. Comparison plots of the adsorption of N2 at 77 K on (filled triangles) chitosan
and (void triangles) chitin aerogels. The lines represent best-fit linear correlations.
positive value (the volume values are given as volume of adsorbed
gas at standard temperature and pressure, STP). The positive intercept corresponds to a larger-than-expected adsorbed volume at
low pressure, which corresponds to a more energetic adsorption than on the reference silica adsorbent. The higher adsorption
enthalpy can depend either on the texture or the composition of the
surface. In the first case, a molecule is surrounded by the surface
of a micropore and interacts with a larger number of surface sites.
In the second case, the presence of strong adsorption sites justifies
the higher adsorption at low pressure.
The ˛S plots for several chitosan and chitin aerogels are reported
in Fig. 6. The slope of the plots varies according to the surface of
the aerogels, from 150 m2 g−1 for the worse chitosan aerogel to
560 m2 g−1 for the best chitin aerogel. In all cases, the extrapolation
of the plots crosses the volume axis at negative values. In the case of
agar aerogels, the ordinates at ˛S = 0 presented positive or negative
values very close to zero (not represented).
A negative value of the intercept indicates a lower-thanexpected adsorbed volume at low pressure and is less common
than a positive one. It can only be interpreted by admitting that
the energy of adsorption of N2 is lower on the measured solid than
on the reference adsorbent, silica in our case. This brings about a
lower density of the adsorbed monolayer (Day, Parfitt, & Peacock,
1979; Lovell, 1975) and a decrease of the amount of N2 adsorbed
in the monolayer by comparison with the value that would have
been adsorbed on a silica surface with the same surface area as the
examined sample. As a consequence, the ˛S plot presents a negative
intercept at the origin. The part of the ˛S plot beyond the monolayer is virtually unaffected by the density of the monolayer, as
the influence of the nature of the adsorbent is especially important
for adsorbed molecules in direct contact with the surface. When
more than a monolayer has been adsorbed, further adsorption takes
place through adsorbate-to-adsorbate interactions and the correlation between relative pressure and adsorbed amount is scantily
modified by the nature of the underlying surface. In this way, the
deviation from linearity of the low-pressure part of the ˛S plot can
be correlated the energy of adsorption on the surface.
The BET treatment provides an energetic parameter C(BET),
which allows to evaluate the net molar energy of adsorption 1E,
viz. the difference between the adsorption enthalpy in the monolayer and in further layers. The net energy of adsorption 1E is
reported in Fig. 7 for all samples as a function of the extrapolated
volume at ˛S = 0, which quantifies the variations of density of the
adsorbed monolayer from the density of the monolayer adsorbed
on the reference silica.
The net adsorption energy 1E is fairly proportional to the variation of density of the adsorbed monolayer. The absolute values can
Fig. 7. Net molar energy of adsorption of N2 vs. the intercept at ˛S = 0 (Figs. 5 and 6)
for chitin (void triangles), chitosan (filled triangles), agar (void lozenges), carrageenan (void square), alginic acid (void circles), and alginate (filled circles)
aerogels and (St. Andrews’ cross) fumed silica.
be compared with the net adsorption energy measured on amorphous silica, which value, 2.9 kJ mol−1 , is in good agreement with
literature results (Lefebvre & Jolicoeur, 1992). In the case of the
aerogels of alginate, alginic acid, and carrageenan, 1E is always
higher than the value measured on the reference silica. For chitosan and agar aerogels, 1E is slightly lower than for silica. 1E of
chitin aerogel is much lower than the silica’s one.
4. Discussion
4.1. Factors affecting the texture of the aerogels
The surface area of the aerogel can bring a reliable information about the size of the secondary units which form the polymer
network, provided that the shape of the aggregates and the density of the polymer can be reasonably assessed by independent
techniques. It would be obviously interesting to determine if this
information on the aerogel could be used to desume properties of
the parent hydrogel. In some cases, a good retention of the structure
of the hydrogel in the supercritically dried aerogel has been demonstrated. In the case of Ca-alginate, SAXS studies have shown that the
aerogel retains the fibrillar structure of the hydrogel (Robitzer et al.,
2008). The hydrogel presented a well-defined rod-like morphology
and this shape was retained through the solvent exchanges and the
supercritical drying treatment.
However, other polysaccharides do not always present the level
of stability of alginate gels. Solvent exchanges and modification of
physical conditions involved in the supercritical drying treatment
can alter in several ways the texture of the gel. The degree of shrinkage of the gel and the formation of mesoporosity are good indicators
of such modifications.
The shrinkage of a fibrillar gel can take place according to several mechanisms, originated by different driving forces. In Fig. 8,
two major alternative mechanisms of shrinkage of a bidimensional
network of rigid rods are schematically represented. Shrinkage can
take place independently of drying, when a change of solvent from
water to a less interacting solvent provides the driving force for
a decrease of the surface/volume ratio of the polymer aggregates.
In the case of fibrillar aggregates, a lower affinity for the solvent
corresponds to a potential for thickening and shortening of the fibrils. If the solvent is a good plasticizer, as ethanol and CO2 can be
for several polymers (Tsivintzelis, Pavlidou, & Panayotou, 2007),
the reorganization of polysaccharide chains to form thicker fib-
Fig. 8. Schematic representation of alternative mechanisms of shrinkage of a fibrillar gel: (a) homothetic shrinkage by fibril thickening and (b) non-homogeneous
shrinkage by local collapses.
rils can occur in a reasonably short time and the corresponding
shortening of fibrils induces a homothetic shrinkage of the gel,
as depicted in the path A of Fig. 8. This mechanism uniformly
decreases the size of the cavities among fibrils. In the case of macroporous hydrogels with cavities of several hundreds nanometers,
shrinkage by decreased solvent affinity is unlikely to generate cavities small enough to enter in the domain of mesoporosity and be
measured by N2 physisorption. Such a mechanism is probably at the
origin of the texture of the aerogels of agar and chitosan from bchitin, which did undergo a significant shrinkage but do not present
any significant mesoporosity. The formation of larger structures
when water is replaced by alcohol has been observed for several
gelling systems of polysaccharides, as in the cases of squid-pen chitosan (Boucard, Viton, & Domard, 2005) and guar (Gittings et al.,
2001).
A different mechanism is operating when interface tension is
the driving force for shrinkage. Gas–liquid interfaces are expected
to be eliminated in supercritical drying. However, incomplete solvent exchange can lead to local retention of solvents with a critical
point higher than CO2 and to the formation of gas–liquid interfaces
when supercritical CO2 is extracted. In this case, interface tension
can draw together fibrils from the opposite sides of a cavity. The
net results are global shrinkage of the gel and local formation of a
porosity much smaller than the original one. The collapse of cavities is unlikely to be an homogeneous phenomenon, especially
because water or alcohol retention is more likely in the smallest
cavities and in the core of the gel. Moreover, the resistance of the
network to interface tension follows a complex pattern, in which
the higher interface tension in smaller cavities is partially compensated by the lower mechanical stiffness of networks with larger
cavities (Gibson & Ashby, 1997). The collapse of the weakest points
of the network brings about a non-uniform shrinkage of the gel, as
schematically represented in the path B of Fig. 8. Such a mechanism
probably accounts for most cases of formation of mesoporosity in
otherwise macroporous gels, as observed for most of the aerogels
whose textural properties are reported in Table 1. In the schematic
representation of Fig. 8, fibrils are represented by rigid rods and
the connectivity of the network is assumed not to be affected by
shrinkage. In a real gel, fibrils can be quite flexible and nodes can
be shredded by severe stress. Both factors contribute to decrease
the resilience of the network and allow a generalized collapse of the
gel. The severe shrinkage of k-carrageenan gel in the supercritical
drying treatment is an interesting example of uniform collapse, in
which the macroporosity of the hydrogel is shrunk to a mesoporosity with a narrow pore size distribution.
A critical parameter for the stiffness of the fibrils is the temperature of glass transition (Tg ) of the polymer they are formed
of. Beyond representing a practical limit to the thermal stability
of the porosity, Tg can also affect the behaviour of the gel in the
drying process. The Tg of polysaccharides is strongly related to
their molecular weight, to the gelling mechanism and the moisture content. Ionotropic gelling by divalent cations increases the
Tg of alginate from 80 to 130 ◦ C (Mruthyunjaya Swamy, Ramaraj,
& Siddaramaiah, 2010; Russo, Malinconico, & Santagata, 2007)
and Tg as high as 200 ◦ C have been suggested for chitin and chitosan (Matsui, Munaro, & Akcelrud, 2010; Sakurai, Maegawa, &
Takahashi, 2000). Tg is significantly increased by the drying treatment: in the case of some agar gels a decrease of the water
content from 15 to 1% brings about an increase of Tg from 60
to 125 ◦ C (Mitsuiki, Mizuno, & Motoki, 1999). At difference with
other polysaccharides, k-carrageenan presents a very low Tg ,
about 1 ◦ C for 12% water content. The corresponding plasticity at
room temperature probably accounts for the observed deformation of carrageenan gel in the intermediate steps of the drying
process.
Anyway, the extreme example of shrinkage is observed in evaporative drying, in which the full force of the water–vapour interface
is exerted on the network. In these cases, the fibrils coalesce in a
compact solid and no porosity can be observed on the polysaccharide xerogels formed by such a drying method (Di Renzo et al., 2005;
Valentin et al., 2007).
4.2. Correlations among surface energetics, monolayer density,
and polymer polarity
The shape of the physisorption isotherm at low relative pressure
provides information on the affinity of the adsorbate for the surface. The C(BET) parameter and the low-coverage variations of the
slope of the comparison plots are both related to the shape of the
initial part of the adsorption isotherm and provide an information
on the energy of adsorption. A possible trouble in the interpretation of these data is the effect of the presence of any microporosity,
which would increase the energy of adsorption independently of
the chemical nature of the surface.
When the comparison plots of the polysaccharide aerogels are
considered (Figs. 5 and 6), the presence of micropores would be
a tempting explanation of the positive intercept of the ˛S plots
for alginates and carrageenan. However, the energetics of lowpressure adsorption can be affected in a very similar way by the
presence of strong adsorption sites on the surface. Quite high C(BET)
values can either be justified by a strong interaction between adsorbent and adsorbate or by the presence of a limited volume of
micropores or surface roughness.
The negative intercept of the ˛S plots for chitin and chitosan
could be accounted for by the geometry of the surface only if some
microporosity was present in the standard adsorbent used. If some
microporosity is commonly observed in precipitated silica, the use
of a fumed silica standard adsorbent at low relative pressure allow
to avoid the inconveniences related to the presence of micropores
(Carrott, Roberts, & Sing, 1988). The negative intercepts observed
for chitin and chitosan can rather be justified by an energy of
adsorption lower than the energy of adsorption on the fumed silica used as standard for the ˛S method. Lower C(BET) parameters
have been shown to correspond to a larger surface area covered
by an adsorbed N2 molecule. For instance, an increase of molecular
areas of 24% was measured on a reference silica when a hydrocarbon coating lowered the C(BET) parameter at a value of 12 (Jelinek
& Kováts, 1994). This effect was attributed to a different orientation of the N2 molecules on the surface. On a non-polar surface, the
N2 molecules are quite flat on the surface and tend to occupy the
maximum area. On a polar surface, the quadrupolar moment of the
N2 molecule favours a head-on adsorption, with the formation of
a denser monolayer (Trens, Denoyel, & Glez, 2004). In the case of
the chitin and chitosan aerogels, a lower density of the N2 monolayer is a sensible explanation of the lower-than-expected adsorbed
volume at low pressure, hence the negative intercept of the ˛S
plot.
The observed order of the energies of adsorption of
N2 on the different polysaccharides is alginate ∼ alginic
acid ≥ carrageenan > agar ∼ chitosan > chitin. This ranking is in
good agreement with the order of polarity of the polymers, which
can be evaluated from the octane/water partition coefficient of the
monomers. Indeed, the calculated partition coefficients decrease
from −0.71 for chitin to −1.85 for chitosan, −2.30 for agar, and
−2.60 for alginic acid, the higher values corresponding to less
polar substances (Ghose, Pritchett, & Crippen, 1989). It can be
observed that the polarity of molecules as evaluated by their
octane/water partition coefficient often differ from the polarity of
the corresponding surfaces as evaluated by another widely used
method, the measurement of the contact angles of water. The
values of the advancing and receding contact angles are affected by
several parameters related to the preparation of the sample and the
experimental setting (Barthlott & Neinhuis, 1997; Gao, McCarthy,
& Zhang, 2009; Lam, Wu, Li, Hair, & Neumann, 2002). Among
these factors, the most important is probably the topology of the
surface at the micron scale, as surface roughness is expected to
enhance hydrophilic and hydrophobic properties at an enormous
extent (Cassie & Baxter, 1944; Koch, Bohn, & Barthlott, 2009; Onda,
Shibuichi, Satoh, & Tsujii, 1996). Variations of surface topology can
account for most of the wide scattering of experimental contact
angles measured on polysaccharide surfaces (Cunha & Gandini,
2010; Yasuda & Okuno, 1994). For instance, water contact angle
varying from 13◦ (superhydrophilic) to 103◦ (highly hydrophobic)
have been measured on chitosan surfaces (Silva et al., 2007; Wang,
Fang, & Yan, 2001). The contact angle provides information on the
energy of interaction of a macroscopic object, like a water droplet
or a cell, with a macroscopic polymer surface, at a scale much
larger than the physisorption of a probe molecule with individual
surface sites.
The variation of physisorption energy of N2 with the polarity
of the polymer implies that the functional groups of the polymers are accessible at the surface of the aerogel fibrils. Indeed,
the main factor affecting polymer polarity and adsorption energetics is the nature of the functional groups of the polysaccharide,
viz. carboxylates of divalent cations for the alginates, carboxylic
groups for the alginic acid, sulphonic groups for carrageenan,
hydroxy groups alone for agar, amino groups for chitosan, and
acetylamido groups for chitin. The presence of electron-deficient
metal cations or acidic protons induces higher adsorption energy
than on fumed silica, while the organic protection of the acetylated groups of chitin induces much lower adsorption energy
than on fumed silica. The functional groups of the agar gel are
hydroxy groups, which behave in a similar way as the silanols
of the silica surface. Indeed, the N2 adsorption energy and the
intercept of the ˛S -plot for agar and silica are virtually identical. The relatively low polarity of the chitosan surface is in good
agreement with the observation of a relative hydrophobicity of the
chitosan gels (Boucard et al., 2007; Montembault, Viton, & Domard,
2005).
The alginate aerogels examined covered a wide range of composition, both from the point of view of the guluronic/mannuronic
ratio and of the nature of the compensating cation. No significant
correlations were found between these parameters and the energy
of adsorption. Indeed, also alginic acid presents a N2 adsorption
energy in the same range as the alginates salted by transition metal
cations. Alginic acid has been shown to present a distance between
OH groups compatible with adsorption of polar molecules, like
water and alcohols, by interaction with a couple of neighbouring
sites (Rodriguez Escudero, Robitzer, Di Renzo, & Quignard, 2009).
The higher interaction energy by comparison with silica parallels
the higher acidity of the carboxylic groups by comparison with
silanol.
The correlation between energetics of N2 adsorption and polarity of the surface has a quite general value and also applies to
synthetic polymers. If a C(BET) parameter is evaluated from published adsorption isotherms and the net physisorption energy 1E is
calculated from this parameter, 1E as low as 1.8 kJ mol−1 can be calculated for hydrophobic polystyrene (Davankov & Tsyurupa, 1989)
and as high as 3.1 kJ mol−1 for more polar melamine-formaldehyde
resin (Derylo-Marczewska, Goworek, & Zgrajka, 2001). However, it
has always to be taken into account that a high adsorption energy
can either be attributed to the presence of strong adsorption sites
or to the presence of micropores. An independent assessment of the
chemistry of the surface is needed to differentiate among the two
possible explanations. For instance, the measurement of 1E as high
as 3 kJ mol−1 for hydrophobic polymers like polystyrene (Milano
et al., 2001) or poly(styrene-butadiene) (Deleuzel, Schultze, &
Sherrington, 2000) has logically been attributed to the presence
of micropores.
5. Conclusions
Physisorption is the only technique able to provide quantitative
information on the surface area and the mesoporosity of polysaccharide aerogels. However, full understanding of the texture of
a material requires the synergy of several techniques. Electron
microscopy provides local information on the shape and the size of
the secondary structures of the material. This information is useful
to choose the proper model for the interpretation of the physisorption data. On the other way, the physisorption measurement of
the property of the whole sample usefully complements the local
nature of the data from microscopy. The limitation of the data from
capillary condensation to features smaller than 50 nm has always
to be taken into account, and the evaluation of macroporosity has
to be provided by macroscopic techniques.
The texture of the aerogel can provide information on the gelling
mechanism and on the evolution of the material in the drying process. Data on the macroscopic shrinkage of the gel in the drying
process allows to differentiate between systems for which the aerogel provides a faithful image of the parent hydrogel and systems
with low mechanical stability. The extent of shrinkage provides a
qualitative information on the stiffness of the secondary structures
and physisorption data provide a quantitative information on their
coalescence.
The high surface area of the aerogels renders much easier the evaluation of the surface properties of the polymers by
any technique. The adsorption of probe molecules, monitored by
spectroscopic, volumetric or calorimetric methods, provides an
important information on the accessibility of the functional groups
of the polymer. The different values of the adsorption heat for
polymers with different functional groups indicate that the versatile chemistry of polysaccharides can be used to prepare materials
which retain their specific properties also in the dry state. In the
case of natural materials, physisorption methods are a promising
tool to identify the functional groups exposed to the surface of complex systems, as it has just been suggested by recent research on
lignocellulosic systems (Chang et al., 2009; Clair, Gril, Di Renzo,
Yamamoto, & Quignard, 2008).
References
Absolom, D. R., Lamberti, F. V., Policova, Z., Sing, W., van Oss, C. J., & Neumann, A.
W. (1983). Surface thermodynamics aspects of bacterial adhesion. Applied and
Environmental Microbiology, 46, 90–97.
Aronson, M., Medalia, O., Schori, L., Mirelman, D., Sharon, N., & Ofek, I. (1979). Prevention of colonization of the urinary tract of mice with Escherichia coli by blocking
of bacterial adherence with methyl a-d-mannopyranoside. Journal of Infectious
Diseases, 139, 329–332.
Atkins, E. D. T., Nieduszyznski, I. A., Mackie, W., Parker, K. D., & Smolko, E. E. (1973).
Structural components of alginic acid. II. The crystalline structure of poly-al-guluronic acid. Results of X-ray diffraction and polarized infrared studies.
Biopolymers, 12, 1879–1887.
Barthlott, W., & Neinhuis, C. (1997). Purity of the sacred lotus, or escape from contamination in biological surfaces. Planta, 202, 1–8.
Bayer, M. E. (1990). Visualization of the bacterial polysaccharide capsule. In J. Kann,
& B. Kann (Eds.), Bacterial capsules (pp. 129–157). Berlin: Springer-Verlag.
Boissière, M., Tourrette, A., Devoisselle, J. M., Di Renzo, F., & Quignard, F. (2006).
Pillaring effects in macroporous carrageenan–silica composite microspheres.
Journal of Colloid and Interface Science, 294, 109–116.
Boucard, N., David, L., Rochas, C., Montembault, A., Viton, C., & Domard, A. (2007).
Polyelectrolyte microstructure in chitosan aqueous and alcohol solutions.
Biomacromolecules, 8, 1209–1217.
Boucard, N., Viton, C., & Domard, A. (2005). New aspects of the formation of physical hydrogels of chitosan in a hydroalcoholic medium. Biomacromolecules, 6,
3227–3237.
Cardea, S., Gugliuzza, A., Sessa, M., Aceto, M. C., Drioli, E., & Reverchon, E. (2009).
Supercritical gel drying: A powerful tool for tailoring symmetric porous PVDFHFP membranes. ACS Applied Materials and Interfaces, 1, 171–180.
Carrott, P. J. M., Roberts, R. A., & Sing, K. S. W. (1988). Adsorption of neopentane by
nonporous carbons and silicas. Langmuir, 4, 740–743.
Cassie, A. B. D., & Baxter, S. (1944). Wettability of porous surfaces. Transactions of the
Faraday Society, 40, 546–551.
Casson, D., & Emery, A. N. (1987). On the elimination of artefactual effects in assessing
the structure of calcium alginate cell immobilization gels. Enzyme and Microbial
Technology, 9, 102–106.
Chang, S.-S., Clair, B., Ruelle, J., Beauchêne, J., Di Renzo, F., Quignard, F., et al. (2009).
Mesoporosity as a new parameter for understanding tension stress generation
in trees. Journal of Experimental Botany, 60, 3023–3030.
Chang, X., Chen, D., & Jiao, X. (2008). Chitosan-based aerogels with high adsorption
performance. Journal of Physical Chemistry B, 112, 7721–7725.
Chassary, P., Vincent, T., & Guibal, E. (2004). Metal anion sorption on chitosan and
derivative materials: A strategy for polymer modification and optimum use.
Journal of Applied Polymer Science, 94, 1634–1642.
Cherstvy, A. G., Kolomeisky, A. B., & Kornyshev, A. A. (2008). Protein–DNA interactions: Reaching and recognizing the targets. Journal of Physical Chemistry B, 112,
4741–4750.
Chu, Y.-F., Hsu, C.-H., Soma, P. K., & Lo, Y. M. (2009). Immobilization of bioluminescent Escherichia Coli cells using natural and artificial fibers treated with
polyethyleneimine. Bioresource Technology, 1001, 3167–3174.
Clair, B., Gril, J., Di Renzo, F., Yamamoto, H., & Quignard, F. (2008). Characterisation
of a gel in the cell walls to elucidate the paradoxical shrinkage of tension wood.
Biomacromolecules, 9, 494–498.
Cunha, A. G., & Gandini, A. (2010). Turning polysaccharides into hydrophobic materials: A critical review. Part 2. Hemicelluloses, chitin/chitosan, starch, pectin and
alginates. Cellulose, 17, 1045–1065.
Daniel, C., Alfano, D., Venditto, V., Cardea, S., Reverchon, E., Larobina, D., et al.
(2005). Aeogels with a microporous crystalline host phase. Advanced Materials,
17, 1515–1518.
Davankov, V. A., & Tsyurupa, M. P. (1989). Structure and properties of porous
hypercrosslinked polystyrene sorbents ‘Styrosorb’. Pure & Applied Chemistry, 61,
1881–1888.
Day, R. E., Parfitt, G. D., & Peacock, J. (1979). A comparison of the effect of pretreatment with ethanol, hexan-l-ol, and hexan-1:6-diol on the adsorption
behavior of rutile, alumina, and silica. Journal of Colloid and Interface Science, 70,
130–138.
Decho, A. W. (1999). Imaging an alginate polymer gel matrix using atomic force
microscopy. Carbohydrate Research, 315, 330–333.
Deleuzel, H., Schultze, X., & Sherrington, D. C. (2000). Porosity analysis of some
poly(styrene/divinylbenzene) beads by nitrogen sorption and mercury intrusion
porosimetry. Polymer Bulletin, 44, 179–186.
Derylo-Marczewska, A., Goworek, J., & Zgrajka, W. (2001). Studies of
melamine–formaldehyde resins by sorption from gas and liquid phases.
Langmuir, 17, 6518–6523.
Dhoot, N. O., & Wheatley, M. A. (2003). Microencapsulated liposomes in controlled
drug delivery: Strategies to modulate drug release and eliminate the burst effect.
Journal of Pharmaceutical Sciences, 92, 679–689.
Di Renzo, F., Valentin, R., Boissière, M., Tourrette, A., Sparapano, G., Molvinger, K.,
et al. (2005). Hierarchical macroporosity induced by constrained syneresis in
core–shell polysaccharide composites. Chemistry of Materials, 17, 4693–4699.
Disney, M. D., Zheng, Z., Swager, T. M., & Seeberger, P. H. (2004). Detection of bacteria
with carbohydrate-functionalized fluorescent polymers. Journal of the American
Chemical Society, 126, 13343–13346.
Drury, J. L., & Mooney, D. J. (2003). Hydrogels for tissue engineering: Scaffold design
variables and applications. Biomaterials, 24, 4337–4351.
Dumitriu, S. (Ed.). (1998). Polysaccharides. New York: Marcel Dekker.
Dumitriu, S., & Chornet, E. (1998). Polysaccharides as support for enzyme and cell
immobilization. In S. Dumitriu (Ed.), Polysaccharides (pp. 629–748). New York:
Marcel Dekker.
Elbert, D. L., & Hubbell, J. A. (1996). Surface treatments of polymers for biocompatibility. Annual Review of Material Research, 26, 365–394.
Foord, S. A., & Atkins, E. D. T. (1989). New X-ray-diffraction results from agarose
extended single helix structures and implications for gelation mechanism.
Biopolymers, 28, 1345–1365.
Galarneau, A., Desplantier, D., Dutartre, R., & Di Renzo, F. (1999). Micelle-templated
silicates as a test-bed for methods of pore size evaluation. Microporous and
Mesoporous Materials, 27, 297–308.
Gao, L., McCarthy, T. J., & Zhang, X. (2009). Wetting and superhydrophobicity. Langmuir, 25, 14100–14104.
Ghose, A. K., Pritchett, A., & Crippen, G. M. (1989). Atomic physicochemical parameters for three dimensional structure directed quantitative structure–activity
relationship. III. Modeling hydrophobic interactions. Journal of Computational
Chemistry, 9, 80–90.
Gibson, L. J., & Ashby, M. F. (1997). Cellular Solids. Structure and Properties. Cambridge:
Cambridge University Press.
Gittings, M. R., Cipelletti, L., Trappe, V., Weitz, D. A., In, M., & Lal, J. (2001). The effect
of solvent and ions on the structure and rheological properties of guar solutions.
Journal of Physical Chemistry A, 105, 9310–9315.
Gregg, S. J., & Sing, K. S. W. (1982). Adsorption, Surface area and Porosity (2nd ed.).
London: Academic Press. (p. 98).
Guibal, E. (2005). Heterogeneous catalysis on chitosan-based materials: A review.
Progress in Polymer Science, 30, 71–109.
Guibal, E., Vincent, T., & Peirano-Blondet, F. (2007). Biopolymers as supports for
heterogeneous catalysis: Focus on chitosan, a promising aminopolysaccharide.
In A. K. S. Gupta (Ed.), Ion Exchange and Solvent Extraction (p. 151-290). Boca
Raton: CRC Press.
Hills, B. P., Godward, J., Debatty, M., Barras, L., Saturio, C. P., & Ouwerx, C. (2000). NMR
studies of calcium induced alginate gelation. Part II. The internal bead structure.
Magnetic Resonance in Chemistry, 38, 719–728.
Jaafari, K., Elmaleh, S., Coma, J., & Benkhouja, K. (2001). Equilibrium and kinetics of
nitrate removal by protonated cross-linked chitosan. Water SA, 27, 9–13.
Jaroniec, M., Kruk, M., & Olivier, J. P. (1999). Standard nitrogen adsorption data for
characterization of nanoporous silicas. Langmuir, 15, 5410–5413.
Jelinek, L., & Kováts, E. S. Z. (1994). True surface areas from nitrogen adsorption
experiments. Langmuir, 10, 4225–4231.
Kanzawa, Y., Koreeda, A., Harada, A., & Harada, T. (1989). Electron microscopy of the
gel-forming ability of polysaccharide food additives. Agricultural and Biological
Chemistry, 53, 979–986.
Kanzawa, Y., Koreeda, A., Harada, A., Okuyama, K., & Harada, T. (1990). Significance of
molecular association for polysaccharide gels in food. Journal of Home Economics
of Japan, 41, 951–956.
Koch, K., Bohn, H. F., & Barthlott, W. (2009). Hierarchically sculptured plant surfaces
and superhydrophobicity. Langmuir, 25, 14116–14120.
Kopecká, M., Phaff, H. J., & Fleet, G. H. (1974). Demonstration of a fibrillar component
in cell wall of yeast Saccharomyces cerevisiae and its chemical nature. Journal of
Cell Biology, 62, 66–76.
Lam, C. N. C., Wu, R., Li, D., Hair, M. L., & Neumann, A. W. (2002). Study of the advancing and receding contact angles: Liquid sorption as a cause of contact angle
hysteresis. Advances in Colloid and Interface Science, 96, 169–191.
Lamarque, G., Viton, C., & Domard, A. (2004). Comparative study of the first heterogeneous deacetylation of a- and b-chitins in a multistep process, 5, 992–1001.
Laus, R., Geremias, R., Vasconcelos, H. L., Laranjeira, M. C. M., & Fávere, V. T. (2007).
Reduction of acidity and removal of metal ions from coal mining effluents using
chitosan microspheres. Journal of Hazardous Materials, 149, 471–474.
Leckband, D. (2001). Novel recognition mechanisms in biological adhesion. Current
Opinion in Colloid & Interface Science, 6, 498–505.
Lee, J.-H., Shim, J. S., Lee, J. S., Kim, J. K., Yang, I. S., Chung, M.-S., et al. (2006). Inhibition of pathogenic bacterial adhesion by acidic polysaccharide from green
tea (Camellia sinensis). Journal of Agricultural and Food Chemistry, 54, 8717–
8723.
Lefebvre, Y., & Jolicoeur, C. (1992). Gas phase adsorption studies of selected probe
molecules on powdered silica polymorphs. Colloids and Surfaces, 63, 67–76.
Li, B., & Logan, B. E. (2004). Bacterial adhesion to glass and metal-oxide surfaces.
Colloids and Surfaces B-Biointerfaces, 36, 81–90.
Lippens, B. C., & de Boer, J. H. (1965). Studies on pore systems in catalysts. V. The t
method. Journal of Catalysis, 4, 319–323.
Liu, Z. M., Becker, T., & Neufeld, R. J. (2005). Spherical alginate granules formulated
for quick-release active subtilisin. Biotechnology Progress, 21, 568–574.
Liu, Y., Yang, C.-H., & Li, J. (2007). Influence of extracellular polymeric substances
on pseudomonas aeruginosa transport and deposition profiles in porous media.
Environmental Science and Technology, 41, 198–205.
Lovell, V. M. (1975). The effect of certain pretreatments on surface-area of various
minerals, determined by BET method. Powder Technology, 12, 71–76.
Mackie, W., Perez, S., Rizzo, R., Taravel, F., & Vignon, M. (1983). Aspects of the conformation of polyguluronate in the solid state and in solution. International Journal
of Biological Macromolecules, 5, 329–341.
Mammen, N., Choi, A.-K., & Whitesides, G. M. (1998). Polyvalent interactions in
biological systems: Implications for design and use of multivalent ligands and
inhibitors. Angewandte Chemie-International Edition, 37, 2754–2794.
Martinsen, A., Storrø, I., & Skjåk-Bræk, G. (1992). Alginate as immobilization material.
3. Diffusional properties. Biotechnology and Bioengineering, 39, 186–194.
Matsui, M., Munaro, M., & Akcelrud, L. (2010). Chitin/polyurethane blends: A thermal
and morphological study. Polymer International, 59, 1090–1098.
Maurstad, G., Danielsen, S., & Stokke, B. T. (2003). Analysis of compacted semiflexible
polyanions visualized by atomic force microscopy: Influence of chain stiffness
on the morphologies of polyelectrolyte complexes. Journal of Physical Chemistry
B, 107, 8172–8180.
Milano, G., Venditto, V., Guerra, G., Cavallo, L., Ciambelli, P., & Sannino, D. (2001).
Shape and volume of cavities in thermoplastic molecular sieves based on syndiotactic polystyrene. Chemistry of Materials, 13, 1506–1511.
Millane, R. P., Chandrasekaran, R., Arnott, S., & Dea, I. C. M. (1988). The molecular
structure of k-carrageenan and comparison with i-carrageenan. Carbohydrate
Research, 182, 1–17.
Mitsuiki, M., Mizuno, A., & Motoki, M. (1999). Determination of molecular weight
of agars and effect of the molecular weight on the glass transition. Journal of
Agricultural and Food Chemistry, 47, 473–478.
Miura, Y., Watanabe, Y., & Okabe, S. (2007). Membrane biofouling in pilot-scale
membrane bioreactors (MBRs) treating municipal wastewater: Impact of biofilm
formation. Environmental Science & Technology, 41, 632–638.
Montembault, A., Viton, C., & Domard, A. (2005). Physico-chemical studies of the
gelation of chitosan in a hydroalcoholic medium. Biomaterials, 26, 933–943.
Mruthyunjaya Swamy, T. M., Ramaraj, B., & Siddaramaiah. (2010). Sodium alginate
and poly(ethylene glycol) blends: Thermal and morphological behaviors. Journal
of Macromolecular Science A, 47, 877–881.
Neimark, A. V. G., & Ravikovitch, P. I. (2001). Capillary condensation in MMS and pore
structure characterization. Microporous and Mesoporous Materials, 44, 697–707.
Neville, A. C., Parry, D. A. D., & Woodhead-Galloway, J. (1976). The chitin crystallite
in arthropod cuticle. Journal of Cell Science, 21, 73–82.
Okuyama, K., Noguchi, K., Miyazawa, T., Yui, T., & Ogawa, K. (1997). Molecular and
crystal structure of hydrated chitosan. Macromolecules, 30, 5849–5855.
Onda, T., Shibuichi, S., Satoh, N., & Tsujii, K. (1996). Super-water-repellent fractal
surfaces. Langmuir, 12, 2125–2127.
Partap, S., Rehman, I., Jones, J. R., & Darr, J. A. (2006). “Supercritical carbon dioxide
in water” emulsion-templated synthesis of porous calcium alginate hydrogels.
Advanced Materials, 18, 501–504.
Pekala, R. W. (1989). Organic aerogels from the polycondensation of resorcinol with
formaldehyde. Journal of Materials Science, 24, 3221–3227.
Peppas, N. A., Hilt, J. Z., Khademhosseini, A., & Langer, R. H. (2006). Hydrogels in biology and medicine: From molecular principles to bionanotechnology. Advanced
Materials, 18, 1345–1360.
Percival, E., & McDowell, R. H. (1967). Chemistry and enzymology of marine algal
polysaccharides. London: Academic Press. (p. 23).
Pierre, A. C., & Pajonk, G. M. (2002). Chemistry of aerogels and their applications.
Chemical Reviews, 102, 4243–4265.
Pilnik, W., & Rombouts, F. M. (1985). Polysaccharides and food processing. Carbohydrate Research, 142, 93–105.
Quignard, F., Valentin, R., & Di Renzo, F. (2008). Aerogel materials from marine
polysaccharides. New Journal of Chemistry, 32, 1300–1310.
Ravi Kumar, M. V. N., Muzzarelli, R. A. A., Sashiwa, H., & Domb, A. J. (2004). Chitosan
chemistry and pharmaceutical perspectives. Chemical Reviews, 104, 6017–6084.
Roberts, G. A. F. (1992). Chitin chemistry. Houndmills: Macmillan.
Robitzer, M., David, L., Rochas, C., Di Renzo, F., & Quignard, F. (2008). Nanostructure
of calcium alginate aerogels obtained from multistep solvent exchange route.
Langmuir, 24, 12547–12552.
Rodriguez Escudero, R., Robitzer, M., Di Renzo, F., & Quignard, F. (2009). Alginate
aerogels as adsorbents of polar molecules from liquid hydrocarbons. Hexanol as
probe molecule. Carbohydrate Polymers, 75, 52–57.
Rouquerol, F., Rouquerol, J., & Sing, K. S. W. (1999). Adsorption by powders and porous
solids. San Diego: Academic Press.
Russo, R., Malinconico, M., & Santagata, G. (2007). Effect of cross-linking with calcium ions on the physical properties of alginate films. Biomacromolecules, 8,
3193–3197.
Sadamoto, R., Niikura, K., Ueda, T., Monde, K., Fukuhara, N., & Nishimura, S.-I. (2004).
Control of bacteria adhesion by cell-wall engineering. Journal of the American
Chemical Society, 126, 3755–3761.
Sakurai, K., Maegawa, T., & Takahashi, T. (2000). Glass transition temperature of
chitosan and miscibility of chitosan/poly(N-vinyl pyrrolidone) blends. Polymer,
41, 7051–7056.
Schengrund, C.-L. (2003). “Multivalent” saccharides: Development of new
approaches for inhibiting the effects of glycosphingolipid-binding pathogens.
Biochemical Pharmacology, 65, 699–707.
Serp, D., Mueller, M., von Stockar, U., & Marison, I. W. (2002a). Low-temperature
electron microscopy for the study of polysaccharide ultrastructures in hydrogels.
I. Theoretical and technical considerations. Biotechnology and Bioengineering, 79,
243–252.
Serp, D., Mueller, M., von Stockar, U., & Marison, I. W. (2002b). Low-temperature
electron microscopy for the study of polysaccharide ultrastructures in hydrogels.
II. Effect of temperature on the structure of Ca2+ -alginate beads. Biotechnology
and Bioengineering, 79, 253–259.
Sharon, N., & Ofek, B. (2000). Safe as mother’s milk: Carbohydrates as future antiadhesion drugs for bacterial diseases. Glycoconjugate Journal, 17, 659–664.
Silva, S. S., Goodfellow, B. J., Benesch, J., Rocha, J., Mano, J. F., & Reis, R. L. (2007).
Morphology and miscibility of chitosan/soy protein blended membranes. Carbohydrate Polymers, 70, 25–31.
Simoni, S. F., Bosma, T. N. P., Harms, H., & Zehnder, A. J. B. (2000). Bivalent cations
increase both the subpopulation of adhering bacteria and their adhesion efficiency in sand columns. Environmental Science and Technology, 34, 1011–1017.
Sing, K. S. W., Everett, D. H., Haul, R. A. W., Moscou, L., Pierotti, R. A., Rouquerol, J.,
et al. (1985). Reporting physisorption data for gas/solid systems. Pure and Applied
Chemistry, 57, 603–619.
Sipahigil, O., & Dortunc, B. (2001). Preparation and in vitro evaluation of verapamil
HCl and ibuprofen containing carrageenan beads. International Journal of Pharmaceutics, 228, 119–128.
Sletmoen, M., Maurstad, G., Sikorski, P., Smestad Paulsen, B., & Stokke, B. T. (2003).
Characterisation of bacterial polysaccharides: Steps towards single molecular
studies. Carbohydrate Research, 338, 2459–2475.
Stephen, S. M., Phillips, G. O., & Williams, P. A. (Eds.). (2006). Food polysaccharides
and their applications. Boca Raton: Taylor & Francis.
Sugita-Konishi, Y., Sakanaka, S., Sasaki, K., Juneja, L. R., Noda, T., & Amano, F. (2002).
Inhibition of bacterial adhesion and salmonella infection in BALB/c mice by
sialyloligosaccharides and their derivatives from chicken egg yolk. Journal of
agricultural and food chemistry, 50, 3607–3613.
Tirrell, M., Kokkoli, E., & Biesalski, M. (2002). The role of surface science in bioengineered materials. Surface Science, 500, 61–83.
Trens, P., Denoyel, R., & Glez, J. C. (2004). Comparative adsorption of argon and nitrogen for the characterisation of hydrophobized surfaces. Colloids and Surfaces
A-Physicochemical and Engineering Aspects, 245, 93–98.
Tsivintzelis, I., Pavlidou, E., & Panayotou, C. (2007). Biodegradable polymer foams
prepared with supercritical CO2 –ethanol mixtures as blowing agents. Journal of
Supercritical Fluids, 42, 265–272.
Tufenkji, N., Dixon, D. R., Considine, R., & Drummond, C. J. (2006). Multi-scale
cryptosporidium/sand interactions in water treatment. Water Research, 40,
3315–3331.
Vachoud, L., Zydowicz, N., & Domard, A. (1997). Formation and characterisation of a
physical chitin gel. Carbohydrate Research, 302, 169–177.
Valentin, R., Bonelli, B., Garrone, E., Di Renzo, F., & Quignard, F. (2007). Accessibility of the functional groups of chitosan aerogel probed by FT-IR-monitored
deuteration. Biomacromolecules, 8, 3646–3650.
Valentin, R., Horga, R., Bonelli, B., Garrone, E., Di Renzo, F., & Quignard, F. (2006).
FTIR spectroscopy of NH3 on acidic and ionotropic alginate aerogels. Biomacromolecules, 7, 877–882.
Valentin, R., Molvinger, K., Quignard, F., & Di Renzo, F. (2005). Methods to analyse the texture of alginate aerogel microspheres. Macromolecular Symposia, 222,
93–101.
Valentin, R., Molvinger, K., Viton, C., Domard, A., & Quignard, F. (2005). From
hydrocolloids to high specific surface area porous supports for catalysis.
Biomacromolecules, 6, 2785–2792.
van Loosdrecht, M. C. M., Lyklema, J., Norde, W., & Zehnder, A. (1989). Bacterial
adhesion—A physicochemical approach. Microbial Ecology, 17, 1–15.
Vincent, T., & Guibal, E. (2004). Chitosan-supported palladium catalyst. 5. Nitrophenol degradation using palladium supported on hollow chitosan fibers.
Environmental Science and Technology, 38, 4233–4240.
Walter, R. H. (1998). Polysaccharide dispersions. San Diego: Academic Press.
Wang, H., Fang, Y. E., & Yan, Y. (2001). Surface modification of chitosan membranes
by alkane vapor plasma. Journal of Materials Chemistry, 11, 1374–1377.
White, R. J., Budarin, V. L., & Clark, J. H. (2008). Tuneable mesoporous materials from
a-d-polysaccharides. ChemSusChem, 1, 408–411.
Yasuda, T., & Okuno, T. (1994). Contact angle of water on polymer surfaces. Langmuir,
10, 2435–2439.
© Copyright 2026