
Download (283Kb)
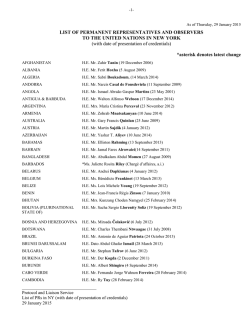
RESEARCH PAPER
Multimodal MRI as a diagnostic biomarker for amyotrophic
lateral sclerosis
Bradley R. Foerster1,2,3,, Ruth C. Carlos2, Ben A. Dwamena2,3, Brian C. Callaghan4, Myria Petrou1,2,
Richard A. E. Edden1,5, Mona A. Mohamed1,5, Robert C. Welsh2,6, Peter B. Barker1,5, Eva L. Feldman4
& Martin G. Pomper1
1
Russell H. Morgan Department of Radiology and Radiological Science, Johns Hopkins University School of Medicine, Baltimore, Maryland
Department of Radiology, University of Michigan, Ann Arbor, Michigan
3
Ann Arbor VA Healthcare System, Ann Arbor, Michigan
4
Department of Neurology, University of Michigan, Ann Arbor, Michigan
5
F.M. Kirby Research Center for Functional Brain Imaging, Kennedy Krieger Institute, Baltimore, Maryland
6
Department of Psychiatry, University of Michigan, Ann Arbor, Michigan
2
Correspondence
Bradley R. Foerster, Department of Radiology,
University of Michigan, 1500 E. Medical
Center Drive, UH B2 A205H, Ann Arbor, MI
48109-5030. Tel: 1-734-615-3586; Fax:
1-734-764-2412; E-mail: compfun@umich.
edu
Funding Information
This study was funded by the A. Alfred
Taubman Medical Research Institute.
Received: 8 November 2013; Revised: 16
December 2013; Accepted: 17 December
2013
Annals of Clinical and Translational
Neurology 2014; 1(2): 107–114
doi: 10.1002/acn3.30
Abstract
Objective: Reliable biomarkers for amyotrophic lateral sclerosis (ALS) are
needed, given the clinical heterogeneity of the disease. Here, we provide proofof-concept for using multimodal magnetic resonance imaging (MRI) as a diagnostic biomarker for ALS. Specifically, we evaluated the added diagnostic utility
of proton magnetic resonance spectroscopy (MRS) to diffusion tensor imaging
(DTI). Methods: Twenty-nine patients with ALS and 30 age- and gendermatched healthy controls underwent brain MRI which used proton MRS
including spectral editing techniques to measure c-aminobutyric acid (GABA)
and DTI to measure fractional anisotropy of the corticospinal tract. Data were
analyzed using logistic regression, t-tests, and generalized linear models with
leave-one-out analysis to generate and compare the resulting receiver operating
characteristic (ROC) curves. Results: The diagnostic accuracy is significantly
improved when the MRS data were combined with the DTI data as compared
to the DTI data only (area under the ROC curves (AUC) = 0.93 vs.
AUC = 0.81; P = 0.05). The combined MRS and DTI data resulted in sensitivity of 0.93, specificity of 0.85, positive likelihood ratio of 6.20, and negative
likelihood ratio of 0.08 whereas the DTI data only resulted in sensitivity of
0.86, specificity of 0.70, positive likelihood ratio of 2.87, and negative likelihood
ratio of 0.20. Interpretation: Combining multiple advanced neuroimaging
modalities significantly improves disease discrimination between ALS patients and
healthy controls. These results provide an important step toward advancing a multimodal MRI approach along the diagnostic test development pathway for ALS.
Introduction
Amyotrophic lateral sclerosis (ALS) is a degenerative
motor neuron disease involving upper and lower motor
neurons (LMN). The disease has a uniformly fatal outcome with median survival times of 2–4 years.1 ALS can
be a challenging disease to diagnose and provide prognostic information at an individual level given its heterogeneous clinical presentation and lack of definitive tests.
Diagnosis of ALS is based on clinical history and examination, and relies on the detection of upper and LMN
signs in multiple body segments.2 These factors contribute
to a nearly 1-year delay on average from the initial symptom onset to diagnosis with a delayed diagnosis of
4 months even after been seen by a neurologist.3,4 Furthermore, over 40% of ALS patients undergo incorrect
medical treatment including surgical intervention.5 Reliable biomarkers for ALS are needed both for diagnostic
as well as prognostic purposes.6,7
Electromyography (EMG) supplements the clinical
evaluation of LMN pathology in ALS and can detect signs
of LMN denervation in muscles that appear normal on
ª 2014 The Authors. Annals of Clinical and Translational Neurology published by Wiley Periodicals, Inc on behalf of American Neurological Association.
This is an open access article under the terms of the Creative Commons Attribution-NonCommercial-NoDerivs License, which permits use and
distribution in any medium, provided the original work is properly cited, the use is non-commercial and no modifications or adaptations are made.
107
Multimodal MRI as a Diagnostic Biomarker for ALS
physical examination.8 Conventional neuroimaging techniques that evaluate structural changes lack the specificity
and sensitivity to serve as an “EMG” surrogate of upper
motor neuron (UMN) involvement for ALS and detect
clinically occult UMN signs.9–11 As a result, the main purpose of conventional magnetic resonance imaging (MRI)
techniques is to rule out alternative diagnoses that may
mimic ALS such as upper cervical cord lesions, which can
produce both UMN and LMN neurological signs. Therefore, great interest exists in using advanced neuroimaging
methods such as diffusion tensor imaging (DTI) and
magnetic resonance spectroscopy (MRS) to develop accurate diagnostic biomarkers for ALS. DTI allows for in
vivo measurement and quantification of water movement,
which has been demonstrated to be altered in ALS, providing evidence of damaged white matter tracts.7 MRS
allows for in vivo measurement of brain metabolites.
Using MRS in ALS patients, N-acetylaspartate (NAA), a
marker of neuronal integrity, has been shown to be
decreased in the motor cortex (MC), and myo-inositol
(mI), a marker of glial cells, has been shown to be
increased in the MC.12 A potential additional diagnostic
biomarker is c-aminobutyric acid (GABA), the major
inhibitory neurotransmitter in the central nervous system.
There is increasing evidence that reduced inhibitory function may play an important role in the pathogenesis of
ALS.13 We have recently published two MRS studies that
used spectral editing techniques to demonstrate a decrease
in GABA in ALS patients.14,15
We are interested in systematically evaluating the
potential of advanced imaging methods to serve as a biomarker in ALS. As an initial step, we have performed two
meta-analysis studies indicating that DTI by itself currently lacks sufficient diagnostic discrimination to be
implemented in the clinical setting.16,17 We concluded
that additional diagnostic tests will have to be combined
with DTI to develop a clinically relevant testing algorithm. As a next step in diagnostic test development, we
have conducted a “Phase 2a” trial which combines MRS
and DTI to compare ALS patients with well-established
disease to healthy controls (HC) as a proof-of-concept.18
The aim of this study is to explore the added diagnostic
utility of MRS, including spectral editing techniques that
enable quantification of GABA, to DTI in the setting of
ALS.
Subjects/Materials and Methods
Twenty-nine right-handed ALS patients and 30 age- and
gender-matched right-handed HCs were recruited. Our
institutional review board approved all study protocols,
and informed written consent was obtained from all of
the participants. Subjects were excluded if they had a his-
108
B. R. Foerster et al.
tory of head injury, cerebrovascular disease, central nervous system infection, active substance abuse, or
contraindication for MRI. ALS patients were classified by
experienced ALS neurologists (B.C.C., E.L.F.) as definite
(n = 4), probable (n = 15), or probable laboratory supported (n = 10) according to the revised El Escorial Criteria.2 In addition, the ALS patients were examined (B.C.C.,
E.L.F.) for presence of muscle spasticity and pathologic
reflexes in the different body segments. The Ashworth
Spasticity Scale (range 0–8),19 presence of pathological
reflexes (range 0–24),20,21, and the Center for Neurologic
Study – Lability Scale for pseudobulbar affect (range 0–
1)22 were used to measure UMN disease involvement
resulting in a range of 0–33 with a higher score reflecting
greater disease burden. The MRI study was performed
within 2 months of the neurological exam. Seven of the
ALS patients had bulbar-onset disease and 22 patients
had limb-onset disease. Fifteen of the ALS patients were
on riluzole treatment for ALS and 14 of the ALS patients
were riluzole treatment-na€ıve. Participant characteristics
are summarized in Table 1.
Diffusion tensor imaging
Nineteen subjects (10 ALS, 9 HCs) were imaged on a Philips Achieva 3T system (Best, Netherlands) using an 8channel receive head coil. Forty subjects (19 ALS, 21
HCs) were imaged on a Philips Ingenia 3T system (Best,
Netherlands) using a 15-channel receive head coil. Whole
brain diffusion-weighted imaging was obtained using a
multiple shot spin-echo technique (repetition time/echo
time = 7075/62 msec, field of view 112 mm, 2-mm isotropic resolution, b values = 0, 800 sec/mm2, 15 isotropically distributed gradients). ExploreDTI v4.8.2 (Utrecht,
the Netherlands) was used to perform the data processing
with incorporating a motion and eddy current correction
Table 1. Participant characteristics.
No.
Age, year,
mean Æ SD (range)
Male:female
Disease duration,
month, mean Æ SD
(range)
UMN Score,
mean Æ SD (range)
ALSFRS-R Score,
mean Æ SD (range)
Controls
ALS
30
59.3 Æ 9.9 (29–79)
29
59.5 Æ 10.2 (32–78)
20:10
NA
17:12
28.6 Æ 14.5 (4–64)
NA
15.6 Æ 7.0 (1–27)
NA
34.1 Æ 8.2 (18–47)
ALS, amyotrophic lateral sclerosis; ALSFRS-R, revised Amyotrophic
Lateral Sclerosis Functional Rating Scale, UMN, upper motor neuron.
ª 2014 The Authors. Annals of Clinical and Translational Neurology published by Wiley Periodicals, Inc on behalf of American Neurological Association.
B. R. Foerster et al.
Multimodal MRI as a Diagnostic Biomarker for ALS
algorithm. Seed regions of interest were placed in the posterior limb of the internal capsule and pons using detailed
white matter atlases to generate the fiber tracks using
standard deterministic stream.23 The fractional anisotropy
(FA) values for the right and left corticospinal tract were
calculated and averaged. Figure 1 depicts the fiber tracking of the corticospinal tracts as well as the MRS voxel
placement in the left MC and resulting spectra.
Magnetic resonance spectroscopy
The MRS results from this cohort have been previously
published.14,15 T1-weighted 3D-MPRAGE images were
used to specify the placement of a 3.0 9 3.0 9 2.0 cm voxel in the left MC manually centered on the hand knob in
the axial projection and the hook in the sagittal projection
under supervision of an experienced neuroradiologist
(B.R.F.).24 Single-voxel point resolved spectroscopy
(PRESS) and Mescher-Garwood point resolved spectroscopy (MEGA-PRESS) data acquisitions were performed.25
PRESS spectra (TR/TE = 2000/35 msec) were acquired
using “VAPOR” water suppression with 32 averages
acquired. LCModel (version 6.1-4A; S. Provencher, Ph.D.,
Oakville, Ontario, Canada)26 was used to analyze the
PRESS data. In order to be used in the analysis, the
Cramer-Rao lower bounds as generated in LCModel for
the metabolites needed to be less than 20%. MEGA-PRESS
spectra were acquired using TE = 68 msec (TE1 =
15 msec, TE2 = 53 msec); TR = 1.8 sec; 256 averages;
frequency selective editing pulses (14 msec) applied at
1.9 ppm (ON) and 7.46 ppm (OFF). Gaussian curve fits
were generated of the GABA and inverted NAA peaks using
in-house post processing software in Matlab 2012a (Mathworks, Natick, MA) and the GABA levels were calculated
relative to the NAA signal in the edited spectra.27 The NAA
concentration generated from the LCModel analysis of the
short-TE PRESS spectrum was then multiplied by the
GABA/NAA ratio to provide an estimate of GABA concentration. SPM5 (Wellcome Trust Centre for Neuroimaging,
London, England) was used to segment the voxels into gray
matter, white matter, and cerebrospinal fluid percentages.
Imaging analyses for both DTI and MRS measures were
performed with the disease status of the subject blinded.
Figure 1. Diffusion tractography and voxel placement with resulting
magnetic resonance spectra. Images showing diffusion tractography
of the corticospinal tract in the sagittal (A) and coronal projections
(B). Voxel placement for magnetic resonance spectroscopy of the
motor cortex region in the sagittal (C) and axial (D) projections (F).
Representative magnetic resonance spectroscopy spectrum from the
motor cortex of an ALS subject using PRESS (E) and MEGA-PRESS
editing technique (F).
Statistical analyses
Stata v.11 (StataCorp, College Station, TX) was used for
the statistical analysis. Using scanner type (Achieva or
Ingenia) as a covariate, logistic regression analyses were
performed between disease status and individual FA and
metabolite values. Distribution of the data was evaluated
using the Shapiro-Wilk test. Differences in FA and brain
metabolite values were determined using two-tailed inde-
pendent sample t-test between ALS patients and HCs. A
post hoc analysis was performed comparing gray matter
and white matter percentages after normalizing to cerebrospinal fluid percentage between ALS patients and HCs
using an independent sample t-test. Associations between
the MRI measures (MRS and DTI) and clinical status
(revised Amyotrophic Lateral Sclerosis Functional Rating
ª 2014 The Authors. Annals of Clinical and Translational Neurology published by Wiley Periodicals, Inc on behalf of American Neurological Association.
109
Multimodal MRI as a Diagnostic Biomarker for ALS
Scale [ALSFRS-R], disease duration, average UMN score
and contralateral UMN score) were performed using
Pearson correlations. The generalized linear model command in Stata, incroc, was used to generate and compare
the receiver operating characteristic (ROC) curves and the
area under the ROC curves (AUC) for the different models using leave-one-out cross-validation analysis and bootstrapping. The two models were (1) DTI FA alone
(Model 1), and (2) DTI FA + MRS NAA + MRS
mI + MRS GABA (Model 2). Scanner type was also
included as a categorical variable in each model. The
optimal cut point to generate the sensitivity and specificity was determined using the Youden index, which places
equal weight to sensitivity and specificity measures.
Results
B. R. Foerster et al.
0.49 IU; P = 0.008). Myo-inositol levels in the left MC
were higher in ALS patients (3.71 Æ 0.67 IU) compared to
HCs (3.14 Æ 0.43 IU; P < 0.001). GABA levels in the MC
were lower in ALS patients (1.45 Æ 0.30 IU) compared to
HCs (1.72 Æ 0.34 IU; P = 0.002). Results are presented in
Figure 2.
Riluzole treatment subanalyses showed that there were
significantly higher NAA levels and FA levels in riluzolena€ıve patients with ALS compared to riluzole-treated
patients with ALS (P = 0.007 and P = 0.03, respectively).
There were no significant differences in mI levels or
GABA levels between the riluzole-na€ıve patients with ALS
and riluzole-treated patients with ALS. There were significant correlations between the MC GABA and disease
duration (r = À0.39, P = 0.05), MC NAA and ALSFRS-R
score (r = 0.39, P < 0.05), DTI FA and ALSFRS-R score
(r = 0.46, P < 0.05).
Group level imaging measures
DTI FA data and conventional MRS data were obtained
from all subjects. For the MEGA-PRESS acquisition,
GABA spectra in the MC of two ALS patients and one
HC had inadequate signal-to-noise ratio. There were no
significant effects of MRI scanner type for the MRS or
DTI FA values (Z > 0.05 for all). There were no significant differences between gray matter and white matter
percentages between the ALS patients and HCs
(P > 0.05). The data for the MRS and DTI FA were normally distributed (P > 0.05 for all).
FA levels were lower in ALS patients (mean Æ SD
0.534 Æ 0.028) compared to HCs (0.569 Æ 0.022;
P < 0.001). NAA levels in the left MC were lower in ALS
patients (7.70 Æ 0.83 IU) compared to HCs (8.20 Æ
ROC and AUC
Figure 3 shows the ROC curve for DTI FA (Model 1)
and DTI FA + MRS NAA + MRS mI + MRS GABA
(Model 2). The AUC for Model 1 was 0.81 (95% CI:
0.70–0.93) and the AUC for Model 2 was significantly
higher with a value of 0.93 (95% CI: 0.87–0.99;
P = 0.05). Scanner type was not a significant covariate in
Model 1 (P > 0.05) or Model 2 (P > 0.05).
Sensitivity, specificity, and predictive values
Sensitivity and specificity of Model 1 were 0.86 and 0.70,
respectively. Sensitivity and specificity of Model 2 were
0.93 and 0.85, respectively. For Model 1, the positive
Figure 2. Decreased fractional anisotropy (FA), decreased N-acetylaspartate (NAA), increased myo-inositol (mI), and decreased c-aminobutyric
acid (GABA) levels in amyotrophic lateral sclerosis (ALS) patients. Circles represent respective values of FA in the corticospinal tract (A), NAA in the
left motor cortex (B), mI in the left motor cortex (C), and GABA levels in the left motor cortex (D) for individual ALS patients and healthy controls
(HC). Horizontal bars indicate the mean. IU, institutional units.
110
ª 2014 The Authors. Annals of Clinical and Translational Neurology published by Wiley Periodicals, Inc on behalf of American Neurological Association.
B. R. Foerster et al.
Multimodal MRI as a Diagnostic Biomarker for ALS
disease pretest probabilities for the two models are presented in Figure 4.
Discussion
Figure 3. Significant increase in diagnostic accuracy combining
magnetic resonance spectroscopy (MRS) and diffusion tensor imaging
(DTI) measures. Receiver operating characteristic (ROC) curves
comparing DTI diagnostic test accuracy model to combined DTI and
MRS model. Solid ROC curve represents the model using DTI
fractional anisotropy values. Dashed ROC curve represents the model
using DTI fractional anisotropy, MRS N-acetylaspartate, MRS myoinositol, and MRS c-aminobutyric acid values combined.
likelihood ratio was 2.87 and the negative likelihood ratio
was 0.20. For Model 2, the positive likelihood ratio was
6.20 and the negative likelihood ratio was 0.08. Using
Bayesian methods, the posttest probabilities of disease
after negative and positive test results using different
By combining MRS measures with DTI FA values, we
demonstrate a statistically significant improvement in the
diagnostic accuracy in distinguishing between ALS
patients with well-established disease and HCs, with a relatively high AUC value of 0.93. Furthermore, the combination of MRS and DTI measures results in improved
positive and negative likelihood ratios. These findings
support addition of relevant metabolite concentrations
from MRS to FA values derived from DTI, so that
together these MRI-generated parameters can provide a
potentially useful noninvasive biomarker for ALS.
The posttest probability graph helps to place our results
in clinical context (Fig. 4). For an individual with an ALS
pretest probability of 0.50, the posttest probability of ALS
is 0.74 using the DTI FA measure only and 0.86 when
combining DTI and MRS measures with a positive test
result. Using the same pretest probability of 0.50, the
posttest probability of ALS is 0.17 using the DTI FA measure only and 0.08 when combining DTI and MRS measures with a negative test result. We chose to use the
Youden index rather than the point on the ROC curve
closest to (0, 1), as the Youden index has been shown to
maximize the overall correct classification rate.28 It is
Figure 4. Posttest probabilities using diffusion tensor imaging (DTI) only and diffusion tensor imaging combined with magnetic resonance
spectroscopy (MRS). Posttest probabilities for imaging results for each of the two models using hypothetical populations with different pretest
disease probabilities. Model 1 used the DTI fractional anisotropy values only. Model 2 uses the DTI fractional anisotropy combined with MRS Nacetylaspartate, MRS myo-inositol and MRS c-aminobutyric acid values.
ª 2014 The Authors. Annals of Clinical and Translational Neurology published by Wiley Periodicals, Inc on behalf of American Neurological Association.
111
Multimodal MRI as a Diagnostic Biomarker for ALS
important to mention that leave-one-out cross-validation
statistical analysis was implemented to avoid overfitting
of the model and subsequent overestimation of diagnostic
accuracy.
A large number of DTI and MRS studies have been
performed that have investigated differences in DTI measures and brain metabolites in the setting of ALS including a number of studies that have included both DTI and
MRS acquisitions.29–33 Although a few of these studies
have evaluated the potential diagnostic utility of either
DTI or MRS,32,33 the combination of these two advanced
neuroimaging techniques for diagnostic accuracy has not
been investigated. There have been recent ALS publications that have combined DTI with other advanced MR
techniques including resting state fMRI34 and voxel-based
morphometry measures35 with encouraging disease discrimination results. Combining multiple MRI methods to
improve disease classification has also been applied in
other neurodegenerative diseases. For example, a multivariate analysis approach has been applied to Alzheimer’s
disease using a combination of MRS and MRI volumetric
metrics to increase diagnostic accuracy and resulted in a
sensitivity of 0.97 and a specificity of 0.94.36
We focused our MRS measures to include NAA, a
measure of neuronal integrity, mI, a glial cell marker, and
GABA, the major inhibitory neurotransmitter in the central nervous system, based on the significant differences
between ALS patients and HCs. Our findings of decreased
NAA and increased mI are in accord with other published
studies.37–40 Our findings of reduced GABA levels in the
MC are supported by other indirect evidence of decreased
cortical inhibition in ALS, including an ALS animal
model, as well as human histochemical, positron emission
tomography, and transcranial magnetic stimulation studies.41–44 For the DTI measures, we chose to focus on FA
as this is the most commonly altered DTI measure in the
ALS literature.16
This study constitutes a critical early step in the development and evaluation of diagnostic testing, in this case
a multimodal MRI approach for the evaluation of ALS
patients. In this study, we are establishing the performance of our testing algorithm to differentiate between
patients with well-established disease compared to HC
subjects. The effectiveness of the diagnostic testing algorithm among these cohorts lays the groundwork for the
subsequent phases of diagnostic test development and validation which include incorporating diseased subjects
with varying severity of disease (Phase 2b) as well as subjects who are only suspected of having the disease (Phase
2c).18,45
As in most ALS imaging studies, our cohort predominately consisted of patients with later stage disease, which
could accentuate effect sizes of the DTI and MRS altera-
112
B. R. Foerster et al.
tions, specifically the observed changes in mI.46 Nevertheless, this approach is important in the proof-of-concept
stage. This study represents an early, but necessary, evaluation of a new diagnostic algorithm according to the
standard methodology of technology assessment over its
lifespan. This imaging study uses one of the larger cohorts
of ALS patients reported to date. However, future diagnostic evaluation studies using multimodal MRI will benefit from including ALS patients with earlier disease
stages as well as a wider spectrum of disease, to decrease
spectrum bias. Longitudinal studies in patients with suspected ALS, based on clinical and functional markers,
using the proposed imaging algorithm will need to be
conducted to determine the sensitivity of the algorithm to
changes in clinical and functional status and to assess rate
of disease conversion to definite ALS. If information from
these more extensive studies suggests a correlation
between imaging measures and disease severity, the
potential of multimodal MR imaging as a prognostic
marker can be also evaluated in a longitudinal setting.
Limitations of this study include the potential contributions from macromolecules with similar coupling properties to the GABA signal at 3 ppm. Due to time
considerations, this study only implemented 15-direction
DTI acquisition that has been shown to add variability to
the FA results compared to 20 or more direction DTI
acquisitions.47 A longitudinal trial enrolling ALS patients
prior to initiation of therapy is required to assess the
effect of riluzole treatment on the measured MRI metrics.
We also did not include subjects with diseases that can
mimic ALS, such as multifocal motor neuropathy, which
would be helpful in validating the specificity of the MRS
and DTI metrics.
In conclusion, adding MRS measures to DTI FA measures leads to significantly increased diagnostic accuracy
in distinguishing ALS patients with well-established disease from HCs. This corresponds to a successful Phase 2a
trial in the established algorithm of diagnostic test development. As such, this provides the foundation for Phase
2b and 2c trials, that is, assessing whether the combined
MRS-DTI measures are related to severity of disease and
evaluating test accuracy performance in subjects with suspected disease. Additional research efforts and multicenter
diagnostic trial evaluations are needed to optimize imaging protocols, validate diagnostic accuracy across a clinically representative disease spectrum, and to understand
whether these techniques can discriminate between ALS
and diseases that mimic ALS.
Acknowledgments
This study was funded by the A. Alfred Taubman Medical
Research Institute. The authors thank MR senior research
ª 2014 The Authors. Annals of Clinical and Translational Neurology published by Wiley Periodicals, Inc on behalf of American Neurological Association.
B. R. Foerster et al.
technologist Suzan Lowe for her assistance in imaging
data acquisition. Carlos has served as a consultant for
Philips Healthcare. Barker is a consultant for Olea Medical, Marseille, France. The authors have no other relationships that might lead to a perceived conflict of interest.
Conflict of Interest
None declared.
References
1. Eisen A, Schulzer M, MacNeil M, et al. Duration of
amyotrophic lateral sclerosis is age dependent. Muscle
Nerve 1993;16:27–32.
2. Brooks BR, Miller RG, Swash M, Munsat TL. El Escorial
revisited: revised criteria for the diagnosis of amyotrophic
lateral sclerosis. Amyotroph Lateral Scler Other Motor
Neuron Disord 2000;1:293–299.
3. Zoccolella S, Beghi E, Palagano G, et al. Predictors of delay
in the diagnosis and clinical trial entry of amyotrophic
lateral sclerosis patients: a population-based study. J
Neurol Sci 2006;250:45–49.
4. Househam E, Swash M. Diagnostic delay in amyotrophic
lateral sclerosis: what scope for improvement? J Neurol Sci
2000;180:76–81.
5. Kraemer M, Buerger M, Berlit P. Diagnostic problems and
delay of diagnosis in amyotrophic lateral sclerosis. Clin
Neurol Neurosurg 2010;112:103–105.
6. Turner MR, Kiernan MC, Leigh PN, Talbot K. Biomarkers in
amyotrophic lateral sclerosis. Lancet Neurol 2009;8: 94–109.
7. Bowser R, Turner MR, Shefner J. Biomarkers in
amyotrophic lateral sclerosis: opportunities and limitations.
Nat Rev Neurol 2011;7:631–638.
8. Eisen A, Swash M. Clinical neurophysiology of ALS. Clin
Neurophysiol 2001;112:2190–2201.
9. Cheung G, Gawel MJ, Cooper PW, et al. Amyotrophic
lateral sclerosis: correlation of clinical and MR imaging
findings. Radiology 1995;194:263–270.
10. Comi G, Rovaris M, Leocani L. Review neuroimaging in
amyotrophic lateral sclerosis. Eur J Neurol 1999;6:629–637.
11. Hofmann E, Ochs G, Pelzl A, Warmuth-Metz M. The
corticospinal tract in amyotrophic lateral sclerosis: an MRI
study. Neuroradiology 1998;40:71–75.
12. Turner MR, Agosta F, Bede P, et al. Neuroimaging in
amyotrophic lateral sclerosis. Biomark Med 2012;6:319–337.
13. Turner MR, Kiernan MC. Does interneuronal dysfunction
contribute to neurodegeneration in amyotrophic lateral
sclerosis? Amyotroph Lateral Scler 2012;13:245–250.
14. Foerster BR, Callaghan BC, Petrou M, et al. Decreased
motor cortex gamma-aminobutyric acid in amyotrophic
lateral sclerosis. Neurology 2012;78:1596–1600.
15. Foerster BR, Pomper MG, Callaghan BC, et al. An
imbalance between excitatory and inhibitory
Multimodal MRI as a Diagnostic Biomarker for ALS
neurotransmitters in amyotrophic lateral sclerosis revealed
by use of 3-T proton magnetic resonance spectroscopy.
JAMA Neurol 2013;24:1–8.
16. Foerster BR, Dwamena BA, Petrou M, et al. Diagnostic
accuracy using diffusion tensor imaging in the diagnosis of
ALS: a meta-analysis. Acad Radiol 2012;19:1075–1086.
17. Foerster BR, Dwamena BA, Petrou M, et al. Diagnostic
accuracy of diffusion tensor imaging in amyotrophic
lateral sclerosis: a systematic review and individual
patient data meta-analysis. Acad Radiol 2013;20:
1099–1106.
18. Gluud C, Gluud LL. Evidence based diagnostics. BMJ
2005;330:724–726.
19. Bohannon RW, Smith MB. Interrater reliability of a
modified Ashworth scale of muscle spasticity. Phys Ther
1987;67:206–207.
20. Turner MR, Cagnin A, Turkheimer FE, et al. Evidence of
widespread cerebral microglial activation in amyotrophic
lateral sclerosis: an [11C](R)-PK11195 positron
emission tomography study. Neurobiol Dis 2004;15:
601–609.
21. Ellis CM, Simmons A, Jones DK, et al. Diffusion tensor
MRI assesses corticospinal tract damage in ALS. Neurology
1999;53:1051–1058.
22. Moore SR, Gresham LS, Bromberg MB, et al. A self report
measure of affective lability. J Neurol Neurosurg
Psychiatry 1997;63:89–93.
23. Mori, S, Wakana, S, Van Zijl PCM. MRI atlas of human
white matter. 1st ed. Amsterdam, The Netherlands; San
Diego, CA: Elsevier, 2004.
24. Yousry TA, Schmid UD, Alkadhi H, et al. Localization of
the motor hand area to a knob on the precentral gyrus.
A new landmark. Brain 1997;120(Pt 1):141–157.
25. Mescher M, Merkle H, Kirsch J, et al. Simultaneous in
vivo spectral editing and water suppression. NMR Biomed
1998;11:266–272.
26. Provencher SW. Estimation of metabolite concentrations
from localized in vivo proton NMR spectra. Magn Reson
Med 1993;30:672–679.
27. Stagg CJ, Best JG, Stephenson MC, et al. Polarity-sensitive
modulation of cortical neurotransmitters by transcranial
stimulation. J Neurosci 2009;29:5202–5206.
28. Perkins NJ, Schisterman EF. The inconsistency of
“optimal” cutpoints obtained using two criteria based on
the receiver operating characteristic curve. Am J Epidemiol
2006;163:670–675.
29. Wang S, Poptani H, Woo JH, et al. Amyotrophic lateral
sclerosis: diffusion-tensor and chemical shift MR imaging
at 3.0 T. Radiology 2006;239:831–838.
30. Mitsumoto H, Ulug AM, Pullman SL, et al. Quantitative
objective markers for upper and lower motor neuron
dysfunction in ALS. Neurology 2007;68:1402–1410.
31. Nelles M, Block W, Traber F, et al. Combined 3T
diffusion tensor tractography and 1H-MR spectroscopy in
ª 2014 The Authors. Annals of Clinical and Translational Neurology published by Wiley Periodicals, Inc on behalf of American Neurological Association.
113
Multimodal MRI as a Diagnostic Biomarker for ALS
32.
33.
34.
35.
36.
37.
38.
114
motor neuron disease. AJNR Am J Neuroradiol
2008;29:1708–1714.
Pyra T, Hui B, Hanstock C, et al. Combined structural
and neurochemical evaluation of the corticospinal tract in
amyotrophic lateral sclerosis. Amyotroph Lateral Scler
2010;11:157–165.
Lombardo F, Frijia F, Bongioanni P, et al. Diffusion tensor
MRI and MR spectroscopy in long lasting upper motor
neuron involvement in amyotrophic lateral sclerosis. Arch
Ital Biol 2009;147:69–82.
Douaud G, Filippini N, Knight S, et al. Integration of
structural and functional magnetic resonance imaging in
amyotrophic lateral sclerosis. Brain 2011;134(Pt 12):3470–
3479.
Filippini N, Douaud G, Mackay CE, et al. Corpus
callosum involvement is a consistent feature of
amyotrophic lateral sclerosis. Neurology 2010;75:1645–
1652.
Westman E, Wahlund LO, Foy C, et al. Magnetic
resonance imaging and magnetic resonance spectroscopy
for detection of early Alzheimer’s disease. J Alzheimers Dis
2011;26(Suppl. 3):307–319.
Agosta F, Chio A, Cosottini M, et al. The present and the
future of neuroimaging in amyotrophic lateral sclerosis.
AJNR Am J Neuroradiol 2010;31:1769–1777.
Block W, Karitzky J, Traber F, et al. Proton magnetic
resonance spectroscopy of the primary motor cortex in
patients with motor neuron disease: subgroup analysis
and follow-up measurements. Arch Neurol 1998;55:931–
936.
B. R. Foerster et al.
39. Bowen BC, Pattany PM, Bradley WG, et al. MR imaging
and localized proton spectroscopy of the precentral gyrus
in amyotrophic lateral sclerosis. AJNR Am J Neuroradiol
2000;21:647–658.
40. Kalra S, Hanstock CC, Martin WR, et al. Detection of
cerebral degeneration in amyotrophic lateral sclerosis using
high-field magnetic resonance spectroscopy. Arch Neurol
2006;63:1144–1148.
41. Nieto-Gonzalez JL, Moser J, Lauritzen M, et al. Reduced
GABAergic inhibition explains cortical hyperexcitability in
the wobbler mouse model of ALS. Cereb Cortex
2011;21:625–635.
42. Petri S, Krampfl K, Hashemi F, et al. Distribution of
GABAA receptor mRNA in the motor cortex of ALS
patients. J Neuropathol Exp Neurol 2003;62:1041–1051.
43. Turner MR, Osei-Lah AD, Hammers A, et al. Abnormal
cortical excitability in sporadic but not homozygous D90A
SOD1 ALS. J Neurol Neurosurg Psychiatry 2005;76:1279–
1285.
44. Vucic S, Kiernan MC. Novel threshold tracking techniques
suggest that cortical hyperexcitability is an early feature
of motor neuron disease. Brain 2006;129(Pt 9):2436–2446.
45. Sackett DL, Haynes RB. The architecture of diagnostic
research. BMJ 2002;324:539–541.
46. van der Graaff MM, Lavini C, Akkerman EM, et al. MR
spectroscopy findings in early stages of motor neuron
disease. AJNR Am J Neuroradiol 2010;31:1799–1806.
47. Jones DK. The effect of gradient sampling schemes on
measures derived from diffusion tensor MRI: a Monte
Carlo study. Magn Reson Med 2004;51:807–815.
ª 2014 The Authors. Annals of Clinical and Translational Neurology published by Wiley Periodicals, Inc on behalf of American Neurological Association.


© Copyright 2026