
Annual epidemiological report - ECDC
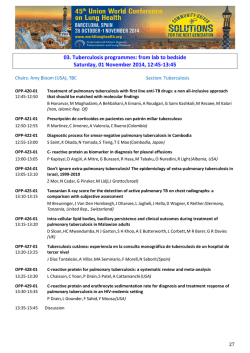
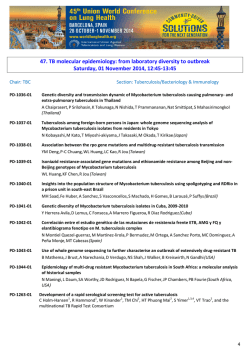
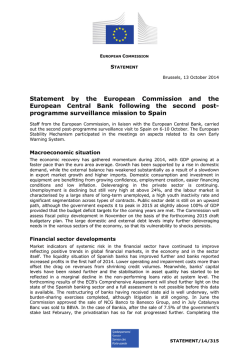
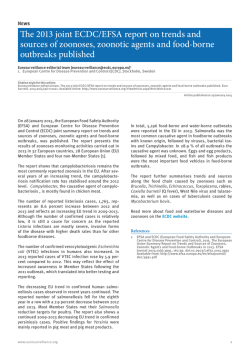
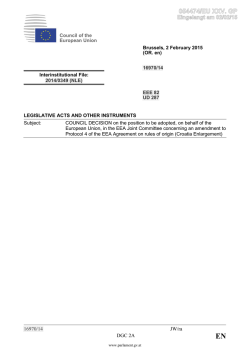
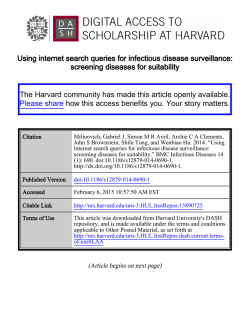
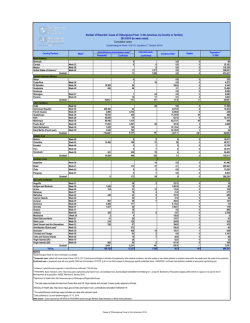
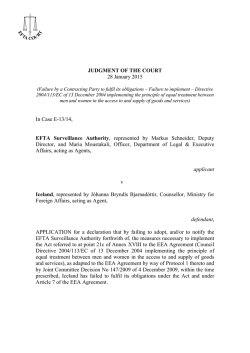
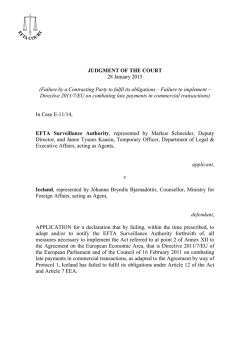
SURVEILLANCE REPORT
Annual epidemiological report
Respiratory tract infections – tuberculosis
2014
www.ecdc.europa.eu
ECDC SURVEILLANCE REPORT
Annual epidemiological report
Respiratory tract infections - tuberculosis
2014
This report of the European Centre for Disease Prevention and Control (ECDC) was coordinated by Catalin Albu,
Sergio Brusin, Joanna Gomes Dias and Bruno Ciancio.
Contributing authors
Vahur Hollo, Csaba Ködmön and Phillip Zucs.
In order to facilitate more timely publication, this year’s edition of the Annual Epidemiological Report is being first
published a disease group at a time and will later be compiled into one comprehensive report. This report presents
the epidemiological situation for tuberculosis as of 2012. Other respiratory tract infections are dealt with in a
separate section of Chapter 2.1, available at http://www.ecdc.europa.eu/en/publications/Publications/Respiratorytract-infections-annual-epidemiological-report-2014.pdf.
Suggested citation: European Centre for Disease Prevention and Control. Annual epidemiological report 2014 –
Respiratory tract infections - tuberculosis. Stockholm: ECDC; 2015.
Stockholm, January 2015
© European Centre for Disease Prevention and Control, 2015
Reproduction is authorised, provided the source is acknowledged
ii
SURVEILLANCE REPORT
Annual epidemiological report 2014 – respiratory tract infections - tuberculosis
Contents
Abbreviations ............................................................................................................................................... iv
Introduction ..................................................................................................................................................1
A note to the reader..................................................................................................................................1
Description of methods .............................................................................................................................2
Data sources: indicator-based surveillance (disease cases) .......................................................................2
Data sources: event-based surveillance ..................................................................................................2
Data analysis ........................................................................................................................................3
Data protection ....................................................................................................................................5
Respiratory tract infections - tuberculosis .........................................................................................................6
Epidemiological situation in 2012 ...........................................................................................................6
Age and gender distribution ...................................................................................................................8
Enhanced surveillance in 2012 ...............................................................................................................8
Discussion .......................................................................................................................................... 11
Surveillance systems overview ............................................................................................................. 12
References ......................................................................................................................................... 13
Figures
Figure 1. Rates of reported TB cases by country, EU/EEA, 2012 .........................................................................8
Figure 2. Rates of confirmed reported TB cases by age and gender, EU/EEA, 2012 ..............................................8
Figure 3. Proportion of confirmed cases among all reported TB cases, EU/EEA, 2012 ...........................................9
Tables
Table 1. Numbers and rates of total reported TB cases, EU/EEA, 2008-2012 .......................................................7
Table 2. Number and percentage of reported MDR and XDR TB cases, EU/EEA, 2012 ........................................ 11
iii
Annual epidemiological report 2014 – respiratory tract infections - tuberculosis
Abbreviations
AFB
ASR
DST
EWRS
EU/EEA
IHR
MDR TB
TB
TESSy
WHO
XDR TB
iv
Acid-fast bacilli
Age-standardised rate
Drug susceptibility testing
Early Warning and Response System
European Union/European Economic Area
International Health Regulations
Multidrug-resistant tuberculosis
Tuberculosis
The European Surveillance System
World Health Organization
Extensively drug-resistant tuberculosis
SURVEILLANCE REPORT
SURVEILLANCE REPORT
Annual epidemiological report 2014 – respiratory tract infections - tuberculosis
Introduction
A note to the reader
The Annual Epidemiological Report 2014 gives an overview of the epidemiology of communicable diseases of public
health significance in Europe, drawn from surveillance information on the 52 communicable diseases and health
issues for which surveillance is mandatory in the European Union (EU) and European Economic Area (EEA)
countries. i ii iii iv
In order to facilitate more timely publication, this year’s edition of the Annual Epidemiological Report is being first
published a disease group at a time and will later be compiled into one comprehensive report. This report presents
the epidemiological situation for respiratory tract infections - tuberculosis as of 2012 and describes the statistical
and epidemiological methods used.
Produced annually, the report is intended for policymakers and health sector leaders, epidemiologists, scientists
and the wider public. It is hoped that readers will find it a useful overview and reference to better understand the
present situation in relation to communicable diseases in Europe. It should also usefully assist policymakers and
health leaders in making evidence-based decisions to plan and improve programmes, services and interventions for
preventing, managing and treating these diseases.
This year’s edition of the report draws on surveillance data for 2012, submitted by Member States to the European
Surveillance System. The report gives an outline description of the epidemiology for each disease, in a standard
format, covering the years 2008–2012. In addition, updates from epidemic intelligence in relation to emerging
public health threats for 2013 are given, by disease as relevant. Information on these is either directly reported to
ECDC through Member State notifications on the Early Warning and Response System (EWRS), according to
defined criteria v, or found through active screening of various sources, including national epidemiological bulletins
and international networks, and various additional formal and informal sources. In-depth reviews of the
epidemiology of particular diseases (e.g. tuberculosis, HIV) or disease groups (e.g. food- and waterborne diseases)
are published separately, sometimes in collaboration with other European agencies or the World Health
Organization’s Regional Office for Europe. These are referenced, for convenience, with the description of each
disease. In addition, further information relating to most of the diseases reported here is available on the ECDC
website health topics pages at http://ecdc.europa.eu/en/healthtopics.
The reader will appreciate that most surveillance systems capture only a proportion of the cases occurring in their
countries. Some cases of disease remain undiagnosed (‘under-ascertainment’), and some are diagnosed but not
reported to public health authorities (‘underreporting’). The pattern of this under-ascertainment and
underreporting varies by disease and country, involving a complex mix of healthcare-seeking behaviour, access to
health services, availability of diagnostic tests, reporting practices by doctors and others, and the operation of the
surveillance system itself.
The direct comparison of disease rates between countries should therefore be undertaken with caution. The reader
should be aware that in most cases, differences in case rates reflect not only differences in the occurrence of the
disease, but also in systematic differences in health and surveillance systems as described here.
i
2000/96/EC: Commission Decision of 22 December 1999 on the communicable diseases to be progressively covered by the
Community network under Decision No 2119/98/EC of the European Parliament and of the Council. Official Journal, OJ L 28,
03.02.2000, p. 50–53.
ii
2003/534/EC: Commission Decision of 17 July 2003 amending Decision No 2119/98/EC of the European Parliament and of the
Council and Decision 2000/96/EC as regards communicable diseases listed in those decisions and amending Decision
2002/253/EC as regards the case definitions for communicable diseases. Official Journal, OJ L 184, 23.07.2003, p. 35–39.
iii
2007/875/EC: Commission Decision of 18 December 2007 amending Decision No 2119/98/EC of the European Parliament and
of the Council and Decision 2000/96/EC as regards communicable diseases listed in those decisions. Official Journal, OJ L 344,
28.12.2007, p. 48–49.
iv
Commission Decision 2119/98/EC of the Parliament and of the Council of 24 September 1998 setting up a network for the
epidemiological surveillance and control of communicable diseases in the Community. Official Journal, OJ L 268, 03/10/1998 p. 1-7.
v
2009/547/EC: Commission Decision of 10 July 2009 amending Decision No 2000/57/EC on the early warning and response
system for the prevention and control of communicable diseases under the Decision No 2119/98/EC of the European Parliament
and of the Council. Official Journal, OJ L 181, 14.07.2009 p. 57-60.
1
Annual epidemiological report 2014 – respiratory tract infections - tuberculosis
SURVEILLANCE REPORT
Each year, we observe improvements in the harmonisation of systems, definitions, protocols and data at Member
State and EU levels. Nevertheless, data provided by the Member States continue to show a number of
inconsistencies. In several situations, the quality and comparability of the data are not optimal, and more work is
planned, in conjunction with Member States, to see how best to improve this situation.
This report aims to be consistent with previously published ECDC surveillance reports for 2012 relating to specific
diseases and disease groups. However, Member States update their data continually and a number have made specific
corrections for this report, including corrections to data reported for earlier years. Accordingly, some minor differences
will be seen when comparing the data in this report to previous Annual Epidemiological and disease-specific reports.
Description of methods
Data sources: indicator-based surveillance (disease cases)
All EU Member States and three EEA countries (Iceland, Liechtenstein and Norway) send information at least annually
from their surveillance systems to ECDC relating to occurrences of cases of the 52 communicable diseases and health
issues under mandatory EU-wide surveillance. Reports are sent according to case definitions established by the EU i.
Data upload by Member States occurs continually throughout the year. In conjunction with annual ECDC reports
for particular diseases or disease groups, and the consolidated annual report, ECDC issues ‘data calls,’ with
specified end dates, to facilitate accurate and up-to-date submission of data for the previous calendar year.
The information submitted by Member States to ECDC is defined through a ‘metadataset’ for each disease under
surveillance. The metadataset includes the case classification for the disease (particularly whether the case is
confirmed or probable) according to official case definitions as determined by the European Commission. It also
defines the information to be included with each case report. Most data are submitted as anonymised individual
case data, but aggregated data are reported by some Member States for some diseases. Countries actively report
zero cases for particular diseases, as applicable.
Data are uploaded and validated by the Member States using ECDC’s online system for the collection of
surveillance data, the European Surveillance System (TESSy). Member States’ information specialists transform the
data in their surveillance systems into an appropriate format before uploading to TESSy. System reports generated
by TESSy allow Member States to review uploaded data and to make modifications where necessary. TESSy
performs automatic validation and additional data validation is conducted by ECDC staff, in liaison with designated
disease experts and epidemiologists in the Member States. Once the draft report is produced, it is sent to Member
States’ National Surveillance Coordinators for final validation. Any final corrections are uploaded to TESSy.
For each disease under surveillance, TESSy also holds a description of the key attributes of the surveillance systems
for that disease in each Member State. This information is included in the report to aid the interpretation of
surveillance data for each reported disease. Member States are asked to verify and update this information each year.
Data sources: event-based surveillance
The report also presents information relating to health threats identified by ECDC through epidemic intelligence
activities, from formal and validated informal sources. These threats are documented and monitored by using a
dedicated database, called the Threat Tracking Tool (TTT). Data analysed in this report are extracted from the TTT
and the EWRS database. The analysis of monitored threats covers the period from the activation of the TTT in
June 2005 until the end of 2013; EWRS entries are covered from January 2005 to the end of 2013.
The expression ‘opening a threat’ refers to the way ECDC assesses threats during its daily threat review meetings. ECDC
experts evaluate potential threats and validate events requiring further attention or action from ECDC, based on their
relevance to public health or the safety of EU citizens. The following criteria are used to open a threat and further
monitor an event:
•
•
•
•
•
•
•
i
more than one Member State is affected
a disease is new or unknown, even if there are no cases in the EU
there is a request from a Member State or from a third party for ECDC to deploy a response team
there is a request for ECDC to prepare a risk assessment of the situation
there is a documented failure in an effective control measure (vaccination, treatment or diagnosis)
there is a documented change in the clinical/epidemiological pattern of the disease, including changes in
disease severity, mode of transmission, etc.
the event matches any of the criteria under the International Health Regulations (IHR) or EWRS.
2002/253/EC: Commission Decision of 19 March 2002 laying down case definitions for reporting communicable diseases to the
Community network under Decision No 2119/98/EC of the European Parliament and of the Council. Official Journal, OJ L 86,
03.04.2002, p. 44–62.
2
SURVEILLANCE REPORT
Annual epidemiological report 2014 – respiratory tract infections
Events are considered relevant to be reported to the EWRS if one or more of the criteria below are met. After the
revised International Health Regulations (IHR) entered into force on 15 June 2007, the decision was amended, and
criteria now include both IHR notifications and the need to exchange details following contact tracing i.
The Commission Decision on serious cross-border threats to health ii; ‘lays down rules on epidemiological
surveillance, monitoring, early warning of, and combating serious cross border threats to health, including
preparedness and response planning related to those activities, in order to coordinate and complement national
policies’.
With reference to this Decision, the following criteria are applied for reporting to the EWRS:
•
•
•
•
•
•
outbreaks of communicable diseases extending to more than one EU Member State
spatial or temporal clustering of cases of a disease of a similar type if pathogenic agents are a possible
cause and there is a risk of propagation between Member States within the Union
spatial or temporal clustering of cases of disease of a similar type outside the EU if pathogenic agents are a
possible cause and there is a risk of propagation to the Union
the appearance or resurgence of a communicable disease or an infectious agent which may require timely
coordinated EU action to contain it
any IHR notification (also reported through EWRS)
any event related to communicable diseases with a potential EU dimension necessitating contact tracing to
identify infected persons or persons potentially in danger, which may involve the exchange of sensitive
personal data of confirmed or suspected cases between concerned Member States.
Data analysis
General principles
All analyses are based on confirmed cases where possible. For some diseases, some Member States do not
distinguish confirmed from other cases; in these situations, total case reports from these countries are used in the
analyses and the country concerned is identified in a footnote to the summary table. For some diseases (e.g.
tuberculosis, Legionnaires’ disease), confirmed cases are defined on a specific basis, described in the relevant
sections. For other diseases the reporting of only confirmed cases would result in a severe underestimation of the
true disease burden, hence both probable and confirmed cases are reported. The ‘month’ variable used in the
seasonality analyses is based on the date that the country chooses as its preferred date for reporting. This could
be either date of onset of disease, date of diagnosis, date of notification, or some other date at the country’s
discretion.
Population data
Population data for the calculation of rates are obtained from Eurostat, the statistical office of the EU. Data for
overall calculations are extracted from the Eurostat database ‘Demographic balance and crude rates’
(DEMO_PJAN). The population as of 1 January of each year is used. Totals per year and per country are available
for all countries for 2012. For calculation of age- and gender-specific rates, the data are aggregated into the
following age groups for the analyses: 0–4, 5–14, 15–24, 25–44, 45–64 and ≥65 years.
Presentation of analyses
The descriptive epidemiology for each disease is set out as a summary table by country and supplementary figures
describing overall epidemiology at EU/EEA level. These include the trend for reported confirmed cases from 2007–
12, age- and gender-specific rates, and occurrence by month (‘seasonality’), if relevant. Additional graphs, figures
and maps are used where necessary to illustrate other important aspects of the disease epidemiology in the EU
and EEA.
Sum m ary table
The summary table for each disease indicates whether the country data were reported from a surveillance system
with national or lesser geographical area of coverage. The table also indicates what type of data the country
submitted: case based (‘C’), aggregated (‘A’) data or data submitted to a disease-specific network (‘D’).
Commission Decision of 10 July 2009 amending Decision No 2000/57/EC on the early warning and response system for the
prevention and control of communicable diseases under the Decision No 2119/98/EC of the European Parliament and of the
Council, in Official Journal of the European Union. 2009. p. L 181: 57-9.
i
Commission Decision 1082/2013/EU, of 5th November 2013 of the European Parliament and the Council of 22 October 2013 on
serious cross-border threats to health.in Official Journal of the European Union 2013.p.L293:1-15.
ii
3
Annual epidemiological report 2014 – respiratory tract infections - tuberculosis
SURVEILLANCE REPORT
This table presents an overview of the number and rates (including age-standardised rates) of confirmed cases or
total cases depending on the disease reported by the Member States surveillance systems for the period 2008–12.
The total number of reported cases (independent of case classification) for 2012 is also shown. Confirmed case
rates are given per 100 000 persons (the number of reported confirmed cases divided by the official Eurostat
estimate of the population for that year multiplied by 100 000). Countries that made no report for a disease are
excluded from the calculation for overall European rates for that disease. Country reports from systems with less
than national coverage (e.g. where only some regions of the country report nationally) are also excluded from
calculation of overall EU case rates.
Age-standardised rates (ASR) are calculated to facilitate comparisons between countries by adjusting for
differences with respect to certain underlying population characteristics such as age. ASRs were calculated when
the EU/EEA rate exceeds 1 per 100 000 population and are given per 100 000 persons. ASRs were calculated using
the direct method according to the following formula:
∑ (r p )
6
i
ASR =
i
i =1
6
∑p
i =1
i
where ri is the specific rate for the age group i in the population being studied, and pi is the population of age
group i in the standard population. The standard population considered in this report was based on the average
population of the EU27 Member States for the period 2001–2010 (Table). This standard population was defined to
reflect the current age structure of Europe.
Age group
Standard population
0–4
25 506 062
5–14
54 043 285
15–24
62 075 051
25–44
143 411 393
45–64
124 427 054
65+
81 889 316
Total
491 352 161
Aspects of descriptive epidem iology at EU/ EEA level
The descriptive epidemiology for each disease for the EU and EEA region overall is described as follows:
Trends in reported number of confirmed cases. The number of confirmed cases by month, 2008–12, for the
EU/EEA is presented as a figure. Countries with consistent reporting of cases or zero cases for the whole five-year
period are included. The figure also shows a centred 12-month moving average to show the overall trend by
smoothing seasonal and random variations.
Age- and gender-specific rates for confirmed cases. Age- and gender-specific rates for the EU/EEA Member
States are presented and given per 100 000 persons. It should be noted that these analyses are based only on
cases for which both age and gender were reported. For some diseases this can result in exclusion of a significant
proportion of cases, and the overall EU and EEA rate will be underestimated. The denominator includes the sum of
the populations within the respective age–gender groups, including countries which actively reported zero cases.
Seasonal distribution of cases. For diseases where reported occurrence varies by month, a figure showing the
seasonality is presented. This shows the total number of confirmed cases reported for each month in 2012,
compared with the maximum, minimum and average number of cases observed for each month for the period
2008–12. These analyses include only cases for which the month of reporting is given; for some diseases this can
result in exclusion of significant numbers of cases.
It will be noted that for some diseases reported numbers are too small for some or all of the above analyses to be
presented.
4
SURVEILLANCE REPORT
Annual epidemiological report 2014 – respiratory tract infections
Data protection
The data received in TESSy from Member States are subject to Regulation (EC) No 45/2001 of the European
Parliament and of the Council of 18 December 2000, providing for ‘the protection of individuals with regard to the
processing of personal data by the Community institutions and bodies, and on the free movement of such data.’
High standards of data protection consistent with these requirements are applied, supervised by the ECDC Data
Protection Officer (DPO). ECDC data protection arrangements are also under the review of the European Data
Protection Supervisor.
Data are made available on request to other European Agencies, Institutions and approved researchers, under
procedures in accordance with the above requirements, approved by the ECDC Management Board.
5
Annual epidemiological report 2014 – respiratory tract infections - tuberculosis
SURVEILLANCE REPORT
Respiratory tract infections
Tuberculosis
•
•
•
•
•
•
•
•
In 2012, 29 EEA countries, 27 of which were EU countries, reported 68 423 cases of tuberculosis (TB),
giving an overall rate of 13.5 cases per 100 000 population; 42 364 (62%) of these cases were laboratoryconfirmed.
Of 68 423 cases reported, 48 395 (71%) were diagnosed with pulmonary TB, 15 706 (23%) with
extrapulmonary TB, 4 112 (6%) with a combination of both, and for 210 (0.3%) of all cases, no site was
reported.
Between 2008 and 2012, the reported TB rate decreased significantly by an annual average of 5%, with a
more pronounced decrease in 21 countries.
The highest rates per 100 000 population in 2012 were reported by Romania (85.2), Lithuania (59.2), Latvia
(48.6), Bulgaria (31.1), Portugal (25.2) and Estonia (21.6).
In 2012, 18 358 (27%) of all notified TB cases were reported as being of foreign origin.
Multidrug-resistance (MDR) remained most prevalent in the Baltic States (14%–26%) and Romania (9%).
In 20 countries reporting drug susceptibility testing results for second-line anti-TB drugs, 14% of the MDR
TB cases tested were extensively drug-resistant (XDR).
Among new culture-confirmed pulmonary TB cases, 77% had a successful treatment outcome at 12 months,
as opposed to 55% of previously treated pulmonary TB cases and 34% of all culture-confirmed MDR TB
cases at 24 months.
Tuberculosis (TB) is an infectious bacterial disease caused by Mycobacterium tuberculosis complex. It typically
affects the lungs (pulmonary TB), but can also cause disease at other sites (extrapulmonary TB). TB is mainly
spread through droplet transmission, for example a person suffering from pulmonary TB expels bacteria by
coughing. In general, a relatively small proportion of people infected with M. tuberculosis complex will go on to
develop TB disease, but the likelihood of developing disease is much higher with impaired immunity. Standard care
involves antibiotic treatment for at least six months. Treatment success is hampered by increasing MDR TB rates.
Epidemiological situation in 2012
In 2012, 68 423 possible, probable and confirmed i TB cases were reported by 27 EU countries, Iceland and
Norway (Table 1). The reported TB rate was 13.5 per 100 000 population in 2012. Rates higher than 20 per
100 000 were reported by Romania (85.2), Lithuania (59.2), Latvia (48.6), Bulgaria (31.1), Portugal (25.2), and
Estonia (21.6). Cases reported in these six high-incidence countries accounted for 38% of all reported cases. TB
case rates in 18 countries were below 10 per 100 000 (Figure 1).
The overall rate in 2012 was 6% lower than in 2011, reflecting a decrease in 19 countries. The overall average
annual decrease between 2008 and 2012 was 5.0% with a net decrease in 21 countries. Rates remained stable or
increased in Cyprus, Iceland, Luxembourg, Norway, Sweden and the United Kingdom, all of them low-incidence
countries reporting over 70% of their TB cases as being of foreign origin.
i
A TB case is reported to ECDC according to the European Commission case definition; cases are categorised as ‘possible’ (based
on clinical criteria only), ‘probable’ (additional detection of acid-fast bacilli (AFB) in sputum, M. tuberculosis complex in nucleic
acid, or granulomata in histology) and ‘confirmed’ (by culture or by detection of both positive AFB in sputum and M. tuberculosis
complex in nucleic acid).
6
SURVEILLANCE REPORT
Annual epidemiological report 2014 – respiratory tract infections
Table 1. Numbers and rates of total reported TB cases, EU/EEA, 2008-2012*
Country
2012
National Report Cases
data
type
2011
Rate
ASR
Confirmed Cases
cases
2010
Rate
Cases
2009
Rate
Cases
2008
Rate
Cases
Rate
Austria
Y
C
648
7.7
7.6
413
690
8.2
691
8.3
696
8.3
817
Belgium
Y
C
987
8.9
9.1
776
1019
9.3
1086
10.0
994
9.2
990
9.3
Bulgaria
Y
C
2280
31.1
30.6
1092
2406
32.6
2649
35.0
2910
38.3
3150
41.2
Cyprus
Y
C
69
8.0
7.8
50
54
6.4
61
7.4
55
6.9
50
6.3
Czech Republic
Y
C
605
5.8
5.6
421
600
5.7
668
6.4
694
6.7
864
8.3
Denmark
Y
C
389
7.0
7.1
301
381
6.9
366
6.6
334
6.1
380
6.9
Estonia
Y
C
290
21.6
21.5
239
339
25.3
333
24.8
411
30.7
444
33.1
Finland
Y
C
274
5.1
5.0
223
324
6.0
320
6.0
413
7.8
341
6.4
France
Y
C
4978
7.6
7.9
2338
4991
7.7
5116
7.9
5276
8.2
5758
9.0
Germany
Y
C
4220
5.2
5.0
3040
4317
5.3
4387
5.4
4444
5.4
4523
5.5
Greece
Y
C
557
4.9
4.9
225
489
4.3
487
4.3
589
5.2
664
5.9
Hungary
Y
C
1223
12.5
11.9
538
1445
14.7
1741
17.7
1407
14.2
1619
16.4
Ireland
Y
C
366
8.0
8.4
277
414
9.1
420
9.4
479
10.8
468
10.6
Italy
Y
C
3142
5.2
5.3
677
3521
5.8
4692
7.8
4244
7.1
4418
7.4
Latvia
Y
C
993
48.6
48.8
778
885
42.7
935
41.6
977
43.2
1070
47.1
Lithuania
Y
C
1781
59.2
59.4
1368
1904
62.4
1938
58.2
2081
62.1
2250
66.8
Luxembourg
Y
C
45
8.6
8.6
33
26
5.1
29
5.8
27
5.5
28
5.8
Malta
Y
C
43
10.3
10.4
16
33
7.9
32
7.7
44
10.7
53
13.0
Netherlands
Y
C
958
5.7
5.9
662
1003
6.0
1068
6.4
1158
7.0
1015
6.2
Poland
Y
C
7542
19.6
19.7
5070
8478
22.0
7509
19.7
8236
21.6
8080
21.2
Portugal
Y
C
2590
25.2
24.2
1711
2612
25.3
2727
26.1
2871
27.5
3002
28.8
Romania
Y
C
18197
85.2
89.6
107.8 24680
114.6
Slovakia
Y
C
345
6.4
6.6
181
399
7.4
439
8.1
506
9.4
633
11.7
Slovenia
Y
C
138
6.7
6.5
126
192
9.4
172
8.4
188
9.3
213
10.6
Spain
Y
C
5991
13.0
12.5
3845
6798
14.7
7239
15.7
7592
16.6
8216
18.1
Sweden
Y
C
632
6.7
6.9
504
580
6.2
667
7.1
617
6.7
546
5.9
United Kingdom
Y
C
8751
14.2
14.1
5200
8899
14.3
8397
13.6
8900
14.4
8532
14.0
15.9 82804
16.7
11974 19205
42078 72004
89.7 21059
EU Total
-
-
68034
13.6
13.5
Iceland
Y
C
11
3.4
3.5
5
9
2.8
22
6.9
9
2.8
6
Liechtenstein
-
-
-
-
-
-
-
-
-
-
-
-
-
-
Norway
Y
C
378
7.6
7.8
281
354
7.2
336
6.9
358
7.5
313
6.6
EU/EEA Total
-
-
68423
13.5
13.4
15.8 83123
16.6
42364 72367
14.4 75228
98.1 23164
14.3 75586
15.1 79307
9.8
15.0 79674
1.9
* Confirmed, probable and possible cases
ASR: Age-standardised rate
Source: Country reports; Y: Yes; N: No; A: Aggregated data report; C: Case-based data report; –: No report; U: Unspecified.
7
Annual epidemiological report 2014 – respiratory tract infections - tuberculosis
SURVEILLANCE REPORT
Figure 1. Rates of reported TB cases by country, EU/EEA, 2012
Age and gender distribution
In 2012, male cases exceeded female cases in all age groups of 15 years and older (Figure 2) with an overall maleto-female ratio of 1.79. Males were overrepresented among cases in all EU/EEA Member States except Iceland, and
TB was reported at least twice as frequently in males by Estonia, Greece, Latvia, Lithuania, Malta and Poland.
Males were also over-represented in all adult age groups, with the greatest gender imbalance in the notification
rate for those aged 45 to 64 years. The highest notification rate was reported in those aged 25 to 44 years.
Children under 15 years of age accounted for 2 845 (4%) of 68 363 TB cases with known age corresponding to a
notification rate of 3.6 per 100 000.
Figure 2. Rates of confirmed reported TB cases by age and gender, EU/EEA, 2012*
Rate per 100 000 population
25.00
Male
Female
20.00
15.00
10.00
5.00
0.00
0-4
5-14
15-24
25-44
Age group
45-64
≥ 65
* Excludes 60 cases with unknown age and 45 cases with unknown gender.
Source: Country reports from Austria, Belgium, Bulgaria, Cyprus, Czech Republic, Denmark, Estonia, Finland, France, Germany,
Greece, Hungary, Iceland, Ireland, Italy, Latvia, Lithuania, Luxembourg, Malta, Netherlands, Norway, Poland, Portugal, Romania,
Slovakia, Slovenia, Spain, Sweden and United Kingdom.
8
SURVEILLANCE REPORT
Annual epidemiological report 2014 – respiratory tract infections
Enhanced surveillance in 2012
Previous treatm ent and laboratory confirm ation
Similar to the figures in 2011 and 2010, 80% (54 541) of 68 423 TB cases reported in 2012 were newly diagnosed,
12% (8 139) had been previously treated for TB and 8% (5 743) had an unknown previous treatment status. The
proportion of new cases in each country ranged from 52% in Italy to 95% in the Netherlands. The Member States
with the lowest proportions of new cases had the highest proportions of cases with unknown previous treatment
status.
Laboratory confirmation was reported for 42 364 (62%) of all 68 423 cases (Figure 3) and for 28 673 (70%) of
new pulmonary cases. All laboratory-confirmed cases but 61 (0.1%) were confirmed by culture. The rest were
confirmed by microscopy and nucleic acid amplification test. Country-specific proportions of laboratory-confirmed
cases ranged from 22% in Italy (provisional data) to 91% in Slovenia. Overall, the trend in case confirmation by
culture, nucleic acid detection and sputum smear has increased steadily since 1995.
Figure 3. Proportion of confirmed cases among all reported TB cases, EU/EEA, 2012
Italy*
Malta
Greece
Hungary
Iceland
France
Bulgaria
Slovakia
United Kingdom
Total EU/EEA
Austria
Spain
Romania
Portugal
Poland
Netherlands
Czech Republic
Germany
Cyprus
Luxembourg
Norway
Ireland
Lithuania
Denmark
Latvia
Belgium
Sweden
Finland
Estonia
Slovenia
0
20
40
60
80
100
(%)
* Provisional data
Source: Country reports from Austria, Belgium, Bulgaria, Cyprus, Czech Republic, Denmark, Estonia, Finland, France, Germany,
Greece, Hungary, Iceland, Ireland, Italy, Latvia, Lithuania, Luxembourg, Malta, Netherlands, Norway, Poland, Portugal, Romania,
Slovakia, Slovenia, Spain, Sweden and United Kingdom.
9
Annual epidemiological report 2014 – respiratory tract infections - tuberculosis
SURVEILLANCE REPORT
Site of TB
Of 68 423 cases reported in 2012, 52 507 (77%) suffered from pulmonary TB, including 4 112 (6%) with
additional extrapulmonary manifestations. Purely extrapulmonary TB affected 15 706 (23%), whereas for 210
(0.3%) of all reported cases the site was not reported. Country-specific proportions of extrapulmonary TB in 2012
ranged from 3% in Hungary to 47% in the United Kingdom. The overall reported rate for extrapulmonary TB has
been stable at 3.1 to 3.2 per 100 000 since 2002.
In children under 15 years of age, extrapulmonary TB accounted for 1 242 (44%) of 2 824 cases with site
information, and in adults aged 15 years and above for 14 356 (22%) of 65 044 cases.
Origin of TB cases
In 2012, 48 801 (71%) of 68 423 reported TB cases were born or had citizenship in the reporting EU/EEA Member
State, 18 358 (27%) were of foreign origin i and 1 264 (2%) were of unknown origin. Of all foreign TB cases, 6 452
(32%) were from Asia (outside of the WHO European Region), 5 516 (32%) from Africa, 2 207 (12%) from other
EU/EEA countries, 1 842 (11%) from non-EU/EEA countries of the WHO European Region, 836 (5%) from the
Americas and 1 505 (8%) from other or unknown countries. In 11 Member States, cases of foreign origin
accounted for the majority, reaching 85% in Sweden and Norway. Overall, the proportion of foreign cases has
been on the rise since 2001. In some countries this was due to a real increase, whereas in others, it was
attributable to the sizeable drop in native cases.
TB and HIV infection
HIV status was reported for 21 602 (61%) of 35 620 TB cases from 16 countries. Two countries only reported HIVpositive cases and were therefore excluded from the analysis. Of the 21 602 cases with known HIV status, 1 188
(5%) were reported as HIV-positive. Among Member States with at least five HIV-co-infected TB cases, a coinfection prevalence of more than 10% among TB cases with known HIV status was reported by Estonia (17% HIV
positive, 94% HIV status known), Portugal (15% HIV positive, 75% HIV status known), Ireland (14% HIV positive,
27% HIV status known) and Latvia (14% HIV positive, 85% HIV status known).
Drug-resistant TB
MDR TB was found in 1 421 (5%) of 31 004 cases with drug susceptibility testing (DST) results (Table 2). Among
pulmonary cases with known previous TB treatment status, MDR was found in 499 (3%) of 18 933 new TB cases
and 718 (19%) of 3 812 cases having previously received TB treatment. As in previous years, MDR TB was most
frequently observed in the three Baltic countries with 11 to 21% of all new pulmonary cases being MDR TB. Among
previously treated pulmonary cases, MDR TB, reached 33–50% in the Baltic States, but also affected some lowincidence countries. In cases of extrapulmonary TB, MDR was less prevalent, affecting 56 (1%) of 4 110 cases with
known DST results.
In 2012, extensively drug-resistant tuberculosis (XDR TB) was reported for 134 (14%) of 978 MDR TB cases
including 127 (15%) of 853 pulmonary MDR TB cases having undergone second-line drug susceptibility testing.
i
The geographic origin of a TB case is classified according to place of birth (born in the country/foreign-born, reported by 24
countries) or, if unavailable, citizenship (citizen/non-citizen, five countries).
10
SURVEILLANCE REPORT
Annual epidemiological report 2014 – respiratory tract infections
Table 2. Number and percentage of reported MDR and XDR TB cases, EU/EEA, 2012
Country
Laboratory- confirmed TB
cases with FL DST*
Total MDR TB
N
%
Total MDR with
SL DST**
XDR TB
N
%***
Austria
392
27
(6.9)
27
7
(25.9)
Belgium
735
20
(2.7)
20
2
(10.0)
Bulgaria
829
49
(5.9)
49
5
(10.2)
Cyprus
49
0
(0.0)
0
0
-
Czech Republic
397
4
(1.0)
2
1
(50.0)
Denmark
298
1
(0.3)
1
0
(0.0)
Estonia
239
61
(25.5)
55
4
(7.3)
Finland
222
3
(1.4)
3
1
(33.3)
France
-
-
-
-
-
-
2 794
60
(2.1)
8
0
(0.0)
-
-
-
-
-
-
Hungary
449
11
(2.4)
10
2
(20.0)
Ireland
265
5
(1.9)
1
0
(0.0)
2 439
74
(3.0)
50
5
(10.0)
Germany
Greece
Italy
Latvia
Lithuania
766
106
(13.8)
106
17
(16.0)
1 368
271
(19.8)
210
52
(24.8)
29
0
(0.0)
-
-
-
Luxembourg
Malta
14
0
(0.0)
-
-
Netherlands
656
11
(1.7)
-
-
-
Poland
4 659
31
(0.7)
4
0
(0.0)
Portugal
1 321
17
(1.3)
9
1
(11.1)
Romania
5 966
530
(8.9)
284
32
(11.3)
Slovakia
181
1
(0.6)
1
0
(0.0)
Slovenia
126
0
(0.0)
-
-
-
Spain
871
37
(4.2)
37
1
(2.7)
Sweden
503
14
(2.8)
14
2
(14.3)
United Kingdom
5151
81
(1.6)
80
2
(2.5)
30 719
1414
(4.6)
971
134
(13.8)
Iceland
5
1
(20.0)
1
0
(0.0)
Liechtenstein
-
-
-
-
-
-
Total EU
Norway
Total EU/EEA
280
6
(2.1)
6
0
(0.0)
31 004
1421
(4.6)
978
134
(13.7)
* FL DST – drug susceptibility testing for first-line drugs
** SL DST – drug susceptibility testing for second-line drugs
*** Percentages calculated from cases with second-line drug susceptibility testing (SL DST)
Treatm ent outcom e
Of 63 366 TB cases notified in 2011 with treatment outcome reported in 2012, 47 229 (75%) had been treated
successfully, 4 714 (7%) had died, 940 (1%) had experienced treatment failure, 3 811 (6%) had defaulted, 1 921
(3%) were still on treatment and 4 751 (7%) had been transferred or had an unknown outcome. France, Greece
and Italy did not report treatment outcome.
Treatment success had been achieved in 77% of new laboratory-confirmed pulmonary TB cases, 55% of previously
treated cases, 34% of MDR TB and 25% of XDR TB cases.
Discussion
Reported TB cases and rates per 100 000 population have declined over the last five years, both in high- and lowincidence countries. The few exceptions with stable or even increasing case rates are Cyprus, Iceland, Luxembourg,
Norway, Sweden and the United Kingdom; these are low-incidence countries with high proportions of foreign-origin
TB cases. The increasing case rates may be due to more effective case detection and increased immigration from
countries where TB is highly endemic rather than low-incidence countries.
11
Annual epidemiological report 2014 – respiratory tract infections - tuberculosis
SURVEILLANCE REPORT
High-incidence countries continue to account for the highest proportions of TB drug resistance among those
countries providing relevant surveillance data, and also for a high and increasing level of HIV co-infection
prevalence. This remains alarming, especially against the backdrop of an economic crisis and budgetary pressures
on public health. Nonetheless, the declining notification rates in these countries probably testify to the continued
basic effectiveness of their TB programmes.
The follow-up to the Framework Action Plan to fight Tuberculosis in the European Union has set targets of
confirming 80% of new pulmonary TB cases by culture and testing all of these for first-line drug susceptibility. In
2012, only 11 of 29 reporting countries achieved the first target and seven countries the second one. Thus,
although the reported prevalence of MDR TB among new culture-positive cases with drug susceptibility testing
(DST) results seems to have been stable in recent years, this information is based on incomplete data. Information
about XDR TB is even poorer, with only 60% of all MDR TB cases testing results for resistance to second-line drugs
being reported. For the prevention and control of MDR TB and XDR TB, high-quality information about the size and
location of the epidemic is indispensable.
In 2011, the treatment success rate of new pulmonary TB cases reported reached 75%; however, the reported
treatment success rate of previously treated cases was 55%, and for MDR TB cases was 34%, which is
unacceptably low. Most countries thus remain far below the Framework Action Plan targets of 85% treatment
success in confirmed new pulmonary TB cases and 70% in MDR TB.
Surveillance systems overview
Laboratories
Physicians
Hospitals
Others
Austria
AT-TUBERKULOSEGESETZ
Cp
Co
A
C
Y
Y
Y
Y
Y
EU Case Definition (legacy/deprecated)
Belgium
BE-TUBERCULOSIS
Cp
Co
A
C
Y
Y
N
N
Y
EU Case Definition (legacy/deprecated)
Bulgaria
BG-MOH
Cp
Co
A
C
Y
N
Y
N
-
Not specified/unknown
Cyprus
CY-NOTIFIED_DISEASES
Cp
Co
P
C
N
Y
N
N
Y
EU-2008
Czech Republic CZ-TUBERCULOSIS
Cp
Co
A
C
Y
Y
Y
N
Y
EU-2008
Denmark
DK-MIS
Cp
Co
P
C
N
Y
N
N
Y
Other
Estonia
EE-TBC
Cp
Co
P
C
Y
Y
Y
Y
Y
EU-2008
Finland
FI-NIDR
Cp
Co
P
C
Y
Y
N
N
Y
EU-2008
France
FR-MANDATORY_INFECTIOUS_DISEASES
Cp
Co
P
C
Y
Y
Y
Y
Y
Other
Germany
[email protected]/6
Cp
Co
P
C
Y
Y
Y
Y
Y
Other
Greece
GR-NOTIFIABLE_DISEASES
Cp
Co
P
C
Y
Y
Y
N
Y
EU-2008
Hungary
HU-TUBERCULOSIS
Cp
Co
P
C
Y
Y
N
N
Y
EU-2008
Iceland
IS-TUBERCULOSIS
Cp
Co
A
C
Y
Y
Y
N
Y
EU Case Definition (legacy/deprecated)
Ireland
IE-TB
Cp
Co
P
C
Y
Y
Y
N
Y
EU-2008
Italy
IT-NRS
Cp
Co
P
C
N
Y
Y
N
Y
Other
Latvia
LV-TB
Cp
Co
P
C
Y
Y
Y
N
Y
EU Case Definition (legacy/deprecated)
Lithuania
LT-TB_REGISTER
Cp
Co
A
C
Y
Y
Y
Y
Y
EU Case Definition (legacy/deprecated)
Luxembourg
LU-SYSTEM1
Cp
Co
P
C
N
Y
N
N
Y
EU-2002
Malta
MT-DISEASE_SURVEILLANCE
Cp
Co
A/P C
Y
Y
Y
Y
Y
EU-2012
Netherlands
NL-NTR
Cp
Co
P
C
Y
Y
N
N
Y
EU-2008
Norway
NO-MSIS_A
Cp
Co
P
C
Y
Y
Y
N
Y
EU-2012
Poland
PL_CR
Cp
Co
P
C
Y
Y
Y
N
Y
EU Case Definition (legacy/deprecated)
Portugal
PT-TUBERCULOSIS
Cp
Co
P
C
N
Y
N
Y
Y
EU-2008
Romania
RO-NTBSy
Cp
Co
P
C
N
Y
N
Y
Y
EU Case Definition (legacy/deprecated)
Slovakia
SK-NRT
Cp
Co
-
C
Y
Y
Y
N
Y
Other
Slovenia
SI-TUBERCULOSIS
Cp
Co
A
C
Y
Y
N
N
Y
EU Case Definition (legacy/deprecated)
Spain
ES-STATUTORY_DISEASES
Cp
Co
P
C
N
Y
Y
N
Y
EU-2008
Sweden
SE-SweTBReg
Cp
Co
P
C
Y
Y
Y
N
Y
Not specified/unknown
Cp
Co
A
C
Y
N
Y
Y
Y
EU Case Definition (legacy/deprecated)
United Kingdom UK-TUBERCULOSIS
12
National coverage
Active (A)/Passive (P)
Case definition used
Case-based (C)/Aggregated (A)
Data reported by
Comprehensive (Co)/Sentinel (Se)/
Other (O)
Data source
Compulsory (Cp)/Voluntary (V)/
Other (O)
Country
SURVEILLANCE REPORT
Annual epidemiological report 2014 – respiratory tract infections
References
1.
European Centre for Disease Prevention and Control/WHO Regional Office for Europe. Tuberculosis surveillance and
monitoring in Europe 2014. Stockholm: ECDC; 2014.
2.
World Health Organization. Global Tuberculosis Control: WHO report 2013. Geneva: WHO; 2013.
3.
European Centre for Disease Prevention and Control. Progressing towards TB elimination – A follow-up to the Framework
Action Plan to Fight Tuberculosis in the European Union. Stockholm: ECDC, 2010.
13

© Copyright 2026