
FCA 2014 Full Year Results Presentation
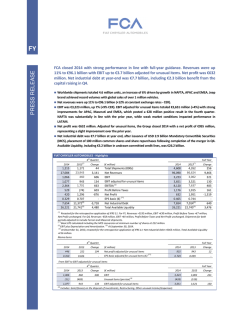
Presentation3 Agenda Page FY 2014 Results January 28, 2015 Safe Harbor Statement This document, and in particular the section entitled “2015 Guidance”, contains forward-looking statements. These statements may include terms such as “may”, “will”, “expect”, “could”, “should”, “intend”, “estimate”, “anticipate”, “believe”, “remain”, “on track”, “design”, “target”, “objective”, “goal”, “forecast”, “projection”, “outlook”, “prospects”, “plan”, “intend”, or similar terms. Forward-looking statements are not guarantees of future performance. Rather, they are based on the Group’s current expectations and projections about future events and, by their nature, are subject to inherent risks and uncertainties. They relate to events and depend on circumstances that may or may not occur or exist in the future and, as such, undue reliance should not be placed on them. Actual results may differ materially from those expressed in such statements as a result of a variety of factors, including: the Group’s ability to reach certain minimum vehicle sales volumes; developments in global financial markets and general economic and other conditions; changes in demand for automotive products, which is highly cyclical; the Group’s ability to enrich the product portfolio and offer innovative products; the high level of competition in the automotive industry; the Group’s ability to expand certain of the Group’s brands internationally; changes in the Group’s credit ratings; the Group’s ability to realize anticipated benefits from any acquisitions, joint venture arrangements and other FY 2014 Results strategic alliances; the Group’s ability to integrate its operations; potential shortfalls in the Group’s defined benefit pension plans; the Group’s ability to provide or arrange for adequate access to financing for the Group’s dealers and retail customers; the Group’s ability to access funding to execute the Group’s business plan and improve the Group’s business, financial condition and results of operations; various types of claims, lawsuits and other contingent obligations against the Group; material operating expenditures in relation to compliance with environmental, health and safety regulation; developments in labor and industrial relations and developments in applicable labor laws; increases in costs, disruptions of supply or shortages of raw materials; exchange rate fluctuations, interest rate changes, credit risk and other market risks; political and civil unrest; earthquakes or other natural disasters and other risks and uncertainties. Any forward-looking statements contained in this document speak only as of the date of this document and the Company does not undertake any obligation to update or revise publicly forward-looking statements. Further information concerning the Group and its businesses, including factors that could materially affect the Company’s financial results, is included in the Company’s reports and filings with the U.S. Securities and Exchange Commission, the AFM and CONSOB. January 28, 2015 2 Group overview Components Mass-market brands by region Product & event information Ferrari and Maserati brands Industry outlook & guidance FY 2014 Results January 28, 2015 3 2014 was a momentous year Jan Feb Mar Apr Jan Feb Mar Apr Chrysler Acquisition (January 1) Fiat S.p.A. reaches agreement with VEBA to acquire remaining stake in Chrysler Group FY 2014 Results Corporate Reorganization Approval (January 29) Fiat’s BoD approves corporate reorganization of “FCA” as a Dutchincorporated, British-domiciled LLC with principal executive offices in the UK May May 5-Year Business Plan (May 6) Combined company presents detailed business plan including product plans and financial targets for 2014 - 2018 Jun Jul June July Shareholder Approval of Merger (August 1) Merger plan approved during Fiat S.p.A. shareholders’ meeting Aug Aug Sep Sept Merger Effective and Dual-Listing (October 12-13) • Merger of Fiat S.p.A. with and into Fiat Investment N.V. becomes effective October 12 • Surviving entity renamed Fiat Chrysler Automobiles N.V. (FCA) • October 13, FCA listed for trading on New York Stock exchange (NYSE) Oct Oct Nov Nov Dec Dec Announced Planned Transactions U.S. Capital Markets Transactions (October 29) (December 16) • Issue common shares • Issue mandatory convertible securities • Separate Ferrari through an IPO and subsequent spin-off • $4B raised 100M shares of common stock issued on NYSE o $2.875B of mandatory convertible securities issued o January 28, 2015 4 FY ’14 executive summary WORLDWIDE SHIPMENTS WERE 4.6 MILLIONS UNITS Jeep brand achieved record volumes with global sales of over 1M vehicles FINANCIAL RESULTS IN LINE WITH GUIDANCE Net revenues at €96.1B EBIT at €3.2B (€3.7B adjusted for unusuals) Net profit of €632M (€1.0B adjusted for unusuals) Net industrial debt at €7.7B Total available liquidity at €26.2B SUCCESSFULLY ACCESSED THE US CAPITAL MARKETS VEBA note refinanced through placement of various debt instruments totalling $5B Debut of FCA shares traded on NYSE on October 13 $2.9B mandatory convertible securities issued and placement of 100M common shares KEY NEW PRODUCTS LAUNCHED Launch of the Jeep Renegade, the brand’s first small SUV and first Group vehicle designed in the US and crafted in Italy Chrysler launched the all-new 200 mid-size sedan 2015 GUIDANCE* Worldwide shipments in 4.8 – 5.0M range Net revenues ~€108B EBIT in €4.1 - 4.5B range Net profit of €1.0 - 1.2B Net industrial debt in €7.5 - 8.0B range * Figures do not include any impacts from the previously announced capital transactions regarding Ferrari FY 2014 Results January 28, 2015 5 FY ‘14 highlights FY Shipments (000s units) 2014 4,608 2013 4,352 Q4 FY 1,215 2014 1,171 NAFTA: 2,493k (+11%) LATAM: 827k (-13%) APAC: 220k (+35%) EMEA: 1,024k (+5%) Ferrari: 7,255 (+4%) • Maserati: 36,448 (+137%) FY Net revenues (€M) 96,090 2013* 86,624 NAFTA: €52,452M (+15%) LATAM: €8,629M (-13%) APAC: €6,259M (+34%) EMEA: €18,020M (+4%) (€M) • • • Components: €8,619M (+7%) FY EBIT Net industrial debt (€B) 23,943 Ferrari: €2,762M (+18%) Maserati: €2,767M (+67%) 3,223 • 2013* 3,002 1,066 460 NAFTA: €1,647M (3.1% margin) LATAM: €177M (2.1% margin) APAC: €537M (8.6% margin) EMEA: -€109M (-0.6% margin) Ferrari:€389M (14.1% margin) Maserati: €275M (9.9% margin) Components: €260M (3.0% margin) Adjusted for unusual items, EBIT was €3,651M (vs €3,521 for 2013) 2014 7.7 * 2013 7.0 Dec 31 Total available liquidity (€B) EBIT increased by 7% (+9% - CER) 1,296 Net industrial debt was €7.7B Excluding the effect of the acquisition of the minority interest in Chrysler and Q4 capital transactions, net industrial debt increased by €0.3B Capex of €8.1B almost fully covered by cash flow from operations Q4 2014 1,951 Dec 31 27,084 * 420 2013 * Net profit includes: Net financial expense of €2,047M (€60M higher than 2013) Tax expense of €544M Net profit of €568M attributable to owners of the parent Adjusted for unusual items, net profit was €955M (vs €943M for 2013) Q4 2014 Net revenues up 11% (+12% at constant exchange rates - CER) (€M) Shipments up 6% Net profit Q4 632 2014 * 2013 Cash & Mktable Securities 23.0 19.7 3.2 3.0 26.2 22.7 Undrawn committed credit lines Total available liquidity was €3.5B higher than at year-end 2013 reflecting: €3.1B cash proceeds from capital transactions in December 2014 Positive currency translation effect of €1.3B €2.7B paid for the acquisition of the minority interest in Chrysler (*) Recasted for the retrospective application of IFRS 11. Net revenues -€192M, EBIT +€30M, Profit Before Taxes +€7M, Net Profit unchanged. Net Industrial Debt +€365M, Total Available Liquidity +€16M Note: Graphs not to scale. Numbers may not add due to rounding FY 2014 Results January 28, 2015 6 FY ‘14 EBIT walk €M Unusuals (519) Δ Unusuals (575) Δ Unusuals 199 Δ Unusuals 15 FY 2014 Results Δ Unusuals (15) Δ Unusuals 65 Δ Unusuals 40 Δ Unusuals 361 Unusuals (428) Δ Unusuals 1 January 28, 2015 7 FY ‘14 net industrial debt walk €M Change in Net Industrial Debt (291) Cash Flow from operating activities, net of Capex (102) 8,385 937 1,081 (2,386) 2,342 (7,014) (7,654) 86 (2,691) (9,705) Dec 31, Acquisition of Dec 31, remaining 2013 2013 ownership Proforma (IFRS 11 Restated) interests in Chrysler (8,119) Industrial EBITDA Financial charges and taxes* Change in funds & other Working capital Capex (281) Investments, scope & other 6 (9,996) Mandatory Dec 31, FX Capital convertible 2014 increase translation without securities effect and and net capital dividends stock transactions issuance Dec 31, 2014 * Net of IAS 19 FY 2014 Results January 28, 2015 8 NAFTA Commercial highlights FY ’14 FY ‘13 Commercial Performance Sales (k units) 2,459 2,147 o Industry remained strong with U.S. and Canada Market Share 12.4% 11.5% o Group sales up 15% outpacing the industry in both U.S. 12.4% 11.4% Canada 15.4% 14.6% both up 6% markets o U.S. Vehicle sales up 16% to 2.1M vs 1.8M last year Jeep brand posted best FY sales ever, up 41% from prior year to 692k vehicles; all Jeep models increased sales Ram truck brand sold 469k units up 28% in 2014, best year since 2005 and best pickup truck sales since 2003 Fiat posted best annual sales since brand was re-introduced in the U.S. in 2011 with 46k units up 7% 2015 Dodge Charger 2015 Chrysler 300 • Refreshed styling with nearly every body panel re-sculpted • New exterior and interior design elements • New models added: SRT Hellcat, SRT 392 and R/T Scat Pack • Revealed at Los Angeles Auto Show in November • 8-speed ATX and full range of fuel-efficient and powerful engine options FY 2014 Results • Best-in-class V-6 highway fuel economy and driving range Market share up 100 bps vs prior year, driven by 18% increase in retail sales; highest OEM share growth for 2014 Fleet mix of 21% improved from 22% in prior year Dealer inventory at 72 days supply vs 79 days at end of 2013 o Canada Vehicle sales up 12% to 290k vehicles Highest annual sales in Company’s history Market leader in Q4 2014 Market share at 15.4%, up 80 bps vs prior year January 28, 2015 9 NAFTA Financial highlights FY ‘14 FY ‘13 % chg Shipments (k units) 2,493 2,238 11% Net revenues (€M) 52,452 45,777 15% o Shipments up 11% y-o-y U.S.: 2,112k (+13%) Canada: 295k (+10%) Mexico: 86k (-6%) €M 411 1,129 Unusuals (504) 2,290 (1,577) 1,647 (29) (577) FY '13 FY 2014 Results Net revenues +15% y-o-y (+15% CER) on higher shipments o Volume & mix improved primarily due to higher shipments EBIT Walk Unusuals 71 o Volume & Mix Net price Industrial costs SG&A Investments/ FX/Other FY '14 o Higher net price due to positive pricing actions partially offset by higher incentives on certain vehicles and FX transaction impact of the Canadian Dollar and Mexican Peso o Industrial costs reflect higher base material costs for vehicle content enhancements and increased warranty and recall costs, partially offset by purchasing savings o Other items mainly include negative charge connected with the UAW MoU entered into by Chrysler on January 21, 2014 related to acquisition of the minority interest in Chrysler January 28, 2015 10 LATAM Commercial highlights FY ‘14 FY ‘13 Sales (k units) 830 933 Market Share 16.0% 15.7% Brazil 21.2% 21.5% Argentina 13.4% 12.0% Commercial Commercial Performance Performance o Industry down 13% y-o-y reflecting weaker trading conditions and record FY ’13 Brazil industry down 7% y-o-y Argentina industry down 29%, due to import restrictions and additional tax on high end segments o Sales down 103k reflecting poor trading conditions Strada “Hard Working” o Market share up 30 bps vs prior year Special Series launched in October Enhanced appearance package including new wheels, tires and Brazil market leadership upheld with share down 30 bps while lead over nearest competitor increased to 350 bps (+80 bps) Palio was best selling model in 2014, ending 27 years of VW Gol leadership Strada achieved 56% segment share and remained segment leader for 15th consecutive year In Argentina, share up 140 bps Combined A/B segment share at 16.7% with strong performance for new Palio (up 29% y-o-y) o Stock levels in line with last year (at ~1 month of supply) badging as well as modified headlamps and interior upgrades FY 2014 Results January 28, 2015 11 LATAM Financial highlights FY ‘14 FY ‘13 % chg Shipments (k units) 827 950 (13%) Net revenues (€M) 8,629 9,973 (13%) o o Shipments down 13% Brazil: declined by 10% vs FY ‘13 due to market weakness Net revenues: down 13% (-7% CER) Argentina: down 22% reflecting overall market deterioration partially offset by market share increase EBIT Walk €M o Overall shipments down 123k units, (Brazil and Argentina down 81k and 24k, respectively) reflecting worse trading conditions partially offset by better mix 381 Unusuals (127) 492 Unusuals (112) (228) (441) FY '13 FY 2014 Results Volume & Mix Net price Industrial costs 2 177 Investments/ FX/Other FY '14 (29) SG&A o Positive pricing actions in Brazil and Argentina o Increased industrial costs and SG&A were impacted by higher input cost inflation and Pernambuco startup costs January 28, 2015 12 APAC Commercial highlights Sales – incl. JVs (k units) FY ‘14 FY ‘13 267 199 Commercial Performance o Industry demand up 8%, with growth in China (+10%), South Korea (+9%), India (+3%) and Japan (+3%) partially offset by slight decline in Australia (-2%) Market Share China 1.0% 0.8% Australia 4.0% 3.1% India 0.5% 0.4% Japan 0.4% 0.4% South Korea 0.5% 0.4% Fiat Avventura o Group sales were 267k vehicles, up 34% outperforming the industry in each major market China +41%, South Korea +36%, Australia +28%, Japan +11% and India +27% Jeep (50% of regional group sales) up 42% y-o-y driven by Grand Cherokee and Cherokee Fiat brand up 35% y-o-y driven by Viaggio and Ottimo Dodge brand up 42% driven by Journey o Share gains in all major markets lead by Australia 90 bps improvement Launched in India in Q4 Small cross over with high ground clearance 60:40 Folding seats - High terrain gauges Stylish mounted spare wheel Functional roof rails - 16’’ alloy wheels FY 2014 Results Note: APAC industry reflects aggregate for major markets where Group competes (China, Australia, Japan, South Korea, and India.) India-reports wholesale volume on industry and market share. January 28, 2015 13 APAC Financial highlights FY ‘14 FY ’13* % chg Shipments (k units) 220 163 35% Net revenues (€M) 6,259 4,668 34% o Shipments up 35% Jeep: +47% Fiat : +23% Dodge: +30% o Net revenues up 34% (+35% CER) driven by higher volumes and better product mix * Adjusted for retrospective application of IFRS 11. Revenues increased by €47M EBIT Walk €M o Positive contribution from both volume & mix 494 Unusuals 0 (142) (1) Adjusted (1) 537 (111) 335 FY '13 15 (54) Unusuals (1) Volume & Mix Net price Industrial costs SG&A o Net price reduction due to higher incentives in response to the increasingly competitive trading environment, particularly in China o Industrial costs increase due to higher ER&D and fixed manufacturing cost related to higher volume Investments/ FX / Other FY '14 o Increase in SG&A to support volume growth for retrospective application of IFRS11 (EBIT increased by €17M) FY 2014 Results January 28, 2015 14 EMEA Commercial highlights FY ’14 FY ‘13 886 875 265 250 Cars 5.8% 6.0% LCVs* 11.5% 11.6% Sales (k units) Cars LCVs Commercial Performance Passenger Cars o EU28+EFTA (EU) industry up 5% to 13.0M units Recovery in Italy (+4%), Germany (+3%), UK (+9%) and Spain (+18%), with France flat Market Share (EU28+EFTA) o Sales up 1% to 886k units (760k sales in EU) Group share down slightly (-20 bps) in EU, driven by share loss in Italy (-100 bps) on the back of run-out models, share stable in EU ex-Italy at 3.3% Continued market leadership for 500 family in A & L0 segments LCVs o EU industry up 10% to 1.7M units driven by recovery in all major markets Italy +16%, Spain +33%, UK +18%, Germany +5% and France +1% Jeep Renegade Launched in September in Italy and in 13 other European countries in Q4 o Sales up 6% with growth in every major market, except France Awarded 5 star Euro NCAP safety rating In December, Renegade 1# in Italy in its segment and in the top 10 among all SUVs FY 2014 Results * Due to unavailability of market data for Italy since January 2012, the figures reported are an extrapolation and discrepancies with actual data could exist. Ducato ranked top in its segment with a 21% share (180 bps over the nearest competitor) with more than 110k units sold Group share in EU down slightly (-10 bps) January 28, 2015 15 EMEA Financial highlights FY ‘14 FY ’13* % chg Shipments (k units) 1,024 979 Net revenues (€M) 18,020 17,335 5% 4% o o Overall shipments up 5% Passenger Cars up 4% to 804k LCVs at 220k units, increasing 17k or 8%, driven mainly by the Italian market Net revenues up 4% on the back of volume increase and favorable mix driven by LCVs, Fiat 500 family and Jeep * Adjusted for retrospective application of IFRS 11. Revenues decreased by €85M EBIT Walk o Volume increase and better mix €M Unusuals 4 Unusuals (195) o Negative pricing driven by continued competitive pressure o Industrial costs include improved manufacturing and purchasing efficiencies partially offset by start-up costs in Melfi o SG&A increase driven by Jeep advertising to support brand growth including the launch of all-new Renegade (1) (1) Adjusted for retrospective application of IFRS11 (EBIT increased by €14M) o Other reflects unusual charge in 2013 to write-off previously capitalized R&D for development of new Alfa products switched to a new platform more appropriate for the brand o Positive EBIT in Q4 FY 2014 Results January 28, 2015 16 Luxury brands Ferrari FY ‘14 FY ‘13 % chg Shipments 7,255 7,000 4% Net revenues (€M) 2,762 2,335 18% 389 364 7% EBIT (€M) Financial Performance o Net revenues up 18% y-o-y due to higher volumes and improved mix on the back of LaFerrari o EBIT up 7% EBIT includes €15M compensation costs related to the resignation of the former chairman. Excluding this item, EBIT was up €40M or 11% Commercial Performance o Street cars shipments up 4% with 12-cyl models up 7% and 8-cyl models up 3% U.S. up 6%, #1 market for the brand FY ‘14 Shipments By Market APAC volumes up 17% Volume flat in the 5 major European markets Europe Top-5 FXX K 30% Japan 6% China, Hong Kong & Taiwan U.S. 30% Maranello’s first hybrid The “K” in the car’s moniker is a reference to the KERS (kinetic energy recovery system) used to maximize performance FY 2014 Results 9% Others 25% January 28, 2015 17 Luxury brands Maserati FY ‘14 FY ‘13 % chg Financial Performance Shipments 36,448 15,393 137% Net revenues (€M) 2,767 1,659 67% o Net revenues up 67% due to higher shipments o EBIT was up by 159%, 10% margin o EBIT up 61% adjusted for unusual items in 2013 275 106 159% EBIT (€M) Commercial Performance Unusual charge of €65M in 2013 was related to the write-off of previously capitalized development costs following the decision to switch a future model to a more technically advanced platform o Shipments up 137% on the back of continued strong performance for the Quattroporte and Ghibli North America: +111%; #1 market for the brand Greater China: +152% FY ‘14 Shipments By Market Europe: +154% Grancabrio Mc Centennial Edition 2014 Maserati’s 100 year anniversary Europe Top-4 13% North America 40% Japan 4% Greater China, 28% Others 15% FY 2014 Results January 28, 2015 18 Components Net revenues (€M) FY '14 FY '13 6,500 5,988 Net revenues (€M) EBIT (€M) FY '14 204 FY '13 169 EBIT (€M) 639 688 (4) (70) o Net revenues down 7% (+3% on constant scope of operations) o Net revenues up 9% (+11% CER) Performance was positive in North America, China and Europe, but down in Brazil Volumes were down 4% for the Cast Iron business (on constant scope of operations) and up 24% for the Aluminum business o EBIT loss of €4M vs a loss of €70M for 2013 which included €60M in unusual charges o EBIT increased €35M y-o-y (€56M adjusted for unusuals) Growth mainly reflects higher volumes as well as cost containment actions and efficiencies Unusual expenses are mainly related to restructuring actions in Brazil Net revenues (€M) FY '14 o Order intake was €2.4B with captive at €1.0B and €1.4B for non-captive. Lighting business up 16%, Electronic division up 15% while Powertrain was mainly flat FY '13 1,550 1,463 EBIT (€M) 60 47 o Net revenues were up 6% mainly attributable to the Body Welding business o EBIT increased 28% o Order intake totaled €1.8B, +12% y-o-y o Order backlog totaled €1.6B, +15% y-o-y Note: graphs not to scale FY 2014 Results January 28, 2015 19 Product & other information Manufacturing Update Products 2015 Alfa Romeo 4C Spider (U.S.) Melfi (Italy) • Plant revamped with ~€1B investment for the production of the all-new Jeep Renegade (Q4 ’14) and Fiat 500X (Q1 ’15) to be sold in more than 100 markets globally • One of the most advanced car assembly plants in the world (according to World Class Manufacturing standards) • Strong initial performance of Renegade and 500X will enable the hiring of ~1,500 new workers in H1 ’15 in addition to the current ~5,400 employees FY 2014 Results Pernambuco (Brazil) • All-new state of the art greenfield facility with adjacent supplier park • Production starting in Q1 ‘15 with Jeep Renegade • Potential capacity >250k vehicles/year, capable to build three different models • Subsidized financing from national development banks with certain tax incentives available for vehicle produced Windsor (Canada) • Revealed at Detroit Auto Show, to • Currently builds Chrysler • Continues roll out of Alfa Romeo Town & Country, Dodge Grand Caravan and Ram C/V vans • Production will be suspended in February for ~3 months to re-tool for the next generation minivan to be launched in Q1 ’16 on an all-new architecture arrive at dealerships in summer 2015 brand to North America after 4C launch in 2014 • Ultralight carbon fiber body and aluminum chassis structures • Modifications will also allow the plant to concurrently build a hybrid electric minivan, potential derivatives products and the current minivan Refreshed Fiat Bravo (Brazil) • Expands Bravo segment presence • Updated external lines, new bumpers and back mist lights • Sales start in Q1 ‘15 January 28, 2015 20 Industry outlook (M units) NAFTA FY '15E 20.0 FY '14 19.9 Passenger cars LATAM APAC FY '15E FY '14 4.2 4.3 LCVs o US: FY 2015 estimate reflects slight increase in U.S. to ~17M (compared to 16.8M in 2014) o LATAM industry seen declining slightly to ~5.1M reflecting economic uncertainties o Industry projected up 6% with improvement driven by China, India, and Australia, partially offset by expected declines in Japan and South Korea 5.1 0.9 0.9 5.2 29.9 FY '15E 28.2 FY '14 o o Canada: FY industry estimate expected to be down slightly from 2014 record level of 1.9M Brazil industry expected to be down slightly due to GDP slowdown and full IPI increase in Jan ‘15 o Argentina industry to decline 8% due to continued restrictions for imports Note: APAC reflects aggregate for key markets where Group competes (China, India, Australia, Japan, South Korea) Passenger cars EMEA EU28+EFTA FY '15E FY '14 13.2 13.0 o LCVs 1.7 14.9 1.7 14.7 Outlook reflects a slight increase for passenger cars with LCVs seen unchanged vs 2014 Passenger Cars EU28+EFTA: +1.5% Further slight increase for Italy, France & Germany LCVs EU28+EFTA confirmed at 1.7M Note: Graphs not to scale. Numbers may not add due to rounding FY 2014 Results January 28, 2015 21 2015 guidance World-wide shipments Net revenues 4.8 - 5.0M units ~€108B EBIT * €4.1 - 4.5B Net profit * €1.0 - 1.2B Net industrial debt €7.5 - 8.0B EPS ** €0.64 - €0.77 * Excludes eventual unusual items ** EPS calculated including the mandatory convertible securities conversion at minimum number of shares at 222 million Note: Figures do not include any impacts from the previously announced capital transactions regarding Ferrari FY 2014 Results January 28, 2015 22 APPENDIX FY 2014 Results January 28, 2015 23 Supplemental financial measures FCA monitors its operations through the use of various supplemental financial measures that may not be comparable to other similarly titled measures of other FCA’s supplemental financial measures are defined as follows: Earnings Before Interest, Taxes (“EBIT”) is computed starting from Net profit/(loss) and then adding back Tax (income)/expenses and Net financial expenses Earnings Before Interest, Taxes, Depreciation and Amortization (“EBITDA”) is computed starting with EBIT and then adding back depreciation and amortization expense Net Industrial Debt is computed as debt plus other financial liabilities related to Industrial Activities less (i) cash and cash equivalents, (ii) current securities, (iii) current financial receivables from Group or jointly controlled financial services entities and (iv) other financial assets. Therefore, debt, cash and other financial assets/liabilities pertaining to Financial Services entities are excluded from the computation of Net Industrial Debt companies. Accordingly, investors and analysts should exercise appropriate caution in comparing these supplemental financial measures to similarly titled financial measures reported by other companies. Group management believes these supplemental financial measures provide comparable measures of its financial performance which then facilitate management’s ability to identify operational trends, as well as make decisions regarding future spending, resource allocations and other operational decisions. FY 2014 Results January 28, 2015 24 Key performance metrics €M (unless otherwise stated) FY ‘14 FY ‘13 (1) World-wide shipments (units ‘000) 4,608 4,352 Net revenues 96,090 86,624 EBIT 3,223 3,002 131 84 (428) (519) Financial charges, net (2,047) (1,987) Pre-tax result 1,176 1,015 Taxes (544) 936 Net profit 632 1,951 Net profit adjusted for unusual items 955 943 8,120 7,637 Of which: Investment income, net Unusual items, net EBITDA (1) Recasted for the retrospective application of IFRS 11. Net revenues -€192M, EBIT +€30M, Profit Before Taxes +€7M, Net Profit unchanged Shipments for both periods adjusted to include Ferrari and Maserati brands FY 2014 Results January 28, 2015 25 EBIT adjusted for unusual items 2014 2013 * EBIT Unusual items EBIT adjusted for unusual items NAFTA 1,647 (504) LATAM 177 APAC EBIT Unusual items EBIT adjusted for unusual items 2,151 2,290 71 2,219 (112) 289 492 (127) 619 537 - 537 335 (1) 336 EMEA (109) 4 (113) (506) (195) (311) Ferrari 389 (15) 404 364 - 364 Maserati 275 - 275 106 (65) 171 Components 260 (20) 280 146 (60) 206 (114) 7 (121) (167) (87) (80) 161 212 (51) (58) (55) (3) 3,223 (428) 3,651 3,002 (519) 3,521 €M Other Eliminations and adjustments Total FY 2014 Results * Recasted for the retrospective application of IFRS 11. January 28, 2015 26 Mass-market brands Market share by key market Quarterly Market Share (%) NAFTA LATAM 23.6 13.0 Q1 Q2 Q3 Q4 12.8 11.4 10.9 Q1 2012 Q2 Q3 20.0 14.9 13.2 Q4 Q1 2013 Q2 Q3 Q4 10.5 9.3 Q1 Q2 Q3 Q4 Q1 2012 2014 EMEA 19.9 Q2 Q3 Q4 9.7 Q1 2013 Q2 Q3 Q4 2014 APAC 46.0 42.7 4.2 47.0 3.4 LCV Passenger Cars LCV 29.3 27.7 27.3 10.8 10.4 10.4 Passenger Cars Q1 Q2 Q3 2012 6.2 Q4 Q1 Q2 Q3 2013 Q4 5.6 Q1 Q2 Q3 2014 5.7 Q4 2.2 0.4 Q1 Q2 Q3 2012 0.1 Q4 1.0 0.9 0.6 0.5 0.5 0.4 0.4 Q1 Q2 Q3 2013 Q4 Q1 Q2 Q3 Q4 2014 1.Reflects aggregate for key markets where Group is competing (China, Australia, India-reports wholesale volume on industry, Japan, South Korea) FY 2014 Results January 28, 2015 27 Group shipments outlook (excl. JVs) (units in thousands) (units in millions) Ferrari and Maserati +95% 0.02 4.4 5.9% 0.04 APAC +35% 4.6 0.04 4.8 – 5.0 0.2 ~0.2 0.8 ~0.9 0.2 Ferrari and Maserati +25% 10 48 1,171 3.8% 1,215 APAC +19% 57 LATAM -4% 217 651 NAFTA +3% 668 236 EMEA +11% 261 227 Q4 ‘13 Q4 ‘14 1.0 LATAM -13% 2.2 NAFTA +11% 2.5 2.6 - 2.7 1.0 EMEA +5% 1.0 1.0 - 1.1 FY ‘14 FY ’15E 12 FY ‘13 Note: Numbers may not add due to rounding; Graphs not to scale. Ferrari and Maserati results combined for presentation purposes only. FY 2014 Results January 28, 2015 28 Debt maturity schedule €B Outstanding Dec. 31 ‘14 FCA 2015 2016 2017 2018 2019 Beyond 13.1 Bank Debt 4.0 1.8 3.9 2.0 0.4 1.0 17.7 Capital Market 2.3 2.6 2.2 1.9 3.8 4.9 2.0 Other Debt 0.8 0.2 0.2 0.1 0.1 0.6 7.1 4.6 6.4 4.0 4.3 6.4 32.9 Total Cash Maturities 23.0 Cash & Mktable Securities 3.2 26.2 Undrawn committed credit lines Total Available Liquidity 4.5 Sale of Receivables (IFRS de-recognition compliant) 2.6 of which receivables sold to financial services JVs (FGA Capital) Note: Numbers may not add due to rounding; total cash maturities excluding accruals FY 2014 Results January 28, 2015 29 FCA Common Shares Outstanding walk 1,507 M shares 35 54 11 1,285 1,185 Placement of 100 FCA shares Shares Outstanding Dec 1, 2014 Placement of FCA shares to replace "withdrawal rights" from merger Placement of treasury shares New FCA shares placed Shares Outstanding Dec 31, 2014 Shares including MCS (2015) 100M FCA common shares placed in December at $11.00 per share of which: • 35M shares previously held by FCA as Treasury shares • 54M FCA shares replacing shares purchased from the “withdrawal rights” from merger • 11M newly issued shares Shares including mandatory convertible securities (MCS) assume additional 222M shares resulting from the minimum conversion rate of 7.74 shares for each $100 nominal security (equivalent to a conversion price of $12.925 per share) Note: Figures above do not include special voting shares which are not listed, cannot be traded and do not participate in dividend distributions FY 2014 Results January 28, 2015 30 Contacts Group Investor Relations Team Joe Veltri +1-248-576-9257 Francesca Ferragina +39-011-006-2308 Tim Krause +1-248-512-2923 Alois Monger +1-248-512-1549 Paolo Mosole +39-011-006-1064 Vice President fax: +39-011-006-3796 FY 2014 Results email: [email protected] websites: www.fcagroup.com www.fcausllc.com January 28, 2015 31


© Copyright 2026