
Study - Oxford Journals
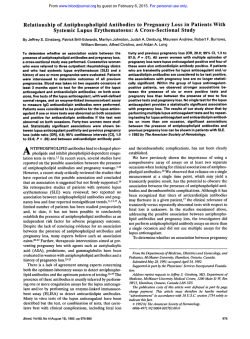
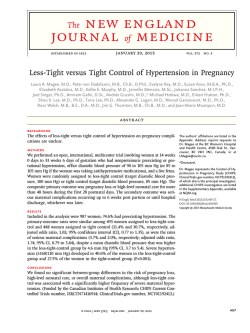
EMBARGOED UNTIL 00:05 hrs GMT ON WEDNESDAY 4 FEBRUARY 2015
Human Reproduction, Vol.0, No.0 pp. 1 –14, 2014
doi:10.1093/humrep/deu348
ORIGINAL ARTICLE Reproductive epidemiology
60
Underuse of modern methods
of contraception: underlying causes
and consequent undesired pregnancies
in 35 low- and middle-income countries
5
10
65
70
Saverio Bellizzi 1, Howard L. Sobel 1,*, Hiromi Obara 1, and
Marleen Temmerman 2
15
1
2
World Health Organization, Western Pacific Regional Office, PO Box 2932 (United Nations Avenue), 1000 Manila, Philippines
World Health Organization Headquarters, Avenue Appia 20, 1211 Geneva 27, Switzerland
75
*Correspondence address. Tel: +63-2-528-9868; Fax: +63-2-526-0279; E-mail: [email protected]
20
Submitted on August 4, 2014; resubmitted on November 21, 2014; accepted on December 5, 2014
80
25
study question: What is the contribution of the underuse of modern methods (MM) of contraception to the annual undesired
pregnancies in 35 low- and middle-income countries?
summary answer: Fifteen million out of 16.7 million undesired pregnancies occurring annually in 35 countries could have been prevented
with the optimal use of MM of contraception.
85
what is known already: Every year, 87 million women worldwide become pregnant unintentionally because of the underuse of MM
30
of contraception.
study design, size, duration: Demographic and health surveys (DHS) of 35 countries, conducted between 2005 and 2012, were
analysed.
participants/materials, setting, methods: Contraceptive use of 12 874 unintentionally pregnant women was compared
35
40
45
50
90
with 111 301 sexually active women who were neither pregnant nor desiring pregnancy.
main results and the role of chance: An average of 96% of 15- to 49-year-old eligible women took part in the survey. When
adjusted for covariates and compared with the use of MM of contraception, the use of traditional methods was associated with a 2.7 [95% confidence
interval (CI): 2.3–3.4] times increase in odds of an undesired pregnancy, while non-use of any method was associated with a 14.3 (95% CI, 12.3–16.7)
times increase. This corresponded to an estimated 16.7 million undesired pregnancies occurring annually in the 35 countries, of which 15.0 million
could have been prevented with the optimal use of MM of contraception (13.5 million women did not use MM whilst 1.5 million women utilized MM
incorrectly). Women with the lowest educational attainment and wealth quintile were 8.6 (95% CI: 8.2–9.1) and 2.6 (95% CI: 2.4–2.9) times less
likely to use contraceptives compared with those with the highest level of each, respectively. Of the 14 893 women who neither desired pregnancy
nor used contraception, 5559 (37.3%) cited fear of side effects and health concerns as the reason for non-use, 3331 (22.4%) cited they or their partner’s opposition to contraception or religious prohibition and 2620 (17.6%) underestimated the risk of pregnancy.
limitations, reasons for caution: Despite the fact that DHS are considered high-quality studies, we should not underestimate
the role played by recall bias for past pregnancies. Few women report a current pregnancy in the first trimester and undesired pregnancies at that
time are probably prone to under-reporting. Some terminated pregnancies may not be included in the current pregnancy group. Furthermore,
covariates measured at the time of the survey may not have reflected the same covariates at the time the currently pregnant women became
pregnant.
95
100
105
wider implications of the findings: Underuse of MM of contraception burdens especially the poor and the less educated.
National strategies should address unfounded health concerns, fear of side effects, opposition and underestimated risk of pregnancy, which
are major contributors to undesired pregnancies.
funding/conflict(s) of interest: No external funding was utilized for this report. There are no conflicts of interest to declare.
55
Key words: unwanted pregnancies / family planning / demographic health surveys / side effects / low- and middle-income countries
& The Author 2014. Published by Oxford University Press on behalf of the European Society of Human Reproduction and Embryology. All rights reserved.
For Permissions, please email: [email protected]
110
2
115
120
125
130
135
140
145
150
155
160
165
Introduction
Every year, when 123 million women experience pregnancy as a harbinger
of happiness, many of the remaining 87 million face it with dismay. The
World Health Organization (WHO) reports that, after becoming pregnant
without intention, many of these women are presented with a stark set of
scenarios: risk of death, disability and lower educational and employment
potential (WHO, 2005). Reducing the number of unintended pregnancies
could avert 60% of maternal deaths and 57% of the child deaths (WHO,
2014). As undesired pregnancies affect poor and vulnerable populations
disproportionately, access to essential contraceptive commodities
remains a great concern to redress global inequity. Furthermore, many
undesired pregnancies end in induced abortion (Cleland and Ali, 2004).
In 2000, 189 nations, by adopting the United Nations Millennium Declaration, pledged to free people from extreme poverty and multiple
deprivations. From this declaration emerged eight Millennium Development Goals (MDGs) (United Nations, 2000). It was agreed that family
planning contributes to sustainable development, health and well-being
of mothers, their children and gender equity (Van Braeckel et al.,
2012). In 2005, the Member States added ‘achieve universal access to reproductive health’ to MDG 5 (WHO, 2014); despite pledges, MDG-5 is
the most off-track MDGof all (WHO, 2013a,b). Although contraceptive
prevalence shows an upward trend and unmet needs show a downward
trend globally, the absolute number of married women who either do
not use contraception or who have an unmet need for family planning
is projected to grow. This indicates that increased investment is necessary to meet the demand for contraceptive methods worldwide
(Alkema et al., 2013; Darroch and Singh, 2013). To accelerate the
achievement of MDG 5 by expanding access to contraceptives, global
initiatives have been revitalized (e.g. Family Planning 2020, International
Conference on Family Planning, ICPD beyond 2014), which aim to
improve the political and funding climate. This intensified global momentum to expand access to contraceptives could be an opportunity for
reproductive health programmes in resource-limited settings.
Method failure leading to pregnancy is common among reversible
methods of contraception. During the first year of contraceptive use,
25– 27% women stop using ‘calendar’ and ‘withdrawal’ methods due
to unintended pregnancy, 15% stop using male condoms, 8% oral contraceptives, 3% injectable, 2% lactational amenorrhea method (LAM) and
0.2% intrauterine devices (IUDs) (Trussell, 2007). Women, especially
those with low education, often switch to less-effective traditional
methods of contraception (Ali and Cleland, 2010). This has slowed
progress in attaining MDG 5(Ali et al., 2012).
This study quantifies the relationship between undesired pregnancies
and contraception: effectiveness of modern methods (MM) of contraception compared with traditional methods, non-use of contraception
and the underlying reasons for not using contraceptives. The study
results aim to target actions to improve utilization of effective contraceptive methodologies.
Materials and Methods
Data sources
170
DHS measure indicators of population and health using nationally representative multistage stratified probabilistic household sample surveys (Macro
International Inc., 1996; Rustein and Rojas, 2003). DHS use extensive interviewer training and field monitoring, standardized variables and
Bellizzi et al.
measurement tools and techniques to ensure standardization and comparability across diverse sites and time periods (Vaessen, 1996; Macro, 2006;
Wirth et al., 2006; Pullum, 2008).
The method-specific contraceptive use in the month before the current
pregnancy was obtained from the monthly calendar of births, pregnancies
and episodes of use and was validated against the variable concerning contraceptive failure to differentiate from contraception discontinuation followed
by early conception.
The variables ‘not desiring pregnancy’ and ‘desire, or not, to use contraception’ were, respectively, derived from the DHS form questions ‘wanting to have
no more children’ or ‘wanting to postpone for two years or more’ and from
‘intention to use contraception in the future’.
DHS were conducted in 49 low- and middle-income countries between
2005 and 2012 (Demographic and Health Survey, 2012). The most recent
survey was used. For the initial analysis, 14 countries did not have the complete set of variables needed and were excluded. Country-specific analysis
for Albania, Azerbaijan and Swaziland was not possible because the sample
had no cases using MM of contraception amongst women immediately
before the current pregnancy; nevertheless, these data sets were incorporated in the pooled analysis. Namibia and Timor-Leste did not present any
individual in the category of user of traditional methods of contraception immediately before the current pregnancy. Thus, the country-specific analysis
was limited to MM of contraception versus non-users of contraception.
175
180
185
190
Outcomes, exposure and covariates
An undesired pregnancy was a pregnancy (at the time of the survey) desired
later after occurrence, or not desired at all.
Status of contraceptive usage was at the time of the survey. For pregnant
women, contraceptive usage indicates its use immediately prior to knowledge of pregnancy, representing contraceptive failures.
The use of contraception was classified under MM, traditional methods
and non-use. MM include combined oral contraceptives, progestogen-only
pills, implants, injectable contraceptives, IUDs, male and female condoms,
sterilization and LAM (WHO, 2013a,b). Traditional methods include withdrawal and fertility-awareness methods (WHO, 2013a,b).
Each person was able to select one primary reason for not using contraception; reasons were subdivided into six categories. ‘Fear of side-effects/
health concerns’ included fear of side effects or health concerns or belief
of interference with normal body processes. ‘Opposition’ included the
woman’s, her husband’s or other’s opposition to contraception use or religious prohibition. ‘Lack of knowledge’ included not knowing where to buy
contraceptives or the types of methods available. ‘Method related reasons’
included ‘cost too much’ or ‘provider too far’. ‘Underestimated risk of pregnancy’ included ‘husband away’, ‘infrequent sex’ and ‘marital separation’.
‘Other’ included ‘fatalism’ (i.e. an event predetermined by fate and therefore
unalterable) and ‘other’.
DHS defined ‘sexually active’ as one engaging in sexual intercourse within
30 days of the interview.
195
200
205
210
215
Study population and sample size
The pooled analysis exploring the risk of undesired pregnancy included undesired pregnancies (n ¼ 12 874) and sexually active, currently not pregnant 220
15- to 49-year-old women who did not desire pregnancy (those known to
be infertile and unable to conceive were excluded from the analysis) (n ¼
111 301). Eight hundred and seventy-five (0.7%) women were missing values
for ‘desiring pregnancies’ leaving 124 175 (99.3%) included in the analysis.
A total of 78 784 (70.8%) out of 111 301 non-pregnant sexually active
women who did not want any future pregnancy were making use of contra- 225
ception; 17 474 (15.7%) women were not using any form of contraception
but expressed the desire to use it and 15 043 (13.5%) did not desire contraception at all. The pooled analysis exploring reasons for not using a method
3
Modern methods of contraception and undesired pregnancy
230
of contraception included all non-pregnant (n ¼ 15 043), sexually active
women who neither desired children nor have the intention to use a
method of contraception in the future. The reason for not using methods
of contraception was not reported by 150 (1.0%) women, leaving 14 893
(99.0%) included in the analysis. The response rate for fertility preference
and intention to use contraception in the non-pregnant women population
was above 97.0% for all DHS countries under study.
Table I Data on conception obtained from
demographic and health surveys in 35 low- and
middle-income countries between 2005 and 2012.
Country, survey years
235
Statistical analysis
240
245
250
255
260
265
270
The pooled analysis was performed after merging all the latest DHS country
files for the 2005– 2012 time period. STATA 10 SE (StataCorp LP, USA) was
used for statistical analysis (Stata Corp., 2008). To weight data, we accounted
for clustering of women by primary sampling units and included country fixed
effect in the pooled analysis.
For each country and the pooled analysis, odds ratio (OR) and adjusted OR
(using multiple logistic regression analysis) between undesired pregnancy
and the type of contraception were determined. P-values of ,0.05 were
considered significant. Logistic regression included education, occupation
(working/not working), marital status, wealth quintiles and urban or rural
residence as covariates.
Population and crude birth rates (CBR) by country were obtained from the
World Health Statistics 2012 (WHO, 2012) to determine annual expected
pregnancies. The estimated number of annual expected pregnancies was
calculated as the number of population multiplied by CBR and then by
1.15 to adjust for miscarriages and terminations (estimated to be 15%;
Garcia-Enguidanos et al., 2002; Inter-agency field manual on reproductive
health in humanitarian settings, 2010), as it is not possible to calculate the
exact number of miscarriages and terminations of pregnancy for each
country. Expected undesired pregnancies and population attributable fraction (PAF) of undesired pregnancies attributable to not using MM of contraception were calculated for each country: P(E)(OR21)/[1+P(E)(OR21)],
where P(E) was the proportion of undesired pregnancies due to non-use of
MM of contraception and OR the odds ratio of pregnancy and the use of MM
of contraception.
The PAF would give us proportional reduction in undesired pregnancies if
traditional methods of contraception and non-use of contraception at all
were replaced by the use of MM of contraception.
Ethical approval
The institutional review board of ORC Macro (Calverton, MD, USA) and of
each country approved the DHS data collection procedures including
informed consent. This study used existing data obtained from ORC
Macro through formal request mechanisms. As no direct interviews or identifying information were included, additional ethical review for the secondary
analysis was not required.
Results
275
280
285
Undesired pregnancies
Of the 111 301 not pregnant women who did not desire pregnancy,
Ghana contributed the smallest number, 447 (0.4%), and India the
largest, 19 056 (17.1%). Of the 12 874 (10.4%) undesired pregnancies,
Albania contributed the smallest number, 15 (0.1%), and India contributed the largest, 1407 (10.9%) (Table I).
For Honduras and India, there were significantly fewer women not
wanting the current pregnancy if the last child was a girl, whilst for
Peru, this was the opposite; for all other countries, there was no significant variation. In all countries, the tendency of not wanting the current
pregnancy increased significantly with parity.
Current
undesired
pregnancies,
n (%)
Currently
non-pregnant,
women not
desiring
pregnancy, n (%)
290
........................................................................................
Pooled
12 874 (100.0)
111 301 (100.0)
Albania 2008/2009
15 (0.1)
2845 (2.6)
Armenia 2010
18 (0.1)
1516 (1.4)
Azerbaijan 2006
51 (0.4)
2682 (2.4)
Bolivia 2008
612 (4.7)
4116 (3.7)
Burkina Faso 2010
199 (1.5)
1469 (1.3)
Burundi 2010
395 (3.1)
1109 (1.0)
Cambodia 2010
135 (1.0)
4621 (4.1)
Colombia 2010
1230 (9.6)
7813 (7.0)
Ethiopia 2011
305 (2.4)
1993 (1.8)
Ghana 2008
137 (1.1)
447 (0.4)
Guyana 2009
113 (0.9)
1265 (1.1)
Honduras 2005/06
564 (4.4)
2968 (2.7)
India 2005/06
1407 (10.9)
19 056 (17.1)
Indonesia 2007
376 (2.9)
10 500 (9.4)
Jordan 2009
357 (2.8)
3062 (2.7)
Kenya 2008/2009
257 (2.0)
1493 (1.3)
Lesotho 2009
167 (1.3)
1366 (1.3)
Madagascar 2008/2009
273 (2.1)
3540 (3.2)
1140 (8.8)
3393 (3.0)
45 (0.3)
2079 (1.9)
Malawi 2010
Moldova 2005
Namibia 2006/2007
334 (2.6)
1527 (1.4)
Nepal 2011
214 (1.7)
2767 (2.5)
Nigeria 2008
430 (3.3)
2410 (2.2)
Peru 2007/2008
1162 (9.0)
9992 (9.1)
Philippines 2008
225 (1.8)
2976 (2.7)
Rwanda 2010
432 (3.4)
2732 (2.4)
Senegal 2010/2011
336 (2.6)
1233 (1.1)
Sierra Leone 2008
174 (1.3)
729 (0.6)
Swaziland 2006/2007
164 (1.3)
1052 (0.9)
Tanzania 2010a
334 (2.6)
1212 (1.1)
Timor-Leste 2009/10
114 (0.9)
1874 (1.7)
Uganda 2011
435 (3.5)
1147 (1.0)
Ukraine 2007
31 (0.2)
2007 (1.8)
Zambia 2007
395 (3.1)
845 (0.8)
Zimbabwe 2010/2011
298 (2.3)
1465 (1.3)
295
300
305
310
315
320
325
330
a
Tanzania refers to the United Republic of Tanzania.
335
In the pooled analysis, the use of traditional methods was associated
with a 2.2 [95% confidence interval (CI): 2.1–2.9] times increased odds
of having an undesired pregnancy compared with the use of MM of contraception (Table II, Fig. 1). Adjusted for covariates, this increased to 2.7 340
(2.3–3.4) times increased odds. Not using any method of contraception
was associated with a 12.4 (95% CI, 11.7–13.1) times increased odds of
4
Bellizzi et al.
400
345
Table II OR by method of contraception for undesired pregnancies, and PAF of undesired pregnancies for women not using
MM of contraception in 35 low- and middle-income countries between 2005 and 2012.
PAF undesired pregnancies
of non-use of MMsa
OR (95% CI) unadjusted
OR (95% CI) adjustedb
.............................................................................................................................................................................................
Pooled
350
Traditional methods
13 517 051 (80.7%)
Not using contraceptives
Armenia
Traditional methods
Bolivia
Traditional methods
4466 (79.7%)
360
Traditional methods
171 190 (86.0%)
Traditional methods
83 898 (86.9%)
Cambodia
Traditional methods
122 876 (88.0%)
Traditional methods
370
45 772 (85.7%)
Traditional methods
556 007 (86.2%)
Ghana
Traditional methods
650 737 (90.9%)
Traditional methods
380
Traditional methods
282 589 (85.6%)
India
Traditional methods
6229 (92.0%)
Traditional methods
390
90 346 (86.3%)
Traditional methods
5 878 331 (79.0%)
Kenya
Traditional methods
Not using contraceptives
2.9 (1.2–6.7)
13.9 (8.1–24.1)
4.4 (2.1–9.3)
2.5 (1.1–5.8)
15.3 (8.1–28.9)
11.9 (8.1–29.3)
420
425
2.4 (1.9–3.0)
2.6 (2.1–3.2)
15.2 (13.1– 17.7)
15.9 (13.7– 18.6)
–
–
430
13.9 (8.6–22.5)
1.3 (0.4–4.2)
1.8 (0.5–5.9)
7.7 (3.8–15.6)
7.8 (3.8–16.0)
1.9 (0.3–15.7)
1.8 (0.2–15.4)
15.1 (6.9–32.7)
14.2 (6.5–31.0)
435
2.3 (1.6–3.2)
2.4 (1.7–3.4)
12.5 (9.8–16.1)
15.2 (11.7– 19.)
440
1.5 (1.2–2.0)
1.4 (1.1–1.9)
11.8 (9.7–14.5)
12.1 (9.8–14.7)
3.1 (2.1–4.8)
2.2 (1.4–3.5)
6.0 (4.7–7.7)
8.4 (6.7–10.7)
2.6 (1.9–3.5)
3.2 (2.3–4.4)
12.2 (9.1–16.3)
13.2 (9.8–17.9)
968 955 (100%)
540 677 (55.8%)
445
50 592 (100%)
32 379 (64.0%)
Not using contraceptives
395
1.9 (0.8–4.7)
10.3 (6.2–17.1)
7 440 925 (100%)
Not using contraceptives
Jordan
3.8 (1.3–11.2)
8.6 (4.9–15.1)
104 688 (100%)
Not using contraceptives
Indonesia
4.2 (1.4–12.1)
7.0 (4.1–11.9)
6771 (100%)
Not using contraceptives
385
415
330 127 (100%)
Not using contraceptives
Honduras
4.4 (3.0–6.5)
32.8 (22.6– 47.7)
10.8 (6.9–17.)
Not using contraceptives
Guyana
3.9 (2.7–5.7)
21.6 (15.3– 30.5)
715 882 (100%)
Not using contraceptives
375
18.1 (3.9–83.2)
645 020 (100%)
Not using contraceptives
Ethiopia
16.1 (3.5–73.1)
410
53 410 (100%)
Not using contraceptives
Colombia
2.3 (0.4–11.9)
139 632 (100%)
Not using contraceptives
365
1.9 (0.4–10.1)
96 545 (100%)
Not using contraceptives
Burundi
2.7 (2.3–3.4)
14.3 (12.3– 16.7)
199 958 (100%)
Not using contraceptives
Burkina Faso
2.2 (2.1–2.9)
12.4 (11.7– 13.1)
5603 (100%)
Not using contraceptives
355
405
16 749 753 (100%)
450
722 648 (100%)
581 732 (80.5%)
4.4 (2.4–8.1)
5.9 (3.0–11.8)
16.8 (10.5– 26.8)
14.8 (9.2–23.9)
Continued
455
5
Modern methods of contraception and undesired pregnancy
Table II Continued
515
PAF undesired pregnancies
of non-use of MMsa
460
OR (95% CI) unadjusted
b
OR (95% CI) adjusted
.............................................................................................................................................................................................
Lesotho
Traditional methods
34 495 (100%)
32 736 (94.9%)
Not using contraceptives
465
Madagascar
Traditional methods
Traditional methods
470
151 763 (96.0%)
Traditional methods
68 198 (90.0%)
Namibia
Traditional methods
10 544 (82.2%)
Traditional methods
480
37 413 (93.1%)
Traditional methods
257 165 (89.0%)
Peru
Traditional methods
738 669 (84.0%)
Traditional methods
490
386 735 (86.7%)
Traditional methods
574 375 (79.5%)
Senegal
Traditional methods
185 350 (80.1%)
Traditional methods
500
125 398 (90.5%)
Traditional methods
70 346 (89.0%)
505
Traditional methods
660 185 (87.0%)
Traditional methods
Not using contraceptives
–
18.1 (12.8– 25.5)
2.7 (1.2–6.3)
3.2 (1.5–6.7)
28.3 (14.6– 40.6)
26.6 (15.5– 45.6)
535
1.3 (0.7–2.5)
1.4 (0.6–2.9)
7.7 (5.1–11.7)
11.3 (6.9–18.3)
540
4.6 (3.8–5.5)
4.8 (3.9–5.9)
21.5 (17.7– 26.1)
25.4 (20.6– 31.3)
5.3 (3.2–8.9)
5.4 (3.3–8.9)
8.9 (5.4–14.6)
8.7 (5.4–14.0)
2.9 (1.8–4.7)
3.3 (2.1–5.3)
11.4 (8.4–15.4)
12.6 (9.3–17.0)
545
550
2.3 (0.5–11.2)
2.4 (0.5–12.5)
8.9 (4.8–16.4)
11.4 (6.0–21.6)
1.3 (0.3–6.5)
1.0 (0.2–5.4)
8.0 (3.7–17.4)
10.1 (4.5–22.3)
555
2.5 (1.2–5.1)
4.0 (1.9–8.5)
14.3 (8.4–24.3)
14.3 (8.3–24.9)
560
6270 (100%)
6151 (98.1%)
Not using contraceptives
Uganda
–
16.7 (12.0– 23.4)
758 833 (100%)
Not using contraceptives
Timor-Leste
530
79 040 (100%)
Not using contraceptives
Tanzania
2.5 (0.9–6.6)
18.1 (7.7–42.4)
138 561 (100%)
Not using contraceptives
Sierra Leone
2.5 (0.9–6.5)
16.5 (7.1–38.3)
231 398 (100%)
Not using contraceptives
495
2.7 (1.8–4.1)
19.5 (15.5– 24.9)
722 484 (100%)
Not using contraceptives
Rwanda
2.7 (1.3–6.5)
17.9 (14.2– 22.6)
446 061 (100%)
Not using contraceptives
Philippines
525
879 368 (100%)
Not using contraceptives
485
37.7 (17.7– 80.3)
288 949 (100%)
Not using contraceptives
Nigeria
41.2 (19.4– 87.6)
40 186 (100%)
Not using contraceptives
Nepal
6.1 (2.3–16.4)
12 827 (100%)
Not using contraceptives
475
4.8 (1.9–12.2)
520
75 776 (100%)
Not using contraceptives
Moldova
2.4 (0.3–19.5)
22.2 (12.1– 40.8)
158 086 (100%)
Not using contraceptives
Malawi
2.6 (0.3–20.3)
22.9 (12.6– 41.6)
–
–
53.7 (7.5–385.4)
56.2 (7.8–404.2)
2.6 (1.4–4.7)
2.3 (1.2–4.5)
10.6 (7.2–15.5)
12.6 (8.4–18.9)
782 193 (100%)
657 042 (84.0%)
565
510
Continued
570
6
Bellizzi et al.
Table II Continued
PAF undesired pregnancies
of non-use of MMsa
575
OR (95% CI) adjustedb
630
.............................................................................................................................................................................................
Ukraine
Traditional methods
92 008 (100%)
76 275 (82.9%)
Not using contraceptives
Zambia
580
OR (95% CI) unadjusted
Traditional methods
Traditional methods
1.5 (0.4–5.4)
24.3 (9.5–61.9)
1.3 (0.7–2.4)
1.2 (0.6–2.3)
9.0 (6.5–12.5)
9.7 (6.9–13.7)
3.4 (1.6–7.1)
3.3 (1.5–6.9)
6.4 (4.8–8.3)
6.5 (4.9–8.6)
635
352 166 (100%)
299 299 (85.0%)
Not using contraceptives
Zimbabwe
1.5 (0.4–5.4)
24.2 (9.6–60.8)
173 918 (100%)
132 178 (76.0%)
Not using contraceptives
640
585
590
595
600
605
610
615
620
Albania, Azerbaijan and Swaziland not reported as no women utilizing MM of contraception prior current pregnancy.
Ethiopia, Namibia and Timor-Leste datasets do not contain any Traditional methods amongst the currently pregnant women.
CI, confidence interval.
a
The PAF of undesired pregnancies attributable to not using MM of contraception were calculated using P(E)(OR21)/[1+P(E)(OR21)], where P(E) was the proportion of undesired
pregnancies due to non-use of MM of contraception and OR the odds ratio of pregnancy and use of MM of contraception.
b
Adjusted for household income, urban/rural, education, marital status and occupation.
having an undesired pregnancy. Adjusted for covariates, this increased to
14.3 (95% CI, 12.3–16.7) times increased odds (Table II, Fig. 2).
Country-specific OR of undesired pregnancy associated with using traditional methods ranged from 1.0 (95% CI, 0.2–5.4) for Sierra Leone to 6.1
(95% CI, 2.3–16.4) for Madagascar and was statistically significant for all
but 10 countries. Country-specific OR of undesired pregnancy because
of not using any contraception methods ranged from 6.5 (95% CI, 4.9–
8.6; P , 0.001) for Zimbabwe to 56.2 (95% CI, 7.8–404.2; P , 0.001)
for Timor-Leste and was statistically significant for all countries.
The PAF of not using MM accounted for 80.7% (13 517 051) of the
estimated undesired pregnancies (16 751 374) in the pooled analysis.
The PAF ranged from 55.8% (540 677) for Indonesia to 98.1% (6151)
for Timor-Leste and the estimated number of undesired pregnancies
because of the use of traditional methods or non-use of contraception
ranged from 4466 in Armenia to 5 878 331 in India.
Indonesia had the lowest PAF (55.8%) contributing to undesired pregnancies due to not using MM in large part due to extremely high failure rates
among those using MM. A total of 105 of 376 women (28%) were using
MM prior to having an unwanted pregnancy (Table III). A high proportion
of women becoming pregnant, despite the usage of MM of contraception
was also found in four other countries: Zimbabwe 37.9% (113/298),
Colombia 24.1% (297/1237), Jordan 19.3% (69/357) and Ukraine
19.4% (6/31). Another 20 countries had failure rates between 5 and
15% and the remaining 10 countries had rates below 5%. If all countries
could achieve a failure rate for MM of ,5%, 1 553 735 (9.3% of all)
unwanted pregnancies could be prevented.
Women not desiring a pregnancy with the lowest education level and
poorest quintile were 8.6 (95% CI, 8.2–9.1) and 2.6 (95% CI: 2.4 –2.9)
times less likely to use any contraception method compared with women
with the highest educational level and quintile, respectively.
Reasons for not using contraception
625
Of the 14 893 sexually active, not pregnant women who neither desired
pregnancy nor used contraception, country-specific sample sizes varied
from 132 for Armenia to 2476 for India.
Of the total, 5559 (37.3%) did not use any contraceptive methods
because of fear of side effects/health concerns; 2620 (17.6%) did not
use it because they underestimated the risk of pregnancy; 3331
(22.4%) women indicated they or their partner’s opposition to contraception or religious prohibition as the reason; 1055 (7.1%) mentioned
other related methods reasons, such as the cost, which alone accounted
for 2.4% of the total. Some 516 (2.4%) women were not aware of the
availability and/or source of contraception and 1812 (12.1%) women
indicated other reasons (Table IV).
The prevalence of women not using contraceptives, citing fear of side
effects/health concerns varied from 9.0% in Armenia to 61.0% in Kenya;
3717 (66.9%) of them did not complete secondary school education, but
the response was evenly distributed among wealth categories. The prevalence of those underestimating risk for pregnancy varied from 2.0% for
Timor-Leste to 40.7% for Ukraine; 1875 (71.6%) had not completed secondary school education and again the response was evenly distributed
among wealth categories. Opposition and lack of knowledge increased
with decreasing wealth quintile. Cost was only cited by 2.4% of the total
as a reason for non-use. Even among the poorest, only 3.3% cited costs.
Discussion
Analysis of 35 low- and middle-income countries revealed that four out
of five undesired pregnancies could have been prevented if MM were
used. The use of traditional methods and not using any method of contraception increased the odds of an undesired pregnancy by 3 and 14 times,
respectively. Of the sexually active women who did not desire pregnancy, non-use of contraceptives was mostly reported due to fear of
side effects/health concerns, religious opposition to use and underestimated risk of pregnancy. Consistent with other studies, women with the
lowest education level and poorest quintile were least likely to use any
contraception method (Byrne et al., 2012; Mostafa Kamal, 2012). The
lack of knowledge about contraceptives was rarely cited as a reason
for non-use. Cost was not even commonly cited among the poor as a
hindrance to contraception access.
645
650
655
660
665
670
675
680
7
Modern methods of contraception and undesired pregnancy
685
745
690
750
695
755
700
760
705
765
710
770
715
775
720
Figure 1 Forest plot showing the relation between undesired pregnancy in women using traditional methods of contraception and women using MM of
725
730
735
740
contraception in all 35 low- and middle-income countries in the survey between 2005 and 2012. This relation is expressed by the effect size (ES), or Log OR,
with relative CI and shows significant association between the use of traditional methods of contraception and undesired pregnancies for 19 countries.
Plotted on log scale; error bars are 95% CIs. Wald test for equivalence of coefficient rejected (x2 ¼ 90.9, P , 0.001). See Table II for OR and CIs by
country. Tanzania refers to the United Republic of Tanzania.
Together, these 35 countries have 2.4 billion persons, 33.6% of the global
population. Most countries had significant ORs of undesired pregnancy
associated with the use of traditional methods. The 10 countries that did
not have significant differences had samples with ,10 subjects in at least
one of the comparison categories. Four additional countries had significant
ORs despite having ,10 subjects in one of the comparison categories.
More than one in four women in Indonesia, Jordan and Colombia had
become pregnant despite using MM. This is vastly higher than other
countries and needs specific attention.
DHS are generally considered high-quality surveys and are sometimes
the only source of maternal and child health information available in
developing countries (Johnson et al., 2009). However, one must consider
that DHS were compared across 35 countries at various times after
2005. The surveys used standardized questionnaires, which minimizes
780
the risk of variation that would significantly affect the results (Johnson 785
et al., 2009).
An average of 96% of 15 –49 years age eligible women took part in the
survey. Guyana had the lowest participation rates (90%) and Rwanda and
Burundi the highest (99%). Recall bias in reporting the use of contraception prior to the current pregnancy could potentially affect the results 790
(Boerma and Sommerfelt, 1993): women who experienced an undesired
pregnancy may be more likely to recall and report their sexual behaviours
compared with those who did not have any undesired pregnancy. Missing
data were minimal in the examined data sets.
Another limitation might be that few women report a current pregnancy 795
in the first trimester and undesired pregnancies at that time are probably
prone to under-reporting. Some terminated pregnancies may not be
included in the current pregnancy group. Also, covariates measured at
8
Bellizzi et al.
800
860
805
865
810
870
815
875
820
880
825
885
830
890
835
840
Figure 2 Forest plot showing the relation between undesired pregnancy in women not using contraception and women using MM of contraception in all
35 low- and middle-income countries in the survey between 2005 and 2012. This relation is expressed by the ES, or Log OR, with relative CI and shows
significant association between the non-use of traditional methods of contraception and undesired pregnancies for all countries for which the analysis could
be performed; for Albania, Azerbaijan and Swaziland, no women were utilizing MM of contraception prior to the current pregnancy. Plotted on log scale;
error bars are 95% CIs. Wald test for equivalence of coefficient rejected (x2 ¼ 500.6, P , 0.001). See Table II for OR and CIs by country. Tanzania refers to
the United Republic of Tanzania.
895
900
845
850
855
the time of the survey may not have reflected the same covariates at the
time the currently pregnant women became pregnant. The DHS did not
include questions on reason for not using among the women who
desired to use contraception.
This study has many implications. Health concerns commonly result in
women not using modern contraceptives; yet most health concerns are
not backed by evidence. For example, scientific studies and systematic
reviews have found no associations between any of the following: oral
contraception and fractures (Lopez et al., 2012a,b); progestin contraception and thromboembolism (Mantha et al., 2012); combined oral
contraception (COC) and increase weight gain (Gallo et al., 2011a,b);
progesterone-only methods and breastfeeding performances, infant
growth, health or development (Kapp and Curtis, 2010; Kapp et al.,
2010); hormonal contraceptives and carbohydrate metabolism in
women without diabetes (Lopez et al., 2009); COC and the course of
acute or chronic hepatitis including progression or severity of cirrhotic fibrosis, the risk of hepatocellular carcinoma in women with chronic hepatitis or the risk of liver dysfunction in hepatitis B virus carriers (Kapp and
Curtis, 2009a,b, Kapp et al., 2009); and oral contraceptive formulation
and increase in breast cancer risk (Marchbanks, 2012). Oral contraception reduces the risk of death from ovarian and endometrial cancer
(Maquire and Westhoff, 2011).
While many women discontinue contraceptives because of side
effects, most of these diminish within a few months. Health worker
905
910
9
Modern methods of contraception and undesired pregnancy
970
915
Table III Distribution of methods of contraception among women who are sexually active, currently not pregnant and not
desiring a child and women with a current undesired pregnancy in 35 low- and middle-income countries between 2005 and
2012.
Pregnant women
(n, %)a
Non-pregnant
women (n, %)
975
.............................................................................................................................................................................................
920
Pooled
MM
Traditional methods
Not using contraceptives
Albania
925
MM
Traditional methods
Not using contraceptives
930
4 (27.7)
262 (9.3)
2152 (75.6)
2 (11.1)
578 (38.1)
5 (27.8)
740 (48.8)
Traditional methods
11 (61.1)
198 (13.1)
51 (100%)
2682 (100%)
0 (– )
559 (20.8)
Traditional methods
15 (29.4)
1585 (59.1)
Not using contraceptives
36 (70.6)
538 (20.1)
612 (100%)
4116 (100%)
35 (5.7)
1759 (42.7)
Traditional methods
121 (19.8)
1401 (34.0)
Not using contraceptives
456 (74.5)
956 (23.3)
199 (100%)
1469 (100%)
15 (7.5)
528 (35.9)
5 (3.3)
42 (2.9)
MM
Traditional methods
179 (89.2)
899 (61.2)
Burundi
Not using contraceptives
395 (100%)
1109 (100%)
MM
15 (3.8)
335 (30.2)
Traditional methods
Not using contraceptives
10 (2.5)
79 (7.1)
370 (93.7)
695 (62.7)
Cambodia
134 (100%)
4621 (100%)
MM
11 (8.2)
2046 (44.3)
Traditional methods
13 (9.7)
922 (19.9)
110 (82.1)
1653 (35.8)
Colombia
1230 (100%)
7813 (100%)
MM
297 (24.1)
5748 (73.6)
Traditional methods
132 (10.7)
1049 (13.4)
Not using contraceptives
801 (65.2)
1016 (13.0)
Ethiopia
304 (100%)
1993 (100%)
MM
21 (6.9)
870 (43.6)
Not using contraceptives
Traditional methods
Not using contraceptives
Ghana
MM
965
0 (– )
Traditional methods
Not using contraceptives
980
2845 (100%)
MM
Burkina Faso
960
31 813 (28.6)
15 (100%)
431 (15.1)
MM
955
23 315 (20.9)
1516 (100%)
Bolivia
950
1324 (10.3)
10 095 (78.4)
18 (100%)
MM
945
56 173 (50.5)
Armenia
Azerbaijan
940
111 301 (100%)
1455 (11.3)
11 (72.3)
Not using contraceptives
935
12 874 (100%)
0 (—)
40 (2.0)
283 (93.1)
1083 (54.4)
137 (100%)
447 (100%)
9 (6.6)
140 (31.3)
5 (3.6)
58 (13.0)
123 (89.8)
249 (55.7)
Continued
985
990
995
1000
1005
1010
1015
1020
1025
10
Bellizzi et al.
Table III Continued
1085
Pregnant women
(n, %)a
1030
Non-pregnant
women (n, %)
.............................................................................................................................................................................................
1035
Guyana
113 (100%)
1265 (100%)
MM
7 (6.2)
611 (48.3)
Traditional methods
1 (0.9)
46 (3.6)
105 (92.9)
608 (48.1)
Honduras
Not using contraceptives
564 (100%)
2968 (100%)
MM
85 (15.1)
1707 (57.5)
Traditional methods
68 (12.1)
604 (20.4)
Not using contraceptives
1040
India
19 056 (100%)
MM
113 (8.0)
7734 (40.6)
Traditional methods
102 (7.2)
4587 (24.1)
1192 (84.8)
6735 (35.3)
Indonesia
376 (100%)
10 500 (100%)
MM
105 (28.0)
7567 (72.1)
Traditional methods
23 (6.1)
721 (6.8)
248 (65.9)
2212 (21.1)
357 (100%)
3062 (100%)
MM
69 (19.3)
1860 (60.7)
Traditional methods
89 (24.9)
762 (24.9)
199 (55.8)
440 (14.4)
257 (100%)
1493 (100%)
MM
20 (7.8)
828 (55.4)
Traditional methods
17 (6.6)
122 (8.2)
220 (85.6)
543 (36.4)
Lesotho
167 (100%)
1366 (100%)
MM
12 (7.2)
857 (62.7)
Not using contraceptives
Jordan
1050
Not using contraceptives
Kenya
1055
Not using contraceptives
1060
Traditional methods
Not using contraceptives
Madagascar
MM
Traditional methods
1065
3540 (100%)
7 (2.6)
1585 (44.8)
570 (16.1)
1140 (100%)
3393 (100%)
MM
86 (7.5)
1868 (55.1)
Traditional methods
36 (3.1)
292 (8.6)
Not using contraceptives
MM
1018 (89.4)
2079 (100%)
7 (15.6)
1116 (53.7)
11 (24.4)
702 (33.8)
Not using contraceptives
27 (60.0)
261 (12.5)
Namibia
334 (100%)
1527 (100%)
MM
45 (13.5)
1085 (71.0)
Not using contraceptives
Nepal
MM
1100
1105
1110
1115
1120
1125
1233 (36.3)
45 (100%)
Traditional methods
Traditional methods
1080
271 (100%)
1385 (39.1)
Moldova
1075
28 (2.0)
481 (35.3)
12 (4.4)
Malawi
1070
1 (0.6)
154 (92.2)
252 (93.0)
Not using contraceptives
1095
657 (22.1)
1407 (100%)
Not using contraceptives
1045
411 (72.8)
1090
0 (—)
26 (1.7)
289 (86.5)
416 (27.3)
214 (100%)
2767 (100%)
15 (7.0)
1565 (56.6)
1130
1135
Continued
1140
11
Modern methods of contraception and undesired pregnancy
Table III Continued
Pregnant women
(n, %)a
1145
Not using contraceptives
756 (27.3)
2410 (100%)
MM
19 (4.4)
610 (25.3)
Traditional methods
11 (2.6)
256 (10.6)
Not using contraceptives
400 (93.0)
1544 (64.1)
1161 (100%)
9992 (100%)
MM
145 (12.5)
5362 (53.7)
Traditional methods
453 (39.0)
3661 (36.6)
563 (48.5)
969 (9.7)
Philippines
Not using contraceptives
225 (100%)
2976 (100%)
MM
21 (9.3)
1225 (41.2)
Traditional methods
72 (32.0)
800 (26.9)
132 (58.7)
951 (31.9)
Rwanda
Not using contraceptives
432 (100%)
2732 (100%)
MM
54 (12.5)
1565 (57.3)
Traditional methods
29 (6.7)
286 (10.5)
Not using contraceptives
1165
Senegal
MM
Traditional methods
Not using contraceptives
1170
Sierra Leone
282 (22.9)
2 (0.6)
22 (1.8)
322 (96.1)
929 (75.3)
729 (100%)
177 (24.3)
Traditional methods
2 (1.2)
39 (5.3)
163 (94.8)
513 (70.4)
Swaziland
162 (100%)
1052 (100%)
MM
0 (– )
694 (66.0)
Traditional methods
0 (– )
44 (4.2)
162 (100)
334 (100%)
1212 (100%)
MM
14 (4.2)
388 (32.0)
Traditional methods
18 (5.4)
178 (14.7)
302 (90.4)
646 (53.3)
114 (100%)
1874 (100%)
MM
1 (0.9)
592 (31.6)
Traditional methods
0 (– )
36 (1.9)
Not using contraceptives
113 (99.1)
1246 (66.5)
Uganda
435 (100%)
1147 (100%)
MM
31 (7.1)
481 (41.9)
Traditional methods
14 (3.2)
93 (8.1)
Not using contraceptives
390 (89.7)
1210
1215
1220
1225
1230
1235
1240
1245
573 (50.0)
Ukraine
31 (100%)
2007 (100%)
MM
6 (19.4)
1266 (63.1)
Traditional methods
4 (12.9)
558 (27.8)
21 (67.7)
183 (9.1)
Not using contraceptives
1205
314 (29.8)
Tanzania
Not using contraceptives
1190
11 (3.3)
7 (4.0)
Timor-Leste
1185
881 (32.2)
1233 (100%)
172 (100%)
Not using contraceptives
1180
349 (80.8)
335 (100%)
MM
Not using contraceptives
1175
446 (16.1)
185 (86.5)
Peru
1160
14 (6.5)
430 (100%)
Nigeria
1155
1200
.............................................................................................................................................................................................
Traditional methods
1150
Non-pregnant
women (n, %)
1195
Continued
1250
12
1255
Bellizzi et al.
Table III Continued
Pregnant women
(n, %)a
Non-pregnant
women (n, %)
1315
.............................................................................................................................................................................................
1260
Zambia
395 (100%)
845 (100%)
MM
52 (13.2)
437 (51.7)
Traditional methods
16 (4.0)
103 (12.2)
327 (82.8)
305 (36.1)
298 (100%)
1465 (100%)
113 (37.9)
1154 (78.8)
Not using contraceptives
Zimbabwe
1265
MM
Traditional methods
Not using contraceptives
10 (3.3)
30 (2.0)
175 (58.8)
281 (19.2)
1320
1325
a
Method discontinued due to pregnancy.
1270
1275
Table IV Frequency by covariate of the reasons for not using any contraception in sexually active, non-pregnant women who
do not desire children (n 5 14 893) in 35 low- and middle-income countries between 2005 and 2012.
Fear of side effects/
health concerns
(n 5 5559; 37.3%),
n (%)
Underestimated risk of
pregnancy (n 5 2620;
17.6%), n (%)
Opposition
(n 5 3331;
22.4%), n (%)
Lack of knowledge
(n 5 516; 3.5%),
n (%)
Other related
methods reasons
(n 5 1055; 7.1%),
n (%)
Other
(n 5 1812;
12.1%), n (%)
1330
1335
.............................................................................................................................................................................................
1280
1285
Education
No education
1703 (30.7)
1049 (40.0)
1611 (48.4)
352 (68.2)
309 (29.3)
757 (41.8)
Primary
2014 (36.2)
826 (31.5)
950 (28.5)
122 (23.6)
382 (36.2)
570 (31.5)
Secondary
1497 (26.9)
630 (24.1)
635 (19.1)
40 (7.8)
279 (26.5)
377 (20.8)
345 (6.2)
115 (4.4)
135 (4.1)
2 (0.4)
85 (8.1)
108 (6.0)
5492 (98.8)
2544 (97.1)
3304 (99.2)
511 (99.1)
1043 (98.9)
1741 (96.1)
67 (1.2)
76 (2.9)
27 (0.8)
5 (0.9)
12 (1.1)
71 (3.9)
Higher
1340
Marital status
Married
Non married
1345
Wealth quintile
1290
1295
First, poorest
1158 (21.2)
523 (20.1)
864 (26.0)
224 (43.6)
266 (25.3)
440 (24.8)
Second
1061 (19.3)
505 (19.5)
709 (21.4)
130 (25.2)
208 (19.8)
361 (20.4)
Third
1011 (18.4)
464 (17.9)
664 (20.0)
99 (19.2)
210 (20.0)
336 (19.0)
Fourth
1077 (19.6)
545 (21.1)
572 (17.2)
44 (8.5)
201 (19.1)
311 (17.5)
Fifth, richest
1181 (21.5)
549 (21.2)
510 (15.4)
18 (3.5)
167 (15.8)
324 (18.3)
1350
Location
Rural
1784 (32.1)
778 (29.7)
846 (25.4)
56 (10.9)
341 (32.3)
627 (34.6)
Urban
3775 (67.9)
1842 (70.3)
2485 (74.6)
460 (89.1)
714 (67.7)
1185 (65.4)
Not working
1167 (21.0)
477 (18.2)
763 (22.9)
129 (25.1)
291 (27.6)
413 (22.8)
Working
4392 (79.0)
2143 (81.8)
2568 (77.1)
387 (74.9)
764 (72.4)
1399 (77.2)
1355
Occupation
1300
1360
1305
1310
reassurance, education regarding common adverse effects, judicious
treatment of symptoms and changing of methods can enable women
to remain protected by MM (Barr, 2010). Furthermore, discontinuation
due to concerns about bleeding patterns appears to be lower with COC
containing second-generation progestogens (Lawrie et al., 2011; Gallo
et al., 2011a,b). Thus, programmes still using first-generation progestogens may consider changing to second-generation progestogens.
Most countries have high contraceptive failure rates. Counselling and
increased use of long-term reversible and irreversible methods have
been effective in reducing failure rates (Lee et al., 2011). Specific
emphasis must be directed to women under 25 years of age who are
more likely to request premature discontinuation of their IUDs and
may benefit from additional counselling (Aoun et al., 2014); limited
data suggest that the levonorgestrel intrauterine system may be an
1365
Modern methods of contraception and undesired pregnancy
1370
1375
1380
1385
1390
1395
1400
1405
1410
1415
acceptable alternative to the COC in this population (Tang et al., 2012).
Additionally, community-based interventions and antenatal contraceptive counselling targeting an improved uptake of (copper) IUDs have
proven effective (Arrowsmith et al., 2012). Furthermore, insertion of
IUDs in the post-partum period has proven safe without increasing the
risk of complications (Kapp and Curtis, 2009a,b). In contrast, post-natal
contraceptive education appears to lack evidence of intervention effectiveness (Lopez et al., 2012a,b). Countries must determine interventions
considering their setting and level of resources, and research needs to
ensure high rates of long-term contraceptive continuation (Halpern
et al., 2011).
Fertility-awareness-based methods for contraception were found
to be inferior to the use of MM, which has been reported previously
(Grimes et al., 2004).
In conclusion, our study estimated 13.5 million undesired pregnancies
in 35 low- and middle-income countries could have been prevented annually if all women who did not desire pregnancy used MM of contraception. It is important to understand how underuse of MM of contraception
translates into a burden of death and disease. Unfounded health concerns, fear of side effects, opposition to use and an underestimated
risk of pregnancy affect all women, regardless of wealth and educational
status. Systematic efforts are needed to address these issues. Routine
client encounters, such as antenatal, immediate post-natal and postabortive care visits, present opportunities for health workers to elicit
concerns from sexually active clients about contraceptives and counsel
accordingly. The use of modern media, such as push videos linked with
websites containing accurate information, could help dispel myths, especially among the youth. These approaches could prove attractive for augmenting sexual education in schools. Many organized religions are neutral
or supportive of family planning. National strategies need to consider
how best to exploit these varied channels to improve the response to
demand and the knowledge of clients. However, national strategies to
increase the response to demand need to be coupled with an available,
affordable and acceptable range of quality contraceptives.
Authors’ roles
S.B. contributed to the conception and design of the study, the acquisition of data and the analysis/interpretation of data. He was also responsible for drafting and revising the manuscript. H.S., H.O. and M.T.
contributed to the conception and design of the study, to the interpretation of data, drafting and revising the manuscript. All authors reviewed
and approved the final manuscript. S.B. is the guarantor and takes full
responsibility for the work as a whole.
Funding
No external funding was utilized for this report.
Conflict of interest
1420
None declared.
References
1425
Ali MM, Cleland J. Oral contraceptive discontinuation and its aftermath in 19
developing countries. Contraception 2010;81:22– 29.
13
Ali MM, Cleland J, Iqbal S. Causes and Consequences of Contraceptive
Discontinuation: Evidence from 60 Demographic and Health Surveys. World
Health Organization, 2012. http://apps.who.int/iris/bitstream/10665/
75429/1/9789241504058_eng.pdf (13 May 2014, date last accessed).
Alkema L, Kantorova V, Menozzi C, Biddlecom A. National, regional, and
1430
global rates and trends in contraceptive prevalence and unmet need for
family planning between 1990 and 2015: a systematic and comprehensive
analysis. Lancet 2013;381:1642–1652.
Aoun J, Dines VA, Stovall DW, Mete M, Nelson CB, Gomez-Lobo V. Effects
of age, parity, and device type on complications and discontinuation of
1435
intrauterine devices. Obstet Gynecol 2014;123:585 –592.
Arrowsmith ME, Aicken CR, Saxena S, Majeed A. Strategies for improving the
acceptability and acceptance of the copper intrauterine device. Cochrane
Database Syst Rev 2012;14:CD008896.
Barr NG. Managing adverse effects of hormonal contraceptives. Am Fam
Physician 2010;82:1499 – 1506.
1440
Boerma JT, Sommerfelt AE. Demographic and health survey (DHS):
contributions and limitations. World Health Stat Q 1993;46:222– 226.
Byrne A, Morgan A, Soto EJ, Dettrick Z. Context-specific, evidence-based
planning for scale-up of family planning services to increase progress to
MDG 5: health system research. Reprod Health 2012;9:27.
Cleland J, Ali MM. Reproductive consequences of contraceptive failure in 19 1445
developing countries. Obstet Gynecol 2004;104:314 –320.
Darroch JE, Singh S. Trends in contraceptive need and use in developing
countries in 2003, 2008, and 2012: an analysis of national surveys. Lancet
2013;381:1756 – 1762.
Demographic and Health Survey. http://www.measuredhs.com/ (1 1450
September 2012, date last accessed).
Gallo MF, Lopez LM, Grimes DA, Schulz KF, Helmerhorst FM. Combination
contraceptives: effects on weight. Cochrane Database Syst Rev 2011a;
7:CD003987.
Gallo MF, Nanda K, Grimes DA, Lopez LM, Schulz KF. 20 mg versus .20 mg
estrogen combined oral contraceptives for contraception. Cochrane 1455
Database Syst Rev 2011b;19:CD003989.
Garcı´a-Enguı´danos A, Calle ME, Valero J, Luna S, Domı´nguez-Rojas V. Risk
factors in miscarriage: a review. Eur J Obstet Gynecol Reprod Biol 2002;
102:111– 119.
Grimes DA, Gallo MF, Grigorieva V, Nanda K, Schulz KF. Fertility awareness- 1460
based methods for contraception. Cochrane Database Syst Rev 2004;
18:CD004860.
Halpern V, Lopez LM, Grimes DA, Gallo MF. Strategies to improve
adherence and acceptability of hormonal methods of contraception.
Cochrane Database Syst Rev 2011;13:CD004317.
1465
Inter-agency field manual on reproductive health in humanitarian settings. 2010
revision for field review. Inter-agency Working Group (IAWG) on
Reproductive Health in Crises. http://www.who.int/reproductivehealth/
publications/emergencies/field_manual/en/ (27 January 2014, date last
accessed).
Johnson K, Grant M, Khan S, Moore Z, Armstrong A, Sa Z. Fieldwork-Related 1470
Factors and Data Quality in the Demographic and Health Surveys Program.
Calverton, MD: Macro International, 2009.
Kapp N, Curtis KM. Hormonal contraceptive use among women with liver
tumors: a systematic review. Contraception 2009a;80:387 – 390.
Kapp N, Curtis KM. Intrauterine device insertion during the postpartum
1475
period: a systematic review. Contraception 2009b;80:327– 336.
Kapp N, Curtis KM. Combined oral contraceptive use among breastfeeding
women: a systematic review. Contraception 2010;82:10– 16.
Kapp N, Tilley IB, Curtis KM. The effects of hormonal contraceptives use
among women with viral hepatitis or cirrhosis of the liver: a systematic
1480
review. Contraception 2009;80:381 – 386.
Kapp N, Curtis K, Nanda K. Progestogen-only contraceptive use among
breastfeeding women: a systematic review. Contraception 2010;82:17– 37.
14
1485
1490
1495
1500
1505
1510
Lawrie TA, Helmerhorst FM, Maitra NK, Kulier R, Bloemenkamp K,
Gulmezoglu AM. Types of progestogensin combined oral contraception:
effectiveness and side-effects. Cochrane Databse Syst Rev 2011;11:CD004861.
Lee JK, Parisi SM, Akers AY, Borrero S, Schwarz EB. The impact of
contraceptive counseling in primary care on contraceptive use. J Gen Intern
Med 2011;26:731–736.
Lopez LM, Grimes DA, Schulz KF. Steroidal contraceptives: effect on
carbohydrate metabolism in women without diabetes mellitus. Cochrane
Database Syst Rev 2009;7:CD006133.
Lopez LM, Chen M, Mullins S, Curtis KM, Helmerhorst FM. Steroidal
contraceptives and bone fractures in women: evidence from
observational studies. Cochrane Database Syst Rev 2012a;15:CD009849.
Lopez LM, Hiller JE, Grimes DA, Chen M. Education for contraceptive use by
women after childbirth. Cochrane Database Syst. Rev 2012b;15:CD001863.
Macro O. Demographic and Health Survey Interviewer’s Manual. Calverton,
MD: ORC Macro, 2006.
Macro International Inc. Sampling Manual: DHS-III. Calverton, MD: Macro
International Inc., 1996.
Mantha S, Karp R, Raghavan V, Terrin N, Bauer KA, Zwicker JI. Assessing the
risk of venous thromboembolic events in women taking progestin-only
contraception: a meta-analysis. BMJ 2012;345:e4944.
Maquire K, Westhoff C. The state of hormonal contraception today:
established and emerging noncontraceptive health benefits. Am J Obstet
Gynecol 2011;205:S4 – S8.
Marchbanks PA, Curtis KM, Mandel MG, Wilson HG, Jeng G, Folger SG,
McDonald JA, Daling JR, Bernstein L, Malone KE et al. Oral
contraceptive formulation and risk of breast cancer. Contraception 2012;
85:342 – 350.
Mostafa Kamal SM. Childbearing and the use of contraceptive methods
among married adolescent in Bangladesh. Eur J Contracept Reprod Health
Care 2012;17:144– 154.
Pullum TW. An Assessment of the Quality of Data on Health and Nutrition in the
DHS Survey, 1993 – 2003. Calverton, MD: Macro International Inc., 2008.
Rustein SO, Rojas J. Guide to DHS Statistics. Calverton, MD: ORC Macro,
MEASURE DHS+, 2003.
Bellizzi et al.
Stata Corp. Statistical Software: Release 10SE [Computer Program]. College
Station, TX: Stata Corp., 2008.
Tang JH, Lopez LM, Mody S, Grimes DA. Hormonal and intrauterine
methods for contraception for women aged 25 years and younger.
Cochrane Database Syst Rev 2012;11:CD009805.
Trussell J. Contraceptive efficacy. In: Hatcher RA, Trussell J, Nelson AL,
Cates W, Stewart FH, Kowal D (eds). Contraceptive Technology: Nineteenth
Revised Edition. New York, NY: Ardent Media, 2007;747–826.
United Nations Millennium Declaration. New York: United Nations, 2000
(United Nations General Assembly Resolution 55/2).
Vaessen M. The potential of the demographic and health surveys (DHS) for
the evaluation and monitoring of maternal and child health indicators. In:
Khlat M (ed). Demographic Evaluation of Health Programmes (Proceedings).
Paris, France: CICRED/UNFPA, 1996.
Van Braeckel D, Temmerman M, Roelens K, Degomme O. Slowing
population growth for wellbeing and development. Lancet 2012;
380:84– 85.
WHO. Universal access to reproductive health; accelerated actions to
enhance progress on Millennium Development Goal 5 through advancing
Target 5b, 2011. http://www.ibpinitiative.org/_include/PDF/WHO_
RHR_HRP_11.02_eng.pdf (8 May 2014, date last accessed).
WHO. Accountability for Women’s and Children’s Health, 2013a. http://
www.who.int/whoman_child_accountability/ierg/en/ (27 January 2014,
date last accessed).
WHO. Factsheet 351: Family Planning, 2013b. http://www.who.int/
mediacentre/factsheets/fs351/en/ (17 May 2013, date last accessed).
WHO. Every newborn: an action plan to end preventable deaths, 2014.
http://www.who.int/maternal_child_adolescent/topics/newborn/everynewborn-action-plan-draft.pdf?ua=1 (8 May 2014, date last accessed).
Wirth ME, Wirth E, Delamonica E, Sacks D, Balk A, Minujin A. Monitoring
Health Equity in the MDGs: A Practical Guide. New York, NY: CIESIN/
UNICEF, 2006.
World Health Organization. The world health report 2005. WHO, 2005.
http://www.who.int/whr/2005/en/ (12 May 2014, date last accessed).
World Health Statistics 2012. Geneva: World Health Organization, 2012.
1540
1545
1550
1555
1560
1565
1570
1515
1575
1520
1580
1525
1585
1530
1590
1535
1595


© Copyright 2026